Article

Flexural Performance of Steel-Continuous-Fiber Composite Bar and Fiber-Reinforced Polymer Bar Hybrid-Reinforced Sustainable Sea-Sand Concrete Beams: Numerical and Theoretical Study

College of Civil Science and Engineering, Yangzhou University, Yangzhou 225127, China
*
Author to whom correspondence should be addressed.
Sustainability 2024, 16(5), 1866; https://doi.org/10.3390/su16051866
Submission received: 8 December 2023 / Revised: 15 February 2024 / Accepted: 21 February 2024 / Published: 24 February 2024

Abstract

:
To investigate the flexural performance of steel-continuous-fiber composite bar (SFCB) and fiber-reinforced polymer (FRP) bar hybrid-reinforced sea-sand concrete (SSC) beams, a total of 21 SSC beams were numerically studied. The concrete damaged plasticity model (CDPM) and FRP brittle damage model were adopted, and the bond-slip behavior between the reinforcement and concrete was considered. Parametric studies were conducted to study the effects of the SSC strength, sectional steel ratio of the SFCB, core steel bar yield strength of the SFCB, out-wrapped FRP elastic modulus of the SFCB, and the ultimate tensile strength of the SFCB on the flexural performance of the beams. The results indicate that increasing the SSC strength and out-wrapped FRP modulus enhanced the bearing capacity and stiffness but reduced the ductility, shifting failure from concrete crushing to FRP bar fracture. A higher SFCB sectional steel ratio markedly improved the flexural stiffness, transforming the load–deflection curve. Elevated core steel bar yield strength maintained the cracking load and deflection while increasing the yield and ultimate loads. For SFCB fracture, higher ultimate tensile strength in the out-wrapped FRP enhanced the ultimate load and deflection, but not in concrete crushing failure. In addition, three failure modes were defined based on the proper assumption, with the proposed bearing capacity formulas aligning well with the FE results.

1. Introduction

As urbanization continues to advance, the demand for sand in construction is steadily increasing. While China accounts for 35% of the world’s total sand and gravel production [1], its natural river sand reserves are diminishing year by year. Faced with the tightening supply of river sand, finding reliable alternatives has become an urgent priority.
China boasts extensive coastal regions with exceptionally rich reserves of sea-sand resources. Numerous investigations have demonstrated that seawater and sea sand, carrying corrosive ions such as chloride ions, exert an impact on concrete [2,3,4,5]. The presence of chloride ions in seawater and sea sand can expedite the setting and hardening processes of cement, accelerate hydration, and promote the formation of more hydration products [6,7,8,9]. Refs. [10,11,12] have shown that sea-sand concrete (SSC) exhibits higher compressive strength at 3 d, 7 d, and 28 d compared to ordinary concrete. Furthermore, SSC demonstrates a greater drying shrinkage rate and improved impermeability. Moreover, due to a relatively low gradient in the chloride ion concentration between the pore solution and external solution, SSC displays lower chloride ion permeability than ordinary concrete does. Therefore, the use of sea sand to produce SSC can bring huge economic benefits to the construction industry.
With the modern human activity expanding to the ocean, there are more and more infrastructures constructed and serviced in marine harsh environments. To achieve an economical and sustainable development, the feasibility of using economical construction materials and the mechanical performance of structures after long-term application in harsh environments, especially the materials made from marine resources and structures serviced in marine environments, need to be extensively investigated. This growing trend is accompanied by the widespread adoption of fiber-reinforced polymer (FRP) bars, owing to their numerous advantages, such as high strength, excellent corrosion resistance, and eco-friendliness [13]. FRP is widely used for its advantages of a low carbon, lightweight, high strength, acid and alkali corrosion resistance, and fatigue resistance [14]. Using FRP to reinforce concrete can not only enhance the overall stiffness of the structure and improve the durability of the structure but also reduce the building environmental pollution and carbon emissions. Substituting FRP bars for conventional steel bars in SSC components offers a fundamental solution to the issue of steel corrosion.
Hua et al. [15] conducted four-point bending tests on SSC beams reinforced with FRP bars. The findings suggest that as the reinforcement ratio increases, the failure mode of the specimens shifts from tension failure to equilibrium failure before ultimately transitioning to compression failure. Chen et al. [16] conducted experimental and numerical research on the flexural performance of SSC beams reinforced with FRP bars exposed to a marine environment. The results demonstrate that the ultimate load-bearing capacity of the specimens increased by 28.0% in a salt-spray environment but decreased by 13.0% in a tidal environment. As the exposure time lengthened, the ultimate load-bearing capacity of the specimens exhibited an initial increase, followed by a decrease, with a simultaneous reduction in both the initial stiffness and ductility. Zhou et al. [17] conducted experimental research on the shear performance of ultra-high-performance seawater and sea-sand concrete beams reinforced with FRP bars. The results indicate that the load–deflection curve of the beams is bilinear, displaying pronounced brittle characteristics upon failure. A higher elastic modulus of the FRP bars corresponds to a greater ultimate load-carrying capacity of the beams and reduced deflection. In summary, the failure mode of FRP-reinforced SSC beams is primarily characterized by the FRP bar fracture, representing a typical brittle failure. While a hybrid reinforcement of steel and FRP bars can transition the beam’s failure mode from brittle to ductile in nature, it is important to note that a steel bar exposed to chloride environments is susceptible to corrosion.
Steel-continuous-fiber composite bars (SFCBs) are a novel structural reinforcement material with a steel core wrapped in FRP, offering advantages such as high strength, large elastic modulus, and exceptional corrosion resistance [18]. Additionally, an SRCB exhibits commendable secondary stiffness. Utilizing SFCBs in conjunction with FRP bars not only enhances the flexural performance and failure mode of all-FRP-reinforced SSC beams but also addresses the corrosion issue in SSC beams featuring a hybrid reinforcement of steel and FRP bars. To date, research on SFCBs combined with FRP bars in SSC beams is scarce. Existing studies have been constrained by limitations in the number of specimens tested, resulting in an incomplete exploration of the parameters influencing beam flexural behavior. Therefore, it is imperative to conduct a parametric study on SSC beams with hybrid reinforcement of SFCBs and FRP bars.
In this work, three-dimensional refined FE models were developed for SSC beams with hybrid reinforcement of SFCBs and FRP bars. The model accounts for FRP fracture behavior and the bond-slip behavior between the tensile bars and concrete. Based on the validated model, parametric studies were conducted to analyze the effects of the SSC strength, sectional steel ratio and yield strength, as well as the out-wrapped FRP elastic modulus and ultimate tensile strength of SFCBs, on the flexural performance of the beams. In addition, three failure modes were defined based on reasonable assumptions, and formulae for the bearing capacity were proposed.

2. Experiment Programs

2.1. Specimen Design

The specimen dimension and test set-up are depicted in Figure 1. This study involves a detailed numerical simulation of the four-point bending tests on SSC beams with hybrid reinforcement of SFCBs and FRP bars as originally conducted by Xiao et al. [19]. All the specimens have a total span of 2200 mm, with a clear span of 1800 mm. Both the pure-bending and shear-bending segments measure 600 mm in length. The beam’s cross-sectional dimension is 200 × 400 mm (width × height), with a concrete cover thickness of 25 mm and an effective height h0 of 375 mm. HRB400 steel bars were employed for both the upper longitudinal and transverse stirrups in all the specimens. The longitudinal bars had a diameter of 12 mm, while the transverse stirrups had a diameter of 10 mm, with a spacing of 100 mm at shear span and a spacing of 200 mm at flexural span, respectively.
The sectional configurations of all the specimens are illustrated in Figure 2, while Table 1 provides the detailed specifications of each specimen, where As represents the cross-sectional area of the tensile steel bar; Af represents the cross-sectional area of FRP; ρs represents the steel reinforcement ratio, calculated as ρs = As/(bh0); ρf represents the FRP ratio, calculated as ρf = Af/(bh0); ρn represents the nominal reinforcement ratio, calculated as ρn = ρs + ρf; ρn,e represents the effective reinforcement ratio, calculated based on the elastic modulus, as ρn,e = ρs + ρf·Ef/Es; ρn,f represents the effective reinforcement ratio, calculated based on the tensile strength, as ρn,f = ρs + ρf·ffu/fy; Ef and Es represent the elastic modulus of the FRP and steel bar, respectively; and ffu and fy represent the ultimate tensile strength of the FRP bar and the yield strength of the steel bar, respectively.

2.2. Material Properties

Figure 3 presents a photo of the FRP bar, SFCB and steel bar. Based on uniaxial tensile tests, the HRB400 steel bar exhibits a yield strength fy of 470 MPa, an ultimate tensile strength fu of 557 MPa, and an elastic modulus Es of 206 GPa. The tensile strength ffu and elastic modulus Ef of the FRP bar are 901 MPa and 50.7 GPa, respectively. For the SFCB, the yield strength fsf,y and ultimate strength fsf,u are 222 MPa and 760 MPa, while the initial elastic modulus Esf,1 and the elastic modulus in the strain-hardening region Esf,2 are 100 GPa and 26.8 GPa, respectively.
The SSC was made of P.O 42.5R ordinary Portland cement, coarse aggregate with a size range of 5–20 mm, dried sea sand and fine aggregate and tap water. The mass of cement, sea sand, coarse aggregate, and water per cubic meter is 315 kg, 714 kg, 1165 kg, and 205 kg, respectively. The 28-day compressive strength fcu of a 150 × 150 × 150 mm specimen of SSC is 25.7 MPa, while its elastic modulus Ec is 25.3 GPa based on the Chinese code GB/T 50081-2019 [20]. As the durability of the specimens is not within the scope of this study, Xiao et al. [19] have suggested that under the same mix proportion, the short-term mechanical properties of SSC are similar to those of conventional concrete. Therefore, the axial compressive strength fc (=0.76fcu) and tensile strength ft (=0.395fcu0.55) of SSC are 19.5 MPa and 2.02 MPa, respectively, according to the Chinese code GB 50010-2010 [21].

3. Establishment of the FE Model

In this study, the three-dimensional (3D) refined FE model was developed for SSC beams with hybrid reinforcement of SFCBs and FRP bars. The model was developed by the commercial FE software ABAQUS 2020 [22], as depicted in Figure 4. To accurately account for the contact between components, a partitioned modeling approach was employed with an implicit static solver. The concrete was modeled using 3D eight-node reduced-integration elements (C3D8R), while all the reinforcement materials were represented by truss elements (T3D2). To account for the bond-slip behavior between the tensile bars and concrete, connector elements (CONN3D2) were used to model the interaction between adjacent nodes of the tensile bars and concrete. A displacement-controlled loading method was employed at the rigid panel located at the loading point.

3.1. Material Constitutive and Damage Model

3.1.1. SSC

According to the Chinese code GB 50010-2010 [21], the compressive and tensile stress–strain relationships for SSC can be obtained. The constitutive model of SSC is applicable only to concrete with cubic compressive strength of less than 80 MPa. It should be noted that this model does not consider the deterioration behavior of concrete strength under long-term chloride corrosion. Therefore, the constitutive model presented herein is capable of accurately characterizing the flexural behavior of beams subjected to short-term loads, while its ability to predict the flexural performance under long-term loads remains limited.
The compressive stress-strain relationship for SSC is defined by Equations (1)–(3), where ρc = fc/Ec, n = Ecεc/(Ecεcfc). σc and εc represent the stress and corresponding strain during SSC compression, respectively. εc0 and αc represent the peak strain and the parameter for the descending phase, respectively.
σ c ε = ρ c n E c ε c n 1 + ε c / ε c 0 n ε c ε c 0 ρ c E c ε c α c ( x 1 ) 2 + x ε c 0 < ε c < ε cu
ε c 0 = 700 + 172 f c × 10 6
ε cu = 0.0033 f cu 50 × 10 5
The tensile constitutive relationship for SSC is expressed in Equations (4) and (5), where ρt = ft/Ec. σt and εt represent the stress and corresponding strain during SSC tensile loading, while ft is the peak tensile stress. εt0 and εtu represent the strain at the peak tensile stress and ultimate tensile strain, respectively. αt represents the parameter for the descending phase.
σ t ε = ρ t 1.2 0.2 ε t / ε t 0 5 E c ε t ε t ε t 0 ρ t / α t ( ε t / ε t 0 1 ) 1.7 + ε t / ε t 0 E c ε t ε t 0 < ε t > ε tu
ε t 0 = 65 f t 0.54 × 10 6
The concrete damaged plasticity model (CDPM) [22] is employed to simulate the crushing and cracking behavior of SSC during bending, where and Ψ are the flow potential eccentricity and dilation angle, respectively; μ and Kc are the viscosity parameter that defines viscoelastic regularization and ratio of second stress invariant on tensile meridian to that on compressive meridian, respectively; and σb0/σc0 is the ratio of initial equiaxial compressive yield stress to initial stress. Table 2 lists the details of the CDPM parameters.
The compressive and tensile damage factors can be obtained with reference to the energy-based approach proposed by Sidoroff et al. [23], where E0 represents the initial elastic modulus, dc represents the compressive material damage factor, dt represents the tensile damage factor, and ε ¯ c pl and ε ¯ t pl represent the equivalent plastic compressive and tensile strains of concrete, respectively.
d c = 1 σ c / E 0 ε c d t = 1 σ t / E 0 ε t

3.1.2. Steel Bar, FRP Bar and SFCB

Figure 5 depicts the tensile stress–strain (σε) curves for the steel bar, FRP bar, and SFCB. The steel bar employs a bilinear constitutive model that considers strain-hardening behavior. The anisotropy of the FRP bar and the SFCB’s out-wrapped FRP are ignored and regarded as an isotropic material with fracture strain. The stress–strain (σε) relationship of SFCB is represented by Equations (7)–(9), where εsf,y and εsf,u represent the yield strain and ultimate tensile strain of SFCB, respectively; Esf,s and Esf,f represent the elastic modulus of the internal steel bar and out-wrapped FRP; As and Af correspond to their respective cross-sectional areas; while A represents the cross-sectional area of the SFCB.
σ = E sf , 1 ε 0 ε ε sf , y E sf , 1 ε sf , y + E sf , 2 ε ε sf , y ε sf , y ε ε sf , u
E sf , 1 = E sf , s A s + E sf , f A f / A
E sf , 2 = E sf , f A f / A
ABAQUS provides the brittle damage model to predict the tensile failure of the FRP bar, as shown in Figure 6. Equation (10) shows the initial damage criterion. When this equation is met, the equivalent plastic strain εpl of the FRP bars accumulatively reaches the equivalent plastic strain of initial damage, where ωD is the state variable; and η is the triaxial stress. η = 1/3 when the FRP bar is under uniaxial tension [24].
ω D = d ε pl ε D pl η , ε pl = 1
The damage evolution rule of the brittle damage model is controlled by the equivalent plastic displacement (upl). The initial equivalent plastic displacement of the FRP bar at the beginning of damage is 0 ( u 0 pl = 0). When the tensile strain of the FRP bar gradually reaches the ultimate tensile strain (εs = εsu), the equivalent plastic displacement at fracture is still 0 ( u D pl = 0), so it is considered that FRP bars fracture once they reach the ultimate tensile strain. However, the equivalent plastic displacement at fracture is defined as always greater than 0 in ABAQUS, so the minimum value is used instead.

3.2. Bond-Slip Constitutive

To simulate the bond-slip behavior between adjacent nodes of the tension reinforcement and concrete, connector elements (CONN3D2) were established, and force–displacement relationships were assigned to them. The bond-slip constitutive model employed in this study is depicted in Figure 7. Normal behavior is characterized as rigid connection (Figure 7a), while tangential behavior follows the bond-slip model recommended by the CEB-FIP Model Code 1990 (Figure 7b) [25], as represented by Equation (11), where τmax and τr represent the peak bond strength and residual bond strength, respectively, while s1 and s2 denote peak slip values, respectively. S3 corresponds to the slip at which the residual bond strength is reached, and α is a fitting coefficient, obtainable from reference [26].
τ t = τ max s s 1 α s s 1 τ max s 1 < s s 2 τ max τ max τ r s s 2 s 3 s 2 s 2 < s s 3 τ r s > s 3

3.3. Contact Type and Mesh Sensitivity Analysis

The sensitivity analysis of the concrete mesh is crucial due to the significant influence of the mesh size on the simulation of tensile softening behavior of concrete [22]. Taking the beam G1SF2 as an example, 20, 30, 40 and 50 mm were used as the basic size to divide the concrete grid. Figure 8 illustrates the influence of the mesh size and bond-slip behavior on the load–deflection curve of beam G1SF2, where “Test” represents experimental results, “FE” signifies FE results, and “Embedded” denotes cases where the slip behavior of the reinforcement is not considered.
The figure clearly shows that concrete with mesh sizes of 40 mm and 50 mm experiences premature crushing during bending, leading to a decline in the load-bearing capacity. As the mesh is refined, the discrepancy between the FE and experimental results gradually diminishes. Balancing computational cost and accuracy, mesh sizes of 20 mm for concrete and 10 mm for reinforcement are chosen. A comparison between the results with and without considering slip reveals that their load–displacement curves are nearly identical before concrete cracking. However, after concrete cracking, the calculations that neglect slip influence significantly exceed the experimental results, leading to an overestimation of the beam’s flexural stiffness. Therefore, it is essential to consider the bond-slip behavior between the tensile reinforcement and concrete.

4. Model Verification

4.1. Experimental Phenomena

Beams G2SF1 and G1SF2 were used as examples to conduct a comparative analysis between the FE model and experimental observations, as illustrated in Figure 9. Strains were employed to depict the crushing and cracking phenomena in SSC beams. In the concrete, the red color represents the element strains reaching the ultimate tensile strain (εtu = 0.00010), while black represents strains reaching the ultimate compressive strain (εcu = −0.0035). In the reinforcement framework, black indicates element strains reaching the FRP bar fracture strain (εfu = 0.017).
The figure reveals that when the load reaches the ultimate capacity, the tensile reinforcement elements in beam G2SF1 experience strains that reach the fracture strain, the concrete undergoes crushing, and the out-wrapped FRP reinforcement also fractures. In contrast, the increased SFCB reinforcement ratio in beam G1SF2 prevents the tensile reinforcement from fracturing, resulting in a failure mode characterized by concrete crushing alone. The strain profiles and experimental observations of these two specimens closely match. The FE model, based on the concrete plastic damage behavior and the SFCB fracture model, accurately captures the failure phenomena of both the concrete and tensile reinforcement.
Observing the strain distribution profiles of all the specimens, it is evident that the failure mode in all cases is characterized by flexural failure. Beam S3 exhibits a failure mode marked by concrete crushing, while beams G1S2, G2S1, and G3 experience failure due to FRP bar fracture. In contrast, beam G2SF1 demonstrates a failure mode featuring both concrete crushing and FRP bar fracture, while beam G1SF2 experiences failure solely due to concrete crushing. Importantly, the FE results align consistently with the experimental results. In summary, the FE model developed in this study accurately predicts the failure modes of SSC beams with hybrid reinforcement.

4.2. Load–Deflection Curve

Figure 10 shows the load–deflection curves (P-δ) for all the specimens. The label “Test” refers to the experimental results, while “FE” represents the FE results.
The figures clearly show that the load–deflection curve of the steel-reinforced SSC beam (S3) demonstrates a pronounced yielding phase. The load–deflection curves of the SSC beams reinforced with steel and FRP bars (G1S2 and G2S1) display a trilinear response due to the steel bar yielding. In contrast, the load–deflection curve of the FRP-reinforced SSC beam (G3) follows a bilinear pattern, reflecting the linear-elastic properties of the FRP bar. Similarly, the load–deflection curves of the SSC beams reinforced with SFCBs and FRE bars (G2SF1 and G1SF2) also exhibit a trilinear behavior, mainly attributed to the yielding of the SFCB core steel bar.
A comparison of beams S3, G1S2, G2S1, and G3 reveals that these four beams exhibit nearly identical flexural stiffness during the elastic stage (prior to cracking). However, as the beams transition into the elastic–plastic stage (after cracking), an increase in the FRP reinforcement ratio leads to a decrease in flexural stiffness, with beam G3 exhibiting the lowest value. Consequently, as the actual reinforcement ratio of the beams increases, the ultimate load capacity also increases, albeit with a reduction in the ultimate deflection.
A comparison between beams G2SF1 and G1SF2 reveals that with an increase in the SFCB reinforcement ratio, the ultimate load and deflection of beam G1SF2 have increased by 7.9% and 6.7%, respectively, in comparison to beam G2SF1. This is attributed to the increased SFCB reinforcement ratio, which results in an enhancement of the beam’s flexural stiffness. Despite the higher FRP reinforcement ratio in beam G2SF1, the lower elastic modulus of the FRP bar compared to SFCB leads to a reduced flexural stiffness compared to beam G1SF2.
The experimental results of all the specimens closely align with the FE results. Therefore, the refined FE model, which accounts for bond-slip behavior and reinforcement material fracture, can accurately predict the flexural capacity and deformations of SSC beams with hybrid reinforcement of SFCBs and FRP bars.

5. Parametric Analyses

To address the limited number of specimens in the experimental research, this section employs a validated FE model to perform a parametric analysis of SSC beams with hybrid reinforcement of SFCBs and FRP bars. In each parametric analysis, beam G1SF2 serves as the reference, with a single parameter changed at a time. The primary focus of this analysis centers on the impact of the SSC strength fc, SFCB sectional steel ratio as (ratio of SFCB sectional steel to the total cross-sectional area), SFCB core steel bar yield strength fy, SFCB out-wrapped FRP elastic modulus Esf,f, and SFCB out-wrapped FRP ultimate tensile strength fsf,u on the flexural performance of the beams. Detailed parameter configurations are provided in Table 3.
A comparative analysis was conducted on the analysis results, including the characteristic loads (cracking load Pcr, yield load Py, and ultimate load Pu), corresponding deflections (cracking deflection δcr, yield deflection δy and ultimate deflection δu), ultimate energy dissipation Eu, ductility coefficient μ, and failure modes. The analysis of the failure patterns reveals that flexural failure in SSC beams reinforced with hybrid reinforcement of SFCBs and FRP bars predominantly occurs in three categories: concrete crushing, FRP bar fracture, and SFCB fracture.
Due to the absence of a yield point in an all-FRP reinforcement concrete beam, the conventional definition of the ductility factor is no longer applicable to reinforced concrete beams with steel bars. In accordance with ACI 440.1R-15 [27], the ductility factor μ is defined as the ratio of energy dissipation at the ultimate state Eu to the energy dissipation at normal service condition Escr, as shown in Equation (12). Upon reaching the deflection limit, the area enclosed by the load–deflection curve and the coordinate axes represents energy dissipation under normal service conditions, denoted as Escr. Similarly, the enclosed area represents energy dissipation at the ultimate state, denoted as Eu. According to code GB 50608-2010 [28], normal service conditions are defined when the mid-span deflection limit δscr is 1/200 of the total span length l.
μ = E u / E scr
Figure 11 shows the compressive and tensile stress–strain curves of SSC with an axial compressive strength fc of 19.5, 34.2, 41.8 and 49.4 MPa, respectively.
Figure 12 depicts the uniaxial tensile stress–strain curves of an SFCB under various parametric designs.

5.1. SSC Strength

Figure 13 illustrates the influence of the SSC strength fc on the flexural performance of the beams, while Table 4 presents the FE model results.
Combining Figure 13 with Table 4, it can be observed that as the SSC strength increases, the cracking load, yield load, and ultimate load of the beams all significantly increase, while the corresponding deflection decreases. This is attributed to the heightened SSC strength, resulting in an increased total bending moment. This is due to the combination of compressive forces in the concrete’s compression zone and tensile forces in the reinforcement of the tension zone, ultimately leading to a higher characteristic load. Because FRP bars have a relatively low elastic modulus, they reach the ultimate tensile strain before the concrete undergoes crushing, causing a reduction in the deflection. This leads to a transition in the failure mode from concrete crushing to FRP bar fracture.
The energy dissipation under the normal service condition is essentially the same for all the cases, but due to a reduced ultimate deflection, the beams with higher SSC strength exhibit lower ultimate energy dissipation, resulting in a corresponding decrease in ductility. Therefore, in the case of hybrid reinforcement using SFCBs and FRP bars, it is advisable to increase the reinforcement ratio of the FRP bars appropriately to prevent premature fracture of the FRP bars, which can result in the wastage of concrete performance.

5.2. Sectional Steel Ratio of SFCBs

Figure 14 illustrates the influence of the SFCB’s sectional steel ratio on the flexural performance of the beams within the SFCB. Table 5 presents the FE model results.
Combining Figure 14 and Table 5 reveals that as the SFCB’s sectional steel ratio increases, the load–deflection curve of the beam undergoes a transition from a bilinear behavior to a trilinear one. Beams with as of 0 (all-FRP beam) and as of 0.39 (a hybrid reinforcement of SFCBs and FRP bars) exhibit the same ultimate load capacity, with the former experiencing a 6.4% increase in the ultimate deflection compared to the latter. This is due to the lower flexural stiffness of the all-FRP beam compared to the hybrid reinforcement beam; under the same load, the deformation of the all-FRP beam is greater than that of the SFCBs and FRP bars hybrid-reinforced beam.
As the SFCB’s sectional steel ratio increases from 0.39 to 0.77 and 1.0, the elastic modulus and yield strength of the SFCB increase accordingly. However, the secondary stiffness and ultimate tensile strength decrease, while the beam’s flexural stiffness notably improves. The failure mode shifts from concrete crushing to FRP bar fracture. In the compressed concrete zone, the ultimate compressive strain has not been reached, resulting in a significant reduction in both the ultimate load and deflection. As the SFCB’s sectional steel ratio increases, the energy dissipation at the normal service condition increases with the rise in initial stiffness. However, the ultimate energy dissipation significantly decreases as the ultimate deflection reduces, resulting in a corresponding decrease in ductility.

5.3. Core Steel Bar Yield Strength of SFCBs

Figure 15 illustrates the impact of the SFCB’s core steel bar yield strength fy on the flexural performance of beams, while Table 6 presents the FE model results.
Combining Figure 15 and Table 6, it is evident that an increase in the SFCB’s core steel bar yield strength fy leads to constant values for the beam’s cracking load and cracking deflection. Concurrently, the yield and ultimate loads increase, resulting in improved flexural stiffness. However, the corresponding deflection experiences a slight reduction. This is because an increase in the SFCB’s core steel bar yield strength does not affect the elastic modulus of the SFCB but only increases its tensile strength. The failure mode of the beam is determined by concrete crushing, and as the tensile strength of the SFCB increases, the ultimate load of the beam also increases. The energy dissipation under the normal service condition increases accordingly, while the ultimate energy dissipation remains nearly unchanged, leading to a decrease in ductility.
When the SFCB’s core steel bar yield strength increases from 300 MPa to 414 MPa, 500 MPa, and 600 MPa, the reference price per ton of reinforcement materials increases by 8.1%, 16.2%, and 24.3%, respectively. However, the ultimate load only increases by 1.5%, 2.6%, and 3.6%, respectively. Therefore, considering cost-effectiveness, increasing the yield strength of SFCB’s core steel bar is not economically viable.

5.4. Out-Wrapped FRP Elastic Modulus of SFCBs

Figure 16 depicts the influence of the SFCB’s out-wrapped FRP elastic modulus Esf,f on the flexural performance of the beams, while Table 7 presents the FE model results.
Combining Figure 16 and Table 7, it is evident that as the SFCB’s out-wrapped FRP elastic modulus Esf,f increases, the cracking, yield, and ultimate loads of the beam all significantly increase, while the corresponding deflection decreases. This is because increasing the SFCB’s out-wrapped FRP elastic modulus results in the higher initial stiffness of the SFCB, consequently enhancing the flexural stiffness of the beam. At the same strain level, the SFCB can withstand larger concrete compressive strains, leading to increased tensile forces in the beam’s cross-section tension zone and the corresponding balancing compressive forces in the compression zone. The concrete in the compression zone reaches the ultimate compressive strain more rapidly, resulting in a higher load-bearing capacity in the beam at the same deformation and reduced ultimate deflection. As the SFCB’s out-wrapped FRP elastic modulus increases, the beam’s flexural stiffness increases during both the elastic and elastic–plastic phases. This leads to a rise in the energy dissipation under the normal service condition. However, due to a reduction in the ultimate deflection, the ultimate energy dissipation significantly decreases, resulting in reduced ductility.
Figure 16 reveals that when Esf,f is 50, 60, and 70 GPa, the beam failure mode is concrete crushing. However, when Esf,f is 80 GPa, the beam failure mode is the fracture of the SFCB. This is because the fracture strain of the SFCB decreases with an increase in the Esf,f. The fracture strain (0.0125) of the SFCB with an Esf,f of 80 GPa is the smallest and is less than the fracture strain (0.0197) of the FRP bar. Consequently, the SFCB fractures prior to the FRP bar.
In summary, increasing the SFCB’s out-wrapped FRP elastic modulus significantly enhances the beam’s load-bearing capacity and flexural stiffness, reducing mid-span deformations. However, this improvement comes at the cost of reduced ductility. Therefore, when designing the SFCB’s out-wrapped FRP elastic modulus, caution should be exercised to avoid designing it excessively high, which could lead to premature SFCB fracture.

5.5. The Ultimate Tensile Strength of SFCB’s Out-Wrapped FRP

Figure 17 illustrates the impact of the SFCB’s out-wrapped FRP ultimate tensile strength fsf,u on the flexural performance of beams, and Table 8 presents the FE model results.
Combining Figure 17 with Table 8, it is evident that an increase in the SFCB’s out-wrapped FRP ultimate tensile strength does not result in any change in the beam’s cracking and yield loads, corresponding deflections, or energy dissipation under the normal service condition. However, for beams with an fsf,u of 750 MPa, premature fracture of the SFCB leads to lower ultimate loads, deflections, and ultimate energy dissipation compared to the other specimens. Additionally, these beams exhibit relatively lower ductility. This is because the SFCB’s out-wrapped FRP ultimate tensile strength has no influence on the initial stiffness of the SFCB but only affects the fracture strain. The smaller the SFCB’s out-wrapped FRP ultimate tensile strength, the smaller the fracture strain of the SFCB. Under the same load, a smaller fracture strain of the SFCB results in earlier fracture of the SFCB. Beams with an fsf,u of 997 MPa, 1250 MPa, and 1500 MPa exhibit identical ultimate loads and deflections. This is because the failure of these beams is determined by concrete crushing, and excessively increasing the SFCB’s out-wrapped FRP ultimate tensile strength has no impact on the flexural performance of the beams.

6. Theoretical Analyses

6.1. Basic Assumptions

The following assumptions were considered: (1) the perfect bond between the reinforcement and SSC has been observed in previous experimental investigations conducted by Xiao et al. [19]; (2) each cross-sectional plane perpendicular to the beam axis maintains its planarity under loading, and (3) the tensile strength of concrete is disregarded.

6.2. Failure Modes and Boundary Failure

The boundary state of the failure modes is shown in Figure 18, where the red color of the reinforcement is expressed as the SFCBs, and the yellow color is expressed as the FRP bars. According to the constitutive models of the materials, the failure modes of SSC beams with hybrid reinforcement of SFCBs and FRP bars can be divided into three situations, where εc and εcu are the compressive strain and ultimate compressive strain of the SSC, respectively; εsf, εsf,y and εsf,u are the tensile strain, yield strain and ultimate tensile strain of the SFCBs, respectively; εf and εfu are the tensile strain and ultimate tensile strain of the FRP bars, respectively; εhu is the minimum ultimate tensile strain of the FRP bars and SFCBs, εhu = min {εfu, εsf,u}; xc1 and xc2 are the height of the compressive zone corresponding to boundary failures 1 and 2, respectively; and ht1 and ht2 are the height of the cross-section part in tension corresponding to boundary failures 1 and 2, respectively.
(1)
Failure mode 1: εc = εcu, εf = εsf < εsf,y.
In failure mode 1, the SFCBs do not undergo yielding, yet the maximum compressive strain attains the ultimate strain of the SSC. This mirrors the characteristics of over-reinforced concrete beams, a condition impractical due to its propensity for brittle failure.
(2)
Failure mode 2: εc = εcu, εsf,y < εf = εsf < εhu.
In failure mode 2, the SFCBs undergo yielding but the strain value falls short of reaching the ultimate tensile strain of both the FRP bars and SFCBs. Failure ensues when the compressive strain of the SSC reaches its ultimate limit. This outcome is anticipated in practical structures due to their inherently ductile nature.
(3)
Failure mode 3: εc < εcu, εsf,y < εf = εsf = εhu.
In failure mode 3, the SFCBs undergo yielding, and the strain value attains the ultimate tensile strain of both the FRP bars and SFCBs. However, the compressive strain of the SSC falls short of the ultimate compressive strain. This scenario is impractical due to the lesser reinforcement.
Assuming the relative actual compressive height coefficient ξc = xc/h0, the boundary relative actual compressive height coefficient ξcb can be defined according to the plane section assumption.
Boundary failure 1:
ξ cb 1 = x c 1 h 0 = ε cu ε cu + ε sf , y
Boundary failure 2:
ξ cb 2 = x c 2 h 0 = ε cu ε cu + ε hu
Depending on the relative actual compressive height coefficient ξc, the failure modes can be categorized as follows. If ξc > ξcb1, failure mode 1 occurs; if ξcb1ξcξcb2, failure mode 2 occurs; and if ξc < ξcb2, failure mode 3 occurs.

6.3. Simplified Method for Calculating the Ultimate Moment

This section develops a simplified calculation for the section ultimate moment. It primarily relies on a simplified rectangular stress block model for concrete compression. Three distinct cases are proposed based on different failure modes.

6.3.1. Failure Mode 1

Figure 19 illustrates the simplified stress–strain distribution in the cross-section when the over-reinforced SSC beam fails.
According to the Chinese code GB 50010-2010 [21], the upper steel bars are not considered, because the upper steel bars are arranged as erecting bars. Equation (15) can be obtained according to the force equilibrium of the cross-section, where xc and x are the actual and height of compressive concrete, respectively, x = xcβc; and αc and βc are the equivalent rectangular stress factors. The standard values are αc = 1.0, βc = 0.8.
α c f c b x = E f ε f A f + E sf , 1 ε sf A sf
ε f = ε sf = h 0 x / β c ε cu x / β c
Combining Equations (15) and (16) allows for the calculation of the compressive concrete height x. Substituting the compressive concrete height x into Equation (17), the flexural capacity of the SSC beams with hybrid reinforcement of SFCBs and FRP bars can be determined.
M u = α c f c b x ( h 0 x 2 )

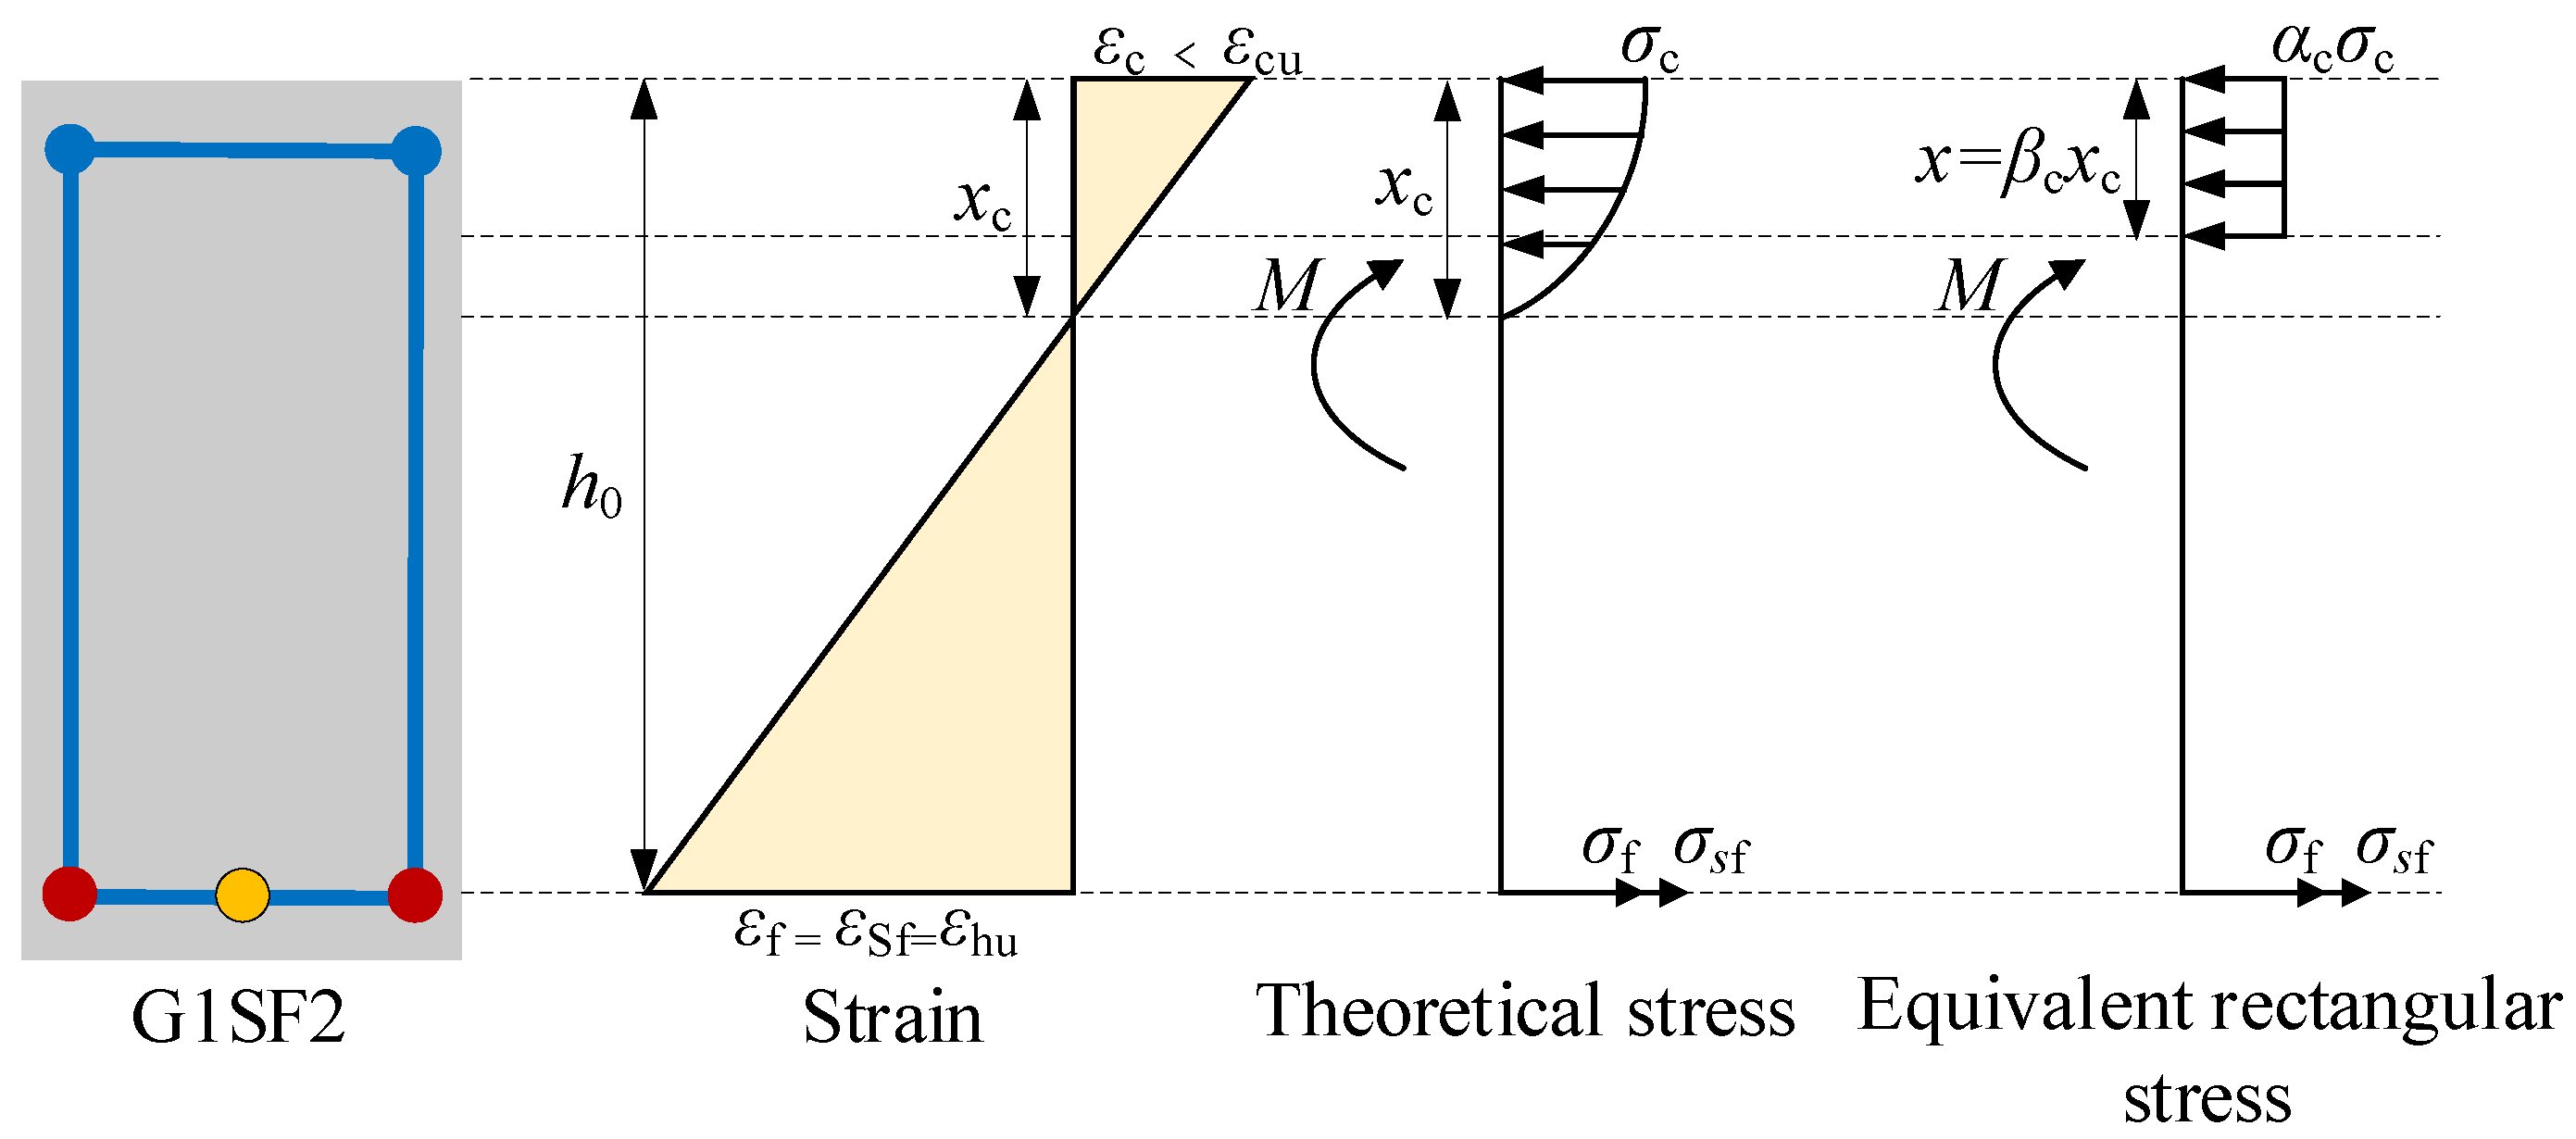
6.3.2. Failure Mode 2

Figure 20 illustrates the simplified stress–strain distribution in the cross-section when the appropriate hybrid reinforced SSC beam fails.
Equation (18) can be obtained according to the force equilibrium of the cross-section. Combining Equations (16) and (17), the flexural capacity of the SSC beams with hybrid reinforcement of SFCBs and FRP bars can be calculated.
α c f c b x = E f ε f A f + f sf , y + E sf , 2 ε sf ε sf , y A sf

6.3.3. Failure Mode 3

Figure 21 illustrates the simplified stress–strain distribution in the cross-section when the under-reinforced hybrid reinforced SSC beam fails.
Equation (19) can be obtained according to the force equilibrium of the cross-section. The concrete strain εc can be obtained by Equation (20). Combining Equations (19) and (20), the flexural capacity of the SSC beams with hybrid reinforcement of SFCBs and FRP bars can be calculated by Equation (21).
α c σ c b x = E f ε hu A f + f sf , y + E sf , 2 ε hu ε sf , y A sf
ε c = x / β c ε hu h 0 x / β c
M u = α c σ c b x ( h 0 x 2 )
The ultimate moment of the FRP bar and SFCB hybrid-reinforced SSC beam can be determined through checking the different cases, and the flow chart for predicting the ultimate moment is shown in Figure 22.

6.4. Verification of the Ultimate Load

Figure 23 illustrates the errors between the FE and predicted ultimate loads, where Pu,FE and Pu,P represent the FE and predicted results of all the specimens analyzed in Section 5. As shown in Figure 23, the mean and the coefficient of variation of Pu,P/Pu,F are 0.91 and 0.04, respectively. Thus, the predicted results agree well with the FE results, and the simplified method for calculating the ultimate moment of SSC beams with hybrid reinforcement of SFCBs and FRP bars can be provided for reference in structural design.

7. Conclusions

Throughout the detailed numerical simulations and theoretical analyses of the flexural performance of SSC beams with hybrid reinforcement of SFCBs and FRP bars, the following conclusions can be obtained.
(1)
With an increase in the SSC strength, the beam exhibits a substantial rise in cracking, yield, and ultimate loads, accompanied by a decrease in deflection and ductility. The failure pattern shifts from concrete crushing to FRP bar fracture. In cases of hybrid reinforcement with SFCBs and FRP bars, it is recommended to proportionally boost the reinforcement ratio of the FRP bars to avert premature fractures.
(2)
Increasing the sectional steel ratio of the SFCBs significantly enhances the flexural stiffness. This results in a shift in the load–deflection curve from bilinear to trilinear, accompanied by a transition in the failure mode from concrete crushing to FRP bar fracture.
(3)
Increasing the core steel bar yield strength of the SFCB has a minimal impact on the beam’s cracking load and deflection, which remain largely unchanged. While the yield and ultimate loads experience a slight increase, their corresponding deflections decrease slightly. Although the energy dissipation under the normal service conditions rises, the ultimate energy dissipation remains nearly constant, leading to a modest reduction in ductility. Considering cost-effectiveness, enhancing the SFCB’s core steel bar yield strength shows relatively low returns.
(4)
A higher out-wrapped FRP elastic modulus of the SFCB improves the beam’s flexural load capacity and stiffness while minimizing the mid-span deformation and reducing ductility. However, an excessive modulus can lead to premature SFCB failure, making 50 GPa the recommended optimal value.
(5)
When the failure mode of the beam is SFCB fracture, increasing the ultimate tensile strength of the SFCB can improve the ultimate load and deflection. When the failure mode of the beam is crushed concrete, the ultimate tensile strength of the SFCB has no effect on the bending performance.
(6)
Based on the reasonable assumptions, the formulae for the bending capacity of SSC beams with hybrid reinforcement of SFCBs and FRP bars has been developed, and the predicted results align well with the FE results.

Author Contributions

Conceptualization, A.W. and Z.Z.; methodology, A.W.; software, A.W. and Z.Z.; validation, A.W., Z.Z. and Y.L.; formal analysis, Y.L.; investigation, A.W. and Z.Z.; resources, Y.L.; data curation, A.W.; writing—original draft preparation, A.W.; writing—review and editing, Z.Z.; visualization, A.W.; supervision, Y.L.; funding acquisition, Y.L. All authors have read and agreed to the published version of the manuscript.

Funding

This research was funded by the National Natural Science Foundation of China [CN 51878590].

Institutional Review Board Statement

Not applicable.

Informed Consent Statement

Not applicable.

Data Availability Statement

The data presented in this study are available on reasonable request from the corresponding author.

Conflicts of Interest

The authors declare no conflicts of interest.

References

  1. Gao, Y.J.; Zhou, Y.Z.; Zhou, J.N.; Kong, X.L.; Zhang, B.; Liu, S.F.; Feng, J.; Zhu, N.S.; Fan, H.L.; Jin, F.N. Blast responses of one-way sea-sand seawater concrete slabs reinforced with BFRP bars. Constr. Build. Mater. 2020, 232, 117254. [Google Scholar] [CrossRef]
  2. Li, P.R.; Li, W.G.; Yu, T.; Qu, F.L.; Tam, V.W.Y. Investigation on early-age hydration, mechanical properties and microstructure of seawater sea sand cement mortar. Constr. Build. Mater. 2020, 249, 118776. [Google Scholar] [CrossRef]
  3. Li, P.R.; Li, W.G.; Sun, Z.H.; Shen, L.M.; Sheng, D.C. Development of sustainable concrete incorporating seawater: A critical review on cement hydration, microstructure and mechanical strength. Cem. Concr. Compos. 2021, 121, 104100. [Google Scholar] [CrossRef]
  4. Etxeberria, M.; Gonzalez-Corominas, A.; Pardo, P. Influence of seawater and blast furnace cement employment on recycled aggregate concretes’ properties. Constr. Build. Mater. 2016, 115, 496–505. [Google Scholar] [CrossRef]
  5. Montanari, L.; Suraneni, P.; Tsui-Chang, M.; Khatibmasjedi, M.; Ebead, U.; Weiss, J.; Nanni, A. Hydration, pore solution, and porosity of cementitious pastes made with seawater. Mater. Civ. Eng. 2019, 31, 04019154.1–04019154.11. [Google Scholar] [CrossRef]
  6. Sun, Y.J.; Zhang, Y.Y.; Cai, Y.M.; Lam, W.L.; Lu, J.X.; Shen PLPoon, C.S. Mechanisms on accelerating hydration of alite mixed with inorganic salts in seawater and characteristics of hydration products. ACS Sustain. Chem. Eng. 2021, 9, 10479–10490. [Google Scholar]
  7. Yaseen, S.A.; Yiseen, G.A.; Poon, C.S.; Li, Z.J. Influence of seawater on the morphological evolution and the microchemistry of hydration products of tricalcium silicates (C3S). ACS Sustain. Chem. Eng. 2020, 8, 15875–15887. [Google Scholar]
  8. Wang, J.J.; Liu, E.G.; Li, L. Multiscale investigations on hydration mechanisms in seawater OPC paste. Constr. Build. Mater. 2018, 191, 891–903. [Google Scholar] [CrossRef]
  9. Xiao, S.M.; Zhang, M.; Zou, D.J.; Liu, T.J.; Zhou, A.; Li, Y. Influence of seawater and sea sand on the performance of Anti-washout underwater concrete: The overlooked significance of Mg2+. Constr. Build. Mater. 2023, 374, 130932. [Google Scholar] [CrossRef]
  10. Ghorab, H.Y.; Hilal, M.S.; Antar, A. Effect of mixing and curing waters on the behaviour of cement pastes and concrete part 2, microstructure of cement pastes. Cem. Concr. Res. 1990, 19, 868–878. [Google Scholar] [CrossRef]
  11. Akinkurolere, O.O.; Jiang, C.; Shobola, O.M. The influence of salt water on the compressive strength of concrete. Eng. Appl. Sci. 2007, 2, 412–415. [Google Scholar]
  12. Zhao, Y.F.; Hu, X.; Shi, C.J.; Zhang, Z.H.; Zhu, D.J. A review on seawater sea-sand concrete: Mixture proportion, hydration, microstructure and properties. Constr. Build. Mater. 2021, 295, 123602. [Google Scholar] [CrossRef]
  13. Zhang, Q.T.; Xiao, J.Z.; Liao, Q.X.; Duan, Z.H. Structural behavior of seawater sea-sand concrete shear wall reinforced with GFRP bars. Eng. Struct. 2019, 189, 458–470. [Google Scholar] [CrossRef]
  14. Ji, X.L.; Chen, L.J.; Liang, K.; Pan, W.; Su, R.K.L. A review on FRP bars and supplementary cementitious materials for the next generation of sustainable and durable construction materials. Constr. Build. Mater. 2023, 383, 131403. [Google Scholar] [CrossRef]
  15. Hua, Y.T.; Yin, S.P.; Feng, L.L. Bearing behavior and serviceability evaluation of seawater sea-sand concrete beams reinforced with BFRP bars. Constr. Build. Mater. 2020, 243, 118294. [Google Scholar] [CrossRef]
  16. Chen, Z.P.; Li, S.X.; Zhou, J.; Xu, R.T.; Dai, S.Q. Flexural behavior of GFRP bars reinforced seawater sea sand concrete beams exposed to marine environment: Experimental and numerical study. Constr. Build. Mater. 2022, 349, 128784. [Google Scholar] [CrossRef]
  17. Zhou, F.; Cheng, Y.M.; Zhu, D.J. Shear Behavior of Ultra-High Performance Seawater Sea-sand Concrete Beams with FRP Bars. J. Hunan Univ. (Nat. Sci.) 2023, 50, 159–168. (In Chinese) [Google Scholar]
  18. Dong, Z.Q.; Wu, G.; Xu, Y. Experimental study on the bond durability between steel-FRP composite bars (SFCBs) and sea sand concrete in ocean environment. Constr. Build. Mater. 2016, 115, 277–284. [Google Scholar] [CrossRef]
  19. Xiao, S.H.; Lin, J.X.; Li, L.J.; Guo, Y.C.; Zeng, J.J.; Xie, Z.H.; Wei, F.F.; Li, M. Experimental study on flexural behavior of concrete beam reinforced with GFRP and steel-fiber composite bars. J. Build. Eng. 2021, 43, 103087. [Google Scholar] [CrossRef]
  20. GB/T 50081-2019; Standard for Test Methods of Concrete Physical and Mechanical Properties. National Standard of the People’s Republic of China: Beijing, China, 2019. (In Chinese)
  21. GB 50010-2010; Code for Design of Concrete Structures. National Standard of the People’s Republic of China: Beijing, China, 2010. (In Chinese)
  22. ABAQUS Inc. Abaqus Analysis User’ s Manual; ABAQUS Inc.: Palo Alto, CA, USA, 2010. [Google Scholar]
  23. Sidoroff, F. Description of Anisotropic Damage Application to Elasticity. In Physical Non-Linearities in Structural Analysis. International Union of Theoretical and Applied Mechanics; Hult, J., Lemaitre, J., Eds.; Springer: Berlin/Heidelberg, Germany, 1981. [Google Scholar]
  24. Ge, W.J.; Zhang, Z.W.; Ashour, A.; Guan, Z.W.; Jiang, H.B.; Sun, C.Z.; Qiu, L.F.; Yao, S.; Cao, D.F. Flexural performance of prefabricated U-shaped UHPC permanent formwork–concrete composite beams reinforced with FRP bars. Arch. Civ. Mech. Eng. 2023, 23, 108. [Google Scholar] [CrossRef]
  25. CEB-FIP Model Code 1990; Design Code. Thomas Telford Ltd.: London, UK, 1990.
  26. Ge, W.J.; Han, M.Y.; Guan, Z.W.; Zhang, P.; Ashour, A.; Li, W.; Lu, W.G.; Cao, D.F.; Yao, S. Tension and bonding behaviour of steel-FRP composite bars subjected to the coupling effects of chloride corrosion and load. Constr. Build. Mater. 2021, 296, 123641. [Google Scholar] [CrossRef]
  27. ACI440.1R-2015; Guide for the Design and Construction of Structural Concrete Reinforced with Fiber-Reinforced Polymer (FRP) Bars. American Concrete Institute: Indianapolis, IN, USA, 2015.
  28. GB 50608-2010; Technical Code for Infrastructure Application of FRP Composites. National Standard of the People’s Republic of China: Beijing, China, 2010. (In Chinese)
Figure 1. Geometric details and test set-up (unit: mm): (a) front elevation; and (b) test setup.
Sustainability 16 01866 g001
Figure 2. The sectional configurations of all the specimens: (a) beam S3; (b) beam G1S2; (c) beam G2S1; (d) beam G3; (e) beam G2SF1; and (f) beam G1SF2.
Sustainability 16 01866 g002
Figure 3. The photo of the FRP bar, SFCB and steel bar.
Sustainability 16 01866 g003
Figure 4. The refined FE model.
Sustainability 16 01866 g004
Figure 5. Tensile stress–strain curves of the steel bar, FRP bar and SFCB.
Sustainability 16 01866 g005
Figure 6. Brittle damage model.
Sustainability 16 01866 g006
Figure 7. Bond-slip constitutive: (a) normal; and (b) tangential.
Sustainability 16 01866 g007
Figure 8. Effects of the mesh size and bond-slip behavior on the load–deflection curves of beam G1SF2.
Sustainability 16 01866 g008
Figure 9. Failure modes: (a) G2SF1; and (b) G1SF2.
Sustainability 16 01866 g009
Figure 10. Load–deflection curves: (a) S3; (b) G1S2; (c) G2S1; (d) G3; (e) G2SF1; and (f) G1SF2.
Sustainability 16 01866 g010
Figure 11. Load–deflection curves: (a) compression; and (b) tension.
Sustainability 16 01866 g011
Figure 12. Nominal stress–strain curves of an SFCB: (a) effect of αs on SFCB; (b) effect of fsf,y on SFCB; (c) effect of Esf,f on SFCB; and (d) effect of fsf,u on SFCB.
Sustainability 16 01866 g012
Figure 13. Effect of fc on flexural performance: (a) P-δ curves; (b) Escr; (c) Eu; and (d) μ.
Sustainability 16 01866 g013
Figure 14. Effect of αs on flexural performance: (a) P-δ curves; (b) Escr; (c) Eu; and (d) μ.
Sustainability 16 01866 g014
Figure 15. Effect of fy on flexural performance: (a) P-δ curves; (b) Escr; (c) Eu; and (d) μ.
Sustainability 16 01866 g015
Figure 16. Effect of Esf,f on flexural performance: (a) P-δ curves; (b) Escr; (c) Eu; and (d) μ.
Sustainability 16 01866 g016
Figure 17. Effect of fsf,u on flexural performance: (a) P-δ curves; (b) Escr; (c) Eu; and (d) μ.
Sustainability 16 01866 g017
Figure 18. Sectional strain distribution of the boundary state.
Sustainability 16 01866 g018
Figure 19. Stress distribution in the hybrid-reinforced beam (failure mode 1).
Sustainability 16 01866 g019
Figure 20. Stress distribution in the hybrid-reinforced beam (failure mode 2).
Sustainability 16 01866 g020
Figure 21. Stress distribution in the hybrid-reinforced beam (failure mode 3).
Sustainability 16 01866 g021
Figure 22. Flow chat for predicting the ultimate flexural moment.
Sustainability 16 01866 g022
Figure 23. Comparison of the predicted and FE simulate results.
Sustainability 16 01866 g023
Table 1. Details of the specimens.
No.As/mm2Af/mm2ρs/%ρf/%ρn/%ρn,f/%ρn,E/%
S32360.330.330.330.33
G1S21571130.210.150.360.520.26
G2S1792260.110.300.410.700.18
G33390.450.450.900.12
G2SF1793480.110.460.571.040.23
G1SF21583580.210.480.691.180.34
Table 2. Details of the CDPM parameters.
Ψεσb0/σc0Kcμ
40°0.11.160.6670.0005
Table 3. Details of the designed parameters.
Influence ParametersReference ParametersExpanded Parameters
fc/MPa19.534.2, 41.8, 49.4
αs0.390, 0.77, 1.0
fsf,y/MPa414300, 500, 600
Esf,f/GPa5060, 70, 80
fsf,u/MPa997750, 1250, 1500
Table 4. Characteristic load, deflection and failure mode.
fc/MPaPcr/kNδcr/mmPy/kNδy/mmPu/kNδu/mmFailure Pattern
19.532.60.3967.92.87177.037.1Concrete crushing
34.237.70.3868.32.86197.131.1FRP bar fracture
41.841.90.3573.72.85201.728.9FRP bar fracture
49.444.70.3076.12.83202.828.2FRP bar fracture
Table 5. Characteristic load, deflection and failure mode.
asPcr/kNδcr/mmPy/kNδy/mmPu/kNδu/mmFailure Pattern
030.70.32177.039.5Concrete crushing
0.3932.6 0.39 67.92.87177.037.1Concrete crushing
0.7735.60.4094.23.25170.731.1FRP bar fracture
1.038.10.47109.53.32138.513.0FRP bar fracture
Table 6. Characteristic load, deflection and failure mode.
fy/MPaPcr/kNδcr/mmPy/kNδy/mmPu/kNδu/mmFailure Pattern
30032.6 0.39 52.02.02174.437.7Concrete crushing
41432.6 0.39 67.92.87177.037.1Concrete crushing
50032.6 0.39 79.13.54179.036.5Concrete crushing
60032.6 0.39 93.54.75180.735.8Concrete crushing
Table 7. Characteristic load, deflection and failure mode.
Esf,f/GPaPcr/kNδcr/mmPy/kNδy/mmPu/kNδu/mmFailure Pattern
5032.60.3967.92.87177.037.1Concrete crushing
6033.30.3870.62.81178.934.1Concrete crushing
7033.80.3772.32.78182.331.8Concrete crushing
8034.20.3675.52.73186.130.0SFCB fracture
Table 8. Characteristic load, deflection and failure mode.
fsf,u/MPaPcr/kNδcr/mmPy/kNδy/mmPu/kNδu/mmFailure Mode
75032.60.3967.92.87172.728.8FRP bar fracture
99732.60.3967.92.87177.037.1Concrete crushing
125032.60.3967.92.87177.037.1Concrete crushing
150032.60.3967.92.87177.037.1Concrete crushing
Disclaimer/Publisher’s Note: The statements, opinions and data contained in all publications are solely those of the individual author(s) and contributor(s) and not of MDPI and/or the editor(s). MDPI and/or the editor(s) disclaim responsibility for any injury to people or property resulting from any ideas, methods, instructions or products referred to in the content.

