Abstract
Mud crab fishing (Scylla serrata) is an important activity contributing to the livelihood of coastal communities in Mozambique. The abundance of this crab and the increase in international companies in the region that exclusively buy crabs and export to the Asian market have caused fisheries to gain local importance in recent years. The present study evaluates the socioeconomic importance of mud crab fishing and the contribution of this activity to the quality of life (QoL) of the local communities along the Bons Sinais Estuary (BSE)—Mozambique. The study was conducted in three fishing villages of the BSE (Mucupia, Carungo, and Inhangulue) to collect information on the economic and sociocultural structure conditions of the local crab families. Field data collection focuses on direct observation and a semi-structured questionnaire divided into four categories/dimensions: fishing activity (FA), family structure (FS), typology of household expenditure (HE), and other activities (OTA). The socioeconomic conditions of fishers’ families were analyzed based on the fishery contribution index (FCI), which comprises different indicators related to FA, HE, and OTA. The monthly fishing revenue ranged from MZN 2.500 (EUR ≈ 35) to MZN 30.000 (EUR ≈ 417), with an average of around MZN 10.796 (EUR ≈ 150) per fisher, slightly exceeding the minimum wage set for public service in Mozambique, which is around MZN 8000 (EUR ≈ 112). The contribution of mud crab fishing is low and is not directly related to enhancement of QoL, meaning that the fishing revenue of mud crabs is barely enough to cover the basic needs of fishers’ families, such as basic services and basic goods. Investments are mainly for transport, including bicycles. The FCI was also low, standing at the alert level (FCI = 0.26–0.50) in all three communities. As the crab market is still growing in the country, it is important that the government, through competent authorities, creates public policies to ensure sustainable exploitation, regulates the selling price of mud crabs according to size, as happens in other countries, and promotes basic services that facilitate the self-development of the fishing communities.
1. Introduction
Fishing is one of the most important activities in societies all over the world [1,2,3,4]. The livelihoods of many nations, as well as the world’s economies, are generally secured through fisheries. In addition to the social aspects that fishing is associated with, it plays a very crucial economic role, contributing to reducing the unemployment rate, increasing food security, and generating income for the country [1,3,5,6].
Mozambique has one of the most extensive coastal areas in East Africa, as well as great fishing potential [7,8]. Most coastal communities are directly dependent on the sea and its resources for their survival [6,9,10]. In Mozambique, marine fisheries account for more than 90% of the total fish production, of which around 80% originates from small-scale and subsistence fisheries [11,12]. This is also the case for many estuarine communities along the Bons Sinais Estuary (BSE), where artisanal and subsistence fishery play a key socioeconomic role [13,14].
The mud crab (Scylla serrata) is a crustacean of high commercial value belonging to the Portunidae family [15,16,17]. This species has a wide distribution, covering the entire Indo-Pacific region from Hawaii, Japan, Taiwan, Philippines, Australia, the Red Sea, South Africa, and around the Indian Ocean to East Africa [17]. This species is exploited in both artisanal and industrial fishing in many countries [15,17]. The main market is Asian countries, mainly the Republic of China [18,19].
In Mozambique, the mud crab is distributed throughout most of the coast, with higher abundance in Zambézia Province, which is believed to be associated with the greater abundance of mangroves in this region [8,20]. The mud crab contributes a low percentage in weight to the global fisheries’ catches in Mozambique due to unreported catches as it has not been included in national fisheries’ statistics. Although crustaceans present low contributions in catches, they are economically valuable resources [21]. The species is caught in several estuaries, but there is a major lack of information in relation to this activity, as well as their socioeconomic importance for local fishing communities [22]. Since 2015, two Chinese companies have been established in Quelimane, targeting their market to crabs and clam fisheries. The low acquisition price of crabs at local villages, together with the increasing international demand, made the number of these companies triple until 2020. This aspect has raised major concerns from local authorities, namely related to increased fishing pressure and potential overfishing [22]. Thus, the National Institute of Fisheries Research (IIP), now the Oceanographic Institute of Mozambique, started scientific surveys in 2016 and 2017 to collect biological data about the species [22]. This study focused on biological aspects such as the size of first maturity and spawning seasons. So far, there are no studies addressing the socioeconomic aspects and the role of mud crab fishing regarding enhancing the living conditions of the local communities in Mozambique and the entire western Indian Ocean region.
Socioeconomic studies of many fisheries are complex. However, they are very important because they provide the possibility to understand the economic, sociocultural, and overall/particular conditions associated with the fisheries, such as livelihoods, the profitability of the activity, and the development pattern of fishing communities. This knowledge is very important to support the conservation and management of fisheries’ resources [3,14,23,24]. Consequently, such knowledge can support decision makers in the formulation of appropriate public policies aimed at offering basic services with a view to promoting the self-development of fishing communities [14,25]. Subsistence and artisanal coastal fishing are regarded as some of the most important activities that determine the livelihood of fishing communities of small islands and in estuarine fisheries in Africa, including in Mozambique [2,8,13,26]. Traditionally, the dependence of coastal communities on small-scale and subsistence fishing has been determined by the availability of arable land, or other sources of income related to secondary sectors, which may include additional factors that determine the social and economic role of coastal fishing [25,27].
The development of effective policies requires knowledge of the resource and fishing and marketing systems, which in most cases are not sufficiently known for crab fishery. Economic assessment is usually applied to determine the viability of fishing and marketing operations, and to identify constraining factors in fisheries. Such analyses are based on principles of rational economic behavior, capital, labor, and time as major input components [24,28,29,30]. These principles, however, do not account for traditional social values. Conventional economic analysis may therefore be limited to extending our understanding of the economic and sociocultural structures and conditions associated with artisanal fisheries [28]. Despite such importance, regional government policies in Mozambique pay very little attention to crab fishery regarding how it can support fishers’ livelihoods and local communities. Knowledge of the commercialization process is also lacking that is of fundamental importance for the formulation and control of management measures, as well as for ensuring socioeconomic sustainability in fishing areas, from the production phase to commercialization [31]. On the other hand, the sociodemographic and socioeconomic characteristics of the fishery communities involved, the main actors, as well as information that enables understanding the contribution of crab fishery regarding improvement of family life conditions are also insufficiently understood. We gathered data on the fishing gear and operations, the fishing yields/revenues, the commercialization circuit, and on the family structure, the typology of household expenditure, and other activities complementary to crab fishery to assemble information related to the socioeconomic profiles of the crab fishers along the BSE. Overall, based on this information, it was possible to assess the extent to which mud crab fishing contributes to improving the quality of life of the fishing communities along the BSE. Specifically, we evaluated how crab fishing revenue is related to household expenditures. Initiatives that aim to encourage the development of programs that promote the socioeconomic valuation of crab fishing and the respective public policies were also suggested and discussed.
2. Material and Methods
2.1. Study Area
The study was conducted in three fishing communities along the BSE, in Zambézia Province, central region of Mozambique: Carungo, Inhangulue, and Mucupia. These communities were selected because they engage in fishing activities, with a particular focus on mud crab harvesting. The main channel of the BSE spans approximately 30 km from its sea entrance to the upper estuary, where two freshwater rivers, Cuacua and Licuar, converge. This estuary separates Quelimane and Inhassunge Districts (Figure 1). The climate is tropical, with two seasons: dry–cold season from April to August) and wet–warm season from October to March. The water temperature in estuary ranges from 17 to 31 °C and salinity from 24 to 35‰ and can drop during the wet season, once the river discharge has a great influence on the environment [32].
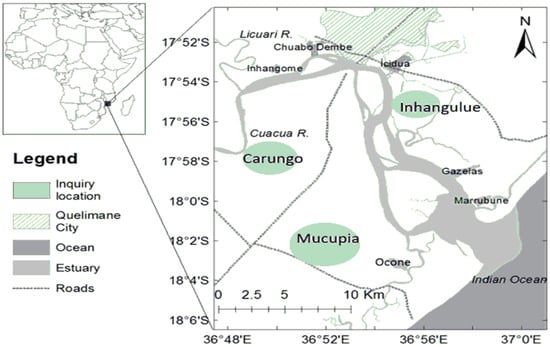
Figure 1.
Location of the fishing communities surveyed along the Bons Sinais Estuary (BSE).
2.2. Data Collection
To understand and characterize fishing activity, fishing gear characteristics, families’ socioeconomic profiles, and commercial value chain of mud crab, two techniques for data collection were used: (i) direct observation during fieldwork, and (ii) inquiries with fishers. The inquiries were conducted through a semi-structured interview carried out between September and October 2018.
Following standard studies in socioeconomic assessment in fisheries [3,33,34,35], the questionnaire was composed of open questions as well as closed questions. Open questions play a major role as they allow the respondent to ask questions about a given proposed topic without conditions pre-fixed by the researcher [34], which is the case regarding fishers’ age, number of children, the number of household members, and so on. Closed questions include the typology of household expenditure and other activities’ dimensions (Table 1).

Table 1.
Socioeconomic categories, variables, and indicators (italicized).
The snowball method was used to collect socioeconomic data, which consist of identifying a fisher, which will indicate other crab fishers. This method assumes that all co-workers know each other, which means that one fisher can indicate the other fishers more easily [36]. In addition, the inquiry was divided into four different categories/dimensions, namely fishing activity (FA), family structure (FS), household expenditure (HE), and other activities (OTA), in addition to fishing assessment. Each category was composed of several indicators (Table 1).
Because of the low literacy rates among artisanal fishers in the region, employing fishing logbooks for data collection would be unfeasible. Thus, data on fishers’ daily catches, fishing effort, as well as fishing revenue (RPUE) were collected at the landing sites in each fishing village. Crab fishing along the estuary is dependent on the tidal cycle, which in this specific case is semi-diurnal, with two cycles of variations every 6 h. According to interviews, the fishers always try to maximize their catches. The fishing effort was standardized for 6 h of fishing per fisher/day. The price per kg was recorded during the sale of crabs process, at the landing sites, buying and selling places established by Chinese companies, and at local markets in general.
2.3. Data Analysis
All collected information was analyzed using different tools, including descriptive statistics, regression and correlation analysis, and multivariate analysis. Finally, a fishery contribution index (FCI) was also developed to assess how crab fishing impacts socioeconomic conditions and quality of life of many fishers’ families. The monthly fishing effort (FE) was used, which considered cumulative number of fishing days per fisher per month (Equation (1)), while the monthly catch per unit of effort (CPUE) was calculated as the total monthly catches (kg) divided by fishing effort (Equation (2)). The fishing revenue (RPUE—revenue per unit effort) was obtained by multiplying the catch rate by the price (kg) (Equation (3)).
Descriptive statistics (mean ± standard deviation) were used to describe how catch rates (CPUE), fishing revenue (RPUE), fishing effort (FE), age structure of fishers, the number of households per family and the number of children vary between communities. Statistical differences among communities regarding the above indicators were tested using a one-way ANOVA (F-test). Prior to ANOVA, data were analyzed to test normality and homogeneity of variance among treatments. Statistical analyses were conducted using the Past4.01 software. A probability level of α < 0.05 was used to reject the null hypothesis. Whenever statistically significant differences were observed, the post hoc Tukey comparison test was used to identify differences between pair of groups.
The estimation of scores within the HE and OTA categories was conducted by estimating the probabilities of occurrence of different variables or predefined indicators for each fisher. These values were calculated by the ratio between the number of indicators that were answered by fisher divided by the total number of potential predefined indicators. For instance, for basic goods (BG), if fisher answered “table” (N = 1 indicator) out of 7 available potential indicators, then we obtain 1:7 as probability (Equation (4)).
where Pvscore—is the probability score of the variable; n—is the number of indicators answered by the fishers; and N—is the total number of potential predefined indicators.
The Pearson’s correlation test (α < 0.05) was used to evaluate the degree of relationships between variables [33], aiming to understand the following questions: how fishing revenue (RPUE) relates to families’ investments, such as basic services (BS), basic goods (BG), communication and information goods (CIG), mobility goods (MG), and development goods and family evolution (DGFE). The above relationships were tested under the assumption that higher economic income (RPUE) would enhance the probability to acquire goods and services for crab fishers’ families.
Multivariate analyses were used to test differences between communities in terms of fishing activity (FA category) and socioeconomic structure (categories FS, HE, and OTA). For these analyses, all variables within the category were used: FA, FS, and OTA. For the OTA category, analyses were conducted based on individual indicators. A similarity matrix was built based on the Jaccard similarity index [37,38,39,40]. The multivariate ordination technique (nMDS—nonmetric multidimensional scaling) was used to visualize similar differences among variables/indicators across communities. The one-way PERMANOVA test was used to confirm the existence of possible statistically significant differences in the variables between crab fishing communities. The similarity percentage test (SIMPER) was used to identify the dominant variables that explained categories’ differences among communities whenever statistical differences between communities were found by PERMANOVA. The primary questions formulated for the above analyses aimed to ascertain whether there are differences in fishing activity, household expenditure, family structure, and other complementary activities among communities. All these multivariate analyses were performed using the open software Past4.01.
The fishery contribution index (FCI) created to assess the socioeconomic conditions of the fishers’ families takes into account the values of weighted categories according to their importance to the model (Equation (5)). Three categories of information and their respective variables were used (fishing activity—FA; household expenditure—HE; and other activities—OTA). Categories whose values were numerical and not probabilities of occurrence, such as the FA, were adjusted using a data MIN (0.1)—MAX (1) transformation process, which allows standardizing the categories to have the same scale unit range.
Following Saaty [41] and Silva et al. [42], the fishery contribution index (FCI) was calculated by the cumulative contribution of FA, HE, and OTA (field sampling observation values) multiplied by the estimated weight (W) of each category, divided by the cumulative sum of the weight of each category (Equation (5)).
The weight of each category was obtained through the combination of two methods: AHP—analytic hierarchy processes and PCA—principal component analyses. The AHP method consisted of determining the relative importance of each category through an arbitrary scale of comparison criteria created by expert score judgment [42]. For example, in terms of socioeconomic impact, the FA, HE, and OTA will have different importance, which, when translated into a score, will indicate which of the categories is more important compared to the others and so on. Thus, the final score is determined based on an arbitrary pre-selected scale proposed by Saaty [41]. The importance of the categories can be classified as the following: 1 (the categories have the same importance); 3 (one of the categories is moderately more important than the others); 5 (one of the categories is more important than the others); 7 (one of the categories is very important compared to the others); and, finally, 9 (one of the categories is absolutely important compared to the others) [42]. All these values are presented on the right of the table, while the opposite classifications are presented on the left of the table in fractional numbers (example: 1; 1/3; 1/5; 1/7, and 1/9) (Table 2). In total, three experts were involved in this process, one of them from the National Institute of Fisheries Research and two from academic institutions that understand the socioeconomic nature and livelihood rationality of the local crab communities.
Table 2.
Scale of comparison criteria.
The PCA method was also used to extract the eigenvalues that measure the degree influence of each category in the model through correlation analyses [42,43,44]. These extracted eigenvalues are the weights or factor loadings of each variable on the main PCA Y component, in this specific case the fishery contribution index (FCI). The percentage of variance explanation by principal axis (PCA1) was 48%, 63.2%, and 50% for Carungo, Inhagulue, and Mucupia and 50.3% for all communities.
At the end, the weights of each category in the index are the result of multiplying the proportional weights obtained by AHP method and the eigenvalues extracted from the PCA for all communities, as well as for each community.
Linear relationships were fitted between the values of the fishery contribution index (FCI) (dependent variable), with the economic indicators, in this case the RPUE (explanatory variable), to verify whether any increase in fishing revenue would also increase the contribution index of fishing. Thus, these analyses have enabled shedding light on the impact of improving the socioeconomic conditions of fishermen’s families. According to Kubrusly [44], Silva et al. [42] and Filho et al. [43], normally, this relationship must be positive so that the model can be validated and the analysis can continue; otherwise, it cannot proceed. It is important to note that the fishery contribution index (FCI) was built based on the combination of three categories/dimensions, where the respective weighting methods were applied. Each category/dimension is made up of many variables or indicators. Thus, although the economic indicator (RPUE) represents one of the variables in the FA category used as input data to build the index, in this relationship, it is considered an independent variable. The index rating scale was from zero (0) to one (1). The variations and their respective classifications are described in Table 3.
Table 3.
The index rating scale.
In order to assess the impact of crab fishing on the enhancement of socioeconomic conditions and quality of life of the fishers’ families, Pearson correlation tests were carried out regarding the fishery contribution index (FCI), with the different indicators of families’ investment categories/dimensions. The main indicators include basic services—BS; basic goods—BG; communication and information goods—CIG; development goods and family evolution—DGFE; and mobility goods—MG.
3. Results
3.1. Sociodemographic Structure of Fishers
In total, 73 crab fishers belonging to different families were interviewed in three fishing communities (Mucupia, Carungo, and Inhangulue) along the BSE. The description of the sociodemographic structure of the fishing communities (age structure—A, number of household members—C, fishing experience—E, and number of children—G) is provided in Figure A1, Appendix A. The field interviews confirmed that mud crab fishing is an important activity in all the communities. Only men carry out crab fishing. The age groups of fishers range from 12 to over 50 years old, with an average of 25 years old, and the most frequent age group of fishers is between 16 and 30 years old, representing 82% of the total fishers. Although with a low contribution (4%), children (age ≤ 15) and fishers aged 40 and over (8%) were also observed. The fishing experience of the total number of fishers interviewed ranged from 1 to 15 years, with an average of 5 years of experience. Around 80% of the fishers had between 1 and 6 years of experience in crab fishing, which means that major crab fishery exploitation took place between 2013 and 2019. The number of household members per fishers’ family interviewed ranged from a minimum of two to a maximum of eleven members, with an average of five members. However, 59% of the crab fishers had three to five household members. The number of children per fishers’ family ranged from zero to nine, with a general average of two children per family. Around 55% of the fishers had one to three children, and 27% of the fishers had no children. No statistical differences were observed in the mean age of fishers (ANOVA; F = 0.23; p > 0.05; Figure A1B), number of household members (ANOVA; F = 0.26; p > 0.05; Figure A1D), fishing years of experience (ANOVA; F = 0.17; p > 0.05; Figure A1F), and number of children (ANOVA; F = 0.07; p > 0.05; Figure A1H) between all three communities (see Figure A1, Appendix A).
3.2. Fishing Activity Characterization, Gear Characteristics, and Modus Operandi
Crab fishing takes place during high tide, and a fishing line is the main fishing gear used to target crabs (Figure 2A). Several independent fishing lines are deployed in a proxy fishing area. The fishing lines are made of opportunity material and consist of a buoy that remains at the surface, which is linked to a baited hook by a line. The distance between buoys varied between 10 and 15 m. The buoy dropline, measuring 8 to 12 m, is equipped with one hook at the end of the line that comes in contact with the sea floor. The droplines’ weights, which allow the hooks to remain on the sea floor, can include rocks and opportunity materials such as lead plates decomposed from obsolete car batteries. The hooks are barbed baitholder hooks. The number of the lines and buoys to fish crabs varied among boats as the boat size and accommodation conditions of the equipment occupy most boats’ surfaces. Small shrimp from the Sergestidae family (low economic value) and small tilapias (Oreochromis mossambicus and Oreochromis niloticus) are normally used as bait in crab fishery, and the types of boats used during fishing are usually small wooden pirogues, with a maximum capacity to carry one or exceptionally two people (Figure 2B). The selling price to fishers per kg ranged from EUR 1 to 3, with an average of EUR 2 ± 0.2 SD (based on August to September 2019 surveys).
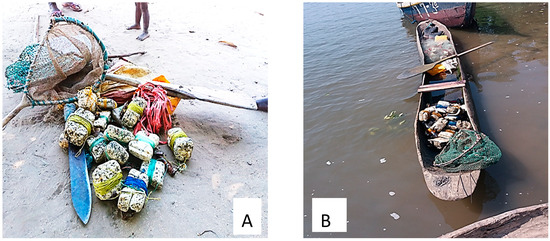
Figure 2.
Type of fishing gear (A) and type of boat used during fishing (B).
3.3. Value Chain of Mud Crab in the Bons Sinais Estuary (BSE)
Figure 3 shows the structure of the commercial production chain and the market circuit of mud crab in the region. Individual fishers are responsible for production/catching. Usually, no bycatch species are caught. After fishing, there are three types of buyers, which include fixed or primary buyers, the local Chinese companies’ buying stations in the communities, and, finally, secondary buyers. Crab catches most often are already destined for a fixed buyer. Therefore, no auction occurs. Secondary buyers are responsible for supplying local markets, restaurants, and hotels, ensuring local consumption. Secondary buyers often do not have access to fishers, and the product is traded from fixed or primary buyers. Primary or fixed buyers act as a kind of pivot in the marketing circuit; they are very familiar with prices and market fluctuations and have several possibilities to sell their product, such as through secondary buyers or at Chinese companies, or even direct to the exporting companies. All catches sold to Chinese buying stations, or sold directly to Chinese companies, are for export to the international market. The crab circuit implies commercialization and exporting specimens alive.
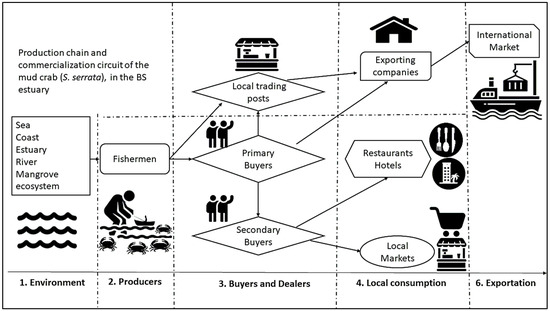
Figure 3.
Artisanal fishery production chain of mud crab along the BS estuary.
3.4. Distribution of Fishing Revenue between Fishers
The monthly revenue per fisher ranged from MZN 2.500 (EUR ≈ 35) to MZN 30.000 (EUR ≈ 417), with an average monthly income around MZN 10.796 (EUR ≈ 150), slightly exceeding the minimum wage fixed regarding public service in Mozambique, which is around MZN 8000 (EUR ≈ 112). Indeed, most fishers (43%) have a monthly fishing revenue below the observed average income (fishing revenue of fishers < average income), a few of them (19%) have an average income (fishing revenue of fishers ≈ average income), and 38% of the fishers have fishing revenue above the average income (fishing revenue of fishers > average income) (Figure 4).
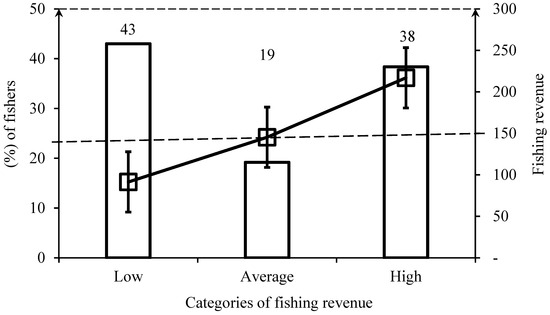
Figure 4.
Categories of fishing revenue and the respective percentages of fishers. Dashed line represents the average revenue among fishers.
3.5. Analysis of Catches per Unit of Effort (CPUE), Fishing Effort (FE), and Fishing Revenue (RPUE)
The fishing effort ranged from 8 to 28 fishing days, equivalent to 48 to 168 h per fisher per month. The mean of fishing effort and standard deviation (SD) was 25 ± 5.1 SD fishing days, equivalent to 150 fishing hours per fisher per month (Figure 5A). The catch rates (CPUE) ranged from 24 to 168 kg per fisher per month, equivalent to a mean catch of 86 ± 33.4 SD kg (Figure 5B). The fishing revenue (RPUE) ranged from EUR 33 to 369 per fisher per month, while the mean fishing revenue (RPUE) was around EUR 150 ± 66.5 SD per fisher per month (Figure 5D). The expenses for fishing are relatively low, ranging from EUR 0.3 to 9 per fisher per month, with a general average of EUR 4 ± 1.95 SD per fisher per month (Figure 5C). Statistical differences for fishing effort (ANOVA: F = 7.861, p < 0.05), fishing expenses (ANOVA: F = 7.844, p < 0.05), and fishing revenue (RPUE) (ANOVA: F = 7.219, p < 0.05) were observed between the communities.
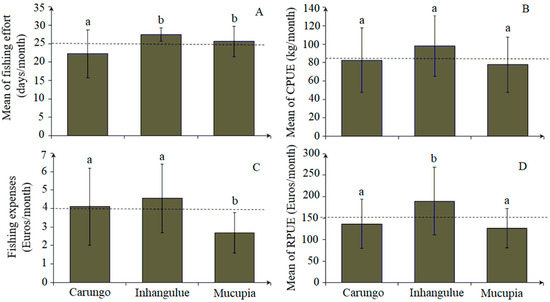
Figure 5.
Mean monthly values of fishing effort (A), catch rates (B), fishing expenses (C), and fishing revenue (D) between communities. The dotted line represents the average mean for all communities. The (a) and (b) letters identify differences between community pairs.
The differences observed for FE (Tukey test: p < 0.05) occurred between both the Mucupia and Inhangulue communities, which recorded the highest fishing effort (FE), and Carungo (Figure 5A). The differences observed for RPUE (Tukey test: p < 0.05) occurred between the community of Inhangulue, which recorded the highest RPUE, and the other communities (Figure 5D). For fishing expenses (FEX) (Tukey test: p < 0.05), differences were found between the community of Mucupia, which has the lowest investment in fishing (Figure 5C), and the other communities. No statistically significant differences were observed for the catch rates (CPUE) between communities (ANOVA, F = 2.499; p < 0.05) (Figure 5B).
3.6. Relationship between Fishing Revenue (RPUE) and Household Expenditure Indicators (BG, BS, CIG, DGFE, and MG)
The correlations between fishing revenue (RPUE) and household expenditure indicators (BS, BG, CIG, DGFE, and MG) were not statistically significant and in some analyses denoted low correlation (r) values (Table 4).
Table 4.
Correlations between fishing revenue (RPUE) and household expenditure indicators.
3.7. Community Structure and Socioeconomic Profiles
The nMDS plots for assessing the differences in the community socioeconomic profiles, performed for different categories of questions collected during the inquiries, are shown in Figure 6. According to the PERMANOVA test, no statistical differences occurred across the communities, and the socioeconomic profiles are similar across the communities for the family structure category (Figure 6A), the fishing activity category (Figure 6C), and the other activities category (Figure 6D). However, for household expenditure (HE), statistical differences were observed between the communities of Mucupia and Carungo (Figure 6B). According to the SIMPER test, communication and information goods (CIG) amounted to the most important indicator within the household expenditure category, which contributed 30% to the observed differences between the communities, followed by development goods and family evolution (DGFE) and basic goods (BG), with 25% and 24% contributions to the differences observed, respectively.
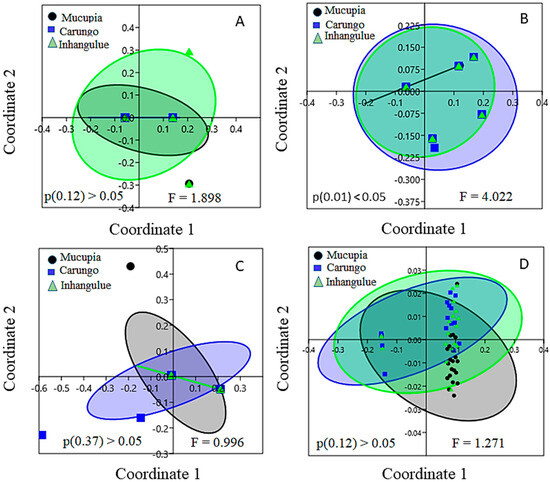
Figure 6.
MDS analysis shows similarity patterns among fishing communities for (A) family structure category, (B) household expenditure category, (C) fishing activity category, and (D) other activities category. The ellipses represent the 95% confidence interval. P and F refer to p-value and F-statistical value of the PERMANOVA test.
3.8. Fishery Contribution Index (FCI)
The overall FCI for all the communities was 0.41. All the communities presented a fishery contribution index (FCI) within the alert level. The lowest value of FCI observed was in the community of Mucupia (0.36), and the highest value of FCI was observed in the community of Inhangulue (0.47), near the upper limit of the alert level. The FCI value for the community of Carungo was (0.38) (Figure 7). Analysis of variance (ANOVA) showed statistically significant differences between the communities in terms of FCI (F = 3.977; p < 0.05). According to Tukey’s pairwise test, differences occurred between the community of Inhangulue and the communities of Mucupia (p < 0.05) and Carungo (p < 0.05). No significant differences were found between the communities of Mucupia and Carungo (p > 0.05) (Figure 7).
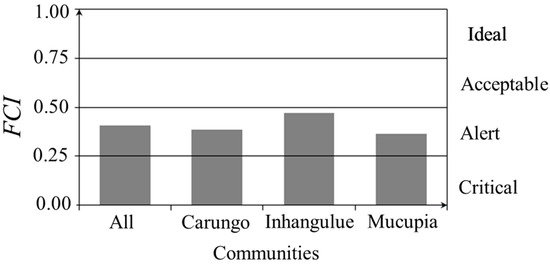
Figure 7.
Fishery contribution index (FCI) by community.
An increase in FCI values was observed with fishing revenue (Figure 8). The linear relationship established between the RPUE and FCI was positive and statistically significant (α < 0.05) for all the communities (Carungo R2 = 0.59, p < 0.05, Inhangulue R2 = 0.68, p < 0.05, and Mucupia R2 = 0.74, p < 0.05), meaning that the increase in fishing revenue has an impact on improving the socioeconomic conditions of fishers’ families.
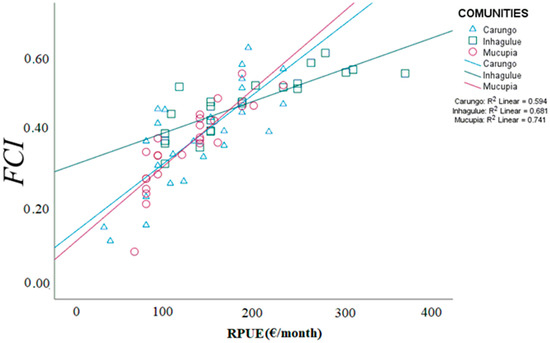
Figure 8.
Relationship between fishers’ fishing revenue (RPUE) and fishery contribution index (FCI) for the communities of Carungo, Inhagulue, and Mocupia.
The correlations between the FCI with different household expenditure categories were statistically significant for basic services (BS), basic goods (BG), and mobility goods (MG) (Table 5). No statistical correlation was found between the FCI and other household expenditure categories, namely communication and information goods (CIG) and development goods and family evolution (DGFE).
Table 5.
Correlations between fishery contribution index (FCI) and the main predefined indicators of household expenditure.
4. Discussion
4.1. Fishers’ Sociodemographic Structure
Most mud crab fishers are youth aged between 16 and 27 years. These results reveal the socioeconomic importance of crab fishing for local communities as alternative employment for the youngest generations in later years since formal jobs are very scarce in the country. The crab fishers’ age group is within the working age in Mozambique, which is 15 to 65 years old [8], as well as close to the Quelimane population demography, whose majority age structure (44%) is 20 to 30 years old [25,45]. The high levels of unemployment within this age group in the country force the youth population to select activities such as fishing to satisfy their needs [45]. This demographic age structure of crab fishers does not match with the other estuarine and coastal fisheries of Mozambique as well as other countries such as Tanzania [46] and Kenya [47], where the age structure of fishers is usually higher because they use, for example, beach seine net, a gillnet that requires huge manpower and strength to handle.
The presence of children (10 to 15 years old) shows that the recruitment process of crab fishers at the community level takes place among this age group, where the knowledge is transferred from the oldest and expert fishers to the youngest. The reduced number of adults (40 and more than 40 years old) observed in crab fishing activity is related to decreases regarding physical conditions with age, making fishing activity difficult to carry out due to manpower limitations [48]. It was found that most young fishers have only five years of fishing experience. This matches with the establishment of Chinese companies in the region that are dedicated to the purchase and export of this species to the Asian market. The results also showed that crab fishery is an attractive activity for youth in different fishing villages rather than higher age groups, also denoting the increasing socioeconomic importance in local communities in recent years potentially due to the lack of employment alternatives and higher incomes. Considering the number of years in fishery, it was observed that most fishers started their activity between 2013 and 2019. International demand is therefore the most likely driving force to explain the increased recruitment into crab fishery in recent years. Based on field interviews, the interest in crabs some years ago was low, and this species was traditionally moderately consumed by local populations, with very little presence in local restaurants or for export.
4.2. Fishing Characterization
The gear used to fish crabs in the BSE is distinct from the gear used in other areas, which mostly includes traps and hoes in the south of the country [15,49]. In the BSE, the species can be harvested by hand during low tide, but this method is not used commonly due to difficulties in harvesting in mud and mangrove bottoms. This leads Quelimane fishers to use fishing lines and remain during long periods to survey the gear for collecting crabs.
Mud crab fishing has distinct characteristics compared to other types of fishing activities. There is no involvement of women in the entire production chain, as usually recorded in other fisheries, where women participate in fishing/shellfish, processing, commercialization, and fish marketing [50,51,52,53]. The absence of women can also be associated with the working conditions since fishing takes place either in the estuary bed, using a rowing boat, or in the mangrove with soft muddy substrate using the excavation technique, which is much more difficult than extracting mangrove bivalves/gastropods. Some authors [53] found that the working conditions during crab fishing, namely physical effort required and job insecurity, are the main aspects that constrained the effective participation of women in this fishing activity. The commercial value chain assessment showed that crabs are sold by men also because most catches are preliminarily sold under pre-agreements established between fishers and traders.
The crab commercial chain involves foreign Chinese companies established in the region that are engaged in the purchase and export of crabs to the Asian market. These actors, fishers/gatherers, traders, suppliers, and exporting companies, play an important role in the overall commercialization circuit. While in other countries these companies have a much-diversified crab market structure destined for Malaysia, Hong Kong, Korea, Taiwan, Singapore, Canada, and Switzerland [17,18], in Mozambique, the marketing started in 2010 and is destined for China. Therefore, it is unlikely that crabs from Quelimane are redistributed to other different Asian markets. According to Begum et al. [18], it is mature and ovate females that are commercialized at a higher prize on the market, while immature females are kept in a fattening system where they are fed until they become mature and with eggs to be placed on the market. The issue related to Asiatic crab development stage/gender preferences is something that the local fishers along the BSE are not aware of, as realized by the field interviews. In Mozambique, crab fattening is still not developed but can be viable in some estuarine areas where old aquaculture/salt flats facilities can be used, including along the BSE [23]. This procedure can be regarded as a potentially valuable investment to be implemented at the community level. In each community, fishing associations can collaborate to establish a co-management system. This system would enhance the value of seafood by facilitating competitive and fairer initial auction selling prices. This would also increase the probability to increase crab families’ economic revenue. Considering the average sale price in 2018 of EUR 2/kg, the crabs are sold in the Asiatic market (EUR 18) at 9 times the pay in Mozambique [17]. The introduction of measures that can promote fair/competitive prices would also valorize the overall crab commercial chain by increasing the number of actors in the crab commercialization process.
The high abundance of the species in the region [20,49,54], associated with the lack of studies and specific regulations and control regarding mud crab fishing [22], as well as the low prices practiced in relation to Asian markets [17], are determining factors that attracted foreign investments in the region. Consequently, this makes mud crab fishing a priority and important activity for many families since it translates into a benefit regarding the socioeconomic empowerment of families, which usually have low revenue and few job alternatives. It should be noted that the estimated mean fishing revenue from a crab fishery corresponds to more than two minimum wage salaries. This fact can explain why many fishers dedicate themselves solely to this activity for their livelihood.
In many countries, like Bangladesh, the price of crab is evaluated according to size categories (e.g., XL to SM) for males and females [17]. In Mozambique, unfortunately, these criteria do not yet exist, and it is not noticed by local fishers that determine the sale price solely based on the number of individuals and weight (kg). However, higher gains can be expected for local fishers and family livelihoods with crab’s valorization due to market-specific preferences/demands.
4.3. Catches per Unit of Effort, Fishing Effort, and Fishing Revenue
Small-scale crab fishing requires fishing almost every day. This aspect may be associated with the type of artisanal/line fishing gear used and low fishing daily yields [55]. Moreover, crabs do not bring self-protein/direct food security benefits to families. Thus, fishers are required to fish daily to enhance their monthly fishing revenues. Daily fishery, despite being demanding, seems quite attractive and compensates for all the effort undertaken, namely if contextualized within the minimum national wage. The results showed a positive and significant relationship between fishing effort (FE) and catch rates (CPUE), as well as catch rates (CPUE) and fishing revenue (RPUE), which means that the increase in fishing effort has a direct impact on the increase in catch rates, just as the increase in catch rates also has a direct impact on fishing revenue.
Unlike other types of fish that are sold dead, crabs are sold alive as only live specimens have commercial value, with dead crabs being discarded due to toxin concerns. The lack of conditions onboard for conserving living specimens enhances fishers’ economic losses. One alternative after fishers immobilizes crabs onboard, by holding the claws with a rope, can consist of storing the crabs in a mesh diamond bag and hang bag on the boat edge under water to avoid desiccation (reducing indirect mortality). The field interviews also indicated potential fishing revenue losses related to landed crabs that die while awaiting sale. Usually, the daily catches are stored/stocked in small straw cages with some mangrove leaves inside to preserve humidity and protect against desiccation, during consecutive days, until fishers reach a satisfactory amount to be sold. Due to the bad preservation conditions on land, some crabs die, also affecting household revenue.
4.4. Fishing Revenue and Household Expenditure
Assuming that families represent the main motivation for fishing activity, we would expect higher economic revenues to be converted into more household expenditures through the main indicators of this category, namely basic services (BS), basic goods (BG), communication and information goods (CIG), development goods and family evolution (DGFE), and mobility goods (MG). However, such a trend was not observed. This clearly shows that the life of the fishing communities is very peculiar, with large difficulties, especially in applying fishing revenue in the best possible way to benefit each family’s well-being. This aspect may be associated with the fact that the BSE communities are located in rural areas, isolated in the form of islands in relation to urban centers and with a specific culture, where using small canoes and small engine boats is often the only transport method. Under these conditions, without any access to basic services such as roads and bridges, electricity to produce ice, and piped drinking water, among other services/goods, it becomes difficult to make any type of investment due to these imposed sociodemographic barriers [56,57]. Such barriers strongly necessitate developing public policies that aim to guarantee the expansion of basic services that will enable the increase in capacity and self-development of small fishing communities based on the local marine resources available.
4.5. Sociodemographic Community Pattern
According to the results obtained, all the communities display a similar socioeconomic profile in relation to most of the categories/dimensions studied. Statistical differences were only observed for the household expenditure category, which means that most families of these three communities share the same sociodemographic characteristics [56]. This aspect may be associated, on the one hand, with the fact that they are suburban communities based along the BSE that depend mainly on fishing for their livelihoods. According [58], differences between fishing communities occur when fishing patterns are different. That includes variability regarding fishing gear and the type of target species exploited by the community, which was not relevant in the present study. On the other hand, as indicated by the results, mud crab fishing is not a very expensive activity in terms of costs to fishers, including equipment acquisition and maintenance (see also Halare [15] and Cebola [20]). Therefore, crab fishing becomes a very accessible activity for fishers as it requires few families’ investment. The probable reasons for the observed differences in the household expenditure category may be associated with the socioeconomic dynamics of each community and the priorities each family defines. These priorities can be influenced by several factors, such as the location of the community, the environmental conditions of the region, the complementary activities in addition to fishing, and the level of family expenses. In the case of Mucupia, the differences evaluated in relation to the other two communities are probably associated with the absence of two types of investments: development goods and family evolution (DGFE) and mobility goods (Figure A3, Appendix C).
Most fishers have no fishing license and do not declare catches, and the demand has been increasing regarding the BSE in recent years. This should increase local concerns as unregulated fisheries can influence variations in the socioeconomic dynamics of the communities themselves. Early planned mitigation of socioeconomic instability increases due to the lack of regulation should be conducted at the local level. Enhanced capacity building at the community level would enable establishing a fishing collective workforce and, throughout fishing organizations, assist in settling/discussing minimum sales prices, evaluating crabs’ value according to size/gender [59], developing fattening systems, and also evolution regarding alternative activities strongly related to fisheries that cover various facets of community life [60].
4.6. Fishery Contribution Index
The FCI was estimated considering the local particularities (socioeconomic dimensions) of the fishing communities. The overall FCI estimated was low (0.41), standing at the alert level, that is, below the acceptable level, which shows that, although crab fishing is considered an important socioeconomic activity, the revenue is still not enough to cover the basic needs of fishers’ families.
The results showed significant differences between the communities regarding FCI. The community of Inhangulue recorded the highest FCI, very close to the upper limit of the alert level, that is, close to the transition zone to the lower limit of the acceptable level. The observed differences are explained by the variation in fishing patterns and the levels of household expenditure between communities, resources’ availability, and fishing experience. The community of Inhangulue comprises fishers with more experience (years of fishing) and higher monthly fishing effort, as well as the highest catch per unit effort (CPUE) and fishing revenue (RPUE) (see Figure 4). Moreover, it is one of the communities where more investments were observed regarding all the household expenditure category indicators (Figure A3, Appendix C).
The FCI was related positively to the fishing revenue (RPUE) in all the communities, denoting that crab fishing has an impact on enhancing the socioeconomic conditions of the fishers’ families in the communities along the BSE, meaning that the socioeconomic aspects of many fishers’ families are intrinsically dependent on fishing activity (FA). However, the correlation analysis between the FCI and the main indicators of the household expenditure category showed that the fishers are still far from fully satisfying the needs of their families. There was no correlation between other complementary activities (OTA) and the main indicators of household expenditure. This result shows that crab fishing is considered to be the main fishing activity regarding livelihood and income generation for many families. Food and crockery are the only investments that are fully covered by fishing revenue within the basic services and goods indicators (Figure A4, Appendix C). In addition to basic services and goods, the results show that basic transport, such as a bicycle, has also received special attention from fishers, which can cause them to save a portion of their money to purchase one. These aspects facilitate mobility and crab transportation to the urban markets where the selling prices are more attractive (Figure A4, Appendix C). This aspect adds opportunity costs to fishers and their families as fishers must decide to save money to satisfy another need, such as purchasing transport, in addition to addressing, for example, basic needs, such as basic services and basic goods, that must also be satisfied [29,61].
Regardless of the investment decisions made by fishers, the results indicated a weak relationship between fishing revenue and the main indicators of the household expenditure category. This aspect reveals that fishing revenue is still too low to meet most families’ needs and, consequently, the possibility of achieving increased quality of life. As previously discussed, rural communities face important limitations (Section 4.4.) that place them in unfavorable conditions, such as the lack of basic services such as electricity, drinking water, and access roads, which can favor the self-development of small fishing villages. This also limits the investment capabilities and initiatives of fishers since, in these conditions, the challenges become even greater [35,53]. Therefore, implementing public policies that aim to promote the self-development of small fishing communities is a crucial factor as it would enable the standard of social dignity to be raised as well as reduce the existing inequalities [35,53].
5. Conclusions
The study highlighted the socioeconomic importance of artisanal mud crab fishing for BSE fishing villages. Many families along the BSE depend on this activity for their livelihood and generating income. With an increase in commercial value and market expansion, crab fishing has attracted mostly young people as an alternative to formal employment. Despite the growing importance of mud crab fishing and the market in the region, it was still unknown to what extent the activity contributes to the well-being and improvement of the living conditions of fishers’ families. The results of this study showed good prospects in terms of exploration capacity and poor prospects in terms of fishing revenue as most fishers’ monthly revenue is below the minimum wage for the public services of Mozambique. However, the fishing revenue is not translated into household expenditures due to a lack of basic social infrastructures, which makes the fishery contribution index of families low with little potential to increase. In this context, the intervention of public policies in order to offer basic services to these communities is undoubtedly necessary, and substantial progress is still required to be made.
The results of this work can be used to regulate mud crab marketing procedures and promote the socioeconomic development of fisheries. Important issues to consider are the following: (i) improving the training of communities in developing techniques to reduce post-harvest mortality. This would maximize the fishing revenue. (ii) Supporting the valorization of crabs through the introduction of sales criteria is another concern, where prices vary according to the size and gender of the crab. This would allow communities to increase their fishing revenue. (iii) Supporting the self-organization of fishing communities is another issue; the fishers need to go through a training process, including becoming familiar with the co-management approach, in order to balance crab exploitation in fishing villages with increasing demand from international/foreign companies/markets. (iv) A further aspect is to encourage crab fattening to increase sales prices and promote the development of secondary activities around crab fishing and consequently (v) improve the QoL of fishers’ families. This information is important because it can support decision makers in the development of public policies capable of promoting the self-development of confined fishing villages along the BSE.
Author Contributions
Data curation and acquisition, B.C.M. and C.J.O.C.; Formal analysis, B.C.M. and F.L.; Investigation, B.C.M. and C.J.O.C.; Methodology, B.C.M. and T.C.B.; Project administration and founding, F.L.; Resources, B.C.M.; Supervision, F.L.; Validation, T.C.B.; Writing—review and editing, M.A.T., F.L. and B.C.M. All authors have read and agreed to the published version of the manuscript.
Funding
This work was supported by Project BIOFISH-QoL (Reference Proposal: 330785505): Integrative approach for enhancing quality of life in fishing communities of the ‘Bons Sinais’ Estuary (Mozambique), funded by FCT and Aga Khan Development Network (AKDN). Francisco Leitão received Portuguese national funds from FCT contract program DL57/2016/CP1361/CT0008 and FCT 2022.04803.CEECIND. This study received Portuguese national funds from FCT—Foundation for Science and Technology through projects UIDB/04326/2020, UIDP/04326/2020, and LA/P/0101/2020. Manuessa B. Ph.D. fellowship was funded by Mozambican Ministry of Science and Technology, Higher and Technical Vocational Education.
Institutional Review Board Statement
Not applicable.
Informed Consent Statement
Not applicable.
Data Availability Statement
Data are contained within the article.
Acknowledgments
The authors would like to thank the School of Marine and Coastal Sciences, Eduardo Mondlane University (Mozambique), and the Center for Marine Sciences (CCMAR), University of Algarve—Portugal (UALG-PT) for the partnership developed, and all collaboration in terms of facilities for the study to be carried out. The authors would also like to address their special thanks to the fishers contacted in the three communities where the study was conducted for their affectionate reception and collaboration, providing relevant information about their fishing activity and their way of life that made this study possible. In the same way, we would like to express our special thanks to Noca Bernardo da Silva Furaca who, based on the coordinates, helped to map the study area. We also thank HORIZON-WIDERA-2021-ACCESS-05 Sustainable Horizons (SHEs) European Universities designing the horizons of sustainability; EEA GRANT PT- Innovation 0072 Preparing the new OCEAN economy 2030: the BLUE ROUTE of discovery.
Conflicts of Interest
The authors declare no conflict of interest.
Appendix A

Figure A1.
Description of sociodemographic structure of fishing communities: age structure (A) and the mean age of fishers by community (B); the number of household (C) and the mean number of households by community (D); fishing experience (E) and the mean time of fishing experience by community (F); the number of children (G) and the mean number of children by community (H).

Appendix B

Figure A2.
Linear regression with 95% confidence interval between (A) fishing effort (FE) and catch rates (CPUE) and (B) catch rates (CPUE) and fishing revenue (RPUE).
Figure A2.
Linear regression with 95% confidence interval between (A) fishing effort (FE) and catch rates (CPUE) and (B) catch rates (CPUE) and fishing revenue (RPUE).

Appendix C

Figure A3.
Typology of household expenditure and percentage distribution of the main indicator groups per community all communities (A), Mucupia (B), Inhangulue (C) and Carungo (D). BG—basic goods; BS—basic services; CIG—communication and information goods; DGFE—development goods and family evolution; MG—mobility goods.


Figure A4.
Percentage of the satisfaction level distribution of the set of needs within each indicator. (A)—Basic services; (B)—Basic goods; (C)—Communication and information goods; (D)—development goods and family evolution; (E)—Mobility goods.
Figure A4.
Percentage of the satisfaction level distribution of the set of needs within each indicator. (A)—Basic services; (B)—Basic goods; (C)—Communication and information goods; (D)—development goods and family evolution; (E)—Mobility goods.

References
- Basurto, X.; Franz, N.; Mills, D.; Virdin, J.; Westlund, L. Improving Our Knowledge on Small-Scale Fisheries: Data Needs and Methodologies; FAO Fisheries and Aquaculture Proceedings (FAO): Rome, Italy, 2017; pp. 14–104.
- FAO. The Development and Use of Indicators for Sustainable Development of Marine Capture Fisheries; Technical Guidelines for Responsible Fisheries; FAO: Rome, Italy, 1999; p. 68.
- FAO. Sample-Based Fishery Surveys. A Technical Handbook; FAO: Rome, Italy, 2002.
- Massamba, S.F.P. A Pesca Artesanal e suas Contribuições para o Desenvolvimento Local: Uma Análise Comparativa dos Distritos de Icoaraci-Belém (PA)—Brasil e Vilankulo-Inhambane-Moçambique. Ph.D. Thesis, Núcleo do Meio Ambiente, Universidade Federal do Pará, Belém, Brazil, 2016. [Google Scholar]
- FAO. Precautionary Approach to Capture Fisheries and Species Introductions; FAO Technical Guidelines for Responsible Fisheries; FAO: Rome, Italy, 1996; p. 54.
- Muringai, R.T.; Mafongoya, P.; Lottering, R.T. Climate Change Perceptions, Impacts and Adaptation Strategies: Insights of Fishers in Zambezi River Basin, Zimbabwe. Sustainability 2022, 14, 3456. [Google Scholar] [CrossRef]
- Balidy, H.J.e.J. O Ambiente Costeiro e Marinho de Moçambique, 2nd ed.; CDS Zonas Costeiras/MICOA: Maputo, Mozambique, 2011; pp. 3–61. [Google Scholar]
- Hoguane, A.M. Perfil e Diagnostico da Zona Costeira de Moçambique. Rev. Gestão Costeira Integr. 2007, 7, 69–82. [Google Scholar] [CrossRef]
- ADNAP. Relatório Anual 2012; Administração Nacional das Pescas, Ministério das Pescas: Cidade de Maputo, Moçambique, 2013; pp. 4–56.
- Manuessa, B.; Morais, E.; Borges, T.C.; Teodósio, M.A.; Leitão, F. First Assessment of the Thryssa vitrirostris (Engraulidae) Beach Seine Fishery in Northeastern Mozambique. Multidiscip. Sci. J. 2018, 1, 116–132. [Google Scholar] [CrossRef]
- Doherty, B.; McBride, M.M.; Brito, A.J.; Le Manach, F.; Sousa, L.; Chauca, I.; Zeller, D. Marine fisheries in Mozambique: Catches updated to 2010 and taxonomic disaggregation. In Fisheries Catch Reconstructions in the Western Indian Ocean, 1950–2010; Fisheries Centre Research Reports; Le Manach, F., Pauly, D., Eds.; Fisheries Centre, University of British Columbia: Vancouver, BC, Canada, 2015; Volume 23, pp. 67–81. [Google Scholar]
- Jacquet, J.; Fox, H.; Motta, H.; Ngusaru, A.; Zeller, D. Few data but many fish: Marine small-scale fisheries catches for Mozambique. Afr. J. Mar. Sci. 2010, 32, 197–206. [Google Scholar] [CrossRef]
- Costa, E.F.S.; Mocuba, J.; Oliveira, D.; Teodósio, M.A.; Leitão, F. Biological aspects of fish species from subsistence fisheries in ‘‘Bons Sinais’’ estuary, Mozambique. Reg. Stud. Mar. Sci. 2020, 39, 2352–4855. [Google Scholar] [CrossRef]
- Mugabe, E.D.; Madeira, A.N.; Mabota, H.S.; Nataniel, A.N.; Santos, J.; Groeneveld, J.C. Small-scale fisheries of the Bons Sinais Estuary in Mozambique with emphasis on utilization of unselective gear. WIO J. Mar. Sci. 2021, 59–74. [Google Scholar] [CrossRef]
- Halare, A.I. Distribuição, Abundância e Aspectos Reprodutivos da Scylla serrata (Forskal) no Saco da Ilha de Inhaca. Master’s Thesis, Departamento de Ciências Biológicas—UEM, Maputo, Mozambique, 1999. [Google Scholar]
- Heasmam, M.P. Aspect of the General Biology and Fisher of the Mud Crab Scylla serrata (Forskal) in Morton Bay. Ph.D. Thesis, University of Queensland, Brisbane, Australia, 1980. [Google Scholar]
- Mahmud, A.I.; Mamun, A.A. Marketing of Mud Crab Scylla serrata (Forksal) from Khulna District to International Markets. Eur. J. Agric. Sci. 2013, 11, 2668–3245. Available online: https://www.researchgate.net/publication/259079829 (accessed on 9 January 2024).
- Begum, M.; Shah, M.M.R.; Mamum, A.A.; Alam, M.J. Comparative study of mud crab (Scylla serrata) fattening practices between two different systems in Bangladesh. J. Bangladesh Agric. Univ. 2009, 7, 151–156. [Google Scholar] [CrossRef]
- Pawiro, S. Markets and marketing trends for aquaculture products in Southeast Asia. In Responsible Aquaculture Development in Southeast Asia. Proceedings of the Seminar-Workshop on Aquaculture Development in Southeast Asia organized by the SEAFDEC Aquaculture Department, 12–14 October 1999, Tigbauan, Iloilo City, Philippines; Garcia, L.M.B., Ed.; SEAFDEC Aquaculture Department: Iloilo, Philippines, 2001; pp. 121–132. [Google Scholar]
- Cebola, A.J. Levantamento da Fauna de Caranguejo de no Chuabo Dembe e Mucupia, Distrito de Inhassunge, Província da Zambézia; Monografia de Licenciatura em Biologia Marinha, Escola Superior de Ciências Marinhas e Costeiras da Universidade Eduardo Mondlane: Quelimane, Moçambique, 2011. [Google Scholar]
- Duarte, L.F.A.; Rodrigues, E.S.; Gasalla, M.A. Contextualização da pesca mundial de lagostas e características de comercialização de Scyllarides Spp. E Panulirus Spp. Na baixada santista, Estado de São Paulo, Brasil. Bol. Inst. Pesca 2011, 37, 235–246. [Google Scholar]
- Mualeque, D.O.; Morais, E.; Amoda, C.; Secanhe, Z. Biologia Reprodutiva do Caranguejo de Mangal (Scylla serrata, Forskal, 1775) no Distrito de Mocubela, Província da Zambézia, Moçambique; Instituto Nacional de Investigação Pesqueira (IIP), Moçambique—Delegação da Zambézia: Maputo, Moçambique, 2019. [Google Scholar]
- Costa, E.; Leitão, F. Land Use and Land Cover in Communities along the Bons Sinais Estuary, Mozambique; Dryad: London, UK, 2022; Available online: https://datadryad.org/stash/dataset/doi:10.5061/dryad.1zcrjdft0 (accessed on 12 February 2024).
- Frey, L.; Botan, C.; Kreps, G. Investigating Communication: An Introduction to Research Methods, 2nd ed.; Allyn & Bacon: Boston, MA, USA, 1999. [Google Scholar]
- Francisco, R.P.; Hoguane, A.M.; Simbine, R.L.; Mabota, H.S. Household dependence on fish-based farming systems in the Bons Sinais Estuary in Mozambique. WIO J. Mar. Sci. 2021, 29–41. [Google Scholar] [CrossRef]
- Kronen, M. Fishing for fortunes? A socio-economic assessment of Tonga’s artisanal fisheries. Fish. Res. 2004, 70, 121–134. [Google Scholar] [CrossRef]
- Allison, E.H.; Ellis, F. The livelihoods approach and management of small-scale fisheries. Mar. Policy 2001, 25, 377–388. [Google Scholar] [CrossRef]
- Gustavson, K. Economic production from the artisanal fisheries of Jamaica. Fish. Res. 2002, 57, 103–115. [Google Scholar] [CrossRef]
- Mankiw, N.G. Principles of Microeconomics, 2nd ed.; Harvard University: Cambridge, MA, USA, 2008. [Google Scholar]
- Smith, S.L.; Karasik, R.; Stavrinaky, A.; Uchida, H.; Burden, M. Fishery Socioeconomic Outcomes Tool: A rapid assessment tool for evaluating socioeconomic performance of fisheries management. Mar. Policy 2019, 105, 20–29. [Google Scholar] [CrossRef]
- Agostinho, A.A.; Gomes, L.C.; Pelicice, F.M. Ecologia e Manejo de Recursos Pesqueiros em Reservatórios do Brasil; Editora da Universidade Estadual de Maringá (EDUEM): Maringá, Brazil, 2007; pp. 10–260. [Google Scholar]
- Ministério da Administração Estatal (MAE). Perfil do Distrito de Inhassunge-Zambezia; MAE: Maputo, Mozambique, 2005; pp. 14–25.
- Franquesa, R.; Malouli Idrissi, M.; Alarcón, J.M. Feasibility Assessment Study on the Setting-up of a Socio-economic Indicator Database for Managing Fisheries. 2001. Available online: https://www.oecd.org/greengrowth/fisheries/2639203.pdf (accessed on 13 February 2024).
- Minayo, M.C.S. O Desafio do Conhecimento: Pesquisa Qualitativa em Saúde, 8th ed.; Hucitec: São Paulo, Brazil, 2004; pp. 3–269. [Google Scholar]
- Silva, M.C.; Oliveira, A.S.; Nunes, G.Q. Caracterização socioeconômica da pesca artesanal no município de Conceição do Araguaia, Estado do Pará. Amaz. Ciência Desenvolv. 2007, 2, 3–15. [Google Scholar]
- Bailey, K.D. Methods of Social Research, 2nd ed.; The Free Press: New York, NY, USA, 1982. [Google Scholar]
- Chung, N.C.; Miasojedow, B.ł.Ż.; Startek, M.ł.; Gambin, A. Jaccard/Tanimoto similarity test and estimation methods for biological presence-absence data. BMC Bioinform. 2019, 20 (Suppl. S15), 644. [Google Scholar] [CrossRef] [PubMed]
- Koeneman, S.H.; Cavanaugh, J.E. An Improved Asymptotic Test for the Jaccard Similarity Index for Binary Data. Stat. Probab. Lett. 2022, 184, 1–5. [Google Scholar] [CrossRef]
- Podani, J. The wonder of the Jaccard coefficient: From alpine floras to bipartite networks. Flora Mediterr. J. 2021, 31, 105–123. [Google Scholar] [CrossRef]
- Shi, Y.; Macy, M. Measuring structural similarity in large online networks. Soc. Sci. Res. 2016, 59, 97–106. [Google Scholar] [CrossRef] [PubMed]
- Saaty, T.L. Concepts, theory, and techniques: Rank generation, preservation, and reversal in the analytic decision process. Decis. Sci. 1987, 18, 157–177. [Google Scholar] [CrossRef]
- Silva, M.G.; Cândido, G.A.; Martins, M.F. Método de construção do índice de desenvolvimento local sustentável: Uma proposta metodológica aplicada. Rev. Bras. De Prod. Agroindustriais 2009, 11, 55–72. [Google Scholar] [CrossRef]
- Filho, D.B.F.; Paranhos, R.; Rocha, E.C.; Silva, J.A., Jr.; Maia, R.G. Análise de componentes principais para construção de indicadores sociais. Rev. Bras. Biom. 2013, 31, 61–78. [Google Scholar]
- Kubrusly, L.S. Um procedimento para calcular índices a partir de uma Base de dados multivariados. Pesqui. Oper. 2001, 21, 107–117. [Google Scholar] [CrossRef]
- Instituto Nacional de Estatítica-INE. Recenseamento Geral da População e Habitação. 2017. Available online: https://www.ine.gov.mz/web/guest/d/indicadores-socio-demograficos-mocambique-20062022 (accessed on 13 February 2024).
- Katikiro, R.E. Reef Fisheries and Livelihoods in Coastal Villages of Southern Tanzania: Lessons for Adaptation to Environmental Change? Ph.D. Thesis, University of Bremen, Bremen, Germany, 2014. [Google Scholar]
- Karama, K.S.; Okemwa, G.M.; Kimani, E.N.; Aura, C.M.; Mwakiti, S.M.; Odongo, D.; Ochiewo, J.; Munyi, F.; Waiyaki, E.; Owiti, H.; et al. Rapid Assessment of the Lamu Beach Seine Fishery; KCDP Technical Report; KCDP: Mombasa, Kenya, 2016; Volume 45. [Google Scholar] [CrossRef]
- Fechine, B.R.A.; Trompieri, N. O processo de envelhecimento: As principais alterações que acontecem com o idoso com o passar dos anos. Rev. Científica Int. 2012, 1. [Google Scholar] [CrossRef]
- Macia, A.; Afonso, P.S. The Mud Crab Scylla serrata (Forskål) in Maputo Bay, Mozambique; WIOMSA: Zanzibar, Tanzania, 2014; pp. 3–5. Available online: https://www.researchgate.net/publication/261621563 (accessed on 16 May 2020).
- Dias, T.L.P.; Rosa, S.R.; Damasceno, L.C.P. Aspectos Socioeconômicos, Percepção Ambiental e Perspectivas das Mulheres Marisqueiras da Reserva de Desenvolvimento Sustentável Ponta do Tubarão (Rio Grande do Norte, Brasil). Rev. Gaia Sci. 2007, 1, 1. Available online: https://periodicos.ufpb.br/ojs/index.php/gaia/article/view/2225 (accessed on 12 February 2024).
- Mattos, P.P.; Morais, N.I.; Aloufa, M. Reserva de Desenvolvimento Sustentável: Avanço na concepção de áreas protegidas? Soc. Nat. 2011, 23, 409–422. [Google Scholar] [CrossRef]
- Ministério Do Mar, Águas Interiores e Pescas—Instituto Nacional para Desenvolvimento da Pesca e Aquacultura (IDEPA). Estudo da cadeia de valor da pesca artesanal no Banco de Sofala; IDEPA: São João da Madeira, Portugal, 2019; pp. 1–124. [Google Scholar]
- Oliveira, J.F.; Novaes, J.L.C.; Segundo, A.L.N.M.; Perreti, D. Fisheries characterization and perception of artisanal fishermen in a Sustainable Development Reserve in Brazilian Northeast. Nat. Online 2016, 14, 48–54. [Google Scholar]
- FAO. Fishery Country Profile; FAO: Maputo, Mozambique, 2007; pp. 3–17. Available online: http://www.fao.org/fishery/docs/DOCUMENT/fcp/en/FI_CP_MZ.pdf (accessed on 13 February 2020).
- Mehdi, H.; Lau, S.C.; Synyshyn, C.; Salena, M.G.; Morphet, M.E.; Hamilton, J.; Muzzatti, M.N.; McCallum, E.S.; Midwood, J.D.; Balshine, S. A comparison of passive and active gear in fish community assessments in summer versus winter. Fish. Res. 2021, 242, 1–11. [Google Scholar] [CrossRef]
- Cardenas, M.A.S. Ethnic and Cultural Homogeneity: An Obstacle for Development; Northeastern University: Boston, MA, USA, 2019; pp. 1–23. [Google Scholar] [CrossRef]
- Maruyama, L.S.; Castro, P.M.G.; Paiva, P. Pesca artesanal no médio e baixo Tietê, São Paulo, Brasil: Aspectos Estruturais e Socioeconômicos. Bol. Inst. Pesca 2009, 35, 61–81. [Google Scholar]
- Carvalho, A.R. Social and structural aspects of artisanal fishing in the upper Paraná River Floodplain (Brazil). Bol. Inst. Pesca 2004, 30, 35–42. [Google Scholar]
- Israel, G.D.; Beaulieu, L.J.; Hartless, G. The Influence of Family and Community Social Capital on Educational Achievement. Rural Sociol. 2001, 66, 43–68. [Google Scholar] [CrossRef]
- Yamamura, E. The Role of Social Capital in Homogeneous Society: Review of Recent Researches in Japan. 2008, pp. 1–28. Available online: https://www.researchgate.net/publication/23543285 (accessed on 13 February 2024).
- O’Boyle, E.J. Opportunity Cost, Decision-Making, Limits, and Human Development. 2020, pp. 1–19. Available online: https://www.researchgate.net/publication/340716274 (accessed on 13 February 2024).


Disclaimer/Publisher’s Note: The statements, opinions and data contained in all publications are solely those of the individual author(s) and contributor(s) and not of MDPI and/or the editor(s). MDPI and/or the editor(s) disclaim responsibility for any injury to people or property resulting from any ideas, methods, instructions or products referred to in the content. |
© 2024 by the authors. Licensee MDPI, Basel, Switzerland. This article is an open access article distributed under the terms and conditions of the Creative Commons Attribution (CC BY) license (https://creativecommons.org/licenses/by/4.0/).