Abstract
The motivation for conducting this research stems from the increasingly applied manipulations of emission control systems (ECSs), especially those in diesel passenger cars (PCs). The study aimed to investigate the influence of manipulations of exhaust gas recirculation (EGR) valves and a diesel exhaust fluid (DEF)-dosing system on the nitrogen oxide (NOX) emissions of a Euro 6 diesel vehicle and, through the quantification of vehicles with manipulated ECSs, estimate the emissions of Euro 6 diesel PCs. Portable emissions measurement system (PEMS) measurements were performed on a Euro 6 diesel vehicle at a constant speed and on real driving emission (RDE) routes. The speed-dependent functions of the NOX hot emission factor (EF) were calculated for seven different scenarios. The results showed that the NOX EFs for the worst-case scenarios were more than two orders of magnitude higher than those where all ECSs were active. Applying the calculated EFs and the survey answers on the percentage of manipulated PCs to the Croatian Euro 6 diesel PC fleet, the results showed that the emission levels were up to 46.3% higher than the emissions calculated by the official computer program COPERT v5.6.5, with a tendency towards significantly higher values. The main conclusion is that vehicle manufacturers, policymakers, and the general public need to be informed about the enormous damage that in-use vehicles with manipulated ECSs cause to the environment and human health, in order to prevent such actions.
1. Introduction
With the entry into force of Directives 91/441/EEC and 93/59/EEC on the approximation of the laws of the Member States relating to measures to be taken against air pollution by emissions from motor vehicles, the era of limiting emissions of nitrogen oxides (NOX) from passenger cars (PCs) has begun in the European Union (EU). One widely accepted technique to reduce NOX emissions in diesel engines is exhaust gas recirculation (EGR) [1]. The application of non-cooled EGR started in some Euro 1 light-duty vehicles (LDVs), becoming the primary NOX reduction strategy in nearly all Euro 2 LDVs. Cooled EGR was implemented in some Euro 3 larger-engine LDVs, becoming the standard in Euro 4 and later diesel vehicles. Since 2014, the Euro 6 emission standard has been in force. The installation of two EGR loops, high-pressure (HP) and low-pressure (LP), has become the standard in Euro 6 diesel vehicles. HP EGR is used at lower engine speeds and loads, while at higher engine loads and speeds, LP EGR is applied. Another NOX reduction technique applied to a wide range of Euro 6 diesel LDVs is the lean NOX trap (LNT), also known as the NOX adsorber [2]. A more recent technique for reducing NOX emissions that is applied to Euro 6 larger-size engine vehicles is selective catalytic reduction (SCR) with urea, also known as diesel exhaust fluid (DEF) [3]. Combining 10–20% EGR with the SCR system gives the best results in NOX reduction [4]. This way, vehicles equipped with EGR and SCR can meet even the strictest requirements of the NOX emission limit values of the Euro 6 emission standard.
Despite all the mentioned NOX reduction techniques, some manufacturers have cheated on emission tests at type approval by installing illegal software, also known as a “defeat device”, that could detect when the vehicle was being tested, changing its performance accordingly to improve its NOX emission values [5]. Not long after the “Dieselgate” scandal was published, the requirements for measuring emissions at type approval became stricter. Since September 2017, for measurements of emissions at type approval, the longer-lasting and more dynamic Worldwide Light-duty Test Procedure (WLTP) has begun replacing the New European Driving Cycle (NEDC), which was used for many years until then [6,7,8]. In addition to laboratory measurements, measurements of particle number (PN) and NOX emissions in real driving conditions, the so-called real driving emissions (RDE), were introduced [9,10]. Such measurements are performed with a portable emissions measurement system (PEMS) [11,12].
In principle, two approaches are used to estimate emissions from road transport: top–down and bottom–up. While the bottom–up approach begins from the local data or the specific emission source, the top–down approach starts from values of annual emissions assessed at a national level [13,14]. Official emission models used by European countries are COPERT, HBEFA, VERSIT+, EMV, and Liipasto. COPERT (Computer program to calculate emissions from road transport) is the EU standard vehicle emissions calculator, which is also globally adopted. It uses vehicle population, mileage, speed, and other data such as ambient conditions and calculates the emissions and energy consumption for a specific country or region [15,16,17,18,19]. Research on newer Euro 6 PCs conducted in the 2014–2016 period shows that NOX emission factors (EFs) were twice the EFs used in emission models [20]. Because of those mentioned above, existing models for estimating emissions from road transport are constantly being upgraded, which is why they relatively well estimate the emissions from newer vehicles [21]. However, such models are mostly upgraded due to the entry of new vehicles on the market and the new technologies applied to such vehicles. In contrast, the models are not updated as a rule for older vehicles. The trend of increasing the age of vehicles in Europe has been ongoing since 2007, and it is known that vehicle emissions worsen with vehicle age [22,23].
In addition to older vehicles, newer vehicles are also subject to the deterioration and failure of emission control systems (ECSs) [24,25]. Diesel vehicles are more prone to breakdowns, especially if they are mainly used in urban traffic. Due to their high maintenance and replacement costs, such systems are often subject to illegal activities, i.e., tampering, such as physical removal or disruption, software deactivation, etc. [26,27]. The most common manipulations in diesel PCs and LCVs are on the EGR valve, diesel particulate filter (DPF), NOX sensor, SCR, and DEF dosing system, etc. [28,29]. Previous studies have shown that tampering with ECSs significantly increases pollutant emissions, especially for NOX and PN [30,31,32]. It is well known that the emissions mentioned above are very harmful to human health and the environment [33,34,35,36]. Because of that, harmful emissions are limited by legislation.
Manipulations of the ECSs of in-use vehicles are still a taboo subject that has not been sufficiently addressed by science and legislation. The motivation for conducting this research stems from the increasing number of services offered by car repair shops through online advertisements, including ECU remap, chip tuning, EGR OFF, DPF OFF, and DEF OFF, etc. Due to limited technical capabilities, the existing emission analysers in periodic technical inspection (PTI) stations cannot be used to detect tampering with the ECSs during the tailpipe emission test [37]. Even with the help of onboard diagnostics (OBD), it is difficult to determine whether ECSs have been tampered with [38]. In this way, many manipulated vehicles pass the emissions test without the disclosure of significant technical defects. Although the number of studies investigating the effects of manipulation on vehicle ECSs has increased in recent years, the question of quantifying such vehicles on the road and modelling their emissions remains topical. The contribution of manipulated vehicles to emissions at the fleet level remains unknown. The lack of such studies opens up space for new research. By measuring the emissions of manipulated vehicles under real driving conditions on the road, it is possible to create models that offer a more accurate assessment of the emissions of such vehicles. This work aimed to investigate the influence of manipulations of the EGR valve and DEF dosing system on the NOX emissions of Euro 6 diesel PCs and, based on the PEMS measurements, to estimate the emissions of manipulated vehicles. However, to apply the emission results to the targeted part of the vehicle fleet, it is first necessary to know the structure of the vehicle fleet, which, for the Republic of Croatia, has been monitored in detail at the individual vehicle level since 2008 [39].
Furthermore, questions arise of how high the share of manipulated vehicles in the targeted vehicle fleet is and how much these vehicles contribute to the fleet’s emissions increase. As ECS manipulations are not legal, there are no available data on the number of vehicles with manipulated ECSs at the level of an individual country. To estimate emissions inventories, some studies, among other sources, use the results of surveys conducted on respondents who are directly involved in creating harmful emissions [40,41]. This study aimed to estimate the share of manipulated vehicles in the vehicle fleet as accurately as possible so the calculation of NOX emissions can be as realistic as possible. For this purpose, an anonymous survey was conducted among PC owners. The survey’s main objective was to quantify car users’ habits and preferences towards ECS manipulations. In a sample of 2000 respondents—owners of a PC with an internal combustion engine (ICE)—209 (or 10.45%) had carried out certain manipulations on the ECSs.
This paper proposes a novel approach to estimate the real driving emissions of vehicles with manipulated ECSs. This study is based on the Tier 3 methodology, where EFs depend on the average vehicle driving speed, as described in the EMEP/EEA air pollutant emission inventory guidebook [42]. Using the NOX EFs determined in this study and applying the bottom–up approach, the emissions of Euro 6 diesel PCs were estimated. These values were then compared with the official computer program COPERT 5 results. The main conclusions are that the emissions of the test vehicle with both the EGR and DEF systems manipulated exceeded the typical values by more than two orders of magnitude compared to the case where all ECSs were active. Applying the survey results and extending them to the targeted fleet, the NOX emissions of Euro 6 diesel PCs were calculated. The results showed that the hot emissions were up to 46.3% higher than those calculated by the official computer program COPERT 5, with a tendency towards significantly higher values. The innovation of this article is the quantification of the real NOX emissions of the targeted vehicle fleet, primarily considering the impact of high-polluting vehicles—those with manipulated ECSs. This research was necessary to show where significant amounts of “hidden” NOX emissions from road transport come from and to encourage policymakers to develop methods to prevent such manipulations. The results of this study are of great importance for vehicle manufacturers and policymakers, but also for the general public, to raise awareness and stimulate action to prevent the tremendous damage that vehicles with manipulated ECSs cause to the environment and human health. Based on additional measurements, it is planned to create a model for calculating the emissions of manipulated vehicles.
2. Materials and Methods
2.1. Measurement Equipment and Test Vehicle
The measurements were carried out with the equipment owned by the National Reference Laboratory for Emissions from Internal Combustion Engines for Non-Road Mobile Machinery from the Faculty of Mechanical Engineering and Naval Architecture of the University of Zagreb. The technical data of the measuring equipment used are listed in Table 1.

Table 1.
Technical data of the measuring equipment.
The measurements were carried out on a company minivan with known technical data, PTI results, and regular maintenance activities. The technical data of the vehicle can be found in Table 2.
Table 2.
Technical data of the test vehicle.
For safety reasons, the test vehicle had a yellow warning system on the roof and an additional bracket for the rear registration plate and lighting equipment. The test vehicle with installed measuring equipment is shown in Figure 1.
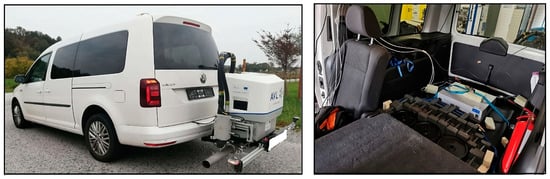
Figure 1.
Test vehicle with installed measuring equipment.
2.2. Measurement Procedure
Before the NOX emission measurement started, preparatory measures were carried out according to the instructions of the test equipment manufacturer, including a pre-test procedure following Commission Regulation (EU) 2018/1832 to improve the emission type approval tests and procedures for light passenger and commercial vehicles, including those for in-service conformity and real-driving emissions. Immediately, the engine and exhaust system components were warmed to normal operating temperature (coolant temperature ≈ 90 °C). After that followed the main test—constant speed and then RDE. During the RDE run, all driving requirements met the Commission Regulation (EU) 2018/1832 criteria. After each measurement, a post-test activity was also carried out following the abovementioned regulation.
Cold-start emissions are excluded from all measurements, and only hot emissions are observed to simplify and speed up the test procedures. Therefore, the measurement results are not comparable with the type approval values, as they include the cold-start phase. Tests in which the DPF regeneration was identified were not considered. All measurements were carried out in the second half of September and the first half of October 2022 at an ambient temperature between 10 and 25 °C to minimise the effects of this parameter. All tests were conducted during calm weather conditions to prevent extra wind resistance to the test vehicle. The appearance of additional rolling resistance was prevented so that tyres were inflated depending on the vehicle’s load to the pressure prescribed by the manufacturer. During the RDE measurements, slope resistances through an elevation change were kept far below the limits of Commission Regulation (EU) 2018/1832.
NOX concentration was measured by non-dispersive ultraviolet spectroscopy (NDUV) and reported in parts per million (ppm). The NO and NO2 emission analyser display resolution was 0.1 ppm. The accuracy of the analyser was ±0.2% of full scale or ±2% rel. The mass flow rate of the exhaust gases was measured with a flow meter and is expressed in kilograms per hour (kg/h). The accuracy of the exhaust gas flow meter was ±2.0% of a reading or ±0.5% of full scale, whichever was greater. Vehicle speed (v) was measured with the Garmin GPS device and is expressed in kilometres per hour (km/h). With the above-known data—NOX concentration, NOX mass flow rate, and vehicle speed—the averaged NOX EFs were calculated, as shown in Equation (1) below.
where:
= NOX EF, related to the driving cycle (mg/km);
= NOX mass flow rate (mg/s);
= mean value of the NOX mass flow rate per driving cycle (mg/s);
= NOX concentration (ppm);
EMF = exhaust mass flow rate (mg/s);
t = run time (s);
d = distance of the driving cycle (km).
2.3. Measurement Sequence
The first set of NOX emission measurements was carried out on a vehicle with its ECSs activated, corresponding to the condition in which the vehicle was type-approved by the manufacturer. Before each further measurement, the vehicle was taken to an authorised Volkswagen workshop, where the individual ECSs were deactivated. Before the second series of measurements was carried out, the HP EGR was deactivated. For the third series of measurements, the LP EGR was deactivated. During the fourth series of measurements, the DEF injector was deactivated. The fifth set of measurements was performed on a vehicle with the HP EGR and the DEF injector deactivated. The sixth set of measurements was performed on a vehicle with the LP EGR OFF and DEF OFF. The seventh set of measurements was carried out on a vehicle with the HP EGR OFF, LP EGR OFF, and DEF OFF. The flowchart of the experiment is shown in Figure 2.
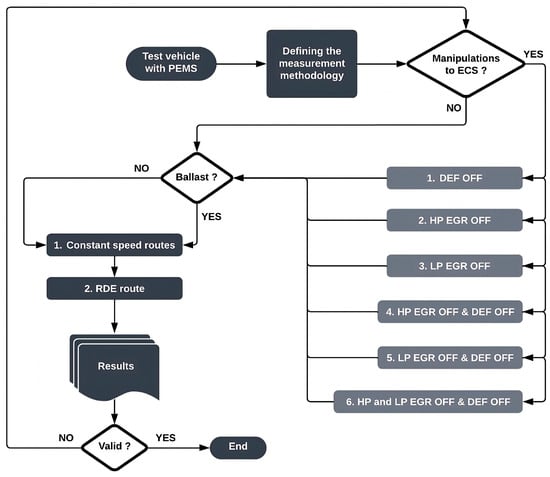
Figure 2.
The flowchart of the experiment.
Each set of NOX emission measurements included runs at constant speeds from 10 km/h to 140 km/h with a 10 km/h step under approximately steady-state engine operating conditions and runs under transient engine operating conditions, each with the vehicle mass in running order (MIRO) increased by the weight of the driver, an additional passenger, and the measurement equipment. The ballast was additionally used in two measurement series to determine the influence of the vehicle mass on emissions. The ballast increased the vehicle mass to the gross vehicle weight rating (GVWR).
2.3.1. Constant-Speed Runs
The runs in different selected gears, at constant speeds of 10 to 80 km/h, lasted 60 s and were carried out on a 2 km test track, while the runs at constant speeds of 90 to 140 km/h lasted 120 s and were carried out on a not frequently used motorway section with moderate gradients. The gear ratios and engine speeds for various constant driving speeds are given in Table 3.
Table 3.
Engine and transmission data of the vehicle, relevant for different constant driving speeds.
2.3.2. RDE Trip
The transient engine operating conditions were fulfilled on the RDE route, which included the city of Zagreb and the surrounding area. The route length was 86 km, and the average travel time was 108 min. The RDE trips were divided into urban (U), rural (R), and motorway (M) segments. Accordingly, the average driving speeds and emission factors were calculated for each RDE driving segment.
2.4. Calculation Method Proposal
The Tier 3 methodology, where EFs depend on the average vehicle driving speed, as described in the EMEP/EEA air pollutant emission inventory guidebook, was used to estimate the real driving emissions of vehicles with manipulated ECSs. Since all measurements were taken when the engine and exhaust aftertreatment devices were heated to normal operating temperature, only the hot emissions were measured and included in this calculation.
A proposal for a general formula for determining the NOX EFs of vehicles with deactivated ECS is shown below, Equation (2).
where:
= NOX EF speed-dependent function for a vehicle with deactivated ECSs of type i (mg/km);
= NOX EF speed-dependent function for a vehicle with activated ECSs (mg/km);
= speed-dependent function of increased emissions due to manipulation of ECS of type i (mg/km).
3. Results
This section contains the results of the emission measurements for seven different working regimes of the ECSs, as described in the measurement sequence section and shown in Figure 2. Based on the processed measurement results in Section 3.1, Section 3.2, Section 3.3, Section 3.4, Section 3.5, Section 3.6, and Section 3.7, the relevant Euro emission standard for the test vehicle was determined following the COPERT nomenclature in Section 3.8, and the NOX emissions calculation for Euro 6 diesel vehicles with manipulated ECSs was proposed in Section 3.9. Based on an anonymous survey conducted among vehicle owners, the proportion of manipulated PCs in the Republic of Croatia was determined in Section 3.10. Considering the emission measurement results and the survey results, the NOX emission inventory of the Euro 6 diesel PC fleet was assessed in six scenarios in Section 3.11.
3.1. Measurements with All ECSs Activated
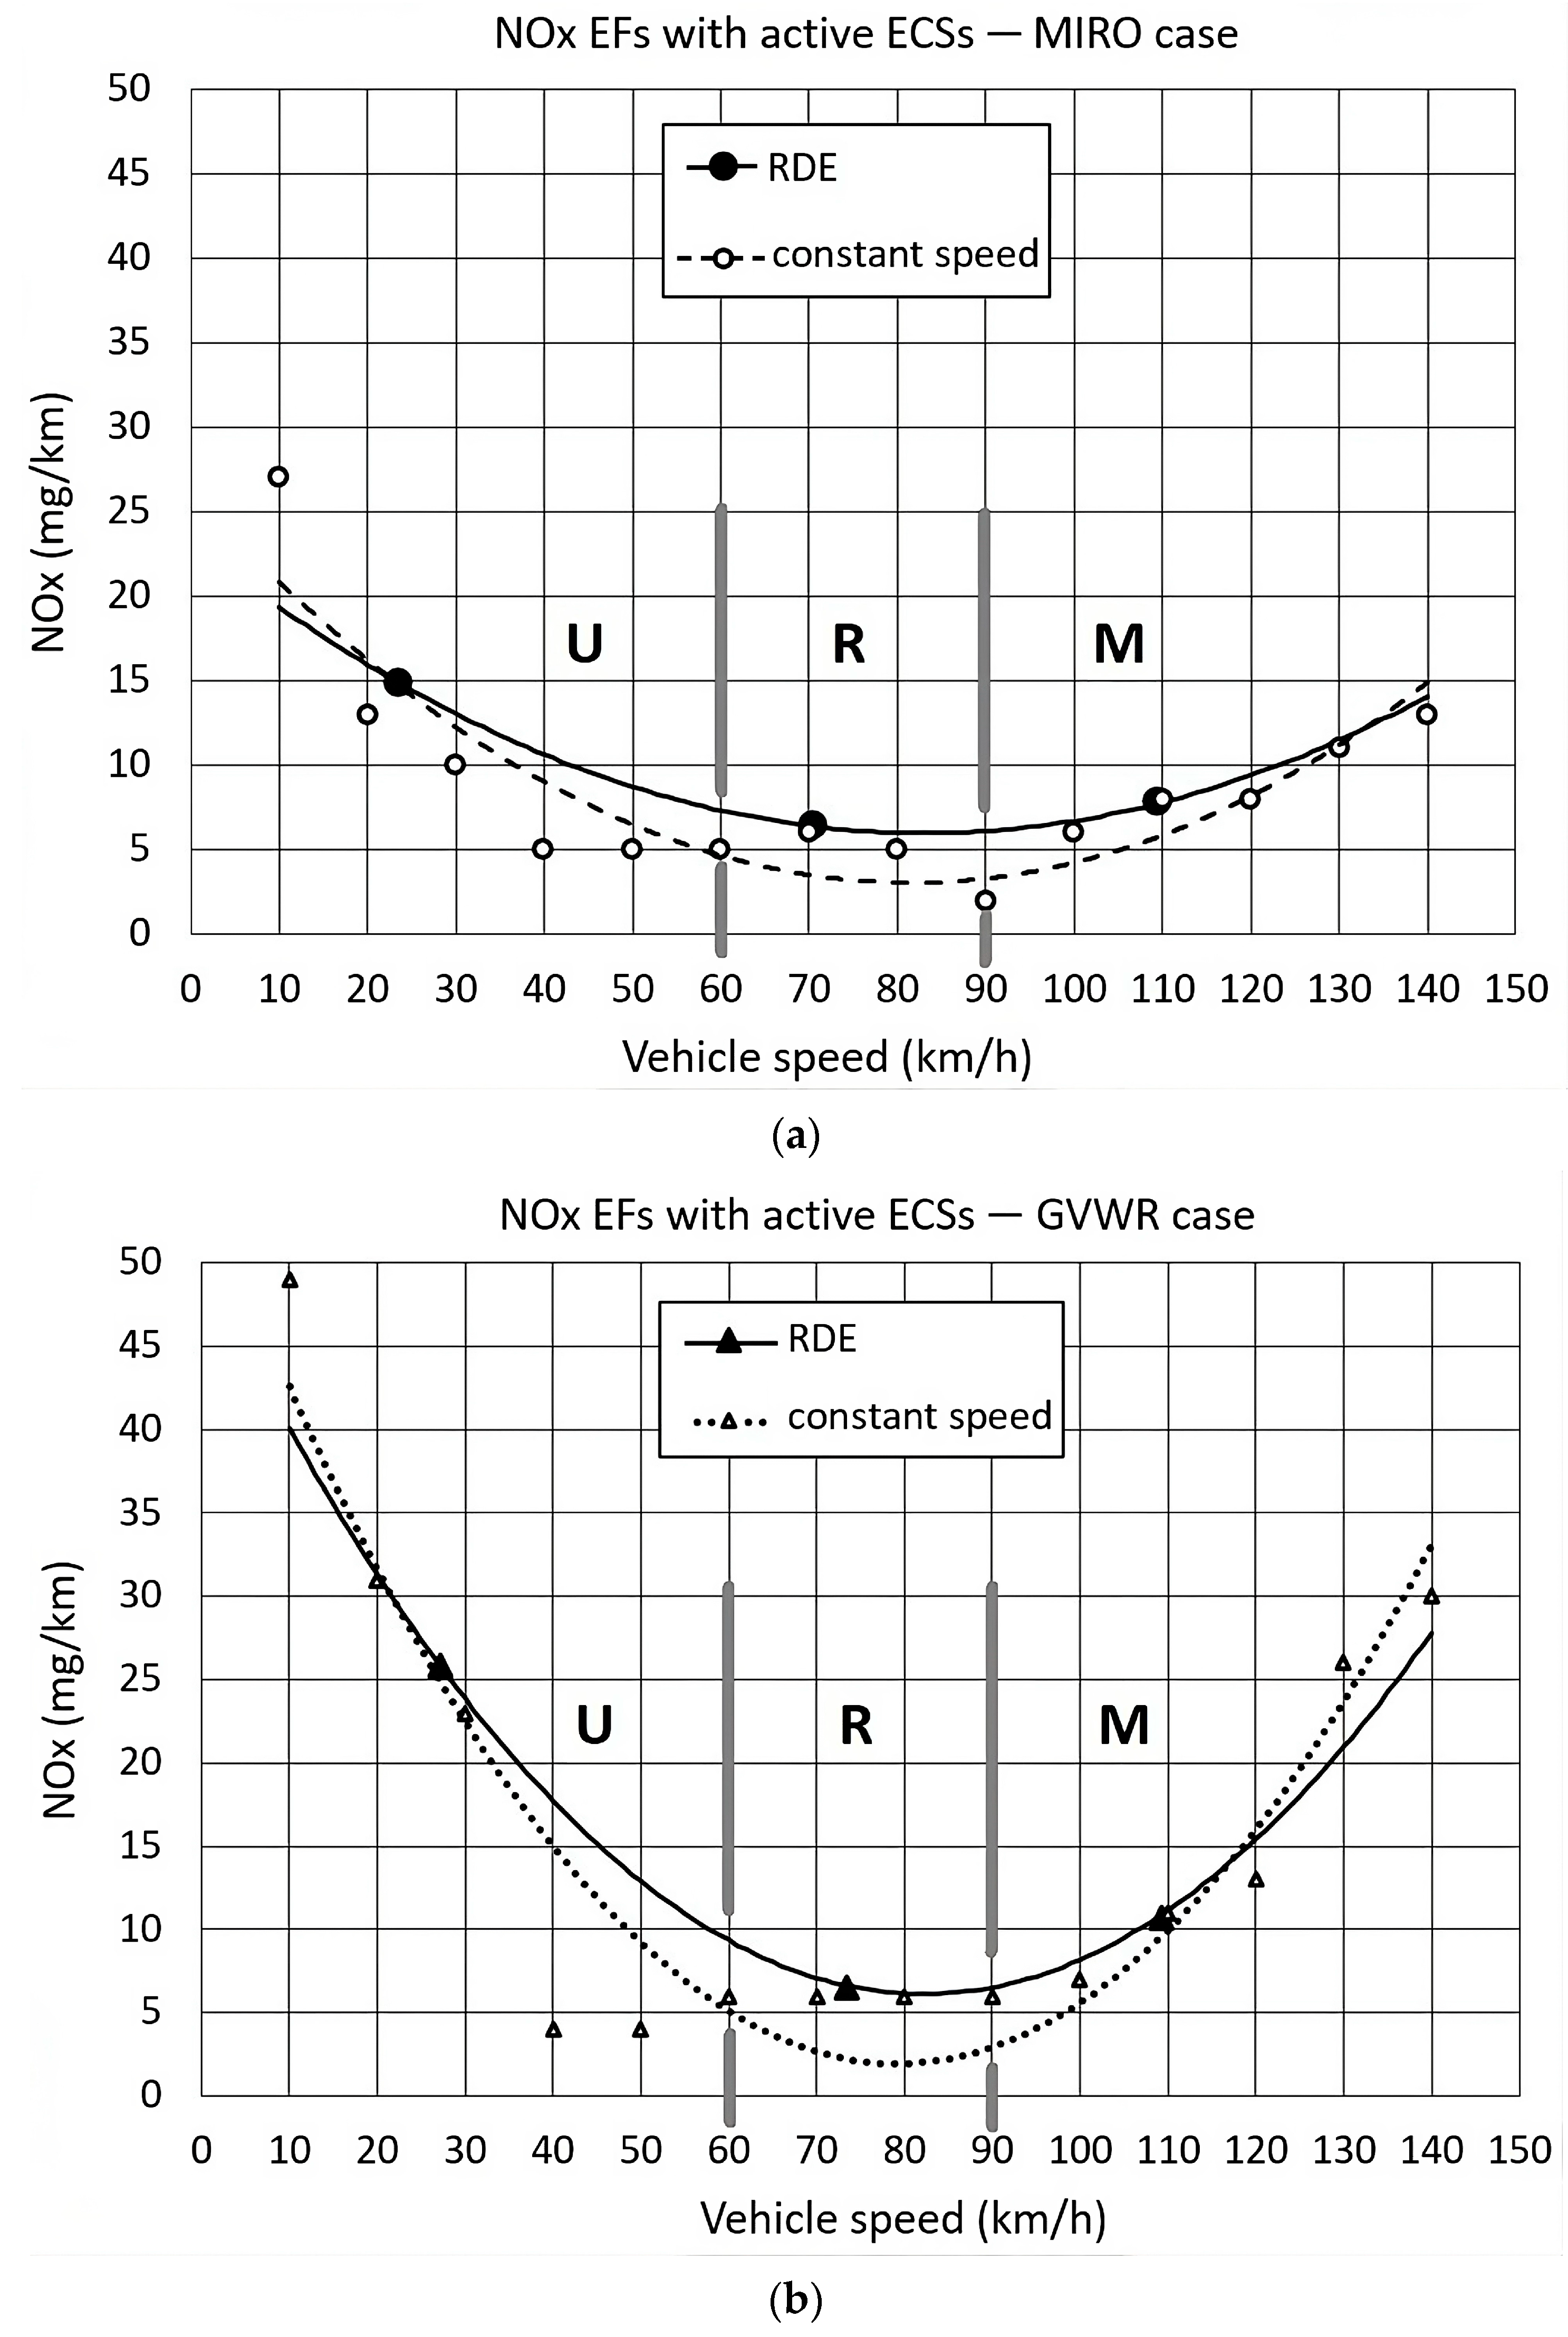
The NOX emissions of the test vehicle with activated ECSs had to be determined first. The vehicle emissions were considered for the case of MIRO and GVWR for driving at a constant speed and RDE driving, as shown in Figure 3.
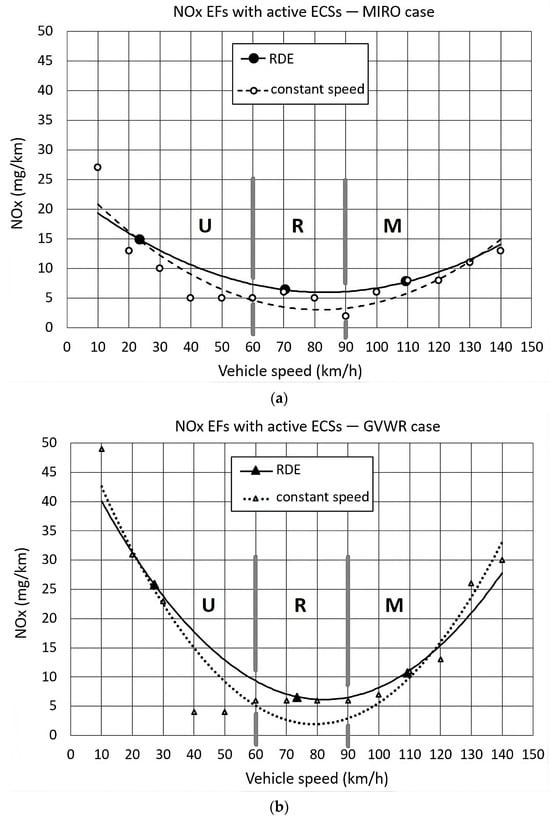
Figure 3.
NOX EFs with active ECSs for the case of MIRO (a) and GVWR (b).
For the case of MIRO at a constant speed, when all ECSs were activated, the function NOX EF fits the measured data based on a quadratic regression model with a coefficient of determination R2 = 0.81. A slightly higher data agreement was achieved in the case of GVWR at a constant speed (R2 = 0.90). For the RDE trips, all measurement results where the driving speed was below 60 km/h were assigned to the urban part (U), those between 60 and 90 km/h to the rural part (R), and those above 90 km/h to the motorway part (M). Essential data such as trip distance, trip duration, average vehicle speed, and NOX EFs were calculated for the U/R/M sections and are shown in Table 4.
Table 4.
RDE trip results for the case where all ECSs were activated.
According to the results of the RDE test, an increase in vehicle mass of 300 kg led to an increase in emissions of 47% (total trip). The increase in emissions due to the increase in vehicle mass in the U/R/M section was 73%/0%/35%.
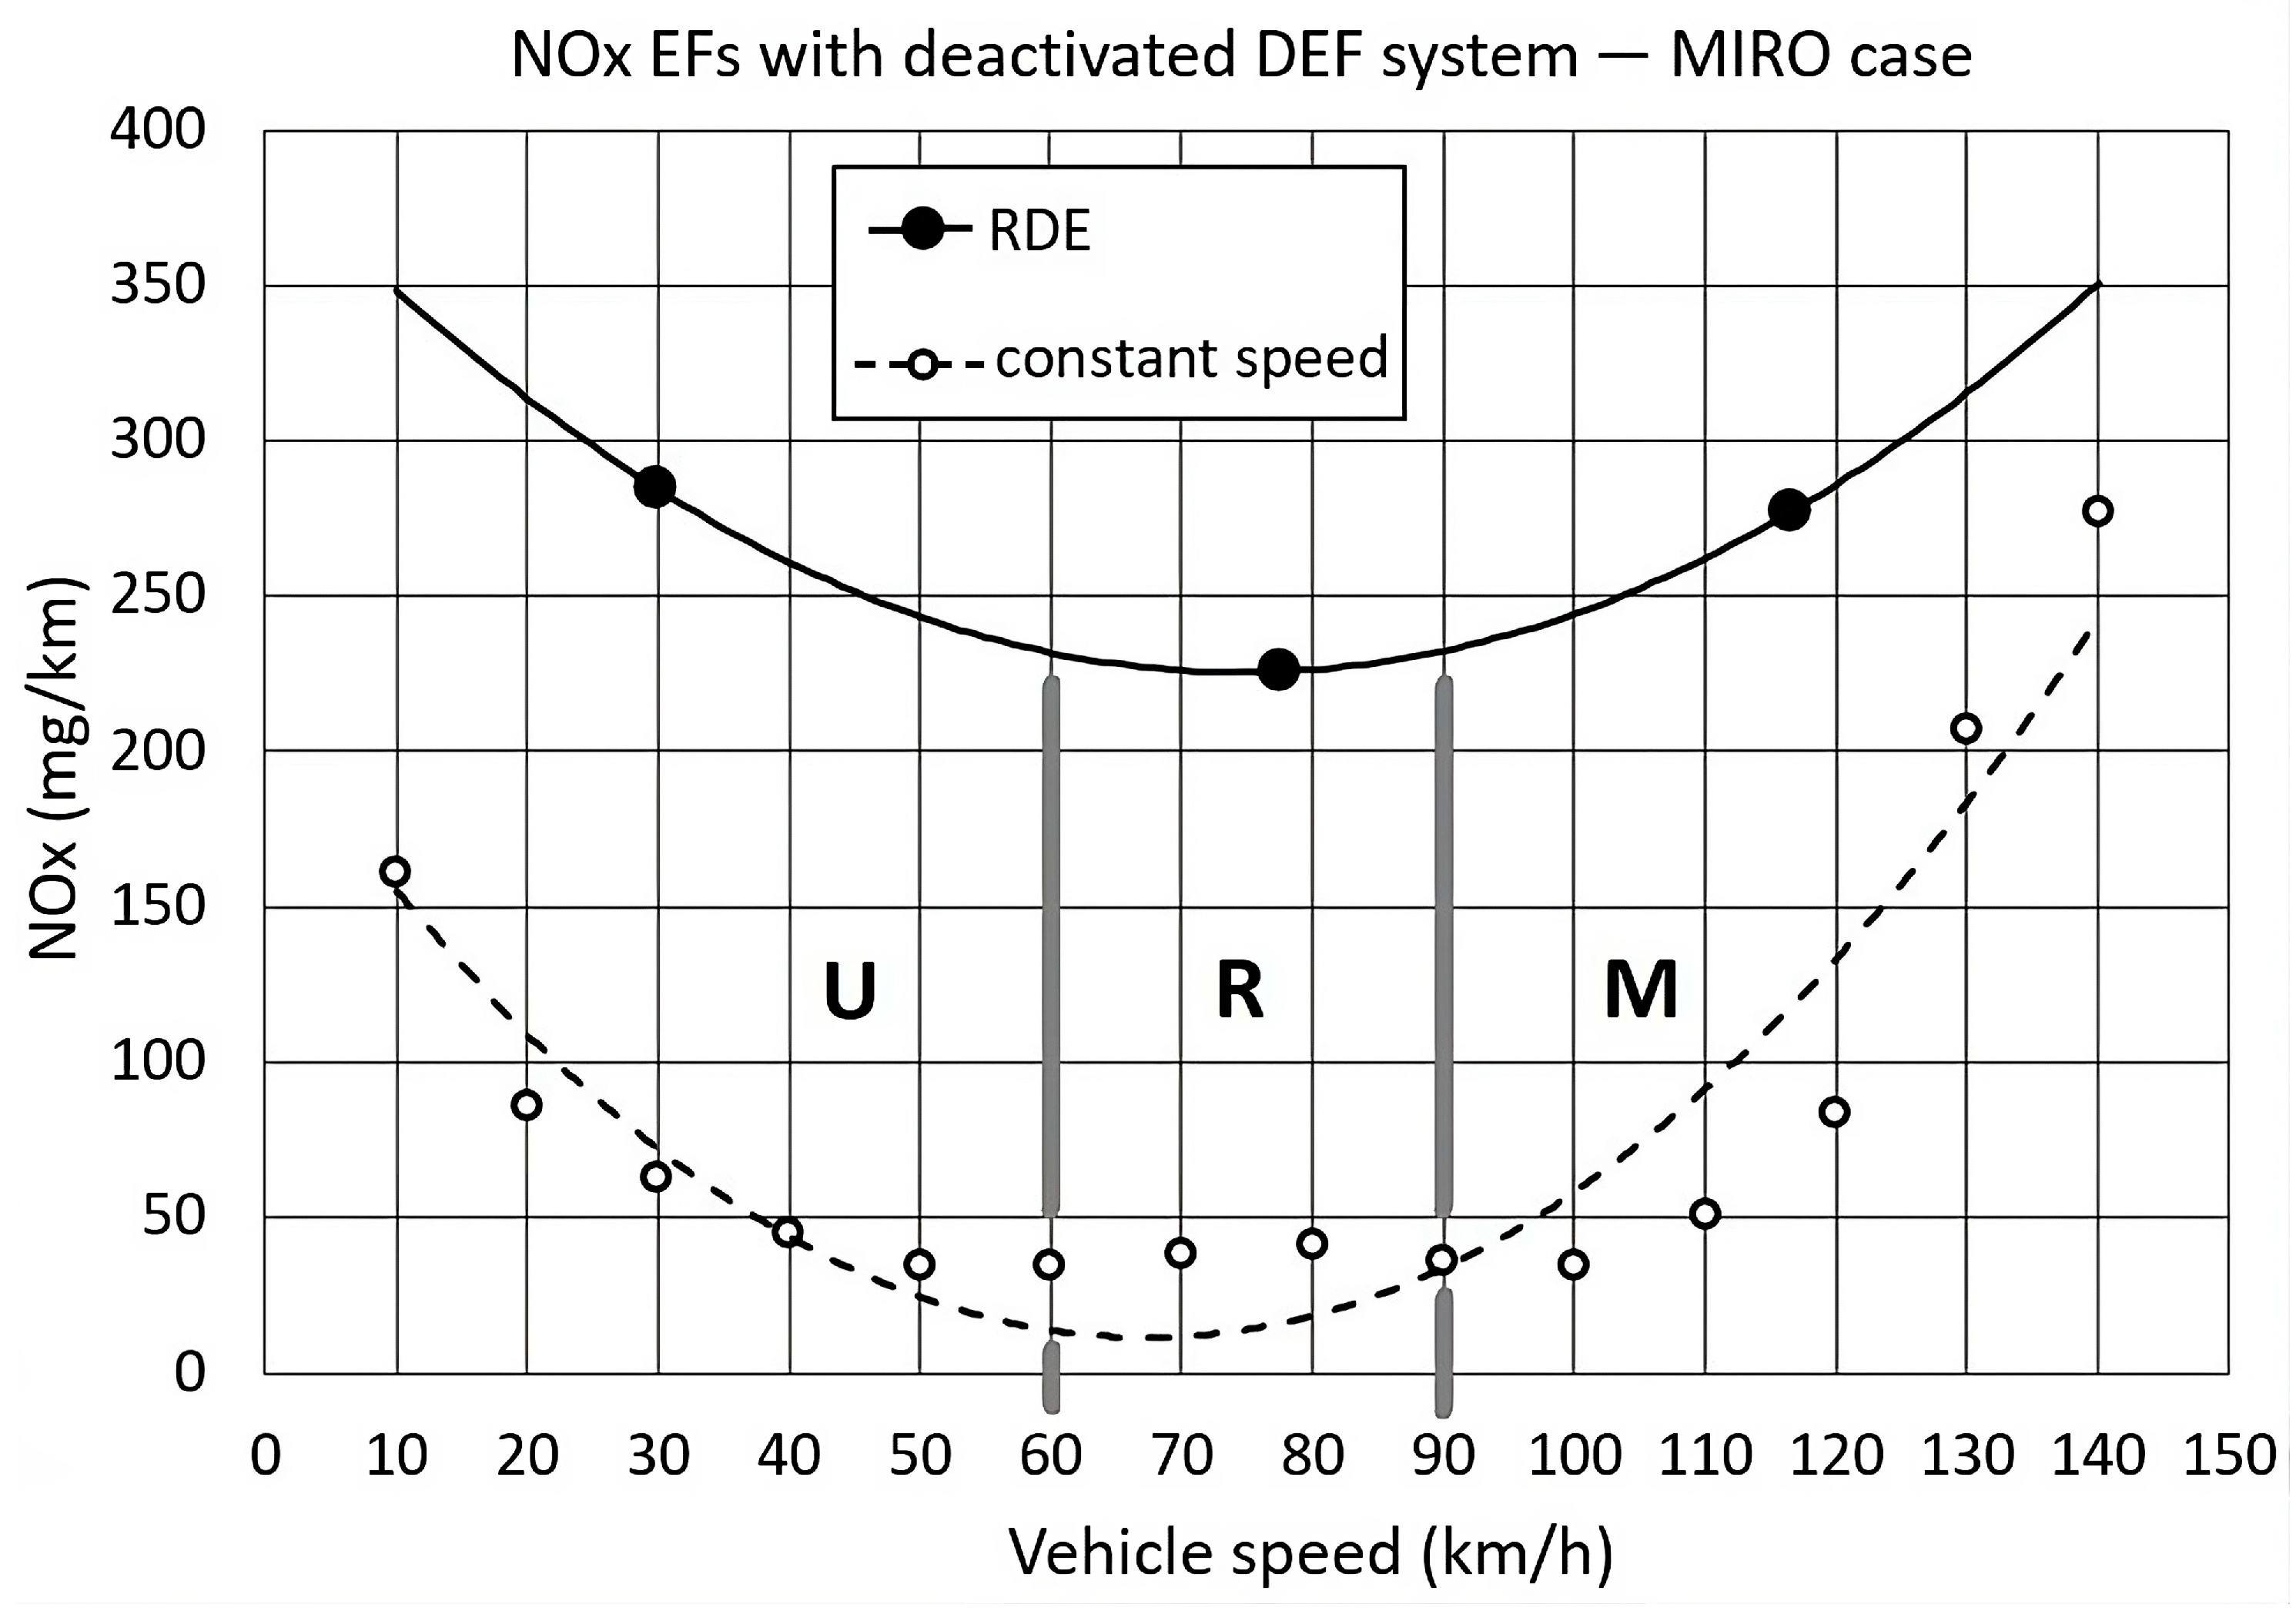
3.2. Measurements with the DEF System Deactivated
After unplugging the DEF module, a “Check Engine” light appeared on the dashboard with a warning message that the vehicle’s range was limited to 1000 km and the engine could not be started after that. The emissions of the test vehicle when the DEF system was deactivated are shown in Figure 4.
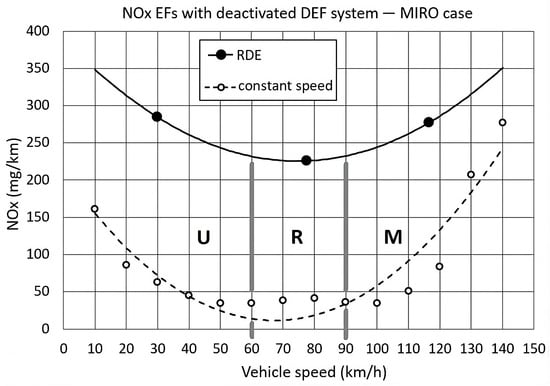
Figure 4.
NOX EFs with deactivated DEF system.
For the case of MIRO at a constant speed, when the DEF system was deactivated, the function NOX EF fits the measured data based on a quadratic regression model with a coefficient of determination R2 = 0.88.
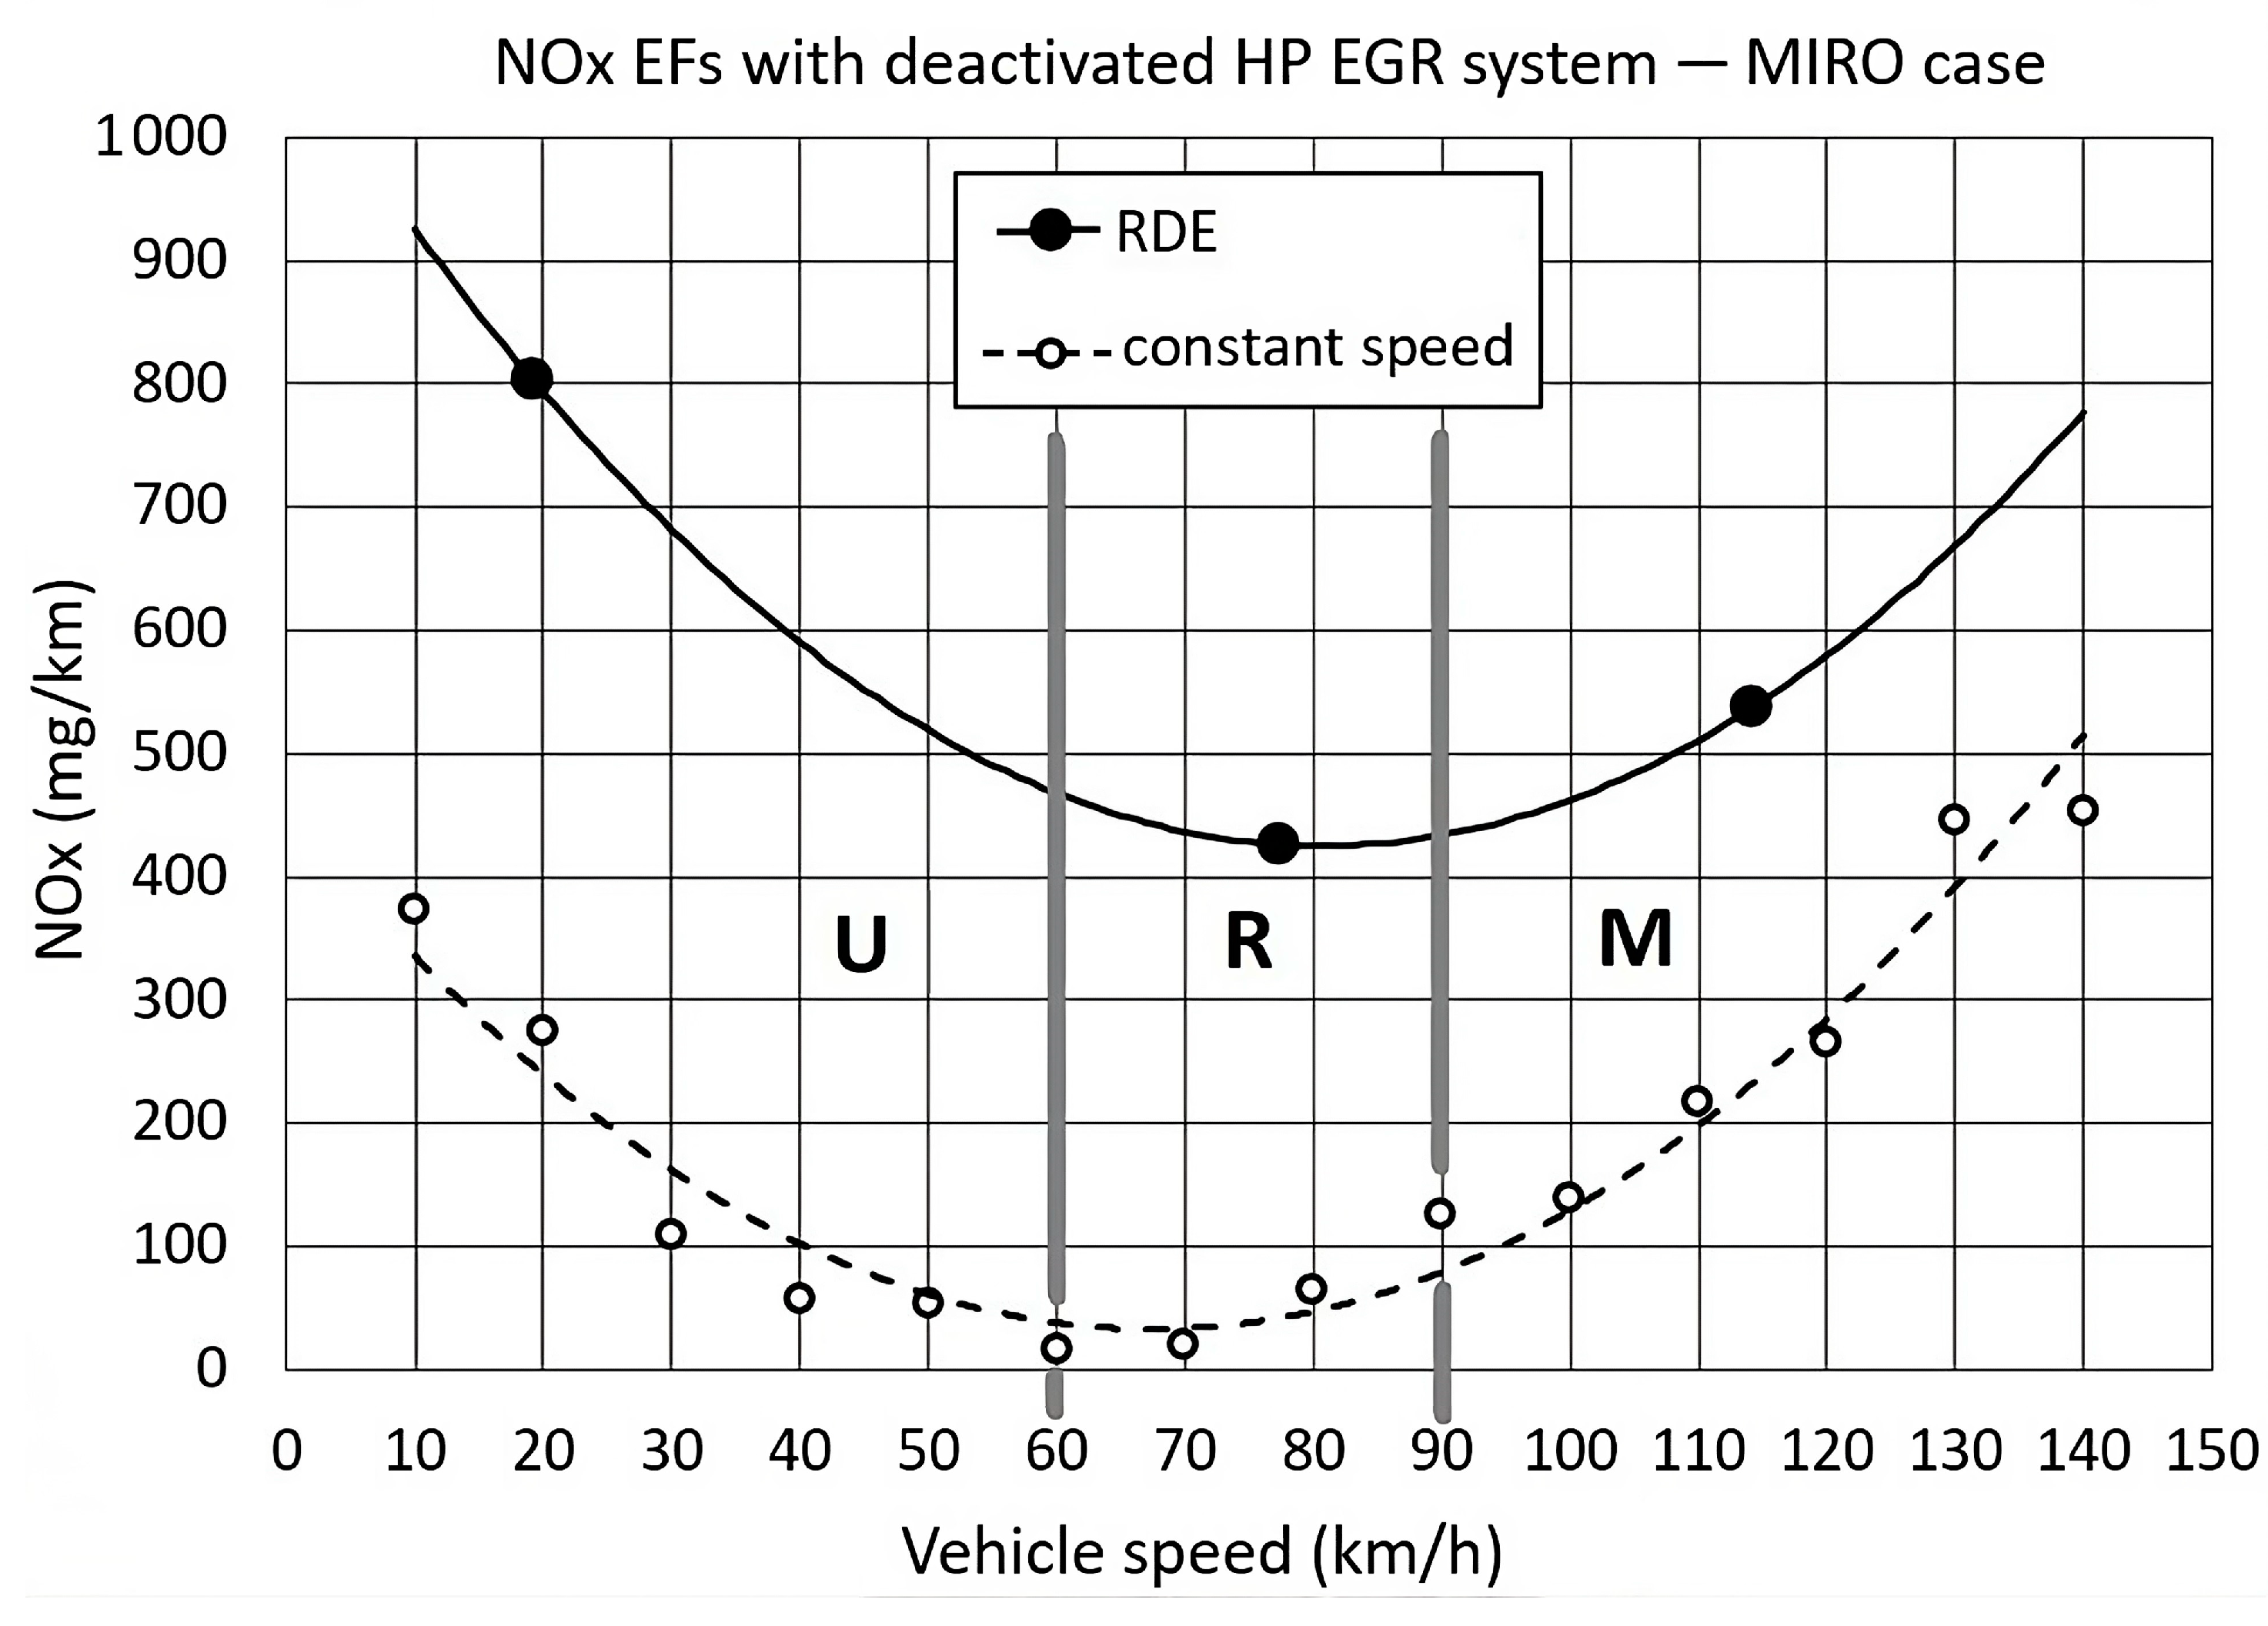
3.3. Measurements with the HP EGR Valve Deactivated
The HP EGR valve was deactivated by disconnecting the HP EGR valve connector, after which, a “Check Engine” light appeared on the dashboard. The emissions of the test vehicle after the deactivation of the HP EGR valve are shown in Figure 5.
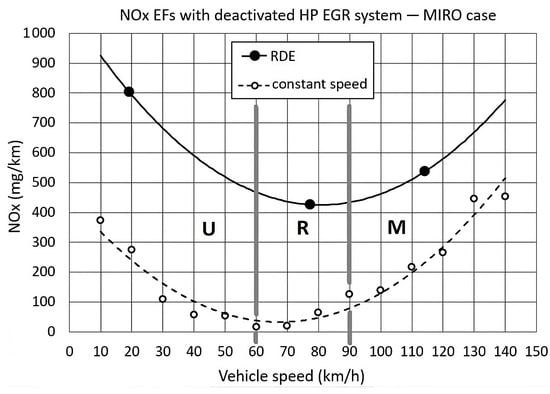
Figure 5.
NOX EFs with deactivated HP EGR valve.
For the case of MIRO at a constant speed, when the HP EGR valve was deactivated, the function NOX EF fits the measured data with a coefficient of determination R2 = 0.94.
3.4. Measurements with the LP EGR Valve Deactivated
Since the LP EGR valve is located in a hard-to-reach place on the vehicle, the LP EGR valve was deactivated by disconnecting the wires of the LP EGR valve from the engine control module. A “Check Engine” light then appeared on the dashboard. Diagnostic trouble codes relevant only to the LP EGR were found when the diagnostic tool check was performed. In other words, the other ECSs were functioning properly. The emissions of the test vehicle after turning off the LP EGR valve are shown in Figure 6.
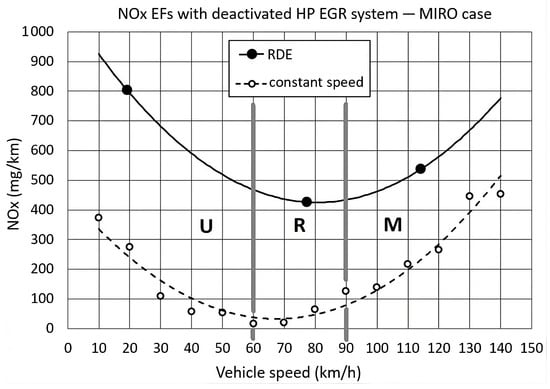
Figure 6.
NOX EFs with deactivated LP EGR valve.
For the case of MIRO at a constant speed, when the LP EGR valve was deactivated, the function NOX EF fits the measured data with a coefficient of determination R2 = 0.82.
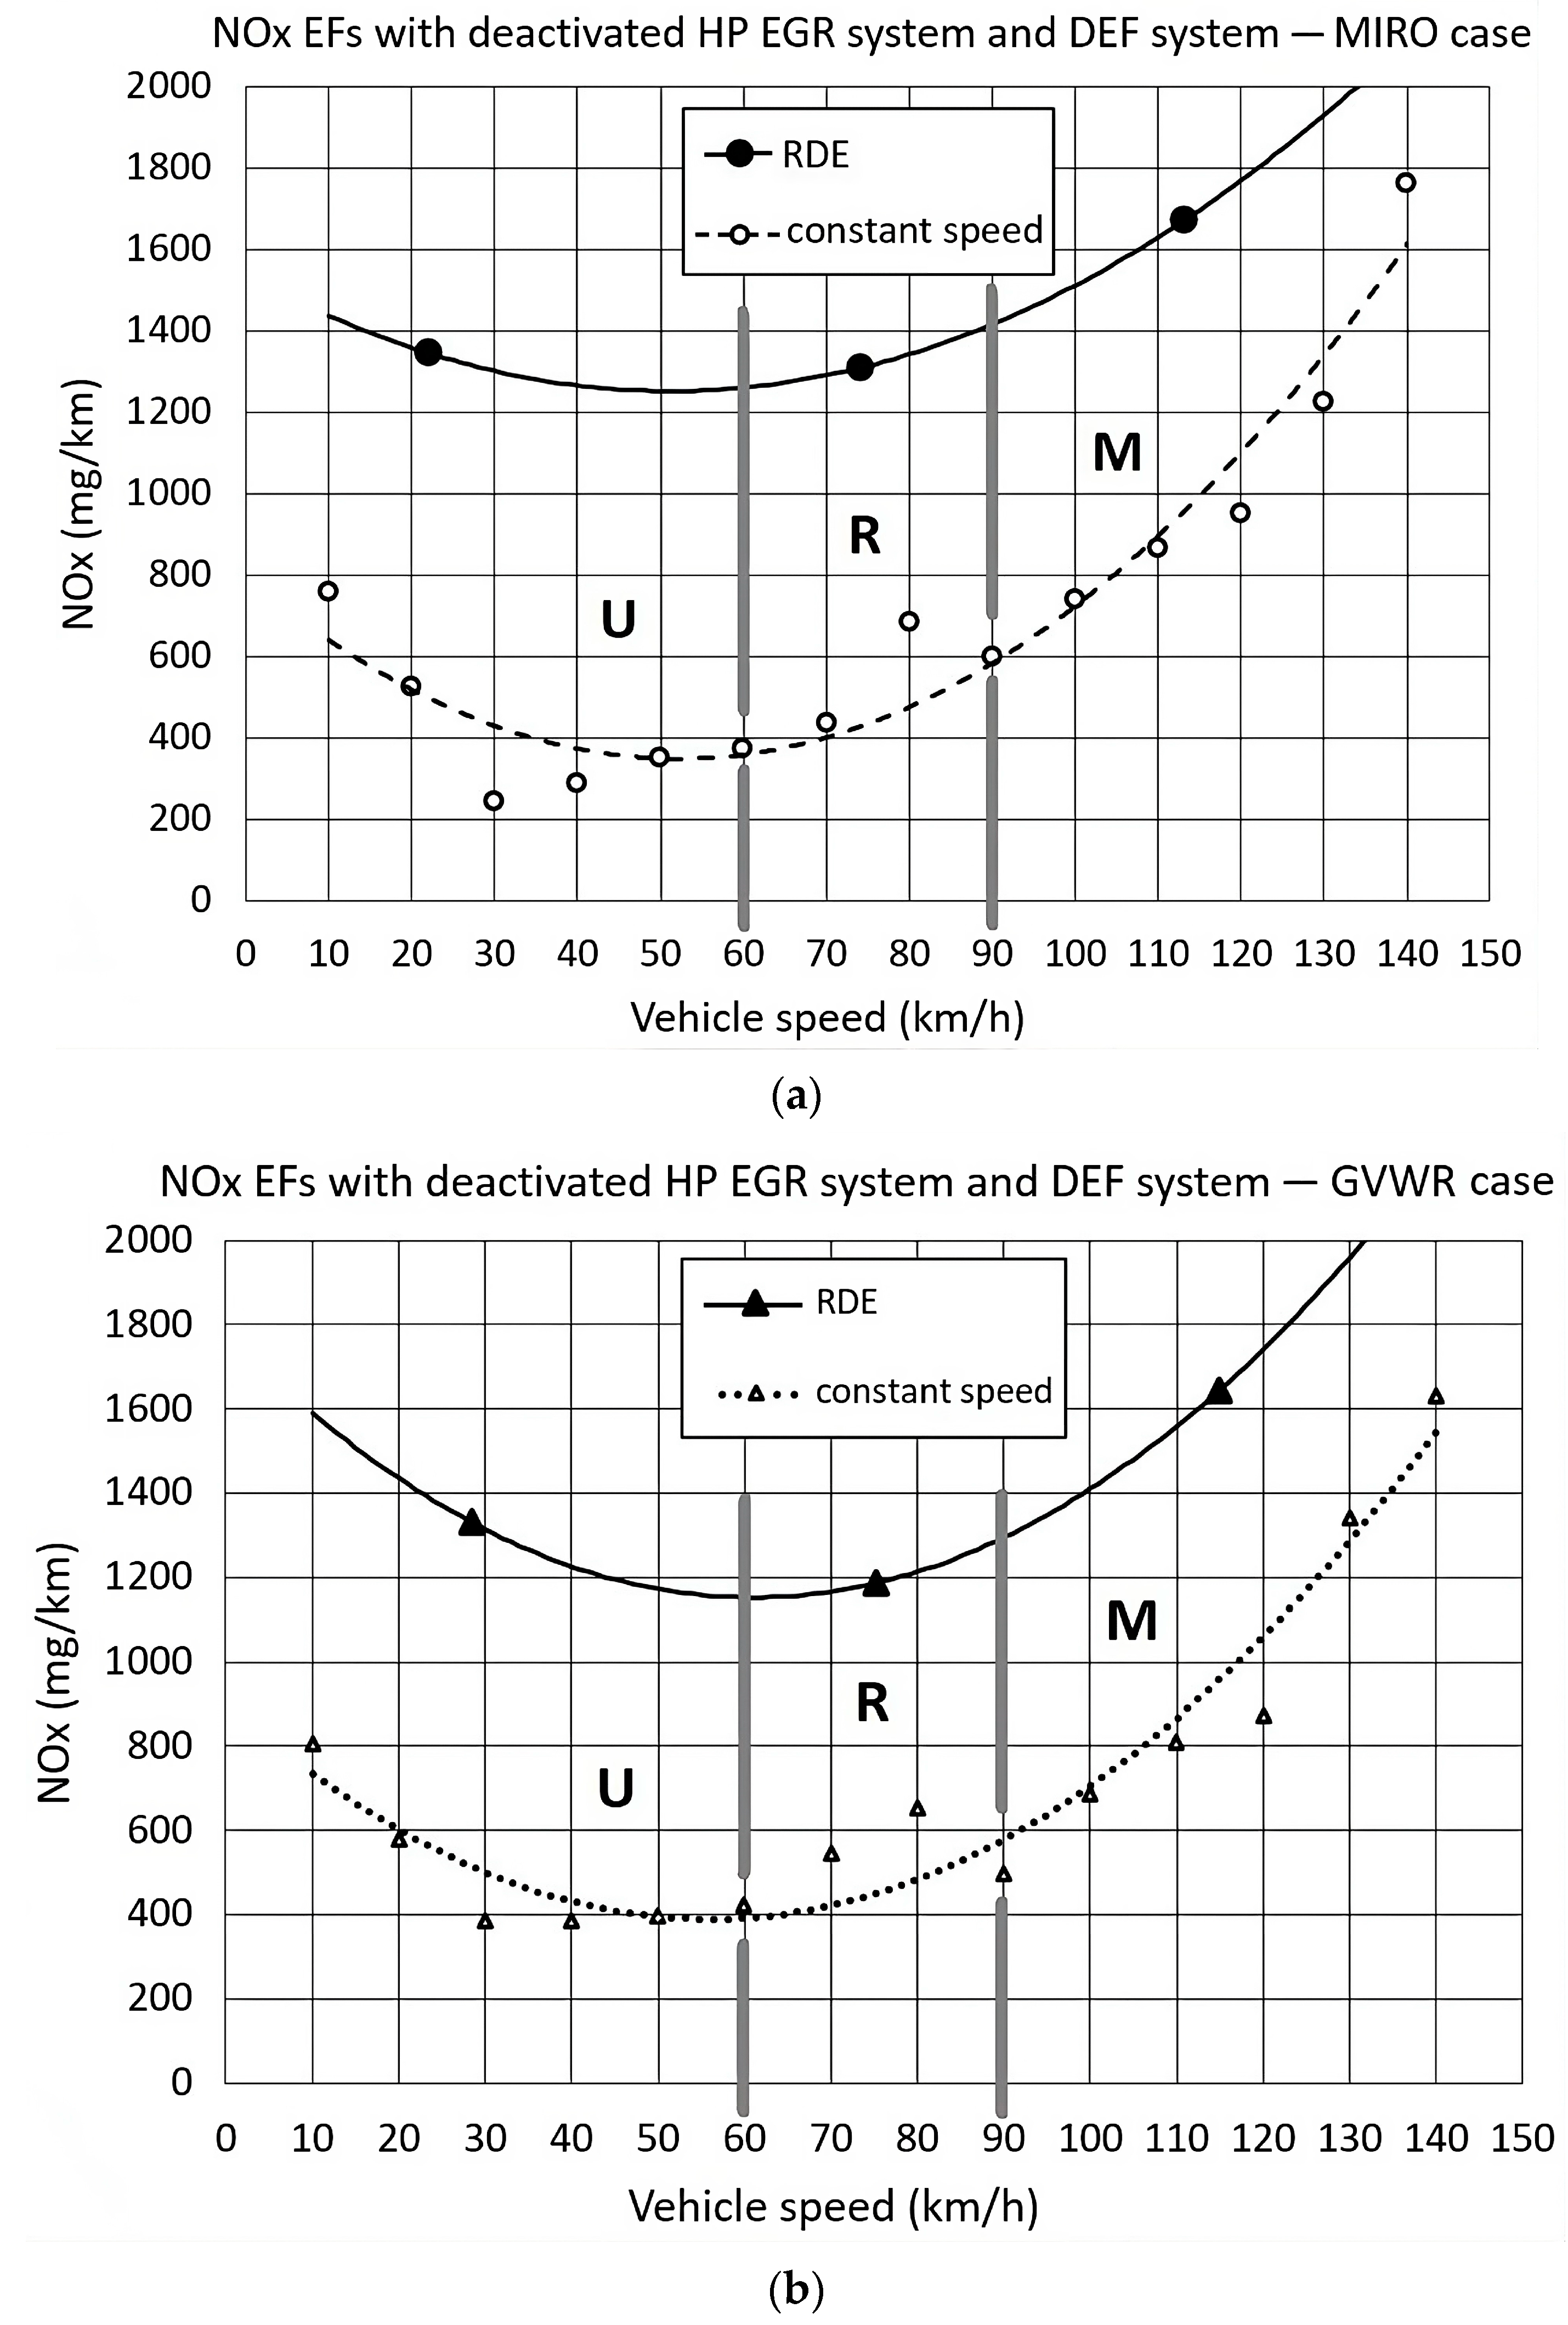
3.5. Measurements with Deactivated HP EGR Valve and DEF System
To determine the impact of manipulations on emissions when several ECSs were deactivated, a combination of deactivated HP EGR and DEF was first considered and tested, as shown in Figure 7.
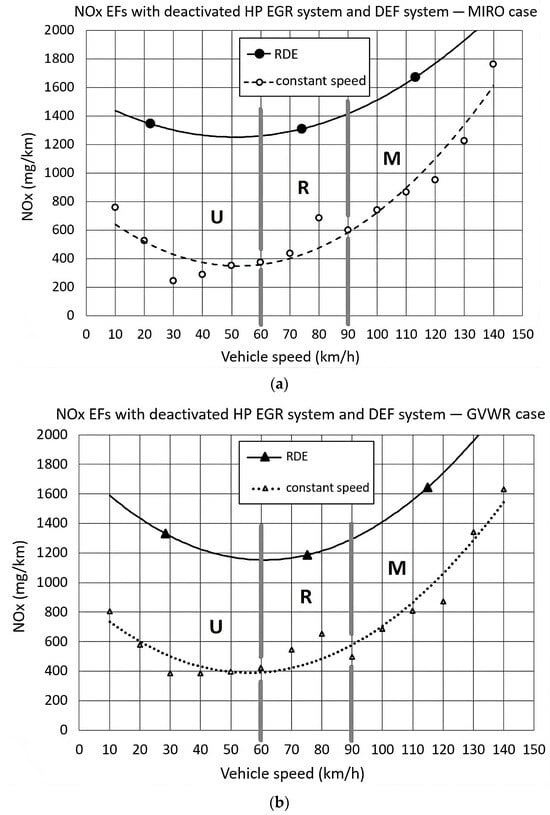
Figure 7.
NOX EFs with deactivated HP EGR valve and DEF system for the case of MIRO (a) and GVWR (b).
For the case of both MIRO and GVWR at a constant speed, when the HP EGR valve and DEF system were deactivated, the function NOX EF fits the measured data with a coefficient of determination R2 = 0.93. For the RDE trips, relevant data such as trip distance, trip duration, average vehicle speed, and NOX EFs were calculated for the U/R/M sections and are shown in Table 5.
Table 5.
RDE trip results for the case where the HP EGR valve and DEF system were deactivated.
According to the results of the RDE test with the HP EGR valve and the DEF system deactivated, increasing the vehicle mass by 300 kg did not affect emissions. Furthermore, emissions decreased by 3.6% on the overall route, while they decreased by 1.1%/9.5%/0.5% in the U/R/M sections. The main cause for this could be relatively lighter traffic conditions in the urban part of the RDE with GVWR.
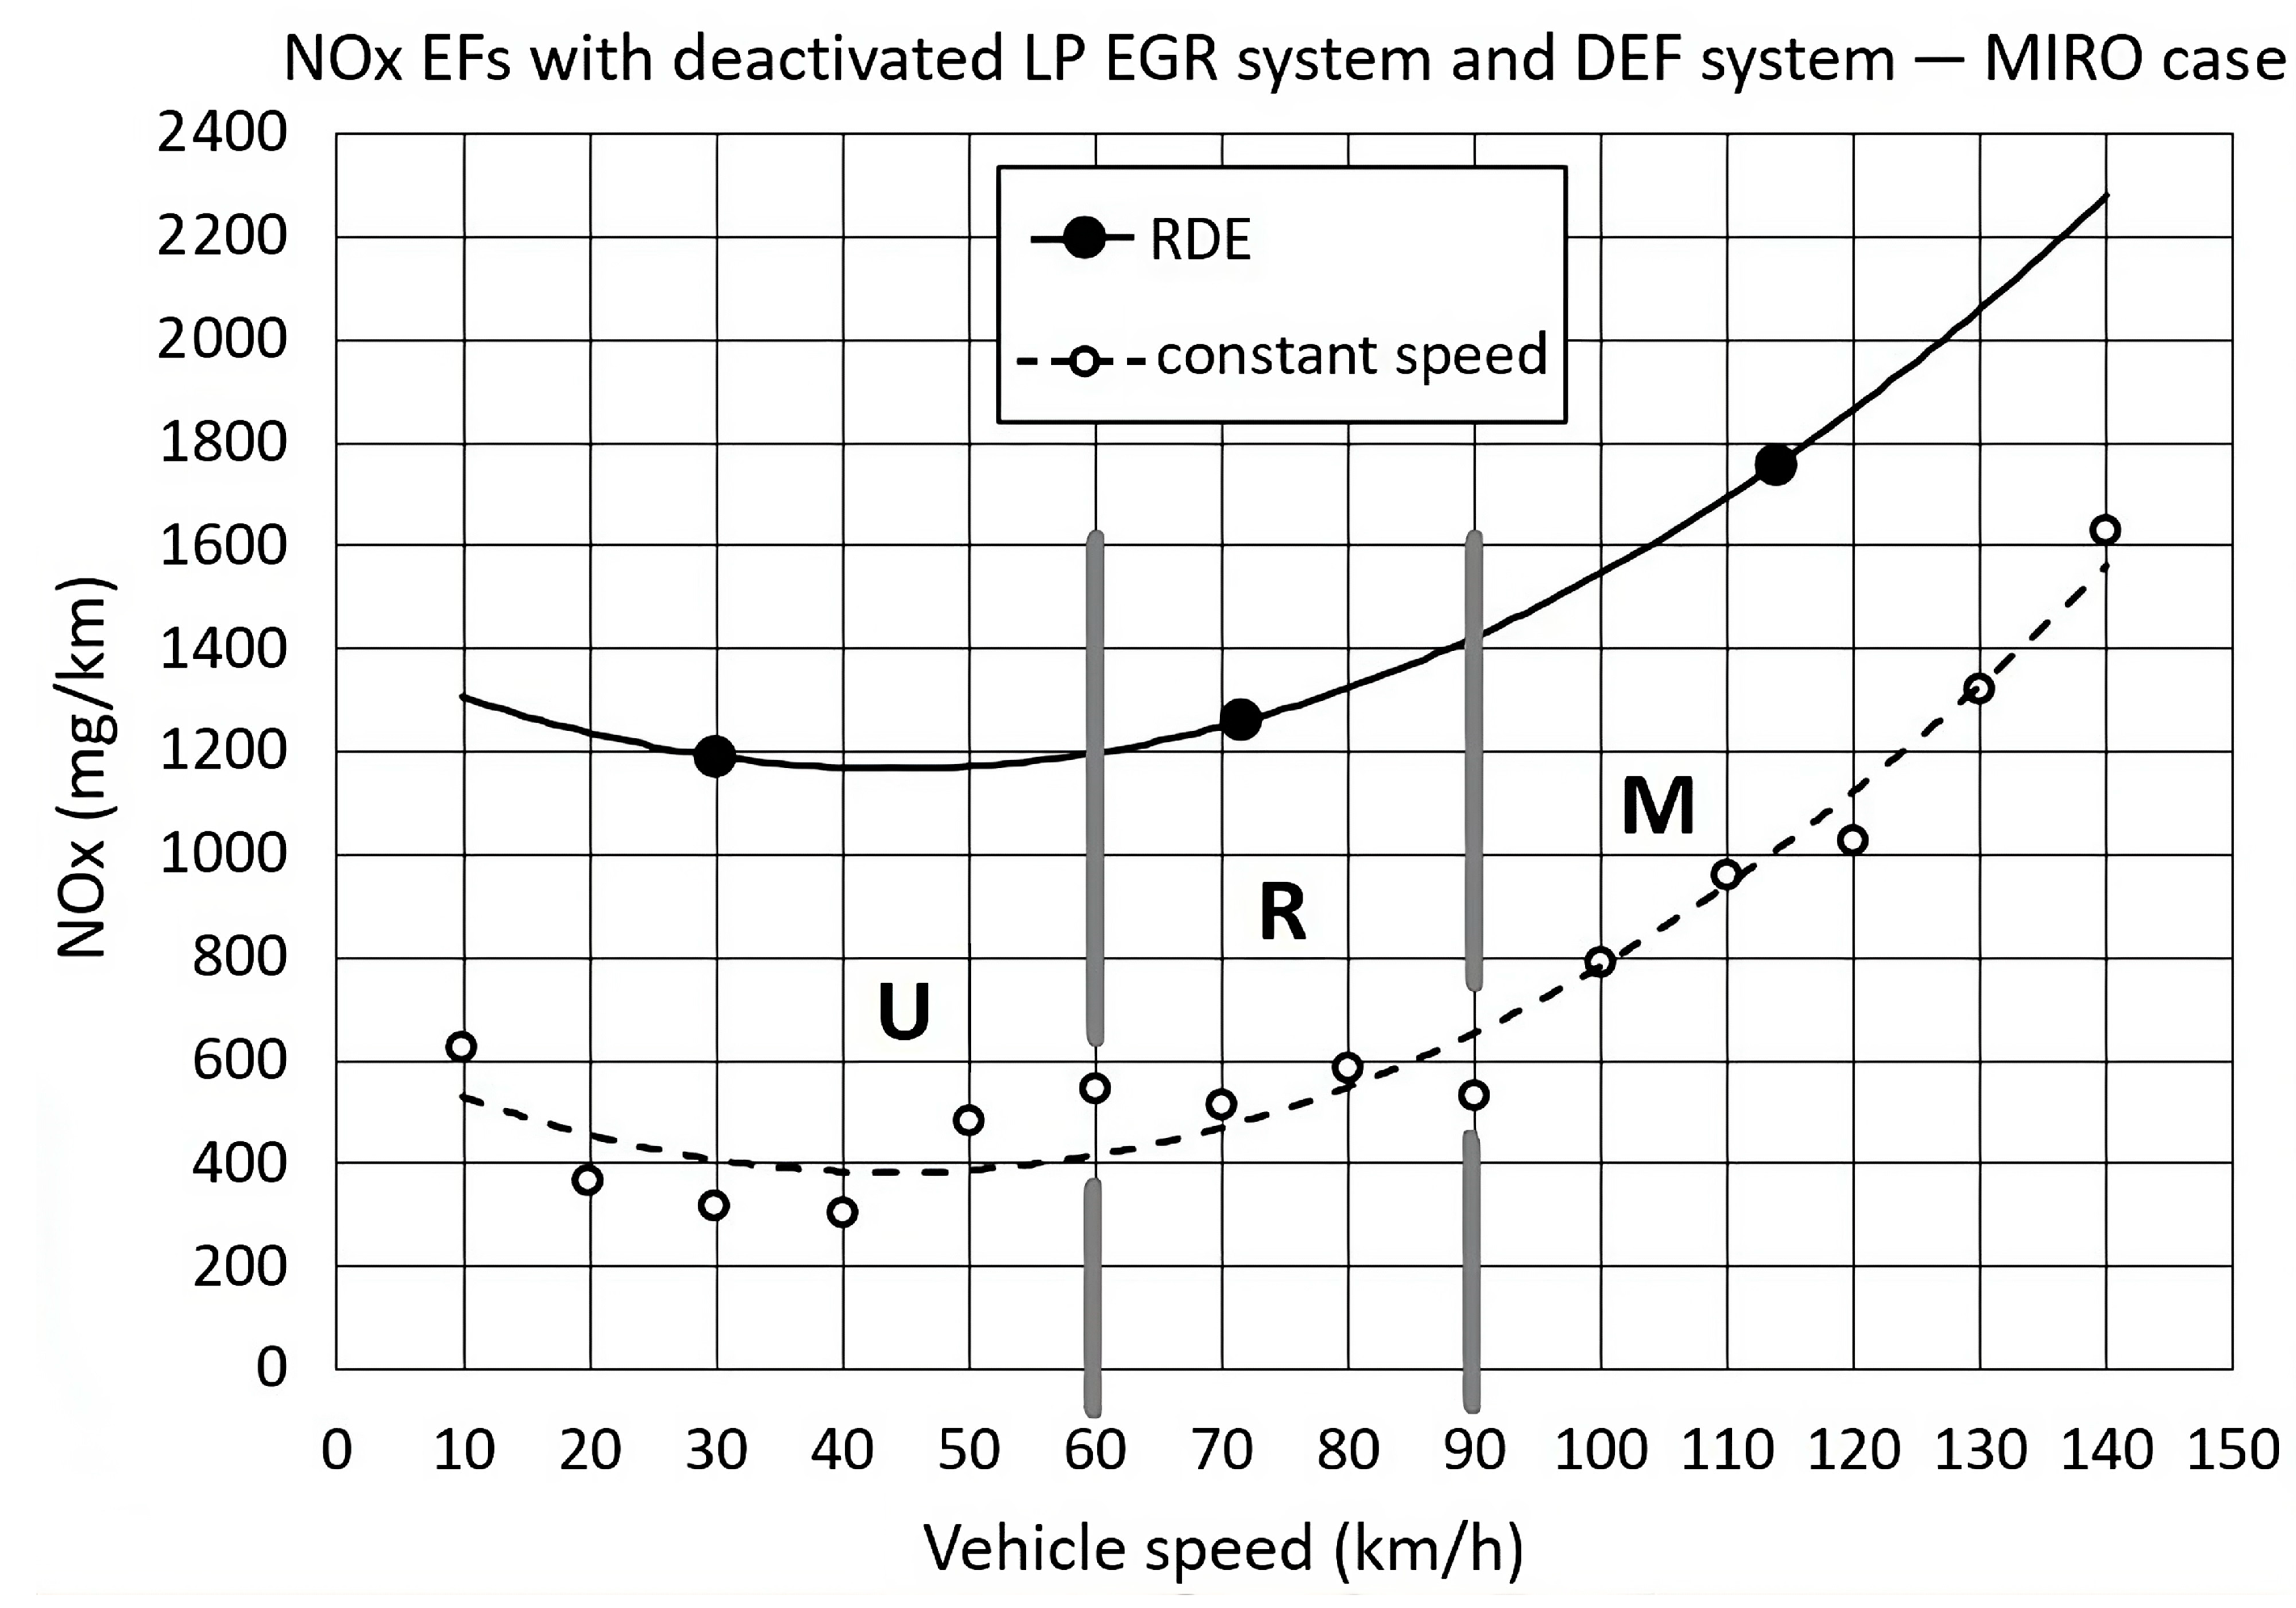
3.6. Measurements with Deactivated LP EGR Valve and DEF System
The influence of the simultaneous deactivation of the LP EGR valve and the DEF system on NOX emissions is considered in this subsection, as shown in Figure 8.
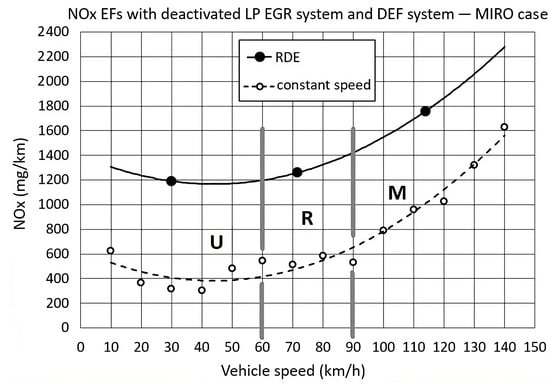
Figure 8.
NOX EFs of the car with the LP EGR valve and DEF system deactivated.
For the case of MIRO at a constant speed, when the LP EGR valve and DEF system were deactivated, the function NOX EF fits the measured data with a coefficient of determination R2 = 0.95.
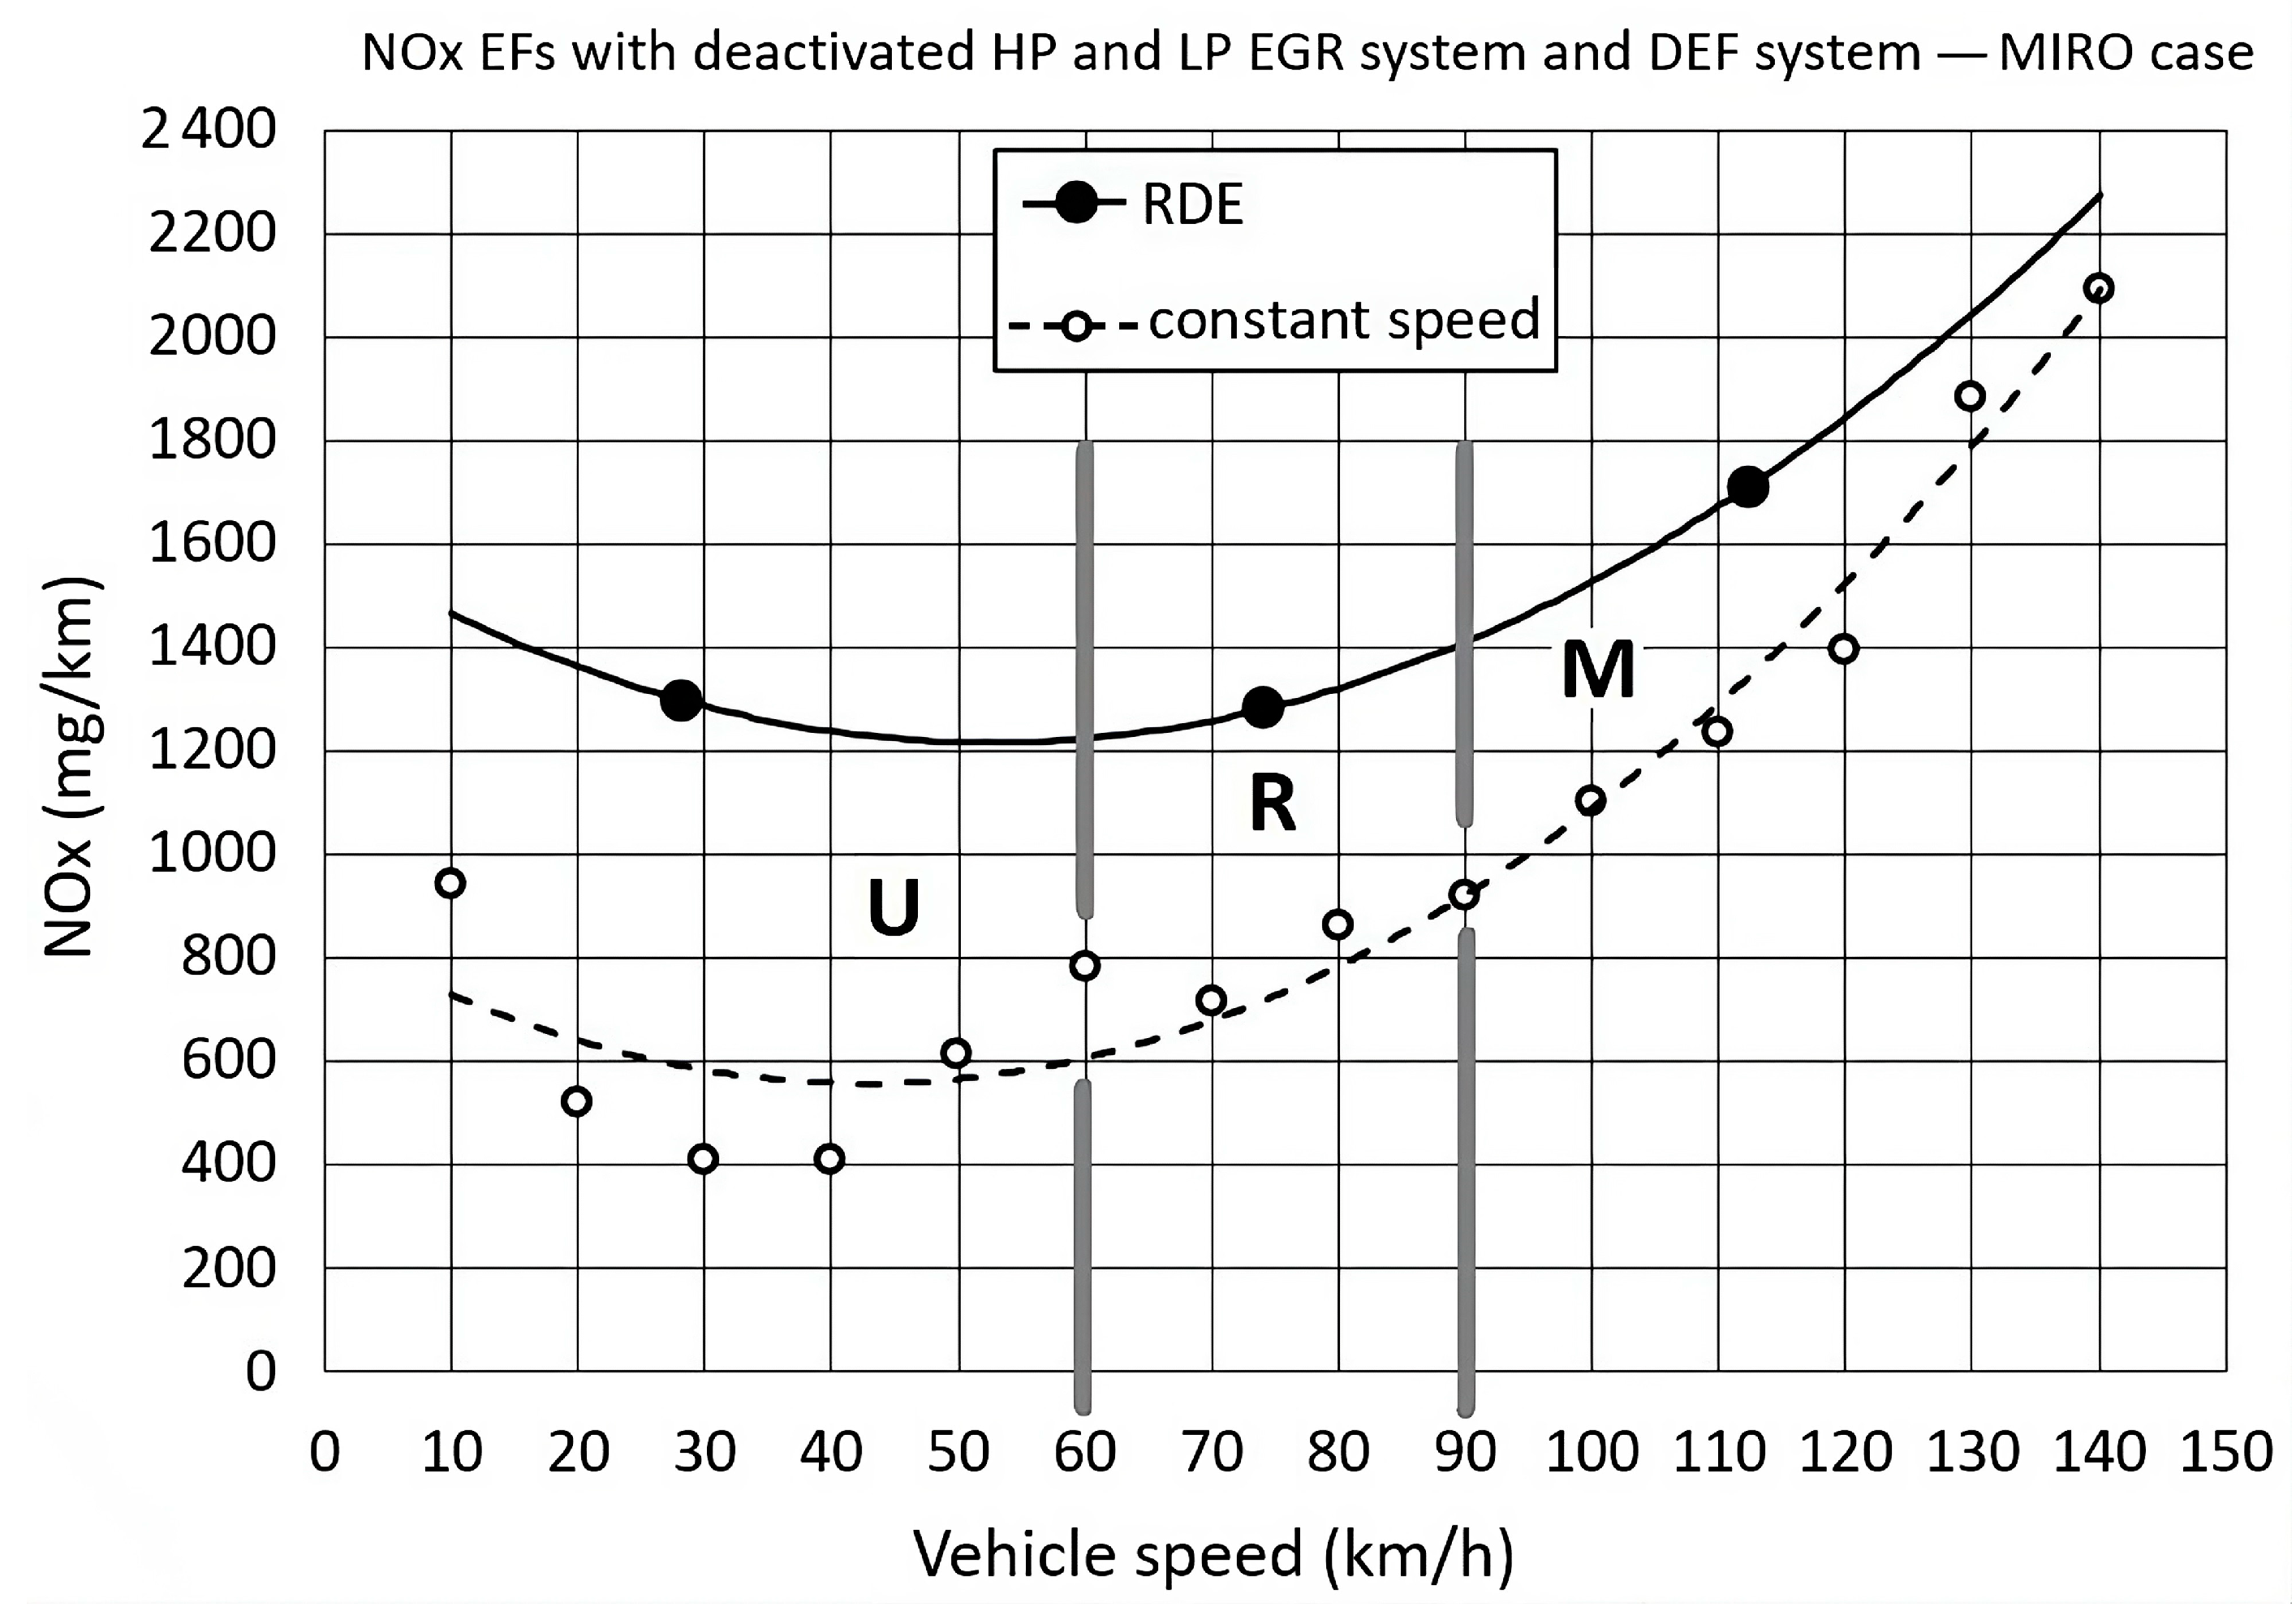
3.7. Measurements with Deactivated HP and LP EGR Valve and DEF System
The influence of the simultaneous deactivation of HP and LP EGR and the DEF system on the emissions of NOX is shown in Figure 9.
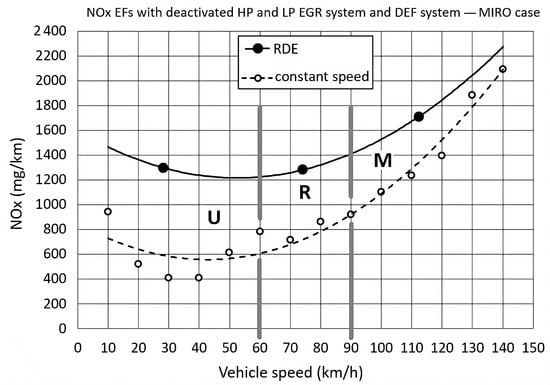
Figure 9.
NOX EFs with deactivated HP and LP EGR valves and the DEF system.
For the case of MIRO at a constant speed, when the HP and LP EGR valves and the DEF system were deactivated, the function NOX EF fits the measured data with a coefficient of determination R2 = 0.95.
3.8. Determination of the Relevant Euro Emission Standard from the COPERT Classification for the Test Vehicle When All ECSs Were Active
According to the COPERT Tier 3 method, NOX hot Efs for N1 and M1 Euro 6 diesel vehicles are expressed in the form as shown in Equation (3) below [42].
where:
= NOX EFs speed-dependent functions;
= factors, related to the vehicle category and emission standard;
= mean vehicle speed (km/h).
In an urban driving mode, driving dynamics, which include rapid speed variations and traffic congestion, cause high NOX emissions. Cruising at moderate speeds in a rural mode leads to the lowest NOX emissions, while air resistance significantly increases fuel consumption and emissions in general in the motorway mode.
Although the test vehicle belongs to category N1—class III, it was approved according to the requirements of class II and received the exhaust emission standard Euro 6 d-TEMP-EVAP-ISC (https://dieselnet.com/standards/eu/ld.php). Comparing the NOX EF polynomials obtained by measurements for the case when all ECSs were active, at a constant speed and during RDE driving, with the NOX EF polynomials implemented in COPERT v.5.6.5, it can be concluded that the COPERT specification shows a significant overestimation. For this reason, the NOX EFs of the Euro 6 d diesel vehicles of category M1 are better suited for further comparison.
3.9. Comparison of RDE NOX Emissions of the Test Vehicle when ECSs Were Active/Inactive with the COPERT Calculation
It should be noted that the COPERT estimation is based on measurements conducted on a larger number of cars, and the NOX EFs present the mean values of all tested vehicles. In the scenario where all ECSs were active, the RDE NOX emissions were lower than the COPERT estimation by a factor of 3.7/5.9/6.2 for the U/R/M driving regime, as shown in Figure 10a. During the total RDE trip of 84.4 km, the PEMS counted 849 mg of NOX emissions, while the COPERT calculated 4.051 g. Even in this case, the COPERT specification shows an overestimation.
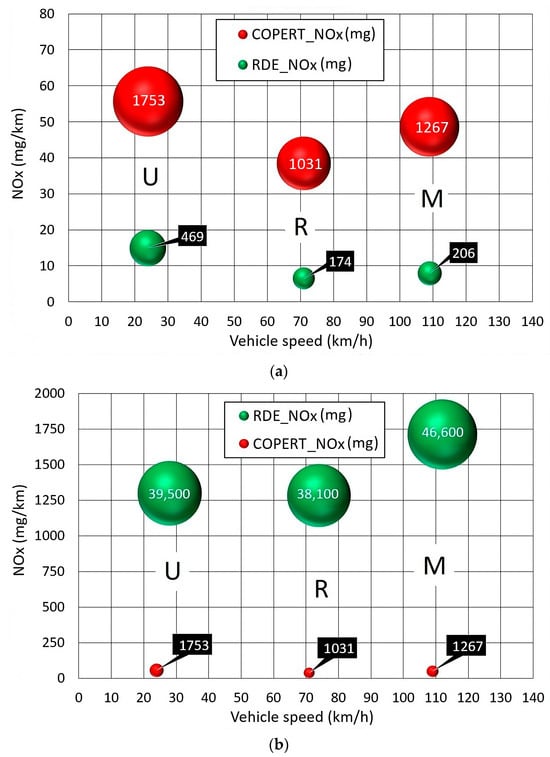
Figure 10.
Comparison of RDE NOX emissions of the test vehicle when ECSs were active (a) and inactive (b) with the COPERT calculation.
In the scenario where NOX ECSs were inactive, the RDE NOX emissions were higher than the COPERT calculation by an increase factor of 23/37/37 for the U/R/M driving regime, as shown in Figure 10b. During the total RDE trip of 87.4 km, the PEMS counted 124.2 g of NOX emissions.
3.10. Calculation of the Functions of Increased Emissions and NOX Increase Factors for Euro 6 Diesel Vehicles with Manipulated ECSs
Based on the measurement results, Equation (2) was used to calculate the speed-dependent functions of increased emissions due to manipulation. The measurement results with deactivated ECSs indicated that the emissions from RDE trips were significantly higher than those from constant-speed trips. The above was to be expected, because RDE driving includes driving dynamics—acceleration, deceleration, and slope resistance—unlike driving at a constant speed. Therefore, the relevant results of the proposed calculation were those from RDE trips. The speed-dependent functions of the increased emissions due to the manipulation of certain ECSs of the tested vehicle with MIRO, together with the corresponding NOX increase factors for the total RDE trips and the U/R/M sections, are shown in Table 6.
Table 6.
Speed-dependent functions of the increased emissions due to manipulation of certain ECSs of the tested vehicle with MIRO and NOX increase factors for the total RDE trips and the U/R/M sections.
For the ECS scenario 2/3/4/5/6/7, the NOX increase factors for the total RDE trip were 26/58/56/144/139/142. For the urban trip, the values of the NOX increase factors for the same scenarios were 12–35% lower than for the total RDE trip, i.e., 21/51/49/99/90/98. For the rural trip, the NOX increase factors were 15–39% higher than the values for the total RDE trip, i.e., 34/67/73/200/193/195. For the motorway trip, the increase factors were 33/64/67/208/216/213, i.e., 10–55% higher than the values for the total RDE trip.
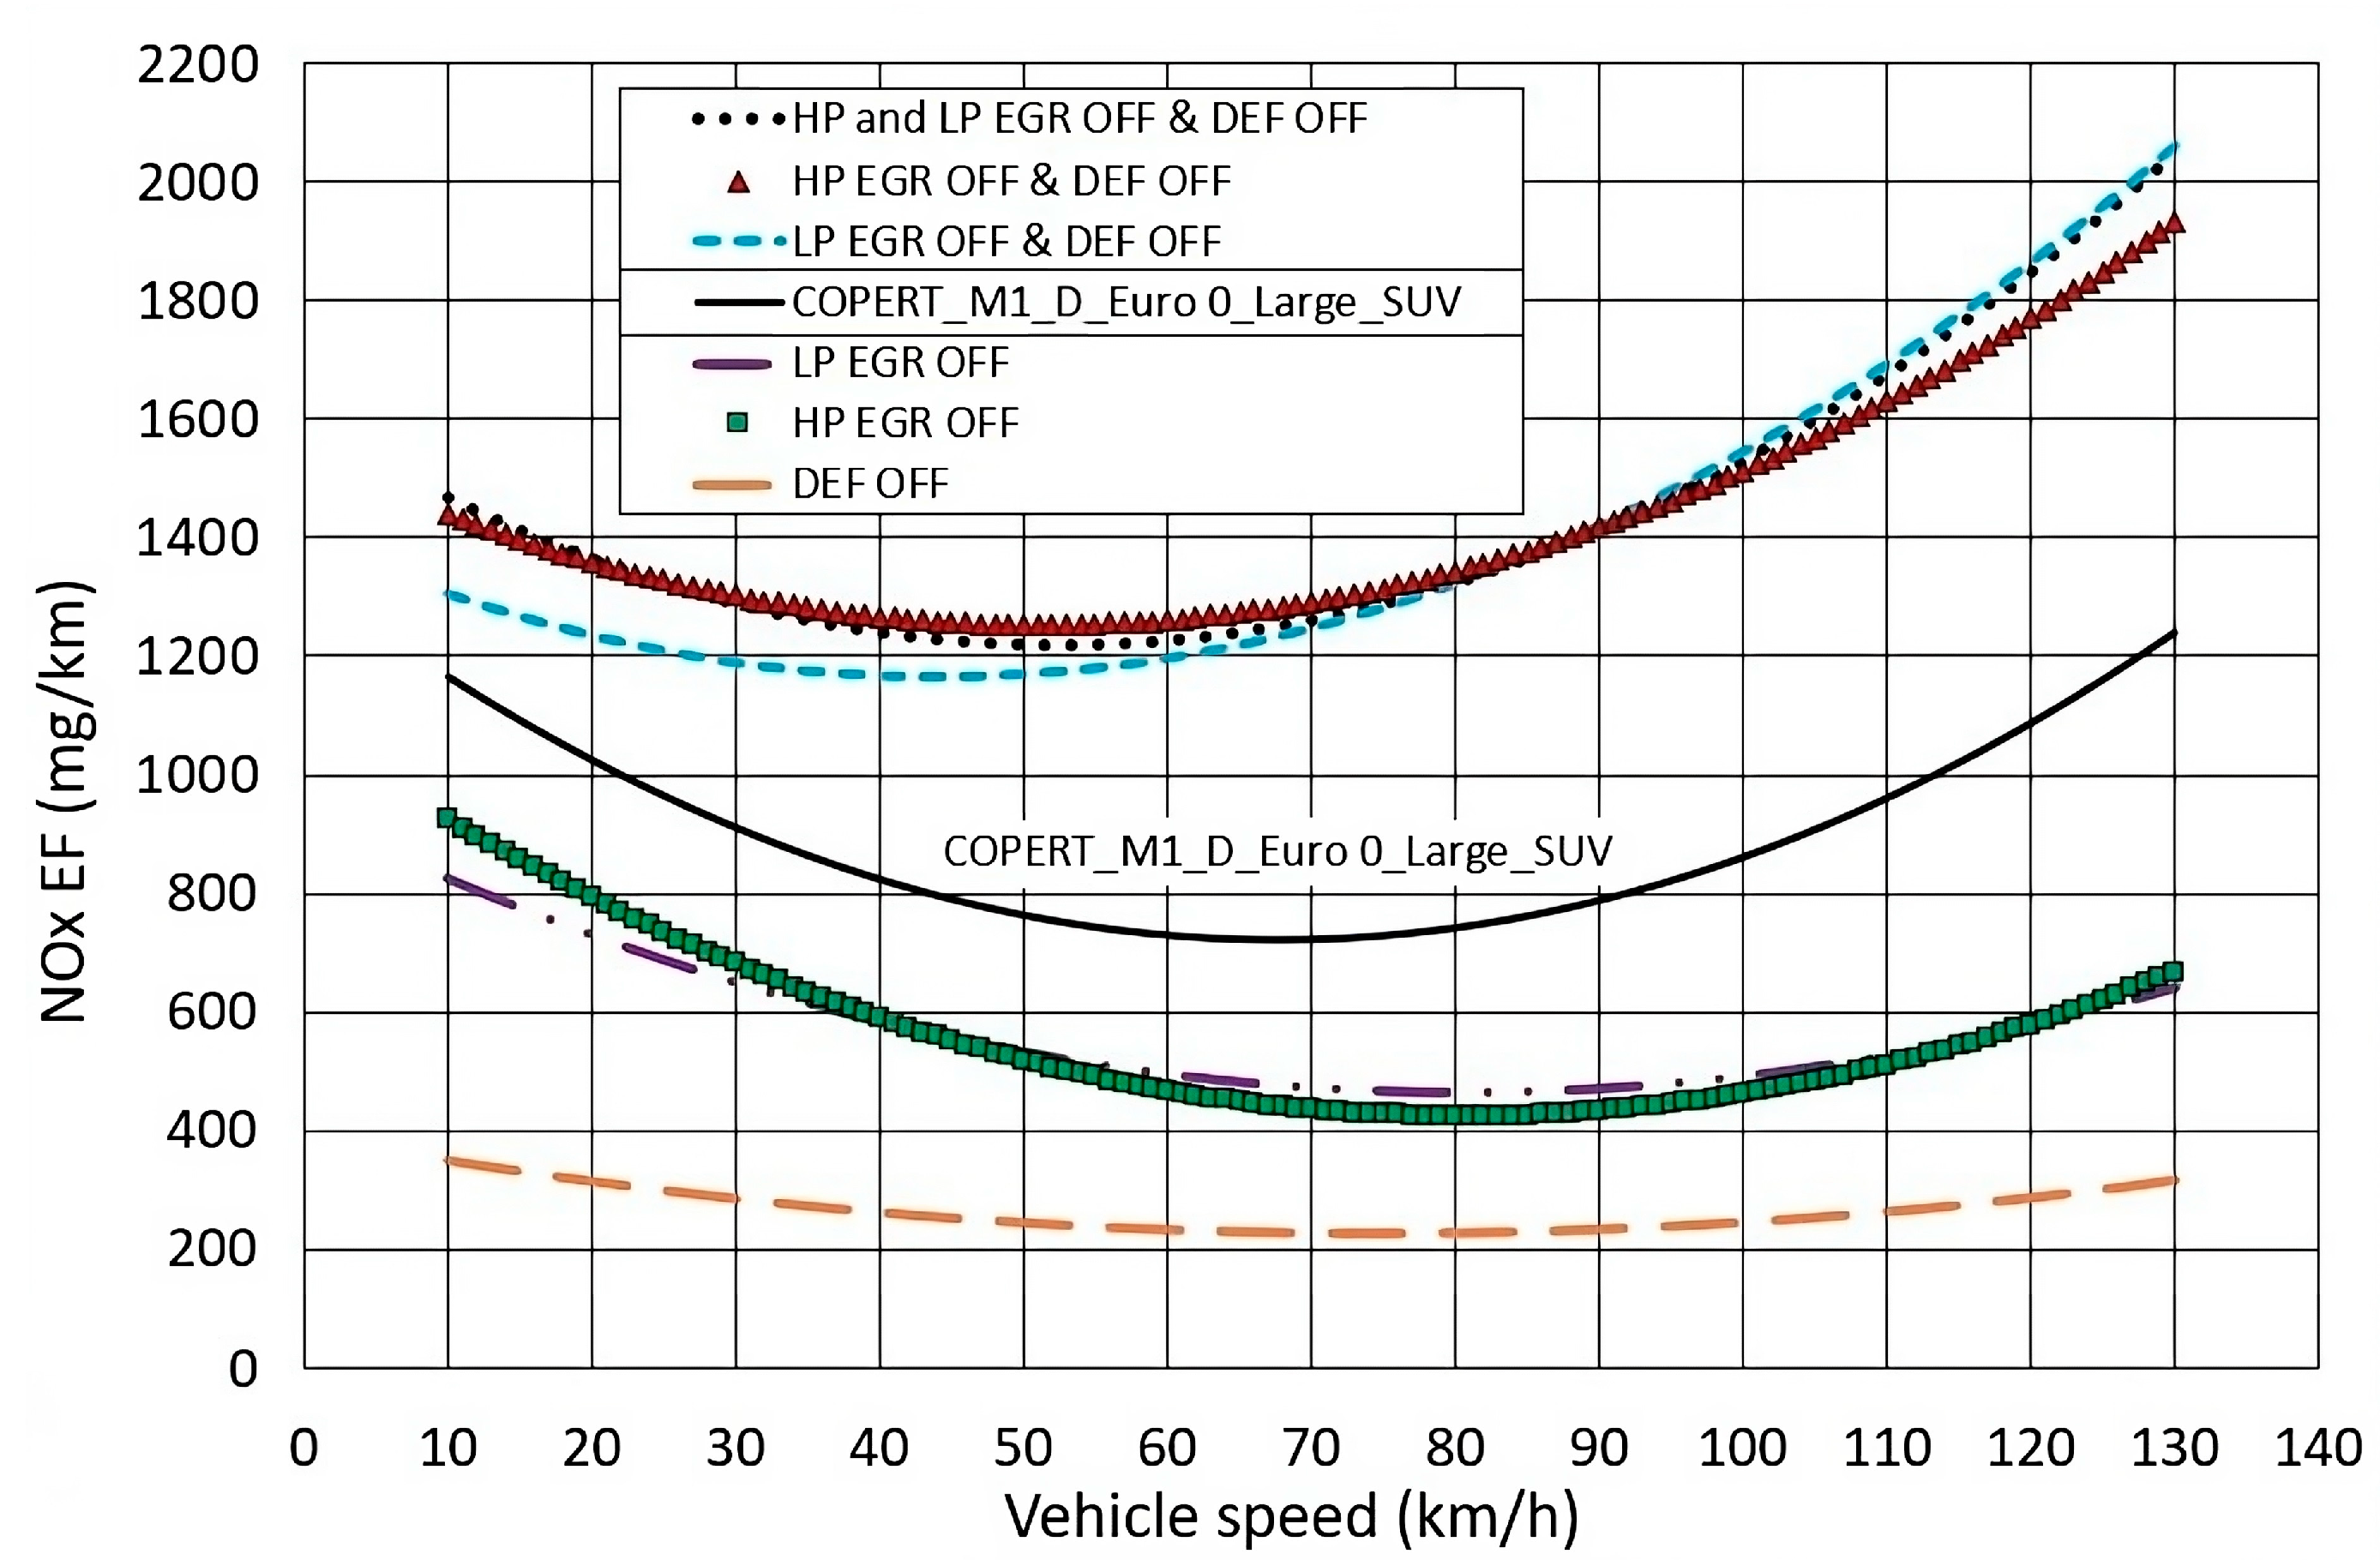
For a more accurate determination of the increase in NOX emissions due to manipulation, it is necessary to carry out a more significant number of measurements on different vehicles to the Euro standard, ECS types, and others. Considering the complexity and long duration of the conducted tests and the necessary resources for repeating the measurements on a larger number of vehicles, alternatively, in the absence of a sufficient number of measurements, the Euro standard of the manipulated vehicles can be lowered to the lowest level (Euro 0 or pre-Euro) to allow for a more accurate calculation of the total hot NOX emissions, as shown in Figure 11.
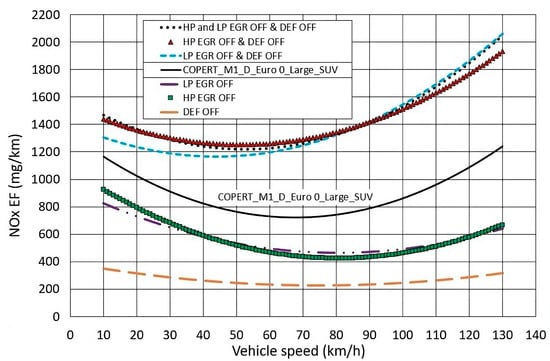
Figure 11.
Comparison of the hot NOX EFs of the test vehicle with manipulated ECSs with the COPERT NOX EFs of a large/SUV diesel PC of the Euro 0 emission standard.
Knowing the proportion of vehicles that have been manipulated makes it possible to estimate the vehicle fleet’s emissions inventory more accurately than existing models.
3.11. An Assessment of the Number of Manipulated PCs in the Republic of Croatia
A simple random sampling technique was used to estimate the number of manipulated PCs in the Croatian fleet as accurately as possible. An anonymous survey was conducted among PC owners by completing a Google form. The survey flyer with an access QR code was available to vehicle owners nationwide at PTI stations. In this way, an attempt was made to reduce bias regarding geographical location, so that the sample did not come from only one region. A total of 2000 people participated in the survey. Since no survey can be 100% accurate, the degree of uncertainty in the survey results is called the margin of error and was calculated using the formula in Equation (4) [43].
where:
= margin of error (%);
= 1.96, z-value that corresponds to confidence level 95%;
= standard deviation of the sample;
= 2000, sample size;
= sample proportion (%);
= 1,831,074, population size, i.e., number of registered PCs.
In a sample of 2000 respondents—owners of a PC with an internal combustion engine (ICE)—209 had carried out certain manipulations on the ECSs. The sample proportion for this sample was 10.45%, and the margin of error was ±1.34% at a 95% confidence level. Applying this to the total population of 1,831,074 PCs with ICE registered in Croatia in 2022, the total number of PCs with ECS manipulations would be 191,347. Of the 209 respondents who performed certain manipulations on their vehicles, 162 were owners of diesel PCs. This sample’s proportion, i.e., the share of diesel PCs with manipulated ECSs in the total PC fleet, was 8.1%, and the margin of error was ±1.19% at a 95% confidence level. Applying this to the total population of 1,027,374 diesel PCs registered in Croatia in 2022, the total number of diesel PCs with ECS manipulations would be 148,317 (14.437%). Of the 162 respondents who performed certain manipulations on their diesel PC, 43 were owners of Euro 6 diesel PCs. The sample proportion for this sample was 2.15%, and the margin of error was ±0.63% at a 95% confidence level. Applying this to the total population of 240,537 Euro 6 diesel PCs registered in Croatia in 2022, the total number of Euro 6 diesel PCs with ECS manipulations would be 39,368 (16.367%). The results of the survey and other processed data are shown in Table 7. It should be noted that diesel plug-in hybrid electric vehicles are not included in the above statistics.
Table 7.
The survey results and the processed data for manipulated passenger cars (PCs_m).
3.12. An Assessment of the NOX Emission Inventory of the Euro 6 Diesel PC Fleet in Croatia
The Euro 6 vehicle category is divided into three subcategories: Euro 6 a/b/c, Euro 6 d-TEMP, and Euro 6 d. The largest share of vehicles is represented in the Euro 6 a/b/c subcategory (≈76%), followed by Euro 6 d-TEMP (≈16.5%) and Euro 6 d (≈7.5%). Based on these proportions, the distribution of manipulated vehicles within the Euro 6 category was made, as shown in Table 8. According to the COPERT calculation, over 95% of the emissions from regular Euro 6 diesel PCs come from the Euro 6 a/b/c subcategory.
Table 8.
Vehicle population and NOX emissions for both total and the manipulated Euro 6 diesel PC fleet.
Considering the emission measurement results and the survey results, six different scenarios were created to evaluate the NOX emission inventory of the Euro 6 diesel PC fleet. It was assumed that the NOX EFs of all the manipulated Euro 6 diesel PCs (Euro 6 a/b/c, Euro 6 d-TEMP, and Euro 6 d) were the same and matched the data obtained in this study. The proposed calculation results were applied to the fleet segment of manipulated Euro 6 diesel PCs (16.367%), i.e., 39,368 vehicles. Using the known data on the annual mileage of each vehicle, the average driving speed, and the share of the distance travelled in a given driving mode, U/R/M, according to the COPERT nomenclature, the relative increase in NOX emissions was calculated at the level of the Euro 6 diesel PC fleet, as shown in Table 9.
Table 9.
For different scenarios, there is a relative increase in hot NOX emissions of the Euro 6 diesel PC fleet compared to the COPERT 5.
Due to the high values of COPERT NOX hot EFs of Euro 6 a/b/c PCs, and taking into account that the research was conducted on a Euro 6 d-TEMP vehicle and not on a Euro 6 a/b/c, the lowest increase in emissions with the proposed calculation was achieved precisely for Euro 6 a/b/c vehicles. Moreover, the proposed calculation indicated a decrease in NOX emissions for the DEF OFF scenario. Since the largest number of Euro 6 vehicles belongs to this subcategory, the total emissions of the entire Euro 6 diesel PC fleet for the DEF OFF case scenario have a negative sign. In all other case scenarios, the proposed calculation showed an increase in emissions within each Euro 6 subcategory and for the category as a whole. For combinations of deactivated individual ECSs, the NOX emissions increased by up to 46.3% at the Euro 6 diesel PC fleet level.
4. Discussion
When all ECSs were active, the NOX emissions when driving at a constant speed from 10 to 140 km/h were not significantly different from the emissions when driving the RDE route, as shown in Figure 3. However, when the ECSs were deactivated, there was a significant difference between the emissions at a constant speed and the RDE route, as shown in Table 10. From the results in Table 10, it can be concluded that driving dynamics during the RDE route significantly impacted the increase in vehicle emissions when the ECSs were deactivated. Given these results, the RDE data were used instead of the constant speed data to calculate the emissions from the manipulated vehicles.
Table 10.
Comparison of NOX EFs when driving at a constant speed and driving the RDE route for different ECS scenarios.
The effects of increasing the vehicle mass on emissions from MIRO (2050 kg) to GVWR (2350 kg) are shown in Figure 3 and Table 4 for the scenario with all ECSs activated, and in Figure 7 and Table 5 for the case with the HP EGR and DEF dosing system deactivated. From a comparison of the results, it can be concluded that the impact of an increase in vehicle mass on NOX emissions is relatively more visible when the ECSs are activated than when they are deactivated. Furthermore, in the HP EGR and DEF OFF scenario, a decrease in NOX emissions with an increasing vehicle mass was observed. However, since the values of NOX emissions for the case when all ECSs are activated were small in absolute values, it can be concluded that the influence of the increase in vehicle mass on the rise in NOX emissions was negligible compared to the upgrowth caused by the manipulations of the ECS. For this reason, MIRO was used instead of GVWR to calculate the NOX emissions of the manipulated vehicles.
When comparing the results of the RDE runs for six different scenarios with the ECS deactivated, it can be seen that the smallest increase in NOX emissions—with an increase factor of 26 for the total RDE trip—was obtained for the case where only the DEF system was deactivated. For the following two scenarios, HP EGR OFF and LP EGR OFF, slightly higher values of the increase factor—58 and 56—were obtained. Similar values of NOX emissions for two test cases—EGR OFF and then DEF OFF—were obtained in a study conducted by the Joint Research Centre (JRC) of the European Commission in Italy [31]. Moreover, the JRC obtained slightly higher values, but was justified considering that the measurement was carried out on an older Euro 6d-Temp LDV, not Euro 6d. From Figure 11, it can be seen that their EF polynomials did not differ significantly. The highest values were obtained for three cases that were a combination of disabled ECSs—HP and LP EGR OFF and DEF OFF, LP EGR OFF and DEF OFF, and the case where both HP and LP EGR and the DEF system were disabled. The NOx increased factors for these three scenarios amounted to 144, 139, and 142. From Figure 11 can be seen that their EF polynomials were very similar. Since the NOX EFs from RDE trips are second-order polynomials determined by only three measurement points, one each in U/R/M driving mode, it is proposed to improve the existing calculation by additional measurements targeting several different average driving speeds in the U/R/M driving mode. In this way, they would determine a polynomial that more accurately describes the dependence of emissions on average driving speed.
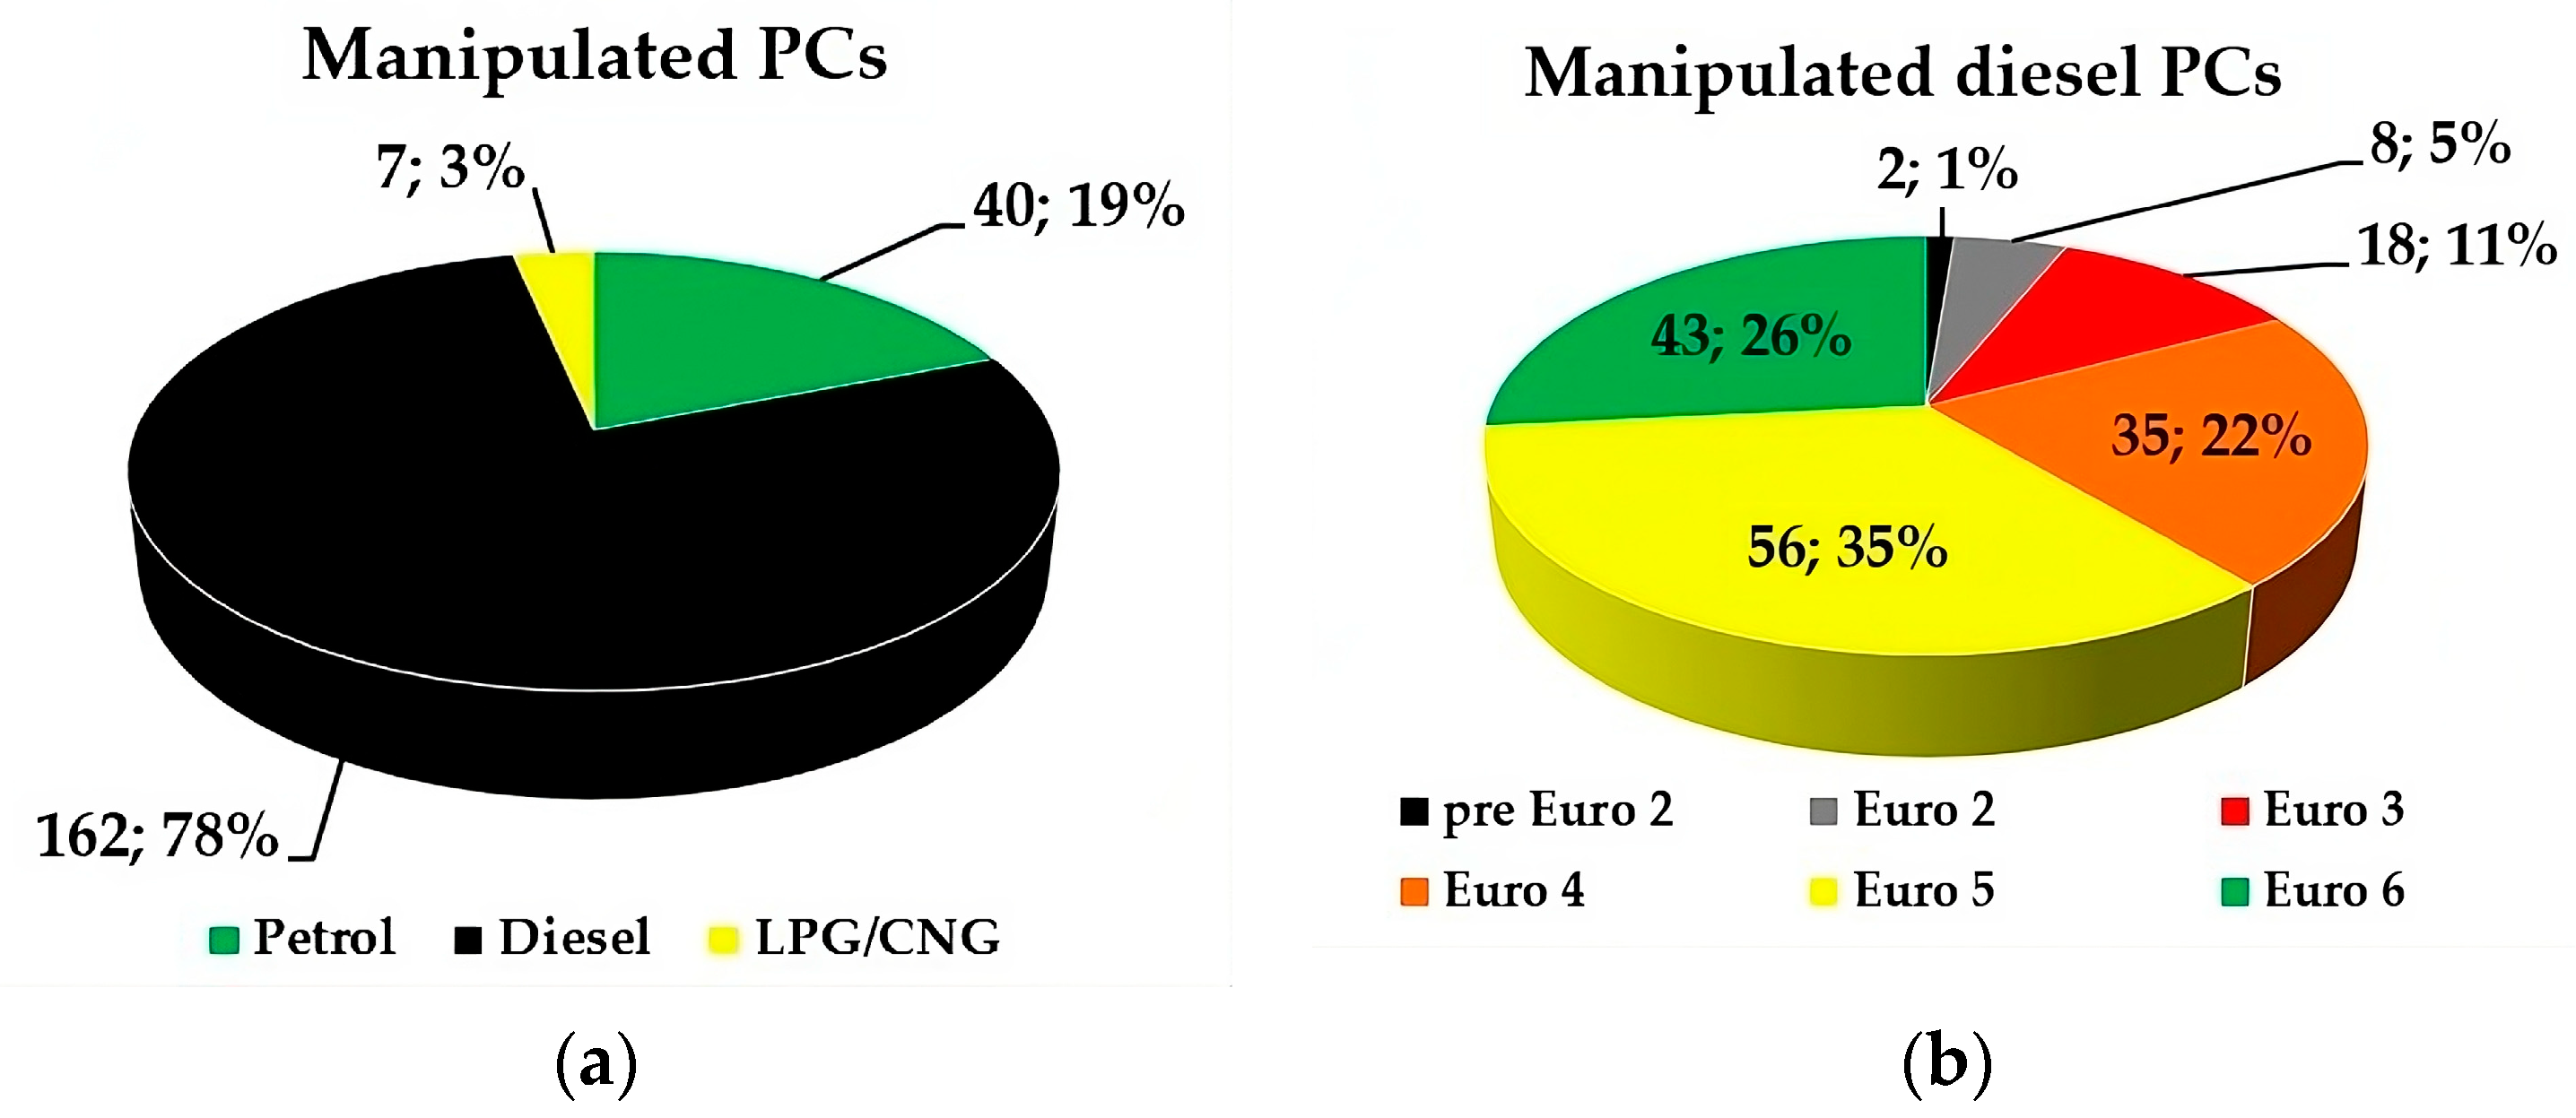
The survey results showed that, on average, one in ten registered PCs has some prohibited modifications to the ECS. Considering diesel cars, on average, 1 in 12 vehicles has some ECS modifications. For diesel cars of the latest Euro 6 standard, 1 in 50 vehicles, on average, has some illegal tampering with the ECS. This study on emissions calculation considered only the survey results for Euro 6 diesel PCs. However, since car owners of all subcategories of PCs participated in the survey, Figure 12 shows a pie chart with data by fuel type and Euro standard.

Figure 12.
The proportion of manipulated PCs by fuel type (a) and the share of manipulated diesel PCs by Euro standard (b) from the survey sample.
Figure 12a shows that the largest share of manipulated PCs was vehicles powered by diesel fuel—78%. The largest share of manipulated diesel cars was of the Euro 5 standard—35%, followed by Euro 6/Euro 4/Euro 3/Euro 2/pre-Euro 2, with shares of 26%/22%/11%/5%/1%, as shown in Figure 12b. Therefore, it is proposed to extend this calculation to diesel cars with lower Euro standards—especially Euro 5 and Euro 4, which account for 29% of the total PC fleet. In that case, it is necessary to perform additional RDE measurements on vehicles of lower Euro standards and different types of installed ECSs and then compare their NOX increase factors with the data of this study. As the existing survey is still retained, it is planned to update the emissions of the vehicle fleet considering the expanded number of respondents.
According to the data in Table 9, the NOX emissions in scenarios 1–7 increased by 329–2263% for Euro 6 d-TEMP (https://dieselnet.com/standards/eu/ld.php) vehicles and by 436–2854% for Euro 6 d vehicles, while unexpectedly lower values—48–187%—were achieved for Euro 6 a/b/c. This raises the question of whether or not this study’s results also apply to Euro 6 a/b/c diesel PCs. The NOX EFs for diesel PCs of the Euro 6 a/b/c standard were several times higher than the EFs of those with higher Euro standards—Euro 6 d-TEMP and Euro 6 d. Although the test vehicle was type-approved with the Euro 6 d-TEMP standard, the RDE measurements indicated that the NOX emission levels were significantly lower than those for Euro 6 d vehicles. It is presumed that the NOX EFs of manipulated Euro 6 a/b/c vehicles are much higher than the EFs of the test vehicle with deactivated ECSs. Therefore, it is assumed that the data from Table 9 for Euro 6 a/b/c are underestimated in all seven scenarios. In addition, the data for the scenario DEF OFF were determined with a negative sign, which is contradictory, as the other results for Euro 6 d-TEMP and Euro 6 d indicated an increase in NOX emissions due to DEF system manipulations. Since Euro 6 a/b/c vehicles make up 76% of the Croatian Euro 6 diesel PC fleet, a significantly higher emission inventory value is expected to be obtained. Due to that, it is necessary to perform RDE measurements on Euro 6 a/b/c vehicles and update the existing calculation of emissions from these vehicles.
Of the 209 respondents who made manipulations to their ECS, 48.8% said they had decided to make those modifications because of an ECS failure or engine malfunction. The prerequisite for chip tuning was the reason for 30.6% of the respondents, and the remaining 20.6% had another reason. It can be concluded that most owners had technical defects as triggers for tampering. Since the components of the ECS are mostly expensive, the owners opted for a cheaper option, namely deactivating the function, instead of buying and installing new parts. When asked about the age of the vehicle at the time of modification, 15.8% said it was less than five years old, 38.3% said the car was between five and ten years old, and 45.9% said the vehicle was more than ten years old. Although older vehicles are more susceptible to manipulation, it can be noted that the proportion of PCs younger than five years is nevertheless significant, and these are exclusively Euro 6 standard vehicles. It can be concluded from this that even newer vehicles are not immune to the technical difficulties of the ECS that occur during vehicle use. As the average age of passenger cars in Croatia has shown an increasing trend since 2007 [39]—an increase from 9.8 to 13.3 years in 2022—it can be expected that this trend with manipulations will continue. As many as 77.1% of the respondents said the tampering was not detected during the PTI test, so the vehicle passed the emissions test. Only 10% of the respondents did not pass the emission test, while the remaining 12.9% stated that they had since deregistered or sold their vehicle. The biggest problem is that such manipulations are difficult or almost impossible to detect during the PTI.
Although the proposed calculation is limited to hot emissions and applied to Euro 6 diesel LDV with the EGR and DEF ECS, it can be extended to cold emissions and other vehicle categories, Euro standards, and ECSs. This research was necessary to show where significant amounts of “hidden” NOX emissions from road transport come from and to encourage policymakers to develop methods to prevent such manipulations. Considering the results and conclusions of this study, it would be scientifically beneficial to continue research on the increased NOX emissions from vehicles with manipulated ECSs.
5. Conclusions
This research aimed to investigate the influence of manipulations of the EGR valve and the DEF dosing system on the NOX emissions of Euro 6 diesel PCs and to estimate the emissions of manipulated vehicles based on PEMS measurements. One of the main conclusions is that the emissions of the test vehicle, where both the EGR valve and the DEF system were tampered with, exceeded the values by more than two orders of magnitude compared to the case where all ECSs were active. This study’s purposed to estimate accurately the proportion of manipulated vehicles in the vehicle fleet so that NOX emissions calculations are as realistic as possible. For this reason, an anonymous survey was conducted among PC owners. Using the survey’s results and extending them to the targeted fleet, the NOX emissions from Euro 6 diesel PCs were calculated. The results showed that the hot emissions of this group of vehicles are up to 46.3% higher than the hot emissions calculated with the official computer program COPERT 5, with a tendency towards significantly higher values.
The essential conclusions that emerged from this study are as follows:
- When all ECSs were active, the NOX EFs from constant speed runs were not significantly different from the values when driving an RDE route;
- When the ECSs were deactivated, the NOX EFs on the RDE route were significantly higher than the values when driving at a constant speed;
- Since the driving dynamics during the RDE runs significantly impacted the increase in vehicle emissions, the more realistic RDE data were used instead of the constant speed data to calculate the emissions from manipulated vehicles;
- An increase in vehicle mass by 300 kg caused the NOX emissions on the RDE trip to be 47% higher when the ECSs were activated and 4% lower when the HP EGR and DEF systems were deactivated;
- When the HP EGR and DEF systems were deactivated, increasing the vehicle mass by 300 kg did not significantly change the NOX emissions. Therefore, due to the simplicity of and reduction in the number of measurements, only MIRO was used to calculate the emissions from the manipulated vehicle;
- The smallest increase in NOX emissions of the test vehicle with manipulated ECSs, with an increase factor of 26 for the total RDE trip, was obtained for the case where only the DEF system was deactivated;
- Slightly higher values of the NOX increase factor—58 and 56—were obtained for the HP EGR OFF and LP EGR OFF scenarios, and their EF polynomials did not differ significantly;
- The highest NOX increase factors—144, 139, and 142—were obtained for three cases that were a combination of deactivated ECSs—HP and LP EGR OFF and DEF OFF, LP EGR OFF and DEF OFF, and the case where both HP and LP EGR and the DEF system were deactivated—and their EF polynomials did not differ significantly;
- The survey results showed that, on average, one in ten registered PCs has some prohibited modifications to the ECS. Considering diesel cars, on average, 1 in 12 vehicles has some ECS modifications. For diesel cars of the latest Euro 6 standard, 1 in 50 vehicles, on average, has some illegal tampering with the ECS;
- The NOX emissions inventory in scenarios 1–7 increased by 329–2263% for Euro 6 d-TEMP vehicles and by 436–2854% for Euro 6 d vehicles, while unexpectedly lower values—48–187%—were achieved for Euro 6 a/b/c. The reason for this is probably that the NOX EFs for Euro 6 a/b/c vehicles in COPERT have been updated, so it is possible that they already include the impact of the operation of defeat devices;
- It is necessary to perform RDE measurements on Euro 6 a/b/c vehicles and update the existing calculation of emissions from these vehicles;
- As many as 77.1% of the survey respondents said that the tampering was not detected during the PTI test, only 10% did not pass the emission test, and the remaining 12.9% stated that they had since deregistered or sold their vehicle.
The limitation of the proposed calculation is that it was created based on the results of only one tested vehicle. To apply the calculation with greater certainty to the entire Euro 6 diesel PC fleet, additional measurements on Euro 6 a/b/c standard vehicles according to the same principle are planned. This method can also be applied to other NOX emission control systems prone to manipulation, such as diesel oxidation catalysts, SCR catalysts, NOX adsorbers, and others. Increasing the EGR causes diesel engines to produce more particulate matter (PM) [44]. Therefore, with a functional EGR system, it would be interesting to investigate the effects of the tampering of the DPF system on PM. Based on additional measurements, it is planned to create a model for calculating the emissions of manipulated vehicles.
These experimental findings indicate where significant amounts of “hidden” NOX emissions from road transport come from. A contribution to the scientific literature derived from the experimental findings is the proposed calculation for determining the NOX EFs of vehicles with deactivated ECSs. The idea is to encourage researchers to deal more with this topic and to create more functions of increased emissions due to the manipulation of ECSs to validate this method and improve the calculation of existing emission models. In addition, the study’s benefit is the survey results, which indicated a share of manipulated vehicles in the fleet. Without these results, it would not be possible to estimate the real emissions of the PC fleet. With the joint efforts of the scientific community and policymakers, it is possible to create measures for preventing such manipulations and consequently improving air quality.
An important omission in the PTI system is because outdated technology is still consciously applied, which, in newer diesel vehicles—Euro 5 and Euro 6—generally cannot detect even smoke opacity, much less tampering [45]. What is even more important is that NOX emissions are not checked at all during PTI [46,47]. A proposal for the International Motor Vehicle Inspection Committee (CITA) is to introduce obligatory new technologies into the PTI system, such as the PN counter for particle number detection and the NOX analyser. Introducing road emissions control would increase awareness of the seriousness of the problem of harmful emissions as one of the main “silent” killers of the 21st century.
Author Contributions
Conceptualisation, M.R. and Z.L.; methodology, M.R.; formal analysis, M.R.; investigation, M.R.; resources, Z.L. and G.P.; data curation, M.R.; writing—original draft preparation, M.R.; writing—review and editing, G.P., P.I. and Z.L.; visualisation, M.R.; supervision, Z.L. All authors have read and agreed to the published version of the manuscript.
Funding
This research received no external funding.
Institutional Review Board Statement
Not applicable.
Informed Consent Statement
Not applicable.
Data Availability Statement
The partial data can be available upon special request.
Acknowledgments
The authors acknowledge the CVH for providing the test vehicle and the National Reference Laboratory for Emissions from Internal Combustion Engines for Non-Road Mobile Machinery of the Faculty of Mechanical Engineering and Naval Architecture of the University of Zagreb for providing the PEMS device. We would also like to thank our colleague Boris Bućan for all pre-test and post-test activities, monitoring the data during the measurement and preparing the raw data for later processing. Our special thanks go to all car owners who participated in the survey.
Conflicts of Interest
The authors declare no conflicts of interest.
References
- Kannan, C.; Vijayakumar, T. Application of Exhaust Gas Recirculation for NOx Reduction in CI Engines. In NOx Emission Control Technologies in Stationary and Automotive Internal Combustion Engines: Approaches Toward NOx Free Automobiles; Ashok, B., Ed.; Elsevier: Amsterdam, The Netherlands, 2022; pp. 189–222. ISBN 978-0-12-823955-1. [Google Scholar]
- Sathishkumar, S.; Mohamed Ibrahim, M. NOx Reduction in IC Engines through Adsorbing Technique. In NOx Emission Control Technologies in Stationary and Automotive Internal Combustion Engines: Approaches Toward NOx Free Automobiles; Ashok, B., Ed.; Elsevier: Amsterdam, The Netherlands, 2022; pp. 255–283. ISBN 978-0-12-823955-1. [Google Scholar]
- Vignesh, R.; Ashok, B. Selective Catalytic Reduction for NOx Reduction. In NOx Emission Control Technologies in Stationary and Automotive Internal Combustion Engines: Approaches Toward NOx Free Automobiles; Ashok, B., Ed.; Elsevier: Amsterdam, The Netherlands, 2022; pp. 285–317. ISBN 978-0-12-823955-1. [Google Scholar]
- Vijay Kumar, M.; Babu, A.V.; Reddy, C.R.; Pandian, A.; Bajaj, M.; Zawbaa, H.M.; Kamel, S. Investigation of the Combustion of Exhaust Gas Recirculation in Diesel Engines with a Particulate Filter and Selective Catalytic Reactor Technologies for Environmental Gas Reduction. Case Stud. Therm. Eng. 2022, 40, 102557. [Google Scholar] [CrossRef]
- Bouzzine, Y.D.; Lueg, R. The Contagion Effect of Environmental Violations: The Case of Dieselgate in Germany. Bus. Strateg. Environ. 2020, 29, 3187–3202. [Google Scholar] [CrossRef]
- Liu, X.; Zhao, F.; Hao, H.; Chen, K.; Liu, Z.; Babiker, H.; Amer, A.A. From NEDC to WLTP: Effect on the Energy Consumption, Nev Credits, and Subsidies Policies of Phev in the Chinese Market. Sustainability 2020, 12, 5747. [Google Scholar] [CrossRef]
- Lasocki, J. The WLTC vs NEDC: A Case Study on the Impacts of Driving Cycle on Engine Performance and Fuel Consumption. Int. J. Automot. Mech. Eng. 2021, 18, 9071–9081. [Google Scholar] [CrossRef]
- Lee, H.; Lee, K. Comparative Evaluation of the Effect of Vehicle Parameters on Fuel Consumption under NEDC and WLTP. Energies 2020, 13, 4245. [Google Scholar] [CrossRef]
- Ramos, A.; Muñoz, J.; Andrés, F.; Armas, O. NOx Emissions from Diesel Light Duty Vehicle Tested under NEDC and Real-Word Driving Conditions. Transp. Res. Part D Transp. Environ. 2018, 63, 37–48. [Google Scholar] [CrossRef]
- Gao, J.; Chen, H.; Liu, Y.; Laurikko, J.; Li, Y.; Li, T.; Tu, R. Comparison of NOx and PN Emissions between Euro 6 Petrol and Diesel Passenger Cars under Real-World Driving Conditions. Sci. Total Environ. 2021, 801, 149789. [Google Scholar] [CrossRef]
- Giechaskiel, B.; Casadei, S.; Rossi, T.; Forloni, F.; Di Domenico, A. Measurements of the Emissions of a “Golden” Vehicle at Seven Laboratories with Portable Emission Measurement Systems (PEMS). Sustainability 2021, 13, 8762. [Google Scholar] [CrossRef]
- Liu, D.; Lou, D.; Liu, J.; Fang, L.; Huang, W. Evaluating Nitrogen Oxides and Ultrafine Particulate Matter Emission Features of Urban Bus Based on Real-World Driving Conditions in the Yangtze River Delta Area, China. Sustainability 2018, 10, 2051. [Google Scholar] [CrossRef]
- Pina, N.; Tchepel, O. A Bottom-up Modeling Approach to Quantify Cold Start Emissions from Urban Road Traffic. Int. J. Sustain. Transp. 2022, 17, 942–955. [Google Scholar] [CrossRef]
- Cifuentes, F.; González, C.M.; Trejos, E.M.; López, L.D.; Sandoval, F.J.; Cuellar, O.A.; Mangones, S.C.; Rojas, N.Y.; Aristizábal, B.H. Comparison of Top-down and Bottom-up Road Transport Emissions through High-Resolution Air Quality Modeling in a City of Complex Orography. Atmosphere 2021, 12, 1372. [Google Scholar] [CrossRef]
- Ali, M.; Kamal, M.D.; Tahir, A.; Atif, S. Fuel Consumption Monitoring through COPERT Model—A Case Study for Urban Sustainability. Sustainability 2021, 13, 11614. [Google Scholar] [CrossRef]
- Li, F.; Zhuang, J.; Cheng, X.; Li, M.; Wang, J.; Yan, Z. Investigation and Prediction of Heavy-Duty Diesel Passenger Bus Emissions in Hainan Using a COPERT Model. Atmosphere 2019, 10, 106. [Google Scholar] [CrossRef]
- Kovács, A.; Leelőssy, Á.; Tettamanti, T.; Esztergár-Kiss, D.; Mészáros, R.; Lagzi, I. Coupling Traffic Originated Urban Air Pollution Estimation with an Atmospheric Chemistry Model. Urban Clim. 2021, 37, 100868. [Google Scholar] [CrossRef]
- Kamruzzaman, M.H.; Mizunoya, T. Quantitative Analysis of Optimum Corrective Fuel Tax for Road Vehicles in Bangladesh: Achieving the Greenhouse Gas Reduction Goal. Asia-Pac. J. Reg. Sci. 2021, 5, 91–124. [Google Scholar] [CrossRef]
- Song, X.; Hao, Y. Research on the Vehicle Emission Characteristics and Its Prevention and Control Strategy in the Central Plains Urban Agglomeration, China. Sustainability 2021, 13, 1119. [Google Scholar] [CrossRef]
- Ntziachristos, L.; Papadimitriou, G.; Ligterink, N.; Hausberger, S. Implications of Diesel Emissions Control Failures to Emission Factors and Road Transport NOx Evolution. Atmos. Environ. 2016, 141, 542–551. [Google Scholar] [CrossRef]
- Lyu, P.; Wang, P.S.; Liu, Y.; Wang, Y. Review of the Studies on Emission Evaluation Approaches for Operating Vehicles. J. Traffic Transp. Eng. 2021, 8, 493–509. [Google Scholar] [CrossRef]
- Davison, J.; Rose, R.A.; Farren, N.J.; Wagner, R.L.; Wilde, S.E.; Wareham, J.V.; Carslaw, D.C. Gasoline and Diesel Passenger Car Emissions Deterioration Using On-Road Emission Measurements and Measured Mileage. Atmos. Environ. X 2022, 14, 100162. [Google Scholar] [CrossRef]
- Chen, Y.; Borken-Kleefeld, J. NOx Emissions from Diesel Passenger Cars Worsen with Age. Environ. Sci. Technol. 2016, 50, 3327–3332. [Google Scholar] [CrossRef]
- Boveroux, F.; Cassiers, S.; De Meyer, P.; Buekenhoudt, P.; Bergmans, B.; Idczak, F.; Jeanmart, H.; Verhelst, S.; Contino, F. Impact of Mileage on Particle Number Emission Factors for EURO5 and EURO6 Diesel Passenger Cars. Atmos. Environ. 2021, 244, 117975. [Google Scholar] [CrossRef]
- Yu, T.; Li, K.; Wu, Q.; Yao, P.; Ke, J.; Wang, B.; Wang, Y. Diesel Engine Emission Aftertreatment Device Aging Mechanism and Durability Assessment Methods: A Review. Atmosphere 2023, 14, 314. [Google Scholar] [CrossRef]
- Thirumalini, S.; Malemutt, P. Investigations on Anti-Tampering of Diesel Particulate Filter. Mater. Today Proc. 2019, 46, 4988–4992. [Google Scholar] [CrossRef]
- Bolboaca, R.; Haller, P.; Kontses, D.; Papageorgiou-Koutoulas, A.; Doulgeris, S.; Zingopis, N.; Samaras, Z. Tampering Detection for Automotive Exhaust Aftertreatment Systems Using Long Short-Term Memory Predictive Networks. In Proceedings of the 2022 IEEE European Symposium on Security and Privacy Workshops (EuroS&PW), Genoa, Italy, 6–10 June 2022; pp. 358–367. [Google Scholar] [CrossRef]
- Smit, R.; Bainbridge, S.; Kennedy, D.; Kingston, P. A Decade of Measuring On-Road Vehicle Emissions with Remote Sensing in Australia. Atmos. Environ. 2021, 252, 118317. [Google Scholar] [CrossRef]
- Lee, T.; Shin, M.; Lee, B.; Chung, J.; Kim, D.; Keel, J.; Lee, S.; Kim, I.; Hong, Y. Rethinking NOx Emission Factors Considering On-Road Driving with Malfunctioning Emission Control Systems: A Case Study of Korean Euro 4 Light-Duty Diesel Vehicles. Atmos. Environ. 2019, 202, 212–222. [Google Scholar] [CrossRef]
- Hu, S.; Deng, B.; Wu, D.; Hou, K. Energy Flow Behavior and Emission Reduction of a Turbo-Charging and EGR Non-Road Diesel Engine Equipped with DOC and DPF under NRTC (Non-Road Transient Cycle). Fuel 2021, 305, 121571. [Google Scholar] [CrossRef]
- Giechaskiel, B.; Forloni, F.; Carriero, M.; Baldini, G.; Castellano, P.; Vermeulen, R.; Kontses, D.; Fragkiadoulakis, P.; Samaras, Z.; Fontaras, G. Effect of Tampering on On-Road and Off-Road Diesel Vehicle Emissions. Sustainability 2022, 14, 6065. [Google Scholar] [CrossRef]
- Rešetar, M.; Pejić, G.; Ilinčić, P.; Kozarac, D.; Lulić, Z. Increase in Nitrogen Oxides Due to Exhaust Gas Recirculation Valve Manipulation. Transp. Res. Part D Transp. Environ. 2022, 109, 103391. [Google Scholar] [CrossRef]
- Shaw, S.; Van Heyst, B. An Evaluation of Risk Ratios on Physical and Mental Health Correlations Due to Increases in Ambient Nitrogen Oxide (NOx) Concentrations. Atmosphere 2022, 13, 967. [Google Scholar] [CrossRef]
- Wan Mahiyuddin, W.R.; Ismail, R.; Mohammad Sham, N.; Ahmad, N.I.; Nik Hassan, N.M.N. Cardiovascular and Respiratory Health Effects of Fine Particulate Matters (PM2.5): A Review on Time Series Studies. Atmosphere 2023, 14, 856. [Google Scholar] [CrossRef]
- Lasek, J.A.; Lajnert, R. On the Issues of NOx as Greenhouse Gases: An Ongoing Discussion…. Appl. Sci. 2022, 12, 10429. [Google Scholar] [CrossRef]
- Alexander, D.; Schwandt, H. The Impact of Car Pollution on Infant and Child Health: Evidence from Emissions Cheating. Rev. Econ. Stud. 2022, 89, 2872–2910. [Google Scholar] [CrossRef]
- Rešetar, M.; Pejić, G.; Ilinčić, P.; Lulić, Z. A New Method for Emission Control System Malfunction Detection During the Periodic Technical Inspection. In Proceedings of the 17th International Conference on Environmental Science and Technology, Athens, Greece, 1–4 September 2021. [Google Scholar]
- Roman, A.S.; Genge, B.; Duka, A.V.; Haller, P. Privacy-Preserving Tampering Detection in Automotive Systems. Electronics 2021, 10, 3161. [Google Scholar] [CrossRef]
- Rešetar, M.; Pejić, G.; Lulić, Z. Changes and Trends in the Croatian Road Vehicle Fleet—Need for Change of Policy Measures. Transp. Policy 2018, 71, 92–105. [Google Scholar] [CrossRef]
- Swab, C.; Allen, P.; Armitage, S.; Biberic, A. 2014 Residential Wood Combustion Survey: Results Overview and Spatial Allocation of Emissions Estimates. Atmos. Environ. 2019, 198, 12–22. [Google Scholar] [CrossRef]
- Lončarević, Š.; Ilinčić, P.; Šagi, G.; Lulić, Z. Development of a Spatial Tier 2 Emission Inventory for Agricultural Tractors by Combining Two Large-Scale Datasets. Sustainability 2023, 15, 13020. [Google Scholar] [CrossRef]
- EEA. EMEP/EEA Air Pollutant Emission Inventory Guidebook; 13/2019; Publications Office of the European Union: Luxembourg, 2019; ISBN 978-92-9480-098-5. [Google Scholar]
- Attia, Y.; Soori, P.K.; Ghaith, F. Analysis of Households’ E-Waste Awareness, Disposal Behavior, and Estimation of Potential Waste Mobile Phones towards an Effective E-Waste Management System in Dubai. Toxics 2021, 9, 236. [Google Scholar] [CrossRef]
- Vijay Kumar, M.; Sudhakara Reddy, S.; Mallikarjuna, K. Experimental Investigation of B20 Blend in the DI Diesel Engine with a Modification of Smaller Orifice Injection Nozzle and after Treatment Systems (EGR+DPF). Int. J. Ambient. Energy 2022, 43, 4878–4892. [Google Scholar] [CrossRef]
- Kadijk, G.; Elstgeest, M.; Ligterink, N.E.; van der Mark, P.J. Investigation into a Periodic Technical Inspection (PTI) Test Method to Check for Presence and Proper Functioning of Diesel Particulate Filters in Light-Duty Diesel Vehicles—Part 2; TNO: Delft, The Netherlands, 2017. [Google Scholar]
- European Parliament, Council of the European Union. Directive 2014/45/EU of the European Parliament and of the Council of 3 April 2014 on Periodic Roadworthiness Tests for Motor Vehicles and Their Trailers and Repealing Directive 2009/40/EC. Off. J. Eur. Union 2014, 57, 51–128. Available online: https://eur-lex.europa.eu/eli/dir/2014/45/oj (accessed on 3 January 2024).
- Buekenhoudt, P.; Müller, G.; Mäurer, H.-J.; Sánchez González, A.; Stephenson, J.; Multari, A.; Pettelet, G.; Schulz, W.H. CITA SET II Project: Sustainable Emission Test for Diesel Vehicles Involving NOx Measurements; CITA: Brussels, Belgium, 2019. [Google Scholar]


Disclaimer/Publisher’s Note: The statements, opinions and data contained in all publications are solely those of the individual author(s) and contributor(s) and not of MDPI and/or the editor(s). MDPI and/or the editor(s) disclaim responsibility for any injury to people or property resulting from any ideas, methods, instructions or products referred to in the content. |
© 2024 by the authors. Licensee MDPI, Basel, Switzerland. This article is an open access article distributed under the terms and conditions of the Creative Commons Attribution (CC BY) license (https://creativecommons.org/licenses/by/4.0/).