Abstract
Olive mill wastes are some of the most important waste streams in Mediterranean countries, such as Greece, and their uncontrolled disposal without treatment imposes serious environmental impacts. In the last few decades, the European Union has defined the framework for a sustainable circular economy, aiming for viable waste treatment solutions. Under this scope, anaerobic digestion could be a remarkable solution for efficiently reducing waste organic matter and producing green energy, at the same time. In this study, the economic sustainability of an anaerobic digestion unit for olive mill effluents was assessed. It was found that a centralized treatment plant that can process liquid olive mill effluents during the olive harvesting season and other agro-industrial by-products (such as fruit and vegetable waste) for the rest of the year could be a viable solution, with waste capacities of 780 m3OMW d−1 and 245 kgFVW d−1. The internal rate of return was estimated at 6%, the net present value was estimated to be EUR 2 million, while the payback period was calculated to be 12 years. Furthermore, through the sensitivity analysis, the selling price of the electricity produced and the productivity of the waste processed in the plant alongside the olive mill wastewater were identified as the main factors affecting the viability of the process. The findings of this study can be applied in the development of a biomass-processing facility, taking into consideration the economic feasibility and the processing of challenging-to-treat wastes to generate green energy.
1. Introduction
Historically, biogas is mainly considered a by-product in sanitary landfills. In recent decades, the renewable energy market has grown to encompass this product, based on the two main advantages of anaerobic digestion: reducing waste streams and simultaneously producing energy and organic fertilizers [1].
Several industries and investors consider biogas production through anaerobic digestion as a high-risk investment, as there are large variations in supply and feedstock characteristics and operational problems due to the low moisture content of certain waste streams [2]. For this reason, many countries have enacted laws to encourage individuals to invest in this sector.
Although widely studied, anaerobic digestion has not been adopted by many countries as a technology of treating waste and producing energy [3]. Europe is a leader in the use of anaerobic digestion, with the introduction of strict environmental regulations for waste management [4]. Asia has the largest number of installed anaerobic digesters (about 0.5 million domestic digesters in 2012 [5]), with most of them being small-scale and capable of providing energy for cooking and lighting to small communities [6]. The United States of America has fewer anaerobic digestion plants installed, with the total number steadily increasing. Only a percentage of 1% (about 240 units) of confined animal feeding operations have installed anaerobic digesters in the USA [7]. All these variations in the implementation of anaerobic digestion are mainly related to socio-economic indicators, pre-existing installed structures, and the availability of new reliable waste treatment technologies [8].
In comparison, the installation of biogas production units is considered necessary for Greece to achieve the targets set by the Renewable Energy Roadmap [9]. The EU criteria, explicitly described in Directive 2009/28/EC, require that the contribution of renewable energy sources to the country’s total energy consumption should be 18% by 2025 [10]. The Greek electricity generation sector is largely based on fossil fuels, the majority of which are imported [11]. Around 54% of the country’s energy needs are covered by petroleum-based products, which is quite high compared with the EU average of 33.4% [12]. Apart from the fact that a large part of these fossil fuels is used as transportation fuel, significant quantities are converted into electricity. In particular, the Greek islands, which are not connected to the grid, produce their electricity from diesel power stations. Several challenges can occur with the installation of anaerobic digestion units in Greece, mainly due to poor design or maintenance (leakage) and N2O formation from nitrogen removal [13]. For this reason, only a few projects for biomass energy production have been carried out in the country, mainly for the management of municipal solid waste or excess sludge in wastewater treatment plants. The installed biomass-derived electricity capacity is estimated to be 57 MW for 12 individual projects, while the target for biomass in Greece for 2025 is 350 MW [14].
Olive oil industry effluents are produced during olive oil production in two-phase and three-phase separation systems. They are significantly organically loaded industrial effluents having chemical oxygen demand (COD) values between 45 and 170 g L−1, biochemical oxygen demand (BOD5) values between 35 and 110 g L−1, and suspended solids concentrations in the range of 1 to 9 g L−1 [15,16]. Moreover, significant quantities of phenolic compounds and long-chain fatty acids, which, in high concentrations, are toxic to micro-organisms and plants, are present in this type of waste [17]. To this end, it is estimated that 1 m3 of olive oil by-product effluent pollutes the environment as much as 100 to 200 m3 of domestic wastewater [18]. For this reason, the treatment of this type of waste can provide a substantial reduction of environmental burdens alongside energy production.
The first criterion for a waste treatment unit’s installation is its economic viability. There are different methodologies for the economic evaluation of a process/investment, with most of them based on the idea of the return of the investment cost within its lifetime, the profit margin, and whether it is attractive enough for an investor [19]. For waste treatment processes, the investment needs to be more efficient (or less costly) than alternatives, as the management of such streams is mandatory [20]. For example, the direct disposal of a waste stream into the environment may have minimal costs, but may not be acceptable if it incurs a fine or the revocation of a company’s license. It is therefore obvious that an appropriate institutional framework is necessary to promote more environmentally acceptable solutions. The economic assessment of a process reflects its interaction with the economic environment through an economic balance [21,22].
In the present work, a techno-economic assessment of an anaerobic digestion plant treating olive mill effluents in a high-rate UASB-type bioreactor was carried out. For this analysis, experimental data from the literature were used in order to predict the reactor’s performance. Several studies have been carried out regarding the installation of anaerobic digestion plants for olive mill by-products. In the study by Tasionas and Dounavis [23], the analysis of the investment plan for the construction of an olive oil industry by-products treatment plant in the region of Corfu was evaluated for its economic feasibility. In the same work, a payback period of 7 years was estimated for a plant with a total investment of 19.6 million euros and a total capacity of 5 MW. Furthermore, the paper by Orive et al. [24] presents the anaerobic digestion of olive mill wastes mixed with piggery wastes. The proposed plant exhibited an IRR equal to 13.7% and a payback period of 7 years. Even if anaerobic digestion, as an industrial waste treatment method, has been studied in the aforementioned works, there is no clear reference to an economically sustainable solution for olive mill effluent treatment and the factors that affect the process’s viability. In fact, olive mill wastewater is a difficult-to-biodegrade waste via anaerobic digestion without pretreatment because of its high phenolic content [25]. For this reason, the present work may provide a positive assay for a viable alternative to olive effluent treatment. The results of the present work can be used for designing a biomass processing plant based on its economic viability and processing of difficult-to-treat wastes to produce useful products and electricity that can be supplied directly to the existing network.
2. Materials and Methods
The process design of the industrial-scale anaerobic digestion system was carried out using the lab-scale and pilot-scale results from previous work by the authors [26] for a UASB reactor, as an example. More specifically, only the reactor’s conditions (temperature, recirculation velocity, etc.), as well as the reactor’s performance (productivity and concentration of digestate in several compounds), were standardized from the citation in order to design a full-scale industrial anaerobic digestion system. UASB reactors present several advantages, such as a low sludge concentration in the effluent and low hydraulic retention times [27]. The equipment parts used for the process were a feed tank, an anaerobic digestion reactor, a digestate collection tank, desulphurization, and an electricity and thermal energy production unit. Different equipment parts were used for the reactor’s operations (feeding, temperature control, etc.), biogas purification (desulphurization column), and energy production (CHP unit). The capacity of the feed tank was set to be capable of holding two days of reactor feed. The storage capacity of the anaerobic digestate storage tank was set at 15 days of reactor digestate production, assuming that, after this period, the digestate would be collected for use as liquid fertilizer without any post-treatment [28]. An empirical formula for large tanks was used to estimate the feed and effluent tank cost (Cp,tank) in euros according to Kookos et al. [29] (Equation (1)), where V indicates the tank’s volume. It is worth noting that the cost equations presented herein are dependent on crucial design parameters in order to estimate the total cost for different waste capacities.
Reinforced concrete was chosen for the construction of the reactor (digester). First, the digester frame needs to be constructed and then all the other parts must be added to create the whole digester unit. During the construction of the frame, anti-corrosion shielding was assumed with materials such as bentonite that should be placed at the point of contact between the base of the digester and its walls and epoxy paint that should be applied to the entire internal surface. Then, thermal insulation was modeled using polyurethane materials, 10 cm wide, placed on the outer surface of the frame, with the whole structure being coated externally with a 1 mm thick aluminum sheet for protection. Finally, in order to achieve the operation of a fully equipped digester, the heat exchanger, which provides the necessary thermal energy to maintain the substrate temperature at the appropriate level for the unit operation, the agitators, which mix the reactor broth, and the lid, which will be installed on the top of the digester to collect the biogas, were taken into account. Based on the above, the cost of the reactor (Cp,reactor) was calculated from the empirical Equation (2) [30], where Vr represents the reactor’s volume (in m3).
To purify the biogas produced, a system that includes a desulphurization tower and a combined heat and power (CHP) unit for energy productivity up to 65 kW was designed. Activated carbon as an adsorbent was assumed in the desulphurization column in order to remove most of the H2S contained in the produced biogas. For the design of the desulphurization column, it was assumed that the adsorption capacity of activated carbon was 1.41 gH2S kgcarbon−1 [31] and the average adsorption bed pore diameter was 1.1 cm. The cost of the column (Cp,column) was estimated from the empirical Equation (3), where Vc indicates the column volume in m3 [29].
A CHP unit mainly includes a boiler for thermal energy production, a turbine, and a generator of electricity [32]. For the design of the CHP unit, an estimation of the cost (Cp,CHP) as a function of the capacity was performed using market prices. Equation (4) was considered as the final costing equation:
Pump costs (Cp,pump) were estimated using Equations (5) and (6) [29].
where Q indicates the volumetric flow required [m3 s−1] and Δh represents the manometric height difference multiplied by the gravitational acceleration (9.81 m s−2).
All the equations were normalized using the CEPCI of 2022 equal to 816.
The fixed capital investment (FCI) was calculated through the equipment cost, as presented in detail in Table 1, and then using Equation (7).

Table 1.
Methodology for FCI calculation [33].
The annual total treatment cost (TTC) was calculated using Table 2 and then Equation (8) [33], assuming that the building’s lifetime was 30 years.
where Crm represents the cost of all raw materials (, Col represents the direct labor costs, and Cb represents the building construction costs. The transport costs from the olive mill to the waste treatment plant were included in raw materials costs. The total number of olive mills per square kilometer was estimated for the region of Western Greece in order to determine the transport cost’s function. The total transport kilometers were calculated by determining the necessary number of olive mills needed to support the plant’s waste capacity. For that reason, the transport cost was considered to increase for a large plant capacity, since more waste needs to be treated in the unit. The exponential increase may be attributed to the large number of olive mills for the needs of a large-capacity unit that leads to a longer distance from the olive mill to the waste treatment plant. The function used to calculate ton-kilometers as a function of plant capacity is shown in Figure 1. The cost per one ton-kilometer was set at 0.1 EUR tkm−1, while the cost of NaHCO3 was set at 0.29 EUR m−3 feed, using current market prices.
Table 2.
Methodology for TTC calculation [33].
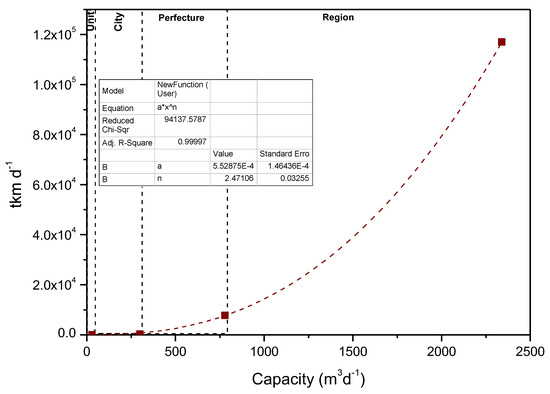
Figure 1.
Waste transportation cost function.
Regarding the labor cost estimation, the number of employees for plant operation was estimated using Equation (9) [29].
where Y indicates the working hours for plant capacity X in m3 d−1.
The total annual revenue (TAR) of the company was calculated from electricity sale and the liquid fertilizer sale (process effluent) (Equation (10)). The selling price of electricity from biomass according to Greek legislation was set at 204 EUR per MWel. The selling price of the fertilizer (fert) was estimated from the effluent quantities in nitrogen, phosphorus, and potassium and the prices of the corresponding fertilizers (0.95 EUR kg−1 for N, 1.0 EUR kg−1 for P, and 0.72 EUR kg−1 for K). This price was estimated at 0.77 EUR kg−1.
The first scenario studied (S1) was the design of an olive mill waste treatment plant that operates for only 4 months per year (during the olive oil production period), since only during this period is there a need for waste treatment. In order to ensure the sustainability of the plant, a second alternative scenario (S2) was proposed to exploit the installed equipment for a longer period. For this reason, a secondary waste was used for treatment in the designed unit. More specifically, in this study, the waste used to operate the plant during the rest of the year was a mixture of fruit and vegetable waste (FVW), according to the work of Tsigkou et al. [34]. Several design parameters were used from the aforementioned study, such as the system’s OLR and digester’s performance, as presented in Table 3. It should be noted that, in an actual application, FVW can be replaced by other agro-industrial wastes generated in the area in the vicinity of the installed plant. The system characteristics and performance for the treatment of the two wastes are presented in Table 3.
Table 3.
Waste characteristics used in the alternative scenarios for the techno-economic analysis [26,34].
Finally, according to Greek legislation (Law 3299/2004) for investment projects in Greece in the field of electricity production from renewable energy sources (geothermal energy, wind farms, parallel electricity, and heat production projects), a subsidy can be granted to reduce the risk of the investment. This subsidy can contribute to the plant’s sustainability by reducing the amount of the initial loan. For this analysis, it was assumed that the proposed plant would be constructed in the Peloponnese region and that it would fall under the category of medium-sized enterprises. The subsidy provided for this zone amounted to 40% of the initial investment. A percentage of 25% of FCI was covered by private funds, since this parameter is crucial in order to receive the subsidy from the Greek government. The remaining percentage (35% of the FCI), as well as the working capital (15% of the FCI), was covered by a loan at a fixed interest rate of 8%. Finally, income tax was set at 20% of the profits. The internal rate of return (IRR) for each investment plan was estimated using Equation (11).
where k indicates the current operation year of the plant and n represents the total operation period of the plant (years).
The net present value of the investment was estimated using Equation (12) setting the minimum acceptable rate of return (MARR) to 4%.
The payback period was estimated as the timespan needed for the achievement of a positive cash flow [29].
3. Results & Discussion
3.1. Investment Plan Analysis
The analysis of FCI and the FCI normalized by the feed volume per month of operation per year for different OMW treatment capacities is presented in Figure 2. The capacity of one olive mill plant was set at 30 m3 d−1 of olive mill waste, while the tenfold amount was set for the capacity of a city, since 10 olive mills could operate in an average-sized city. The minimum FCI for one olive mill was estimated at 800,000 EUR and about 20% of this cost was derived from the purchase and installation of the anaerobic digestion reactor. It is worth noting that the FCI per cubic meter of waste to be treated decreases sharply when the capacity increases, while it stabilizes at 34 EUR per cubic meter of feed for S1 and 20 EUR per cubic meter of feed for S2 for the capacity of a prefecture (500–760 m3 d−1). The increased FCI-normalized values in small nominal capacities may be attributed to the significance of the cost of equipment parts, such as pumps and tanks, compared with the reactor cost. In large nominal capacities, the FCI value exhibited a linear correlation with the volume of the treated OMW. For this reason, the normalized FCI value stabilizes. The significant decrease in S2 FCI compared with S1 may be attributed to the longer operation period of the plant, even with the use of waste with lower productivity than that of olive mill waste. The sharp decrease exhibited in Figure 2b (normalized diagram) was attributed to the high equipment cost in relation to the small feed capacity of the system. This is in the same direction as the fact that larger-capacity units tend to have a smaller equipment cost per amount of feed material. It is worth noting that the cost for several equipment parts, like tanks and pumps, represents a higher percentage of the FCI for small capacities due to the economy of scale.
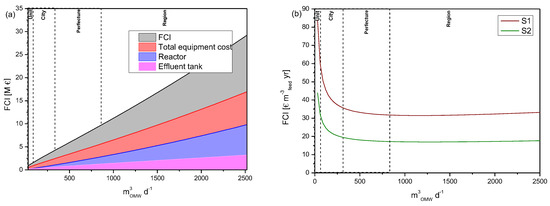
Figure 2.
FCI value (a) and normalized FCI value (b) as a function of OMW treatment capacity (m3waste d−1) for the studied scenarios.
Similar trends were exhibited for the waste treatment costs in the two alternative scenarios (Figure 3). A minimum was achieved for both scenarios at a capacity of one prefecture with numerical values of 8 EUR per cubic meter of waste for S1 and 4.3 EUR per cubic meter of waste for S2. It was shown that about 15% of the total treatment cost was attributed to the equipment’s depreciation, while about 5% was caused by the purchase of NaHCO3 to adjust the alkalinity for S1, while for the second scenario, this percentage dropped to 0.5%, since the addition of this chemical was not required for the stable operation of the reactor fed with FVW.
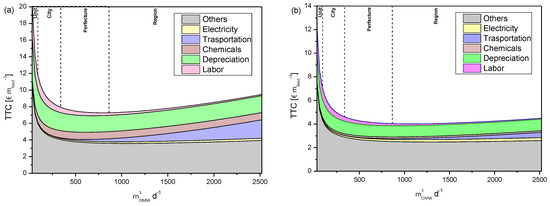
Figure 3.
Total treatment cost as a function of unit capacity (m3waste d−1) for the studied scenarios S1 (a) and S2 (b). The term “Others” contains the unreferred costs that are presented in Table 2.
The waste transportation costs to the treatment plant are estimated to be negligible for a plant that operates with the waste of one olive mill, while a sharp increase was exhibited as the treatment plant became more centralized, eventually covering 25% of the total treatment costs. For this reason, a continuous upward trend in total processing costs was identified with increasing capacity above the level of a prefecture.
Based on the above, four different investment plans were developed for each studied scenario (Figure 4 and Figure 5). Each investment plant was tested in different capacities at the level of one olive mill (30 m3 d−1) and centralized processing solutions at the level of a city (300 m3 d−1), a prefecture (780 m3 d−1), and a region (2300 m3 d−1). The plant construction was set to 1 year, since no profit was considered for this period.
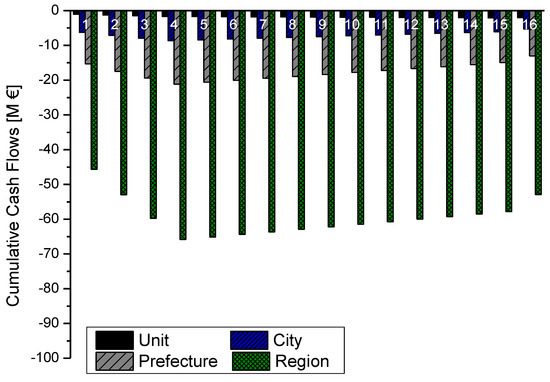
Figure 4.
Annual cumulative cash flows as a function of the operation year for studied scenario S1.
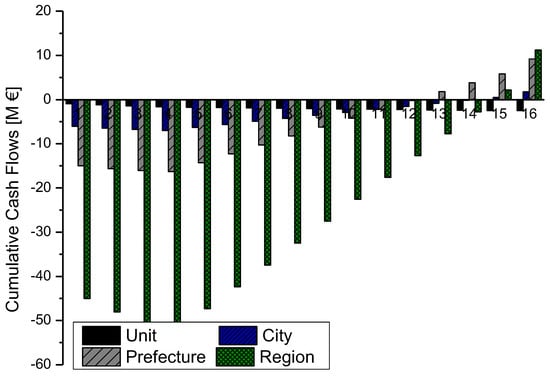
Figure 5.
Annual cumulative cash flows as a function of the operation year for studied scenario S2.
Regarding S1, negative cumulative cash flows were observed for each different capacity, making the investment unsustainable. The main reason for this fact was the very short plant operating period through the year, due to the seasonality of the waste used as feedstock. Similar results were observed in other studies where the treatment of three-phase olive mill wastewater in a plant with a capacity of 17,500 tons per day resulted in an annual deficit of 14,000 EUR [35]. It is worth noting that this capacity is reflected in Figure 4 at the level of a region.
Regarding the S2 scenario (Figure 5), an increase in cumulative cash flows was exhibited, which became positive after the 12th year of operation for capacities at the city, prefecture, and region levels. This investment plan does not include revenues from the thermal energy produced as there is no installed district heating network in the region of Peloponnese. The addition of this extra revenue may increase the viability of the unit. The economic parameters for S2 investment plans are presented in Table 4. The optimal plant capacity (IRR maximization) was exhibited at the prefecture level for a capacity of 780 m3 OMW per day, with an IRR of 6% and a payback period of 12 years. This plant could produce 3.4 MW of electricity during OMW treatment and 1.9 MW during FVW treatment, while the FCI, TPC, and TAR of the unit were estimated to be 13.6 M EUR, 4.5 M EUR, and 6.1 M EUR respectively. In a study by Li et al. [36], a higher IRR (about 20%) was estimated compared to the present study. However, in the same study, revenues from thermal energy were considered, and there was no calculation of the costs for the installation of a district heating network. The addition of this revenue would potentially increase this ratio in the present study as well. Moreover, in a study by Aui et al. [37], regarding the treatment of agri-food effluents (mainly manure) in small-scale anaerobic digestion plants, an IRR between 3% and 5% for 1 MW of electricity production was observed, a result similar to the results of the present study.
Table 4.
Economic parameters for the investment plans of studied scenario S2.
3.2. Sensitivity Analysis
The S2 investment plant with the optimal capacity (780 m3 OMW d−1) was tested for its sensitivity to specific system input parameters. The scope of this strategy was to highlight the input parameters to which the system exhibited the maximum variations in the output response. The output control parameter was the net present value after the end of the equipment life for the optimal capacity. The different input parameters (sell price of electricity, productivity of secondary substrate, sell price of fertilizer, etc.) were modified by ±20% of their proposed value. Different NPV values were estimated for different values of the input parameters, as presented in Figure 6. The NPV of the system was observed as highly sensitive to the selling price of the electricity produced, with a 700% response increase with a 20% increase in selling price, as presented in Figure 6. This fact is indicative of the increased viability of these units if there is support from the government regarding the electricity purchase price.
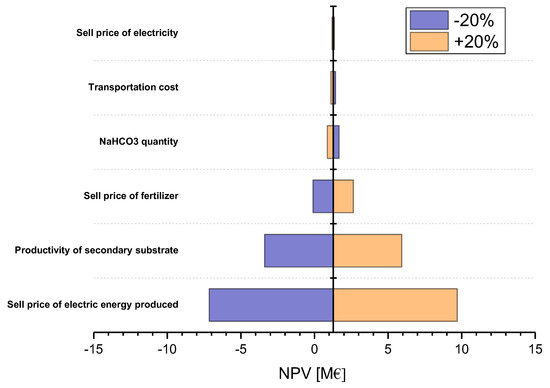
Figure 6.
Sensitivity analysis of the system as a function of different input variables.
Moreover, the system was proven sensitive to the productivity of the substrate used for the plant operation during the non-olive-harvesting period (secondary substrate). According to this observation, the direct process dependence on different wastes is evident. In rural areas, various types of manure could potentially be used as a secondary substrate, but also plants that have exhibited high yields regarding energy production, such as artichoke and prickly pear [38,39].
Finally, the NPV of the system exhibited a small variation with the change in raw material prices. Particularly, there were small changes in the investment NPV when the costs of both transportation (fuel) and electricity change. This is an optimistic result considering the stability of the system with the fluctuations in commodity prices, which are nowadays highly variable.
4. Conclusions
To this day, the treatment of olive mill effluents poses a serious risk to the stability of Mediterranean ecosystems. Greece is a major olive oil producing country, with significant production of olive mill effluents, and, at the same time, lags behind the EU regulations regarding the percentage of renewable energy in the energy mixture of EU countries. The production of biomass energy from these effluents seems to solve both problems. The viability of an olive mill waste treatment plant is a crucial stage, both for the treatment of these wastes and for sustainable energy production from biomass. In this study, a techno-economic analysis of two different scenarios for the treatment of olive mill wastewater, either as a single substrate or using a second substrate during the months when the waste is not produced, was carried out. This study shows that a centralized treatment plant at the prefecture level (780 m3 d−1) could be the optimal sustainable solution, with an IRR equal to 6%, as for higher capacities, the transportation cost increased significantly. Finally, the sensitivity analysis showed that the selling price of the produced energy was a crucial factor for the unit’s sustainability. From the analysis presented above, anaerobic digestion appears to be economically viable, a fact that may be further enhanced by increased support by regulatory bodies, or by the increasing prices of fossil-derived energy.
Author Contributions
Conceptualization, G.M. and D.Z.; methodology, G.M.; software, G.M.; validation, G.M. and D.Z.; formal analysis, G.M.; investigation, G.M.; resources, C.Z. and M.K.; data curation, G.M.; writing—original draft preparation, G.M.; writing—review and editing, D.Z. and M.K.; visualization, G.M.; supervision, C.Z. and M.K.; project administration, M.K.; funding acquisition, M.K. and C.Z. All authors have read and agreed to the published version of the manuscript.
Funding
This work was co-financed by the European Union and Greek national funds through the Regional Operational Program “Western Greece 2014–2020” under the Call “Regional Research and Innovation Strategies for Smart Spe-cialization (RIS3) in Agro-food” (project: DER6-0021057 entitled “Integrated Energy and Environmental Exploita-tion of Olive Oil Production by-products, OLIVENERGY”). The publication fees of this manuscript have been fi-nanced by the Research Council of the University of Patras.
Institutional Review Board Statement
Not Applicable.
Informed Consent Statement
Not Applicable.
Data Availability Statement
Data are contained within the article.
Conflicts of Interest
All authors declare that they have received research grants from the funding source reported under ‘Funding’. Author Constantina Zafiri was employed by the company Green Technologies Ltd. All authors declare that the research was conducted in the absence of any other commercial or financial relationships that could be construed as a potential conflict of interest.
Abbreviations
| CHP | Combined heat and power unit |
| COD | Chemical oxygen demand |
| FCI | Fixed capital investment |
| FVW | Fruit and vegetable waste |
| HRT | Hydraulic retention time |
| IRR | Internal rate of return |
| MARR | Minimum acceptable rate of return |
| NPV | Net present value |
| OLR | Organic loading rate |
| OMW | Olive mill wastewater |
| TTC | Total treatment cost |
References
- Varjani, S.; Upasani, V.N. Bioaugmentation of Pseudomonas Aeruginosa NCIM 5514–A Novel Oily Waste Degrader for Treatment of Petroleum Hydrocarbons. Bioresour. Technol. 2021, 319, 124240. [Google Scholar] [CrossRef]
- Cusenza, M.A.; Longo, S.; Cellura, M.; Guarino, F.; Messineo, A.; Mistretta, M.; Volpe, M. Environmental Assessment of a Waste-to-Energy Practice: The Pyrolysis of Agro-Industrial Biomass Residues. Sustain. Prod. Consum. 2021, 28, 866–876. [Google Scholar] [CrossRef]
- Chen, H.; Yang, T.; Shen, Z.; Yang, E.; Liu, K.; Wang, H.; Chen, J.; Sanjaya, E.H.; Wu, S. Can Digestate Recirculation Promote Biohythane Production from Two-Stage Co-Digestion of Rice Straw and Pig Manure? J. Environ. Manag. 2022, 319, 115655. [Google Scholar] [CrossRef]
- Koyande, A.K.; Chew, K.W.; Lim, J.-W.; Lam, M.-K.; Ho, Y.-C.; Show, P.-L. Biorefinery of Chlorella Sorokiniana Using Ultra Sonication Assisted Liquid Triphasic Flotation System. Bioresour. Technol. 2020, 303, 122931. [Google Scholar] [CrossRef]
- Surendra, K.C.; Takara, D.; Jasinski, J.; Kumar Khanal, S. Household Anaerobic Digester for Bioenergy Production in Developing Countries: Opportunities and Challenges. Environ. Technol. 2013, 34, 1671–1689. [Google Scholar] [CrossRef]
- Mohanty, S.S.; Koul, Y.; Varjani, S.; Pandey, A.; Ngo, H.H.; Chang, J.-S.; Wong, J.W.C.; Bui, X.-T. A Critical Review on Various Feedstocks as Sustainable Substrates for Biosurfactants Production: A Way towards Cleaner Production. Microb. Cell Fact. 2021, 20, 1–13. [Google Scholar] [CrossRef]
- Cowley, C.; Brorsen, B.W. Anaerobic Digester Production and Cost Functions. Ecol. Econ. 2018, 152, 347–357. [Google Scholar] [CrossRef]
- Mishra, B.; Varjani, S.; Agrawal, D.C.; Mandal, S.K.; Ngo, H.H.; Taherzadeh, M.J.; Chang, J.-S.; You, S.; Guo, W. Engineering Biocatalytic Material for the Remediation of Pollutants: A Comprehensive Review. Environ. Technol. Innov. 2020, 20, 101063. [Google Scholar] [CrossRef]
- European Commission. Roadmap 2050; European Commission: Brussels, Belgium, 2011. [Google Scholar]
- Parliament, E. Directive 2009/28/EC of the European Parliament and of the Council of 23 April 2009 on the Promotion of the Use of Energy from Renewable Sources and Amending and Subsequently Repealing Directives 2001/77/EC and 2003/30/EC. Off. J. Eur. Union L 2009, 140, 47. [Google Scholar]
- Orfanos, N.; Mitzelos, D.; Sagani, A.; Dedoussis, V. Life-Cycle Environmental Performance Assessment of Electricity Generation and Transmission Systems in Greece. Renew. Energy 2019, 139, 1447–1462. [Google Scholar] [CrossRef]
- Rekleitis, G.; Haralambous, K.-J.; Loizidou, M.; Aravossis, K. Utilization of Agricultural and Livestock Waste in Anaerobic Digestion (AD): Applying the Biorefinery Concept in a Circular Economy. Energies 2020, 13, 4428. [Google Scholar] [CrossRef]
- Prochaska, C.; Zouboulis, A. A Mini-Review of Urban Wastewater Treatment in Greece: History, Development and Future Challenges. Sustainability 2020, 12, 6133. [Google Scholar] [CrossRef]
- Alatzas, S.; Moustakas, K.; Malamis, D.; Vakalis, S. Biomass Potential from Agricultural Waste for Energetic Utilization in Greece. Energies 2019, 12, 1095. [Google Scholar] [CrossRef]
- Niaounakis, M.; Halvadakis, C.P. Olive Processing Waste Management: Literature Review and Patent Survey; Elsevier: Amsterdam, The Netherlands, 2006. [Google Scholar]
- Manthos, G.; Dareioti, M.; Zagklis, D.; Kornaros, M. Using Biochemical Methane Potential Results for the Economic Optimization of Continuous Anaerobic Digestion Systems: The Effect of Substrates’ Synergy. Renew. Energy 2023, 211, 296–306. [Google Scholar] [CrossRef]
- Sousa, D.A.; Costa, A.I.; Alexandre, M.R.; Prata, J.V. How an Environmental Issue Could Turn into Useful High-Valued Products: The Olive Mill Wastewater Case. Sci. Total Environ. 2019, 647, 1097–1105. [Google Scholar] [CrossRef]
- Al-Hmoud, L.; Al-Saida, B.; Sandouqa, A. Olive Mill Wastewater Treatment: A Recent Review. Jordanian J. Eng. Chem. Ind. 2020, 3, 91–106. [Google Scholar]
- Chauvel, A.; Fournier, G.; Raimbault, C. Manual of Process Economic Evaluation; Editions Technip: Paris France, 2003; ISBN 2710808366. [Google Scholar]
- Rani, P.; Mishra, A.R.; Krishankumar, R.; Ravichandran, K.S.; Kar, S. Multi-Criteria Food Waste Treatment Method Selection Using Single-Valued Neutrosophic-CRITIC-MULTIMOORA Framework. Appl. Soft Comput. 2021, 111, 107657. [Google Scholar] [CrossRef]
- Buchner, G.A.; Zimmermann, A.W.; Hohgräve, A.E.; Schomäcker, R. Techno-Economic Assessment Framework for the Chemical Industry—Based on Technology Readiness Levels. Ind. Eng. Chem. Res. 2018, 57, 8502–8517. [Google Scholar] [CrossRef]
- Jeronen, E. Economic Sustainability. In Encyclopedia of Sustainable Management; Springer: Berlin/Heidelberg, Germany, 2023; pp. 1257–1263. [Google Scholar]
- Tasionas, A.; Dounavis, A.S. Techno-Economic Analysis of the Olive Oil Mills Waste Valorisation for Energy Production: A Case Study of Corfu. Environ. Res. Eng. Manag. 2019, 75, 18–29. [Google Scholar] [CrossRef]
- Orive, M.; Cebrián, M.; Zufia, J. Techno-Economic Anaerobic Co-Digestion Feasibility Study for Two-Phase Olive Oil Mill Pomace and Pig Slurry. Renew. Energy 2016, 97, 532–540. [Google Scholar] [CrossRef]
- Manthos, G.; Zagklis, D.; Zafiri, C.; Kornaros, M. Comparative Life Cycle Assessment of Anaerobic Digestion, Lagoon Evaporation, and Direct Land Application of Olive Mill Wastewater. Bioresour. Technol. 2023, 388, 129778. [Google Scholar] [CrossRef]
- Manthos, G.; Zagklis, D.; Papavasileiou, V.; Gkountou, N.A.; Saita, Z.; Zafiri, C.; Kornaros, M. High-Rate Upflow Anaerobic Sludge Blanket Bioreactor for the Treatment of Olive Mill Effluents: Laboratory and Pilot Scale Systems Investigation. Renew. Energy 2023, 217, 119215. [Google Scholar] [CrossRef]
- Chen, H.; Yuan, J.; Xu, Q.; Yang, E.; Yang, T.; Shi, L.; Liu, Z.; Yu, H.; Cao, J.; Zhou, Q. Swine Wastewater Treatment Using Combined Up-Flow Anaerobic Sludge Blanket and Anaerobic Membrane Bioreactor: Performance and Microbial Community Diversity. Bioresour. Technol. 2023, 373, 128606. [Google Scholar] [CrossRef]
- Koszel, M.; Lorencowicz, E. Agricultural Use of Biogas Digestate as a Replacement Fertilizers. Agric. Agric. Sci. Procedia 2015, 7, 119–124. [Google Scholar] [CrossRef]
- Kookos, Ι. Introduction to Chemical Plant Design; Tziola Publishing: Glyfada, Greece, 2009; ISBN 978-960-418-173-5. [Google Scholar]
- Papadiamantopoulos, M. Design and Techno-Economic Optimization of an Energy Recovery Plant for Agroindustrial Waste. 2012. Available online: https://nemertes.library.upatras.gr/items/8ac84f07-1425-4619-99d6-9fc99617cd77 (accessed on 2 February 2024).
- Sitthikhankaew, R.; Predapitakkun, S.; Kiattikomol, R.W.; Pumhiran, S.; Assabumrungrat, S.; Laosiripojana, N. Comparative Study of Hydrogen Sulfide Adsorption by Using Alkaline Impregnated Activated Carbons for Hot Fuel Gas Purification. Energy Procedia 2011, 9, 15–24. [Google Scholar] [CrossRef][Green Version]
- Lai, F.; Wang, S.; Liu, M.; Yan, J. Operation Optimization on the Large-Scale CHP Station Composed of Multiple CHP Units and a Thermocline Heat Storage Tank. Energy Convers. Manag. 2020, 211, 112767. [Google Scholar] [CrossRef]
- Peters, M.S.; Timmerhaus, K.D.; West, R.E. Plant Design and Economics for Chemical Engineers; McGraw-Hill: New York, NY, USA, 2003; Volume 4. [Google Scholar]
- Tsigkou, K.; Tsafrakidou, P.; Kopsahelis, A.; Zagklis, D.; Zafiri, C.; Kornaros, M. Used Disposable Nappies and Expired Food Products Valorisation through One-& Two-Stage Anaerobic Co-Digestion. Renew. Energy 2020, 147, 610–619. [Google Scholar]
- Mas Bolaños, M. Feasibility Study of Anaerobic Digestion of Olive Mill Wastewater for Energy Production. Case Study Applied to an Olive Oil Extraction Industry in Spain. Bachelor’s Thesis, Universitat Politècnica de Catalunya, Barcelona, Spain, 2017. [Google Scholar]
- Li, Y.; Han, Y.; Zhang, Y.; Luo, W.; Li, G. Anaerobic Digestion of Different Agricultural Wastes: A Techno-Economic Assessment. Bioresour. Technol. 2020, 315, 123836. [Google Scholar] [CrossRef]
- Aui, A.; Li, W.; Wright, M.M. Techno-Economic and Life Cycle Analysis of a Farm-Scale Anaerobic Digestion Plant in Iowa. Waste Manag. 2019, 89, 154–164. [Google Scholar] [CrossRef]
- de Diego-Díaz, B.; Peñas, F.J.; Fernández-Rodríguez, J. Sustainable Management of Lignocellulosic Wastes: Temperature Strategies for Anaerobic Digestion of Artichoke. J. Clean. Prod. 2021, 280, 124479. [Google Scholar] [CrossRef]
- Quiroz, M.; Varnero, M.T.; Cuevas, J.G.; Sierra, H. Cactus Pear (Opuntia Ficus-Indica) in Areas with Limited Rainfall for the Production of Biogas and Biofertilizer. J. Clean. Prod. 2021, 289, 125839. [Google Scholar] [CrossRef]


Disclaimer/Publisher’s Note: The statements, opinions and data contained in all publications are solely those of the individual author(s) and contributor(s) and not of MDPI and/or the editor(s). MDPI and/or the editor(s) disclaim responsibility for any injury to people or property resulting from any ideas, methods, instructions or products referred to in the content. |
© 2024 by the authors. Licensee MDPI, Basel, Switzerland. This article is an open access article distributed under the terms and conditions of the Creative Commons Attribution (CC BY) license (https://creativecommons.org/licenses/by/4.0/).