Abstract
This study mainly explores people’s environmental attitudes and perceptions and their motivations for protecting and improving ecosystem services in Italy. The environmental perceptions of people were explored through the New Ecological Paradigm (NEP) scale, a tool for gauging environmental consciousness and perceptions, especially in the context of ecological sustainability. Data were collected from a sample of more than 1500 respondents residing in Italy using computer-assisted web interviewing (CAWI). The results showed that respondents have a high level of environmental concern for most scale issues. The application of principal component analysis (PCA) to the respondents’ responses revealed the multidimensionality of the NEP scale: anti-anthropocentrism (pro-NEP items), human domination (pro-dominant social paradigm (DSP) items), and limits of nature. The results also showed that socio-demographic characteristics and people’s knowledge and beliefs are associated with a strong concern for nature, which can support ecosystem service conservation. Different cultural backgrounds may place varying emphasis on sustainability, conservation, or economic development.
1. Introduction
The loss of biodiversity and the deterioration of ecosystems due to critical drivers, such as climate change, expansion of urbanized areas, intensive livestock production, and wildlife trade, present new occasions for human interactions with pathogens such as viruses, bacteria, and fungi, which also increase the possibility of spreading diseases, such as coronavirus disease 2019 (COVID-19). This consequence is not completely surprising because emerging infectious diseases (EIDs) are expected. EIDs have been significantly increasing since 1940. The 1940s correspond to the agricultural revolution (or green revolution). During this era, it was possible to change the traditional agricultural production system from a system based on natural cycles to an actual intensive production system based on pesticides, fertilizers, and chemical utilization. If, on the one hand, the productivity change has provided the possibility of feeding a wider part of the global population and consequently guaranteed its increase and well-being; on the other hand, it has caused a constantly increasing need for natural space required for that development and has often been linked to environmental factors [1,2,3,4]. Even if the understanding of the mechanisms underlying EID occurrence remains rudimentary [5], emerging pandemics and, consequently, their economic impact, are increasing in frequency [6].
All the key drivers mentioned above have a deep impact on natural systems and ecosystems, which are constantly trying to adapt to the new pressures due to anthropogenic activities and, consequently, modifying their resilience [7,8].
Concerning the relationship between humans and nature, the COVID-19 pandemic has shown us how much they are interconnected. As reported by the Intergovernmental Science-Policy Platform on Biodiversity and Ecosystem Service [9], the same human activities (e.g., changes in how we use land, agriculture expansion, unsustainable trade, etc.) that drive climate change and biodiversity loss also drive pandemics. As stated by many experts, the excessive exploitation of ecosystem services can produce negative externalities, increasing the risks of infectious disease [10]. The scientific literature and scholars agree on the close relationship between humans, the environment, and health [11].
The pandemic crisis has exposed people to high risks of disease. However, the pandemic has also highlighted how important it is to invest in natural capital, for example, the protection of ecosystems, to convey safety benefits and enhance disease regulation. Restoring ecosystem services may limit the health harms transferred from animals to humans [10]. During 2020 and 2021, people appreciated nature and ecosystem services, especially those in their homes’ proximity, such as green spaces in urban areas, to help them face severe movement restrictions by governments promoting physical and psychic well-being [12]. Paradoxically, several limitations adopted to manage COVID-19 have brought positive ecological effects, such as significantly better air quality in dense urban areas [4]. Research by the Economist Intelligence Unit (2021) [13] showed that, globally, millions of people deemed nature and biodiversity loss a priority, which affected their behavior. Moreover, a study sponsored by the Boston Consulting Group interviewed more than 3000 respondents in eight countries during the pandemic crisis (the survey was conducted among a sample of 3249 respondents in Brazil, France, China, India, Indonesia, South Africa, the UK, and the US (see https://www.bcg.com/it-it/publications/2020/pandemic-is-heightening-environmental-awareness, access on 22 November 2023)), and 70% of them believed that anthropocentric activities create environmental damage and health issues. Investment in conservation that can prevent biodiversity loss and ecosystem service decline could provide economic benefits and improve the health crisis [14].
Ecosystem services, which comprise the benefits that ecosystems provide to people, play a key role in preserving and supporting human and economic well-being [15]. The Millennium Ecosystem Assessment in 2005 [16] identified four categories of ecosystem services: provisioning, regulating, supporting, and cultural services.
Therefore, exploring people’s opinions, concerns, and knowledge regarding the contributions of ecosystem services to human life today is even more essential to designing policies that will protect nature and improve sustainable environmental conservation. Ref. [17] indicate that the difficult task is to design an indicator to measure environmental attitudes that are, in turn, influenced by people’s experiences and personal perceptions. The New Ecological Paradigm (NEP) scale, which was initially developed by [18] and later modified by [19], was successfully used to interpret and assess people’s ecological orientation. The NEP scale investigates people’s views about their ability to control nature, the finite nature of ecological resources, the equal rights between nature and humans, the harmful consequences of human behavior, and the belief that humans are not exempt from the constraints of nature. High values of the NEP scale indicate a “pro-ecological orientation”, which is a measure of how much people care about nature [19]. The link between pro-environmental beliefs and pro-environmental behavior has to be demonstrated. However, since the studies conducted by [20], which are related to the theory of planned behavior, and by [21], scholars have proven that individuals with stronger environmental attitudes are more willing to pay for environmental resources. Similarly, the relationship between the environmental concerns of the general public and their support of environmental policies has been well-studied [22,23,24,25].
In the last 40 years, the NEP scale has been adopted in several fields of research and different geographical areas (see [26]) for a meta-analysis of studies using the NEP scale (see [27]) for a comprehensive overview of recent studies, or [28]. In addition, [29] provided information about the different numbers of items considered to construct the NEP scale (5, 6, 10, or 15 items) and some methodological details, such as the number of ordered response categories used for the NEP items (five-point, four-point or seven-point scale), or how to phrase the items (negative or positive meaning). The field of application covered by the NEP studies varies from environmental behavior regarding students, consumers, managers, and citizens [30,31,32,33] to pro-environmental behavior toward green buildings, energy-saving, and planning actions [34,35,36,37,38]. Other studies have used the NEP scale to investigate public perceptions and attitudes toward ecosystems or environmental resource protection [17,39,40,41,42,43,44,45,46,47,48,49,50].
This paper reports the results of an online survey administered to a sample of the Italian population (1517 respondents) between January 2021 and July 2021. This work is part of a broader research program on the economic valuation of marine ecosystem services in the Italian coastal habitats that are experiencing environmental and anthropic pressures (the scientific research program for a “regulated” lagoon called Venezia 2021 is coordinated by CORILA and defines an integrated set of observational tools and data to contribute to the correct balance of the lagoon ecosystem). This paper will discuss the results related to the investigation of (1) people’s perception and attitudes toward the environment and the ecological status of natural resources such as ecosystem services and (2) the perceived relationship between ecosystem loss and the COVID-19 pandemic.
This paper will contribute to the literature in three ways. First, we will provide further insights into the reliability of the NEP scale as a tool for measuring environmental attitudes and its internal consistency, significance, and dimensionality. Second, we will enable a better understanding of the factors that explain pro-environmental attitudes and behaviors, which will support the conservation of coastal ecosystem services in Italy. Last, we will test the possible differences between the results obtained with the NEP scale mean scores and the main socio-demographic variables, as well as the respondents’ opinions on possible human-related factors of the transmission of COVID-19.
The paper is structured as follows: Section 2 provides information about the questionnaire and describes the main socio-characteristics and beliefs of the respondents. Section 3 describes the principal component analysis (PCA) results, and Section 4 discusses the principal outcomes. The Section 5 oncludes the paper and offers insights and future research directions.
2. Materials and Methods
2.1. Data Collection
The data for this study were obtained from a two-wave survey administered in Italy using computer-assisted web interviewing (CAWI) with the help of IPSOS, an international and professional survey company. The surveys collected information about public preferences and attitudes toward ecosystem services and the possible relationship between the loss of ecosystems and the outbreak of COVID-19. For the selection of the sample, it was decided to adopt a mixed approach, which is based on criteria of both cost and type of information that we wanted to consider and on an evaluation of sampling errors in the main estimates at the national level.
The CAWI questionnaires were based on a stratified sample design (based on age, gender, and location) following the latest national census of the Italian Institute of Statistics (ISTAT). Data were initially collected from a sample of 517 respondents living in the Veneto region in Italy and later collected from a nationwide survey based on 1000 respondents (The reason for collecting a sample of 517 individuals in Veneto and then 1000 individuals from the remainder of Italy is related to the different availability of monetary funds in the two periods. Therefore, samples represent the Veneto Region and Italy population, respectively). Questionnaires were administered in January and July 2021 using CAWI. From the statistics relative to the whole sample (Table 1), 49% of the respondents were men, and the average age was approximately 48 years. The average annual household income of the participants was approximately EUR 27,500 and EUR 34,700 for Italy and Veneto, respectively (EUR 31,641 is the average Italian household income and EUR 35,673 is the average Veneto household income; Istat 2021). Almost 70% of the respondents have a full-time job, and approximately 65% of the respondents are married.

Table 1.
Main descriptive statistics of the samples.
The surveys were structured into four main parts. The first part consisted of “warm-up questions” to gather socio-demographic and socio-economic data about the respondents (age, gender, education, income, etc.). The second part explored the environmental awareness of respondents and their knowledge of the fundamental role of the marine ecosystem in providing crucial natural resources, ecosystem services, and human health security. The third part was comprised of questions to determine the participants’ environmental attitudes using the NEP scale [19]. In this study, the revised NEP scale was used to gauge environmental attitudes to accurately explain respondents’ responses and motivate their decisions to act in an ecologically responsible way.
The last section of the questionnaire consists of socio-economic and demographic questions.
2.2. Method
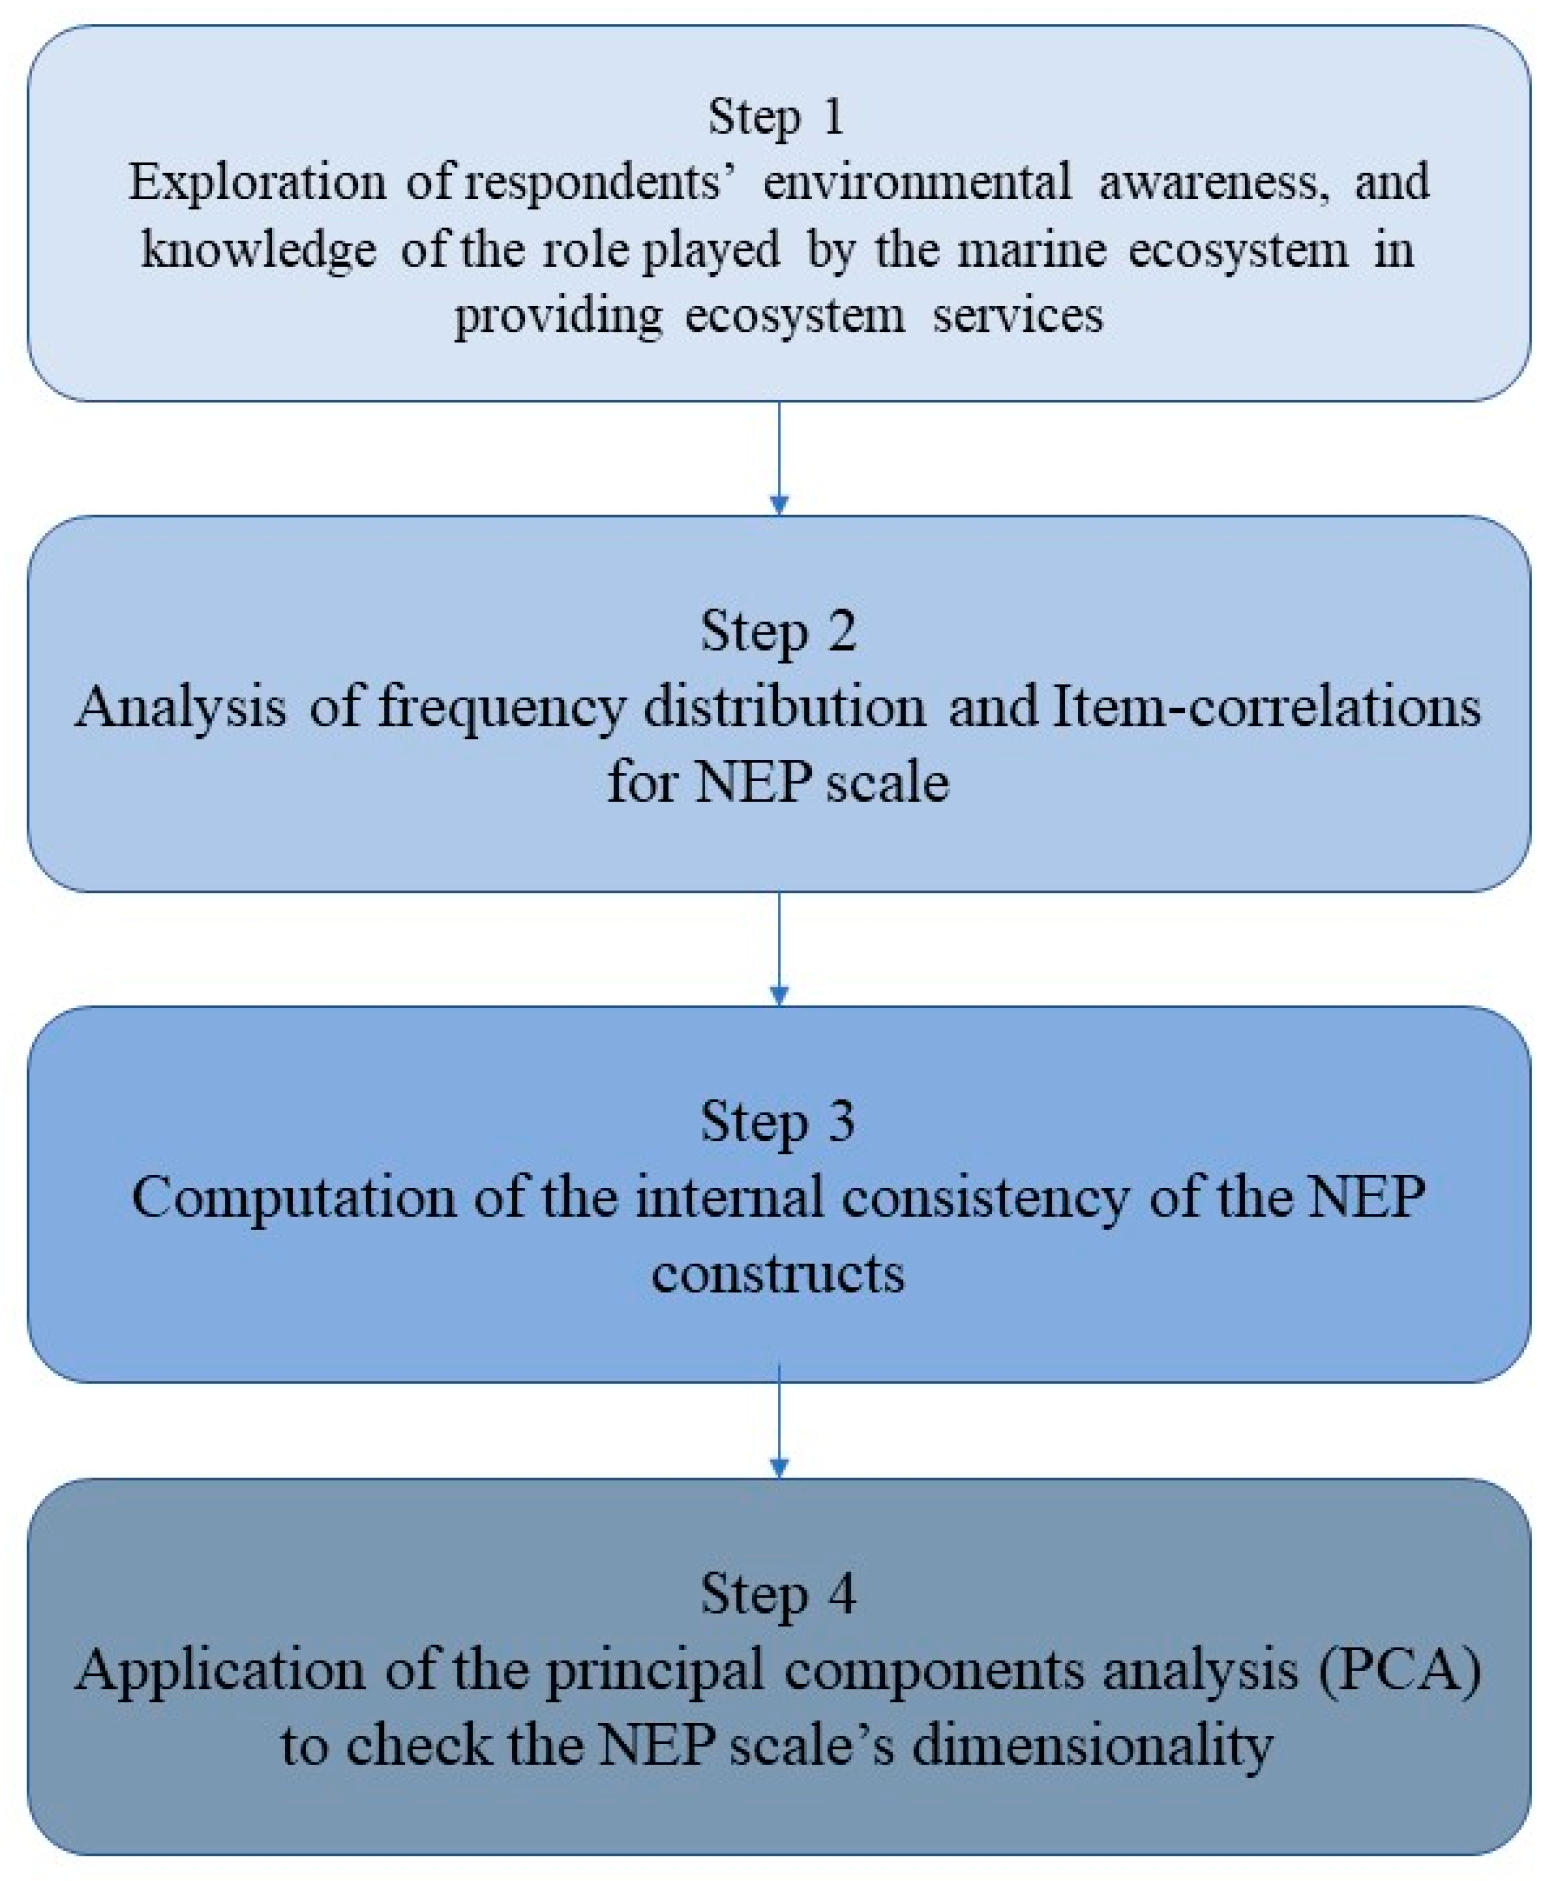
The analysis consisted of four steps: (1) a summary of the descriptive statistics of the respondents to explore the environmental awareness and their knowledge of the role of the marine ecosystem in providing crucial natural resources, ecosystem services, and human health security; (2) a summary of the responses to the 15 items of the NEP scale using a five-point Likert scale response system; (3) the computation of the internal consistency of the NEP constructs using Cronbach’s coefficient alpha; and (4) the performance of the PCA to check the NEP scale’s dimensionality. Figure 1 illustrates the main phases of the research method adopted in this study.
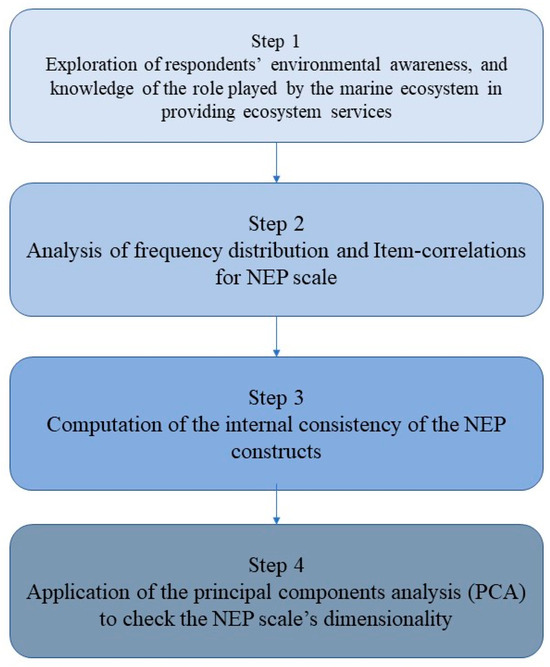
Figure 1.
Flow chart of the research process.
The NEP Scale consists of 15 items (Table 2) aimed to measure the following ecological worldviews of individuals (Dunlop et al., 2000): (A) reality of limits to economic growth; (B) anti-anthropocentrism; (C) nature’s balance fragility; (D) rejection of human exceptionalism (i.e., men are not limited by the laws of nature); and (E) the probability that eco-crises will affect people. The items were rated as strongly disagree (SD), disagree (D), neutral (N), agree (A), and strongly agree (SA), and were coded as 1, 2, 3, 4, and 5.
Table 2.
Frequency and mean distribution of the NEP scale items (N = 1517).
If people agree with the eight odd-numbered items and disagree with the seven even-numbered items, they are recognized as pro-NEP. Therefore, in the statistical analysis, the scores were reversed for calculating the NEP score for the even-numbered items. Positive answers in the even-numbered items suggest that people adhere to the dominant social paradigm (DSP).
Key socio-demographic and sociocultural characteristics were considered to better explain respondents’ pro-environmental attitudes and beliefs.
This paper implemented the NEP scale because it offers a comprehensive approach covering various environmental concern dimensions that help understand respondents’ attitudes, making it suitable for studies aiming to capture a holistic view of pro-environmental perspectives. In the literature, it is possible to find alternative measures that may be more focused on specific dimensions of environmental attitudes (for example, the Value–Belief–Norm (VBN) Theory Scale). While this can be advantageous in specific contexts, we sought a comprehensive assessment.
The NEP scale has undergone extensive validation in various cultural and demographic contexts, contributing to its reliability and cross-cultural applicability. Other alternative measures may need a different level of validation, which can compromise the generalizability of the findings, mainly if the study involves a population not well-represented in the literature results.
Usually, the NEP scale is further analyzed using PCA. PCA with varimax rotation was performed to reduce the data’s dimensionality while maintaining the data set’s greatest variation. This operation obtains a new set of variables identified as the principal components, which are uncorrelated and ordered to preserve the higher variability [51].
3. Results
3.1. NEP Scale
Table 2 reports the answers to the 15 items of the NEP scale for all the respondents (N = 1517). We calculated the NEP score as the average of all the scores accrued on each item and for all the respondents. An individual score represents the endorsement of an ecological and global perspective as the sum of scores on the 15 items. Higher scores denote a high level of environmental concern.
In this study, the mean score of the items ranges from a minimum of 2.33 (item “The Earth has plenty of natural resources if only we learn to develop them”) to 4.28 (item “Humans are severely abusing the environment”).
The average score of the respondents in the study regarding their level of acceptance of the NEP was 3.74. Moreover, Table 2 specifies the five different components (A–E) and how they are combined, as reported in Section 2.2.
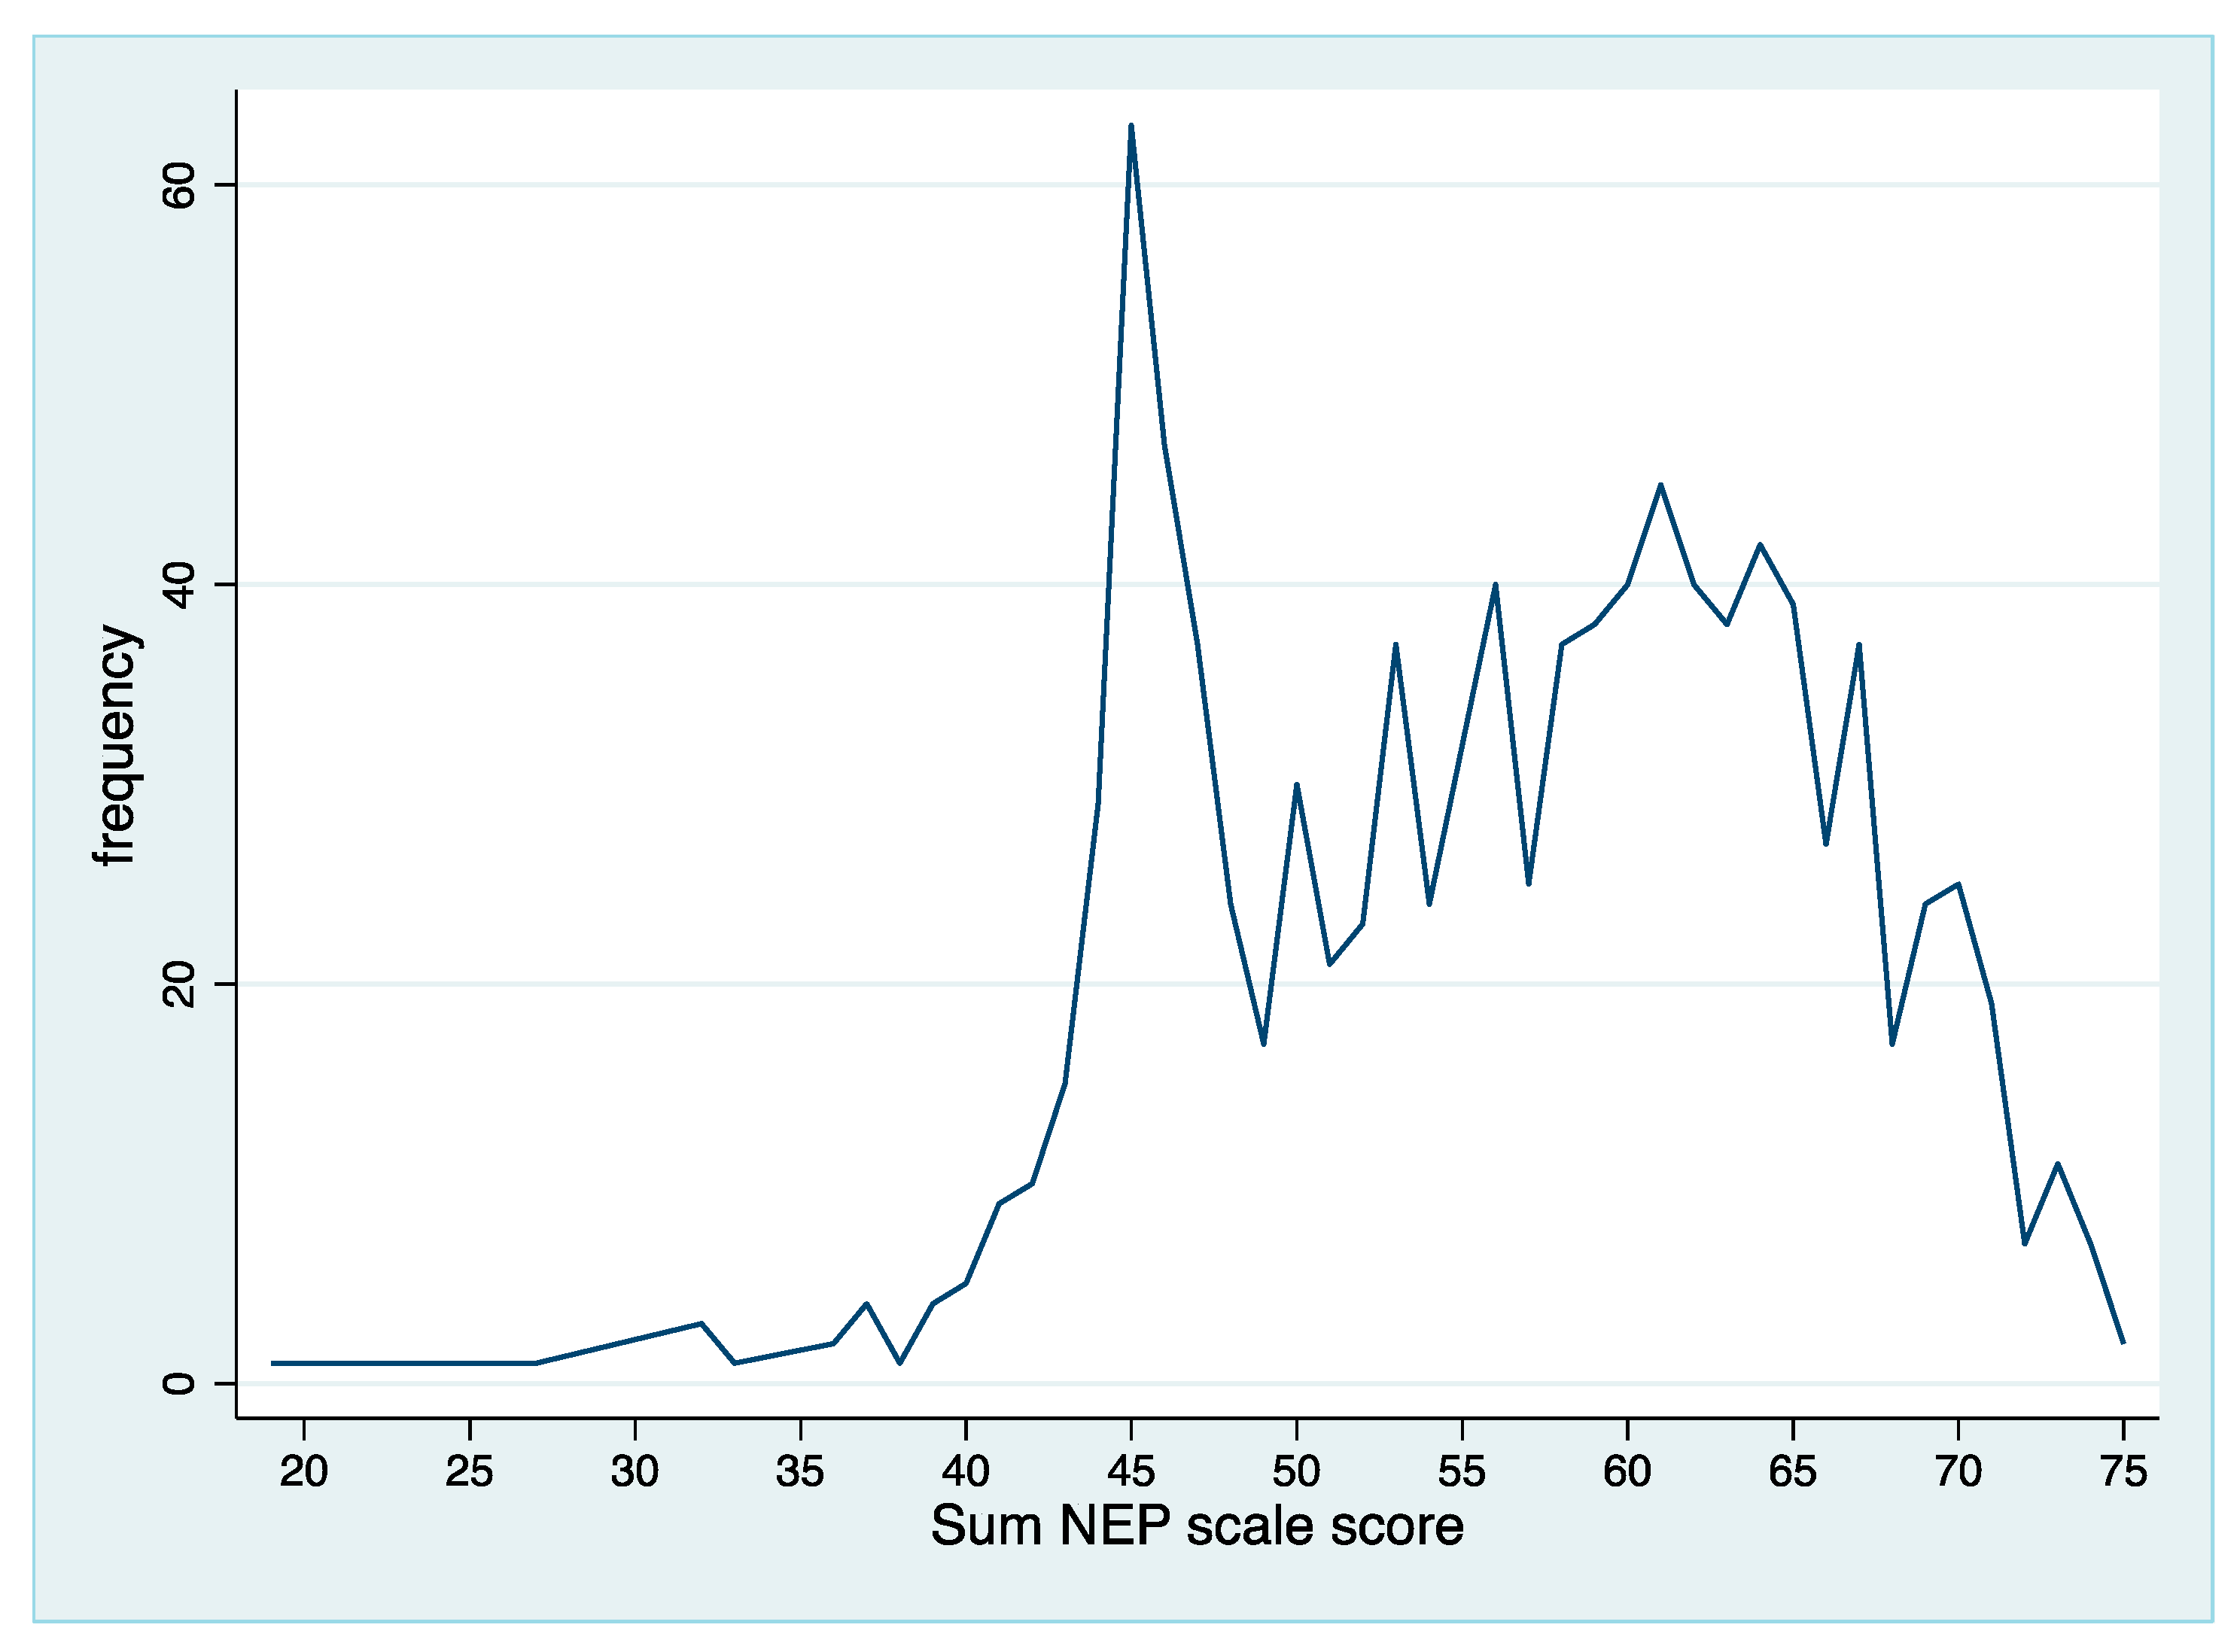
Other information that is helpful for evaluating people’s ecological worldview is the individual total NEP score (Figure 2), calculated as the sum of all the 15 scores on the individual scale items. In this study, the total NEP score ranged from 19 to 75 with an average value of 56.09 (standard deviation of 9.06), which indicates a good respondents’ ecological attitude [52]. Higher scores show a stronger feeling for the ecological worldview.
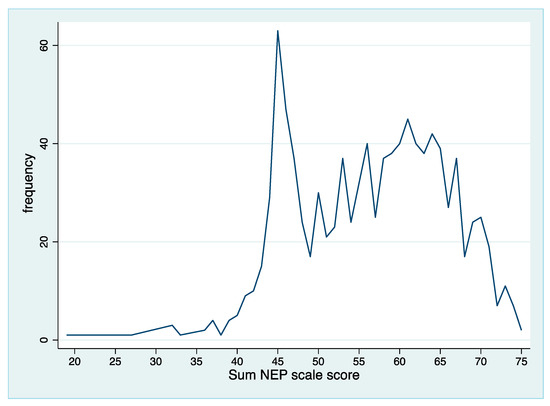
Figure 2.
Total NEP scale score.
3.2. Principal Components Analysis
The pioneering paper of [18] found that the 12 items of the NEP scale were aggregated into one dimension, the so-called unidimensionality. Later, the applications of the NEP scale in several geographical contexts and to different samples of individuals revealed uneven results: some applications found a single dimension, whereas some applications found multidimensionality of the NEP items [19,53]. In this paper, we also investigated this aspect and will present the results here.
To measure people’s environmental awareness, an index was constructed by averaging the mean calculated in the several NEP items. In this section, we estimated Cronbach’s coefficient alpha to assess the internal consistency of the scale and adopted the PCA with varimax rotation [54,55] to determine whether the 15 items could be treated as a single category. An eigenvalue of 1.00 was used for factor identification (Kaiser’s criterion). Three factors were derived from the NEP scale, which explained 55.73% of the total variance (Table 3), with eigenvalues varying between 4.98 and 1.06.
Table 3.
Total variance explained.
Table 4 illustrates how factor 1 (F1), factor 2 (F2), and factor 3 (F3) explained 33.23%, 15.43%, and 7.06%, respectively, of the data variability. Together, these three main components explained 55.73% of the data variability (total variance). Moreover, Table 4 reports the value for Cronbach’s coefficient alpha (0.83). The value remained stable even when we removed Item 6 (“The Earth has plenty of natural resources if we just learn how to develop them”) from the scale because of the low correlation with the other issues.
Table 4.
Results of the PCA of NEP scale items.
Other important statistical tests for determining the validity of the PCA are the Kaiser–Meyer–Olkin (KMO) criterion (0.9) and Bartlett’s test of sphericity (7400.26; p-value of 0.000).
Table 4 shows the factor loadings and the distribution of the items. Three factors were derived from the NEP scale. Specifically, the findings grouped the 15 items into three dimensions: anti-anthropocentrism (pro-NEP items), human domination (pro-DSP items), and limits of nature. The first factor (F1) contained four related dimensions, focusing on the probability of an eco-crisis (items 5 and 15), nature balance fragility (items 3 and 13), anti-anthropocentrism (item 7), and anti-exceptionalism (item 9). The analysis showed that this factor had three common cross-loadings related to the dimension limits of nature (items 1, 6, and 11). The findings suggest that these items (1, 6, and 11) were correlated to two dimensions, although they seemed slightly less related to anti-anthropocentrism than the limits of nature. The second factor (F2) is correlated with six items of the data set, covering four argument types: anti-exceptionalism (items 4 and 14), anti-anthropocentrism (items 12 and 2), the possibility of eco-crisis (item 10), and fragility of nature balance (item 8). The third factor (F3), although presenting common cross-loadings with the first factor, was composed only of items pertaining to one dimension (limits of nature). This dimension was composed of the three original items, as described in its original construction. F3 included items 1, 6, and 11.
Item 6 on the NEP scale revealed cross-loadings related to F1 and F3 and the lowest agreement with the NEP worldview. Only 13.97% of the respondents had a pro-NEP view. This value was far below the results obtained in the other statements. The statements with the lowest pro-NEP percentage values—items 4 and 12—had approximately 28- and 33-point differences, respectively, compared to statement 6. Items 1 and 11, which refer to the same theoretical sub-dimension of limits to growth, had an even larger value gap from statement 6.
In contrast to the general results, they indicated a marked contrariety for respondents to assume a pro-NEP view in this statement. According to [52] a possible interpretation could be a misunderstanding or misinterpretation of the word “develop” in the statement due to its placement at the end of the sentence. This wording could lead the participants to a distorted interpretation of the statement.
3.3. People’s Familiarity with Marine Ecosystem Services during the COVID-19 Pandemic
The questions submitted in the first part of the questionnaire were intended to form a background about respondents’ familiarity with the marine ecosystem, which is considered both a natural place and a place of recreation and economic production. A series of questions were presented to explore the environmental awareness of the respondents and their knowledge of the fundamental role of the marine ecosystem in providing crucial natural resources, ecosystem services, and human health security. Respondents indicated their agreement or disagreement (using a five-point Likert scale) with the fact that the marine ecosystem provides ecosystem services to people (Table 5). According to respondents, the primary ecosystem services provided by the marine ecosystem were habitat services (life cycle maintenance of marine species; 3.98), environmental education (3.97), coastal erosion prevention (3.95), and climate regulation (3.85). Analyzing the overall average values attributed by respondents to the ecosystem services provided by the marine ecosystem, we observed that each ecosystem service obtained an average value above 3.51 on a scale from one to five. The results denote some level of knowledge and awareness by respondents regarding the ecosystem services provided by the marine environment and recognition of their importance for the territory.
Table 5.
How much do you agree that the marine environment provides the following ecosystem services to people (where 1 = strongly disagree and 5 = totally agree)?
Many zoonotic infections that cause human health diseases are linked with environmental problems such as the loss of ecosystems [14,56]. The perceptions and opinions of respondents about the possible connection between human health and the environment were investigated using a few specific questions. According to the results, Italian people (more than 80% of the sample) recognized a link between ecosystem health and the spread of diseases (Table 6). People expressed a specific awareness and recognized the importance of the marine ecosystem in providing a wide variety of ecosystem services that derive, directly or indirectly, multiple benefits for humans and territorial development. Our findings reveal that the COVID-19 pandemic may positively affect people’s perception of the importance of the environment and ecosystem services. Thus, by heightening people’s environmental awareness, our results suggest that maintaining a positive marine natural heritage outcome is related to how people perceive the environment.
Table 6.
How probable is it that the deterioration in the quality of ecosystems could lead to the onset of diseases similar to the coronavirus (where 1 = very unlikely and 5 = very likely)?
Notably, the percentage of people who recognize the association between ecosystem degradation and human health increased by almost 10 percentage points from the first survey in January (76.30%) to the July 2021 survey (85.00%). The results indicate that people are becoming more aware of the relationship between environmental health and human health.
As shown in Table 7, the respondents predominantly associated ecosystem degradation with anthropic activities, such as air pollution (56.10%), water pollution (55.17%), deforestation (40.67%), biodiversity loss (35.46%), intensive livestock farming (37.24%), wildlife trade (37.97%), and urban sprawl (28.81%).
Table 7.
Which of the following human actions could most lead to an increased probability of the spread of viruses such as the current coronavirus?
We also investigated the role of specific socio-demographics and the determinants of environmental concerns by employing the non-parametric Mann–Whitney test [57]. In this study, the Mann–Whitney test showed a significant difference between the mean NEP scores and the scores of female (M = 596,939.5) and male (M = 552,946.5) respondents (p = 0.0027) in the total NEP scores.
The application of the Mann–Whitney test for individual characteristics of the respondents and mean NEP scores revealed a significant difference among people who worked (719,146.5), married respondents (751,903), and respondents with higher education (401,511). Moreover, the Mann–Whitney test revealed a strong relationship between mean NEP scores and all individuals’ opinions on possible human-related factors influencing the transmission of COVID-19, with the exception of 5G transmission, which was the control variable (Table 8).
Table 8.
Relationship between the Mean NEP score and respondents’ opinion on the possible human-related factors influencing the transmission of COVID-19.
Analyses of the overall frequency and the mean distributions indicate that the majority of the sample endorses NEP statements on most issues on the scale. Although the respondents show environmental sympathy in several NEP sentences, it is not possible to conclude that they have a pro-ecological focus in general. People may express positive attitudes toward the environment or state their intentions to engage in pro-environmental actions, but these thoughts may not always materialize into concrete behaviors. The literature discusses practical barriers and constraints, such as time, cost, convenience, or a lack of knowledge, that can prevent individuals from acting on their pro-environmental attitudes [58]. Even if someone genuinely cares about the environment, real-world limitations might hinder their ability to engage in environmentally friendly behaviors. For example, if a pro-environmental action requires low costs, people are more willing to act; when the effort to change unsustainable paths increases, people are less prepared to modify their behavior.
4. Discussion
The present study employed the NEP scale in Italy to investigate people’s attitudes and beliefs about nature and ecosystem services in particular. Our objective was to better understand the familiarity of respondents toward ecosystem services and to determine people’s opinions about the possible link between the loss of biodiversity, ecosystem services, and the proliferation of diseases such as COVID-19. In addition to posing direct questions to respondents, we adopted the NEP scale since it is one of the most accepted indicators for measuring people’s attitudes. In general, the current study revealed that people think that it is highly probable that ecosystem loss or degradation is a driving factor in the occurrence of diseases such as COVID-19. Moreover, respondents demonstrated familiarity with the concept’s ecosystem and ecosystem services in Venice. The awareness and knowledge of citizens toward ecosystem services will increase the acceptance of targeted conservation policy and guide the involvement of the general public and other stakeholders in supporting ecosystem conservation strategies and sustainable behavior [59].
The study acquired essential findings concerning the NEP scale that can have significant implications for its use in future research.
First, the results showed that in our case study, the NEP scale was multidimensional; it measured three dimensions. This outcome is consistent with previous studies on the NEP scale dimensionality [17,60,61,62,63,64]. Nevertheless, many studies have revealed two dimensions [65,66,67,68,69] or four dimensions [27,52,70,71] in their samples. Dimensions that constitute an environmental worldview differ in a historical, sociocultural, and spatial context [72]. The NEP scale was created based on a developed country’s perspective of the environment. The genesis of widely utilized theoretical concepts and terms, such as the DSP and NEP, was defined according to a Western environmental view [68].
Second, our results support the findings of previous studies suggesting that the NEP scale is internally consistent in its ability to display environmental attitudes. The total Cronbach’s coefficient alpha was 0.83, and according to previous studies, a reliability coefficient between 0.70 and 0.80 or greater is generally considered acceptable [19,73,74]. However, this coefficient alone does not indicate if the scale is unidimensional or multidimensional.
Although most of the available evidence suggests the general validity of the NEP scale, greater consensus on whether the scale measure can be considered unidimensional or multidimensional is needed [19].
Third, the total NEP score (56.09) indicated ecological concern and engagement by respondents, similar to other studies [52].
Empirical results found a connection between environmental attitude and people’s socio-economic characteristics, territorial, and sociocultural context [19,26,75,76,77]. Socio-economic characteristics include age, level of education, household income, and occupational status. Territorial and sociocultural contexts include the country in which the survey was administered, the historical context of the survey (considering that the NEP scale with 12/15 items has been used for four decades), and the language in which the survey and the statements are administered. Further, the type of sample used in the different surveys must be considered regarding the method of administration and the representativeness and heterogeneity of the selected sample. We found that women are more concerned with the environment than men. This result is consistent with other research findings in different geographical contexts, such as Greece, the US, India, and Brazil, demonstrating that women care more about the environment than men and score higher on the NEP scale [17,78,79,80,81]. This finding can be attributed to gender roles, societal expectations, and women’s perceived responsibility for household and community well-being. Other significant determinants were people who work, are married, were familiar with the term ecosystem, and thought there was a high probability that the deterioration of ecosystem quality could lead to the spread of diseases similar to COVID-19. All these aspects can significantly affect the study results, and a cautious approach should be taken when comparing different samples. Parenthood and family planning can shape pro-environmental attitudes. Married people, especially those with children, may become more conscious of environmental issues as they consider the long-term impact on future generations. People who have a regular and long-term job may consider contributing to environmental sustainability and positively engage in pro-ecological behaviors. A higher level of environmental knowledge is often associated with more positive and pro-ecological attitudes. When individuals have a deeper understanding of the interconnectedness of human activities with the environment and the potential consequences of unsustainable practices, they are more likely to express concern and support for environmental conservation [82].
Some studies have found a correlation between NEP scores and behavior [83]. Other studies argue that even if the results indicate that most of the population has a pro-NEP worldview, their behavior may substantially differ from the statements presented in the survey [84]. This premise would indicate that a quantitative measurement (through the NEP method) may not be sufficient to determine people’s factual behavior. Attitudes and values do not necessarily lead to environmentally conscious behavior. Numerous elements, personal interests, ethics, and fear can directly or indirectly influence individual behavior [73]. These elements deserve to be more clearly identified and analyzed.
Empirical research in other geographical and demographic areas is needed to understand the scale’s effectiveness and quality.
5. Conclusions
In this study, we administered a survey to investigate people’s views about the connection between ecosystem service and their attitude and engagement with nature. Moreover, we adopted the NEP scale to assess Italians’ environmental perceptions and attitudes, a prerequisite for designing appropriate conservation policies and preventing biodiversity and ecosystem service losses. Specifically, through applying the NEP scale and specific questions about the environment and ecosystem services, this research also explored the latent motivations useful to explaining individuals’ propensity for marine ecosystem protection and policy-making. Future research will investigate how the intimate connection between humans and nature may guide people in taking action or participating in specific projects aimed at safeguarding and improving ecosystem services.
According to the study results, Italian people (more than 80% of the sample) recognized a link between ecosystem health and the spread of diseases. People expressed a specific awareness and recognized the importance of the marine ecosystem in providing a wide variety of ecosystem services that derive, directly or indirectly, multiple benefits for humans and territorial development. Our findings reveal that the current pandemic may positively affect people’s perception of the importance of the environment and ecosystem services. Thus, by heightening people’s environmental awareness, our results suggest that the conservation of marine natural heritage is related to how people perceive the environment.
The results of the NEP scale (pro-NEP score of 60.18%) and the mean NEP score (56.09) demonstrated that respondents have a high level of environmental concern for most scale issues. This outcome is indicative of the embracement of the NEP statements by the majority of respondents for most issues on the scale. However, attitudes, beliefs, and mindsets are not the only drivers of proper pro-environmental behavior. Although they are significant in the underlying set of factors of these behaviors, it has been shown that direct experience of environmental relevance influences ecological worldviews, and presumably, direct experience of environmental education can also induce pro-environmental attitudes. A combination of different individual factors can lead to differences in ecosystem service perception. We found that women, people who worked, and those who were married were environmentally sympathetic. Similarly, persons who think that the deterioration of ecosystem quality led to a higher probability of virus and disease transmission showed strong biocentric attitudes.
The PCA reveals that the Italian NEP scale has three dimensions that are consistent with several previous studies on NEP scale dimensionality. The investigation of the multidimensional nature of the NEP scale has shown the complexity of analyzing environmental attitudes. More scientific evidence on a defined number of dimensions is needed; hence, further research is recommended. In addition, generalizing our study’s results to a larger population or other geographical context requires caution.
The study’s results may be helpful to policymakers in integrating people’s environmental concerns and perceptions into relevant decision-making processes. For example, it is possible to include specific educational initiatives aimed at raising awareness about environmental issues in different types of schools, emphasizing the interdependence of human–environment actions. Targeting schools, communities, and even workplaces can enhance knowledge and foster a sense of responsibility. Local and central governments can also design specific economic instruments, such as taxes, subsidies, or even tailored environmental agreements, to encourage citizens and enterprises to adopt sustainable practices. In general, the pro-ecological attitudes demonstrated in this study may be incentivized and integrated into various policy sectors intertwined with real ecosystem services such as tourism, energy, transportation, and waste management. Cooperation among different sectors can create cohesive policies that address multiple facets of environmental sustainability, reinforcing the alignment with public attitudes. Horizontally, the public and private sectors may finance research and innovation programs to create new sustainable products and processes and to support initiatives that explore and develop sustainable technologies, conservation strategies, and ecosystem restoration methods. This approach can contribute to the advancement of practices that favor positive behaviors toward environmental protection.
The results of this study will also guide future research in investigating how much environmental attitudes and beliefs guide people’s willingness to contribute to ecosystem services protection in future research. The pandemic crisis can increase the chance for radical policy change, assigning to nature and ecosystem services protection a strategic role for health security and a better quality of life.
The study’s results could support the current debate on the relationship between people’s attitudes toward the environment and public involvement in marine ecosystem conservation policies. However, this study has two shortcomings. First, to effectively prove the relationship between ecosystem services and people’s eco-centric views, we should have adapted the conventional 15 items to describe the critical issues of marine ecosystem services, similar to the work of [44]. The NEP scale, which was revised in the 2000s, considered people’s views on the human–nature relationship during that era. This temporal context might impact the scale’s ability to fully capture contemporary perspectives on the people–ecology dualism. Future research could explore the development of an updated NEP scale that reflects a new viewpoint on environmental issues and ecosystem services, ensuring its relevance to the dynamic nature of attitudes in the Anthropocene. However, longitudinal studies are essential for tracking changes in environmental attitudes over time and thus provide valuable insights. Moreover, undertaking this study in different geographical and cultural contexts can contribute to a more comprehensive understanding of global attitudes.
The second drawback is related to the survey organization. Although our two-wave design was inevitable, it would have been ideal to have simultaneously surveyed all respondents with a balanced sample, avoiding the relatively large percentage of people with higher education. Moreover, future research could combine self-reported data with observational or behavioral measures to better understand participants’ environmental behaviors. Additionally, exploring alternative survey methodologies or incorporating qualitative methods may mitigate biases associated with self-reporting.
The future and availability of natural resources are extremely uncertain, and good communications and solid education can lead to a decisive breakthrough. Involving all citizens, including our children and students, in environmental activities is the proper way to inform and teach how to behave to protect the planet and contribute to long-term environmental sustainability. However, creating change at the individual and community levels requires a considerable effort in understanding what really matters to people and, second, in identifying the suitable instruments to make participation possible.
Author Contributions
Conceptualization, S.T.; Methodology, S.T.; Validation, D.B.; Formal analysis, D.B.; Writing – original draft, S.T. and D.B.; Supervision, S.T.; Project administration, S.T.; Funding acquisition, S.T.. All authors have read and agreed to the published version of the manuscript.
Funding
This research was funded by CORILA, with the contribution of the Provveditorato for the Public Works of Veneto, Trentino Alto Adige and Friuli Venezia Giulia.
Institutional Review Board Statement
Not applicable.
Informed Consent Statement
Informed consent was obtained from all subjects involved in the study.
Data Availability Statement
The datasets generated and analyzed during the current study are available from the corresponding author on reasonable request.
Conflicts of Interest
The authors declare no potential conflicts of interest with respect to the research, authorship, and/or publication of this article.
References
- Taylor, L.H.; Latham, S.M.; Woolhouse, M.E.J. Risk factors for human disease emergence. Philos. Trans. R. Soc. London. Ser. B Biol. Sci. 2001, 356, 983–989. [Google Scholar] [CrossRef]
- Patz, J.A.; Daszak, P.; Tabor, G.M.; Aguirre, A.A.; Pearl, M.; Epstein, J.; Wolfe, N.D.; Kilpatrick, A.M.; Foufopoulos, J.; Molyneux, D.; et al. Unhealthy Landscapes: Policy Recommendations on Land Use Change and Infectious Disease Emergence. Environ. Health Perspect. 2004, 112, 1092–1098. [Google Scholar] [CrossRef] [PubMed]
- Weiss, R.A.; McMichael, A.J. Social and environmental risk factors in the emergence of infectious diseases. Nat. Med. 2004, 10 (Suppl. S12), S70–S76. [Google Scholar] [CrossRef] [PubMed]
- McNeely, J.A. Nature and COVID-19: The pandemic, the environment, and the way ahead. Ambio 2021, 50, 767–781. [Google Scholar] [CrossRef] [PubMed]
- Morse, S.S.; Mazet, J.A.; Woolhouse, M.; Parrish, C.R.; Carroll, D.; Karesh, W.B.; Zambrana-Torrelio, C.; Lipkin, W.I.; Daszak, P. Prediction and prevention of the next pandemic zoonosis. Lancet 2012, 380, 1956–1965. [Google Scholar] [CrossRef]
- Pike, J.; Bogich, T.; Elwood, S.; Finnoff, D.C.; Daszak, P. Economic optimization of a global strategy to address the pandemic threat. Proc. Natl. Acad. Sci. USA 2014, 111, 18519–18523. [Google Scholar] [CrossRef]
- Allen, T.; Murray, K.A.; Zambrana-Torrelio, C.; Morse, S.S.; Rondinini, C.; Di Marco, M.; Breit, N.; Olival, K.J.; Daszak, P. Global hotspots and correlates of emerging zoonotic diseases. Nat. Commun. 2017, 8, 1124. [Google Scholar] [CrossRef] [PubMed]
- Rohr, J.R.; Barrett, C.B.; Civitello, D.J.; Craft, M.E.; Delius, B.; DeLeo, G.A.; Hudson, P.J.; Jouanard, N.; Nguyen, K.H.; Ostfeld, R.S.; et al. Emerging human infectious diseases and the links to global food production. Nat. Sustain. 2019, 2, 445–456. [Google Scholar] [CrossRef]
- IPBES. Workshop Report on Biodiversity and Pandemics of the Intergovernmental Platform on Biodiversity and Ecosystem Services (IPBES) (1.3); Zenodo: 2020. Available online: https://zenodo.org/records/7432079 (accessed on 22 November 2023).
- Everard, M.; Johnston, P.; Santillo, D.; Staddon, C. The role of ecosystems in mitigation and management of Covid-19 and other zoonoses. Environ. Sci. Policy 2020, 111, 7–17. [Google Scholar] [CrossRef]
- Potter, J.D.; Brooks, C.; Donovan, G.; Cunningham, C.; Douwes, J. A perspective on green, blue, and grey spaces, biodiversity, microbiota, and human health. Sci. Total Environ. 2023, 892, 164772. [Google Scholar] [CrossRef]
- Beckmann-Wübbelt, A.; Fricke, A.; Sebesvari, Z.; Yakouchenkova, I.A.; Fröhlich, K.; Saha, S. High public appreciation for the cultural ecosystem services of urban and peri-urban forests during the COVID-19 pandemic. Sustain. Cities Soc. 2021, 74, 103240. [Google Scholar] [CrossRef]
- Economist Intelligence Unit. An Eco-wakening: Measuring Global Awareness, Engagement and Action for Nature. 2021. Available online: https://impact.economist.com/sustainability/ecosystems-resources/an-eco-wakening-measuring-global-awareness-engagement-and-action-for-nature (accessed on 22 November 2023).
- Lawler, O.K.; Allan, H.L.; Baxter, P.W.; Castagnino, R.; Tor, M.C.; Dann, L.E.; Hungerford, J.; Karmacharya, D.; Lloyd, T.J.; López-Jara, M.J.; et al. The COVID-19 pandemic is intricately linked to biodiversity loss and ecosystem health. Lancet Planet. Health 2021, 5, e840–e850. [Google Scholar] [CrossRef]
- Doherty, E.; Murphy, G.; Hynes, S.; Buckley, C. Valuing ecosystem services across water bodies: Results from a discrete choice experiment. Ecosyst. Serv. 2014, 7, 89–97. [Google Scholar] [CrossRef]
- Reid, W.V.; Mooney, H.A.; Cropper, A.; Capistrano, D.; Carpenter, S.R.; Chopra, K.; Dasgupta, P.; Dietz, T.; Duraiappah, A.K.; Hassan, R.; et al. Ecosystems and Human Well-Being-Synthesis: A Report of the Millennium Ecosystem Assessment; Island Press: Washington, DC, USA, 2005. [Google Scholar]
- Halkos, G.; Matsiori, S. Environmental attitude, motivations and values for marine biodiversity protection. J. Behav. Exp. Econ. 2017, 69, 61–70. [Google Scholar] [CrossRef]
- Dunlap, R.E.; Van Liere, K.D. The “new environmental paradigm”. J. Environ. Educ. 1978, 9, 10–19. [Google Scholar] [CrossRef]
- Dunlap, R.E.; Van Liere, K.D.; Mertig, A.G.; Jones, R.E. New Trends in Measuring Environmental Attitudes: Measuring Endorsement of the New Ecological Paradigm: A Revised NEP Scale. J. Soc. Issues 2000, 56, 425–442. [Google Scholar] [CrossRef]
- Ajzen, I.; Fishbein, M. A Bayesian analysis of attribution processes. Psychol. Bull. 1975, 82, 261. [Google Scholar] [CrossRef]
- Kotchen, M.J.; Reiling, S.D. Environmental attitudes, motivations, and contingent valuation of nonuse values: A case study involving endangered species. Ecol. Econ. 2000, 32, 93–107. [Google Scholar] [CrossRef]
- Pyatt, S.T. Concern for the Environment among General Publics: A Cross-National Study. Soc. Nat. Resour. 2007, 20, 883–898. [Google Scholar] [CrossRef]
- Clayton, S.; Myers, G. Conservation Psychology: Understanding and Promoting Human Care for Nature; Blackwell: Oxford, UK, 2009. [Google Scholar]
- Steg, L.; De Groot, J.I.; Dreijerink, L.; Abrahamse, W.; Siero, F. General antecedents of personal norms, policy acceptability, and intentions: The role of values, worldviews, and environmental concern. Soc. Nat. Resour. 2011, 24, 349–367. [Google Scholar] [CrossRef]
- Harring, N.; Jagers, S.C.; Matti, S. Public support for pro-environmental policy measures: Examining the impact of personal values and ideology. Sustainability 2017, 9, 679. [Google Scholar] [CrossRef]
- Hawcroft, L.J.; Milfont, T.L. The use (and abuse) of the new environmental paradigm scale over the last 30 years: A meta-analysis. J. Environ. Psychol. 2010, 30, 143–158. [Google Scholar] [CrossRef]
- Matsiori, S.K. Application of the New Environmental Paradigm to Greece: A critical case study. Econ. Anal. Policy 2020, 66, 335–344. [Google Scholar] [CrossRef]
- Freire, O.; Quevedo-Silva, F.; Frederico, E.; Vils, L.; Junior, S.S.B. Effective scale for consumers’ environmental concerns: A competing scales study between NEP and ECCB. J. Clean. Prod. 2021, 304, 126801. [Google Scholar] [CrossRef]
- Ziegler, A. New Ecological Paradigm meets behavioral economics: On the relationship between environmental values and economic preferences. J. Environ. Econ. Manag. 2021, 109, 102516. [Google Scholar] [CrossRef]
- Law, M.M.S.; Hills, P.; Hau, B.C.H. Engaging employees in sustainable development–a case study of environmental education and awareness training in Hong Kong. Bus. Strategy Environ. 2017, 26, 84–97. [Google Scholar] [CrossRef]
- Kukkonen, J.; Kärkkäinen, S.; Keinonen, T. Examining the relationships between factors influencing environmental behaviour among university students. Sustainability 2018, 10, 4294. [Google Scholar] [CrossRef]
- Zollo, L.; Yoon, S.; Rialti, R.; Ciappei, C. Ethical consumption and consumers’ decision making: The role of moral intuition. Manag. Decis. 2018, 56, 692–710. [Google Scholar] [CrossRef]
- Mallick, D.; Tsang, E.P.K.; Lee, J.C.K.; Cheang, C.C. Marine Environmental Knowledge and Attitudes among University Students in Hong Kong: An Application of the Ocean Literacy Framework. Int. J. Environ. Res. Public Health 2023, 20, 4785. [Google Scholar] [CrossRef]
- Kalkbrenner, B.J.; Roosen, J. Citizens’ willingness to participate in local renewable energy projects: The role of community and trust in Germany. Energy Res. Soc. Sci. 2016, 13, 60–70. [Google Scholar] [CrossRef]
- Xie, X.; Lu, Y.; Gou, Z. Green building pro-environment behaviors: Are green users also green buyers? Sustainability 2017, 9, 1703. [Google Scholar] [CrossRef]
- Liu, Y.; Hong, Z.; Zhu, J.; Yan, J.; Qi, J.; Liu, P. Promoting green residential buildings: Residents’ environmental attitude, subjective knowledge, and social trust matter. Energy Policy 2018, 112, 152–161. [Google Scholar] [CrossRef]
- Atshan, S.; Bixler, R.P.; Rai, V.; Springer, D.W. Pathways to urban sustainability through individual behaviors: The role of social capital. Environ. Sci. Policy 2020, 112, 330–339. [Google Scholar] [CrossRef]
- Merten, M.J.; Becker, A.C.; Matthies, E. What explains German consumers’ acceptance of carbon pricing? Examining the roles of pro-environmental orientation and consumer coping style. Energy Res. Soc. Sci. 2022, 85, 102367. [Google Scholar] [CrossRef]
- Liu, J.; Ouyang, Z.; Miao, H. Environmental attitudes of stakeholders and their perceptions regarding protected area-community conflicts: A case study in China. J. Environ. Manag. 2010, 91, 2254–2262. [Google Scholar] [CrossRef]
- Pienaar, E.F.; Lew, D.K.; Wallmo, K. Are environmental attitudes influenced by survey context? An investigation of the context dependency of the New Ecological Paradigm (NEP) Scale. Soc. Sci. Res. 2013, 42, 1542–1554. [Google Scholar] [CrossRef]
- Pienaar, E.F.; Lew, D.K.; Wallmo, K. The importance of survey content: Testing for the context dependency of the New Ecological Paradigm Scale. Soc. Sci. Res. 2015, 51, 338–349. [Google Scholar] [CrossRef]
- Suziana, H. Environmental attitudes and preference for wetland conservation in Malaysia. J. Nat. Conserv. 2017, 37, 133–145. [Google Scholar] [CrossRef]
- Taye, F.A.; Vedel, S.E.; Jacobsen, J.B. Accounting for environmental attitude to explain variations in willingness to pay for forest ecosystem services using the new environmental paradigm. J. Environ. Econ. Policy 2018, 7, 420–440. [Google Scholar] [CrossRef]
- Barradas, J.I.; Ghilardi-Lopes, N.P. A case study using the New Ecological Paradigm scale to evaluate coastal and marine environmental perception in the Greater São Paulo (Brazil). Ocean Coast. Manag. 2020, 191, 105177. [Google Scholar] [CrossRef]
- Wardropper, C.B.; Mase, A.S.; Qiu, J.; Kohl, P.; Booth, E.G.; Rissman, A.R. Ecological worldview, agricultural or natural resource-based activities, and geography affect perceived importance of ecosystem services. Landsc. Urban Plan. 2020, 197, 103768. [Google Scholar] [CrossRef]
- Bergtold, J.S.; Caldas, M.M.; Ramsey, S.M.; Sanderson, M.R.; Granco, G.; Mather, M.E. The gap between experts, farmers and non-farmers on perceived environmental vulnerability and the influence of values and beliefs. J. Environ. Manag. 2022, 316, 115186. [Google Scholar] [CrossRef]
- Johnson, D.; Geisendorf, S. Valuing ecosystem services of sustainable urban drainage systems: A discrete choice experiment to elicit preferences and willingness to pay. J. Environ. Manag. 2022, 307, 114508. [Google Scholar] [CrossRef]
- Luo, Y.; Deng, J.; Pierskalla, C.; Lee, J.H.; Tang, J. New Ecological Paradigm, Leisure Motivation, and Wellbeing Satisfaction: A Comparative Analysis of Recreational Use of Urban Parks before and after the COVID-19 Outbreak. Land 2022, 11, 1224. [Google Scholar] [CrossRef]
- Chen, M.; Martens, P. Environmental Concern and Public Attitudes toward Marine Life in Coastal China. Anthrozoös 2023, 36, 117–136. [Google Scholar] [CrossRef]
- Eusse-Villa, L.; McBratney, A.; Franceschinis, C.; Meyerhoff, J.; Field, D.; Thiene, M. Mapping citizens’ attitudes towards soil ecosystem services: A case study from New South Wales, Australia. Soil Secur. 2022, 7, 100063. [Google Scholar] [CrossRef]
- Jolliffe, I.T. Principal Component Analysis for Special Types of Data; Springer: New York, NY, USA, 2002; pp. 338–372. [Google Scholar]
- Rideout, B.E.; Hushen, K.; McGinty, D.; Perkins, S.; Tate, J. Endorsement of the New Ecological Paradigm in Systematic and E-mail Samples of College Students. J. Environ. Educ. 2005, 36, 15–23. [Google Scholar] [CrossRef]
- Ntanos, S.; Kyriakopoulos, G.; Skordoulis, M.; Chalikias, M.; Arabatzis, G. An Application of the New Environmental Paradigm (NEP) Scale in a Greek Context. Energies. 2019, 12, 239. [Google Scholar] [CrossRef]
- Clark, C.F.; Kotchen, M.J.; Moore, M.R. Internal and external influences on pro-environmental behavior: Participation in a green electricity program. J. Environ. Psychol. 2003, 23, 237–246. [Google Scholar] [CrossRef]
- Aldrich, G.A.; Grimsrud, K.M.; Thacher, J.A.; Kotchen, M.J. Relating environmental attitudes and contingent values: How robust are methods for identifying preference heterogeneity? Environ. Resour. Econ. 2007, 37, 757–775. [Google Scholar] [CrossRef]
- Mishra, J.; Mishra, P.; Arora, N.K. Linkages between environmental issues and zoonotic diseases: With reference to COVID-19 pandemic. Environ. Sustain. 2021, 4, 455–467. [Google Scholar] [CrossRef]
- Mann, B.; Whitney, D. On a test of whether one of 2 random variables is stochastically larger than the other. Ann. Math. Stat. 1947, 18, 50–60. [Google Scholar] [CrossRef]
- Farjam, M.; Nikolaychuk, O.; Bravo, G. Experimental evidence of an environmental attitude-behavior gap in high-cost situations. Ecol. Econ. 2019, 166, 106434. [Google Scholar] [CrossRef]
- Paterson, D.M.; Hanley, N.D.; Black, K.; Defew, E.C.; Solan, M. Biodiversity, ecosystems and coastal zone management: Linking science and policy. Mar. Ecol. 2011, 434, 201–202. [Google Scholar] [CrossRef]
- Albrecht, D.; Bultena, G.; Hoiberg, E.; Nowak, P. Measuring Environmental Concern: The New Environmental Paradigm Scale. J. Environ. Educ. 1982, 13, 39–43. [Google Scholar] [CrossRef]
- Edgell, M.C.R.; Nowell, D.E. The new environmental paradigm scale: Wildlife and environmental beliefs in British Columbia. Soc. Nat. Resour. 1989, 2, 285–296. [Google Scholar] [CrossRef]
- Noe, F.P.; Snow, R. The New Environmental Paradigm and Further Scale Analysis. J. Environ. Educ. 1990, 21, 20–26. [Google Scholar] [CrossRef]
- Shetzer, L.; Stackman, R.W.; Moore, L.F. Business-Environment Attitudes and the New Environmental Paradigm. J. Environ. Educ. 1991, 22, 14–21. [Google Scholar] [CrossRef]
- Bechtel, R.B.; Verdugo, V.C.; de Queiroz Pinheiro, J. Environmental Belief Systems: United States, Brazil, and Mexico. J. Cross-Cult. Psychol. 1999, 30, 122–128. [Google Scholar] [CrossRef]
- Noe, F.P.; Hammitt, W.E. Environmental attitudes and the personal relevance of management actions in a park setting. J. Environ. Manag. 1992, 35, 205–216. [Google Scholar] [CrossRef]
- Noe, F.P.; Snow, R. Hispanic Cultural Influence on Environmental Concern. J. Environ. Educ. 1990, 21, 27–34. [Google Scholar] [CrossRef]
- Scott, D.; Willits, F.K. Environmental Attitudes and Behavior: A Pennsylvania Survey. Environ. Behav. 1994, 26, 239–260. [Google Scholar] [CrossRef]
- Gooch, G.D. Environmental Beliefs and Attitudes in Sweden and the Baltic States. Environ. Behav. 1995, 27, 513–539. [Google Scholar] [CrossRef]
- Atav, E.; Altunoğlu, B.D.; Sönmez, S. The Determination of the Environmental Attitudes of Secondary Education Students. Procedia Soc. Behav. Sci. 2015, 174, 1391–1396. [Google Scholar] [CrossRef]
- Roberts, J.A.; Bacon, D.R. Exploring the Subtle Relationships between Environmental Concern and Ecologically Conscious Consumer Behavior. J. Bus. Res. 1997, 40, 79–89. [Google Scholar] [CrossRef]
- Furman, A. A Note on Environmental Concern in a Developing Country: Results From an Istanbul Survey. Environ. Behav. 1998, 30, 520–534. [Google Scholar] [CrossRef]
- Denis, H.D.; Pereira, L.N. Measuring the level of endorsement of the New Environmental Paradigm: A transnational study. Dos Algarves Multidiscip. E-J. 2017, 23, 4–26. [Google Scholar]
- Erdogan, N. Testing the new ecological paradigm scale: Turkish case. Afr. J. Agric. Res. 2009, 4, 1023–1031. [Google Scholar]
- Moyano-Diaz, E.; Palomo-Vélez, G. Propriedades Psicométricas da Escala Novo Paradigma Ecológico (NEP-R) em População Chilena. Psico 2014, 45, 415. [Google Scholar] [CrossRef]
- Simmons, D.; Widmar, R. Motivations and Barriers to Recycling: Toward a Strategy for Public Education. J. Environ. Educ. 1990, 22, 13–18. [Google Scholar] [CrossRef]
- Thapa, B. Environmentalism: The Relation of Environmental Attitudes and Environmentally Responsible Behaviors among Undergraduate Students. Bull. Sci. Technol. Soc. 1999, 19, 426–438. [Google Scholar] [CrossRef]
- Mobley, C.; Vagias, W.M.; DeWard, S.L. Exploring Additional Determinants of Environmentally Responsible Behavior: The Influence of Environmental Literature and Environmental Attitudes. Environ. Behav. 2010, 42, 420–447. [Google Scholar] [CrossRef]
- Halkos, G.; Matsiori, S. Gathering society’s opinion of the sustainable management and economic value of the coastal zone. Sustain. Dev. 2018, 26, 701–712. [Google Scholar] [CrossRef]
- Diamantopoulos, A.; Schlegelmilch, B.B.; Sinkovics, R.R.; Bohlen, G.M. Can socio-demographics still play a role in profiling green consumers? A review of the evidence and an empirical investigation. J. Bus. Res. 2003, 56, 465–480. [Google Scholar] [CrossRef]
- Zelezny, L.C.; Chua, P.-P.; Aldrich, C. New Ways of Thinking about Environmentalism: Elaborating on Gender Differences in Environmentalism. J. Soc. Issues 2000, 56, 443–457. [Google Scholar] [CrossRef]
- Mohai, P. Men, women, and the environment: An examination of the gender gap in environmental concern and activism. Soc. Nat. Resour. 1992, 5, 1–19. [Google Scholar] [CrossRef]
- Liu, P.; Teng, M.; Han, C. How does environmental knowledge translate into pro-environmental behaviors?: The mediating role of environmental attitudes and behavioral intentions. Sci. Total Environ. 2020, 728, 138126. [Google Scholar] [CrossRef]
- Ebreo, A.; Hershey, J.; Vining, J. Reducing Solid Waste: Linking Recycling to Environmentally Responsible Consumerism. Environ. Behav. 1999, 31, 107–135. [Google Scholar] [CrossRef]
- Lück, M. The «New Environmental Paradigm»: Is the scale of Dunlap and Van Liere applicable in a tourism context? Tour. Geogr. 2003, 5, 228–240. [Google Scholar] [CrossRef]
Disclaimer/Publisher’s Note: The statements, opinions and data contained in all publications are solely those of the individual author(s) and contributor(s) and not of MDPI and/or the editor(s). MDPI and/or the editor(s) disclaim responsibility for any injury to people or property resulting from any ideas, methods, instructions or products referred to in the content. |
© 2024 by the authors. Licensee MDPI, Basel, Switzerland. This article is an open access article distributed under the terms and conditions of the Creative Commons Attribution (CC BY) license (https://creativecommons.org/licenses/by/4.0/).