1. Introduction
Urban growth in cities has increased exponentially in recent decades, generating a significant increase in urban informal settlements, especially in Latin American cities, resulting in a high expansion of urban territories in a disorderly manner [
1,
2,
3]. The city as the central axis of economic development has gradually been transformed into an epicenter saturated with urban inhabitants, industry, transportation, pollution, informality, climate change, citizen insecurity, and urban overcrowding, among others. In this scenario, and especially in view of the reduced foresight and planning of Latin American cities, this has had a negative impact on the use and optimization of the necessary resources that an urban territory should have in order to provide a perception of quality of life for its inhabitants [
4,
5].
Nearly one billion people live on the continents of Asia, Africa, and Latin America, equivalent to one-sixth of the world’s population and one-third of all urban dwellers who live in informal settlements, unplanned environments, and precarious housing. According to UN-Habitat, this number is expected to double by 2030. Approximately 1.3 billion people live below the poverty line, and, of these, 886 million live in middle-income countries such as Latin America, increasing informal settlements, poverty, and facing risks of polluted air, unhealthy water, and malnutrition [
6,
7,
8,
9].
There is a perception of an urban crisis in Latin American countries, a pressing trend in loss of quality of life in many cities that materializes in direct risks to their inhabitants as well as to the territories to which they belong culturally and socially [
10]. This urban crisis associated with population growth and poverty that converge in underdeveloped cities is characterized by poor planning and informality in urban development [
11]. The 2002 United Nations Environment Program Report has stated that poverty is one of the main factors that generate environmental degradation and neighborhood informality and is intrinsically related to accelerated urbanization and globalization. This phenomenon affects, to a certain extent, equitable urban developments, excluding people living in the informal city [
12].
Informal neighborhoods in Latin America often have negative impacts on various strategic ecosystems, exceeding their carrying capacity, limiting environmental services, and accelerating climate change [
13]. In this context, the inhabitants of informal neighborhoods live in inadequate housing located in high-risk areas (in most cases not mitigable) and in places where public spaces are invaded by illegal groups that sell lots in areas that, due to their geographic location and danger, end up being unsuitable for creating a decent urban space [
14]. These types of buildings do not have coverage of basic public services, public transportation, basic urban infrastructure, and clear land legalization processes, accentuating the existing correlation between poverty and public health in a territory [
12,
15]. The conditions of environmental pollution, exclusion, violence, misery, precarious habitability, high energy, natural resource consumption, unemployment, informal housing, urban overcrowding, low governance, and high migration limit urban growth and magnify poverty, informality, and unhealthiness in Latin American contexts [
16,
17].
The concept of quality of life from an urban planning perspective is considered as a determinant to conceive a more inclusive and friendly urban design for its inhabitants, so it can be understood as the level of satisfaction they have in cities since it conditions the spatial and territorial planning strategies that are projected in urban areas by the regulatory bodies since it directly affects the social, environmental, economic, cultural and legislative components because the quality of life must consider the systemic relationships between these factors in order to have a positive impact on human beings [
18]. This dynamic concept, which goes beyond leisure, increased income, and material goods, also depends on the opportunities that people have to obtain what they consider valuable and that provide them with a feeling of well-being and security in their environment [
19].
To determine the level of quality of life of a population from a health perspective, the dimensions of basic infrastructure, housing, household services, environment, and employment must be taken into account. With these needs covered, the biological territorial vulnerability of the inhabitant gradually decreases, which is related to fundamental aspects of public health that mainly affect the informal city. The impacts caused by the increase in biological vulnerability can increase poverty in terms of the presence of diseases and malnutrition, which prevent the inhabitants of the neighborhoods from improving their quality of life conditions, given the need to allocate a greater proportion of their income to corrective health issues [
6].
This study, focused on the dynamics of the informal city, was developed in a community attached to the TECHO Colombia Organization, which is made up of volunteers together with inhabitants of informal settlements in Latin America who work to support the overcoming of poverty through training and joint action of its inhabitants, volunteers, and other actors by improving urban habitability with the implementation of community infrastructure projects, education for development, and social entrepreneurship [
20].
Therefore, this work sought to address the complexity of unplanned urban spaces from an evaluation of their level of sustainability, taking into account the impacts on the territory and their relationship with the health-disease processes to which their inhabitants are exposed. Many of the measurement processes consulted at the global and local levels focus on reporting numerical indicators without taking into account the impacts they have on people’s quality of life, for which this study focused on public health. Likewise, many of the results presented to the communities are not fully understood because the numerical expressions are not justified in a correlative manner with the reality that many of these populations in Latin America live because they are far from the formal city.
The main limitations of the study were related to the aspects of accessibility to the territory given its geographic location and the lack of formal transportation to the neighborhood; another limitation was citizen insecurity, so the authors had to coordinate the visits previously with the TECHO Colombia Organization in order not to generate a risk in the face of the crime rate. Likewise, another limitation was related to the spaces to carry out the workshops with the community since there is no basic infrastructure. The social mapping sessions were held in a meeting room of the church of the sector on Sundays, due to the fact that another limitation was the community’s time, as they work informally from Monday to Saturday.
Finally, for the follow-up of this work, the authors will rely on the infrastructure area of the TECHO Colombia Organization, as this organization promotes the construction of community infrastructure in the sector with which improvements are projected in terms of roads, retaining walls, recovery of public space, community halls, and emergency housing, works that will improve the indicators and their causalities against impacts on the territory and health-disease processes in the inhabitants.
The document is organized as follows.
Section 1.1 provides background information, and
Section 1.2 presents the local problem.
Section 2 describes the methodological framework of research framed in action research, cross-sectional research, and causal correlation design. The results are presented in
Section 3. The discussion of the results is in
Section 4, and the conclusions of the study are in
Section 5.
1.1. Background
The New Urban Agenda was presented at Habitat III in Quito, Ecuador, in 2016. This agenda functions as a driver of the Sustainable Development Goals (SDGs), in particular SDG 11, which deals with how to make cities and human settlements inclusive, safe, resilient, and sustainable, thus improving the quality of life of its inhabitants [
15,
21,
22,
23,
24].
Regarding indicators of sustainable cities, they developed an analysis of indicator-related factors, such as categories and sectors of informal housing [
25,
26]. Making a synthetic analysis of smart and other sustainable parameters [
27], they compiled different tools of sustainable indicators from the University of Toronto, the World Bank, and the World Resources Institute, as well as Eurostat and the World Health Organization [
28] establishing a list of 51 indicators for urban sustainability.
The indicators established by UN-Habitat in its proposal “United for Smart Sustainable Cities—U4SSC (2017)” present indicators from the environmental, economic, and sociocultural dimensions. For their part, Ref. [
29] have proposed a methodological tool that allows the analysis of the development of emerging cities with high population density, including factors associated with sustainability, building conditions, and urban renewal. Thus, the Inter-American Development Bank (IDB) has proposed a methodological guide of sustainable development indicators for an emerging city. These indicators are divided into three dimensions: environment, urban and fiscal development, and governance [
30].
With regard to different indicators that evaluate neighborhood informality, in the neighborhoods called “Exposición and São Pelegrino”, in the city of Caxias do Sul, Brazil, several indicators of housing density, population density, public transportation, as well as parameters of location of parks and squares, equipment, connectivity, and sustainability, have been taken into account. As for the work of analysis at the neighborhood scale in the city of Temuco, Chile [
31], in which four neighborhoods have been evaluated using as a basis the system of urban indicators of the Malaga protocol [
32], whose methodology is based on the existing distance from a given service to meet a need of an inhabitant. On the other hand, Ref. [
18] compared eight informal neighborhoods in the city of Bogotá, prioritizing indicators related to pedestrian streets, compact and connected development, and mixed land use.
Taking into account that documents were reviewed that presented sustainability indicators from the economic, environmental, and social dimensions, it was identified for this research that the sustainability of a territory is divided into three large areas: the biotic, abiotic, and anthropic parts; having a balance in these dimensions, a territory in addition to being sustainable, is efficient and provides quality of life to its inhabitants. This assertion was fundamental to subsequently define the variables and indicators used in this study together with the community.
1.2. Problem
In Bogotá’ s specific case, a poverty rate close to 27% was reached in the year of 2019 and showing an increase in the year 2020 of 12.9 percentage points. Likewise, in the year 2021, a Gini coefficient of 0.528 was reached. In this context, there was a setback in the goals corresponding to the mortality rate in children under 5 years of age due to acute malnutrition, more than half of the infant deaths (56%), concentrated especially in the localities of Ciudad Bolivar, Suba, Bosa, Kennedy, and Engativá. In short, in housing, in the context of the year 2021, the qualitative deficit was 9.0% and in quantitative character with a value close to 1.6% [
33].
Regarding citizen security in Bogota, in 2021, the homicide rate increased from 13.4 in 2020 to 14.4 in 2021; between 2020 and 2021, the personal injury rate increased by 24.6%; andm in the case of theft from persons in 2021, an increase of 28.6% was observed. Regarding air quality, in the period from 2017 to 2021, the concentration of particulate matter (PM10) in the atmosphere exceeded the permissible limits recommended by the World Health Organization (20 μg/m
3) due to the increase in freight transportation and in a smaller area planted with trees per inhabitant. By 2021, the amount of waste disposed of in the Doña Juana landfill increased, and only 33.5% of this waste was used. This situation deepened inequality throughout the city, affecting the most vulnerable populations, impacting their quality of life in the city [
33].
As for the informal neighborhood areas of Ciudad Bolívar, the residential areas are close to places such as garbage dumps and areas of natural risk. Coverage of public utilities is precarious in terms of water, sewage, garbage collection, and natural gas. The locality has air pollution with measurements of more than 20 μg/m
3 (in PM10), noise problems, excessive advertising, and environmental unhealthiness. In this scenario, about 34% of the inhabitants stated that this type of pollution is frequently present in the surroundings of their homes, affecting the well-being of the family. In a demographic context, there is an active population of 361,000 people, 80% of whom work in the informal sector. At a general level, the percentage of people in multidimensional poverty is one of the highest in Bogota, with 97,447 people with unsatisfied basic needs (UBN), and the displaced population living in this locality is significantly high, with values close to 70% [
34].
On the other hand, community processes of sustainable, legal, and formal occupation of a territory are dynamic agents in the planning of cities that promote the care of their ecosystems and, above all, that respect institutionalism and promote social development, conditions that show little progress in Latin America [
35]. Population growth in urban areas is expected to continue at a dizzying pace in the coming decades, which has significant implications for environmental sustainability and public health in the territories [
36]. However, urbanization is not only a spatial process promoted by population growth but also a stimulus that, if properly oriented, can be used to overcome other global problems such as poverty, inequality, environmental degradation, climate change, biodiversity loss, and conflicts, which are critical elements of the 2030 Agenda and are related to quality of life [
30].
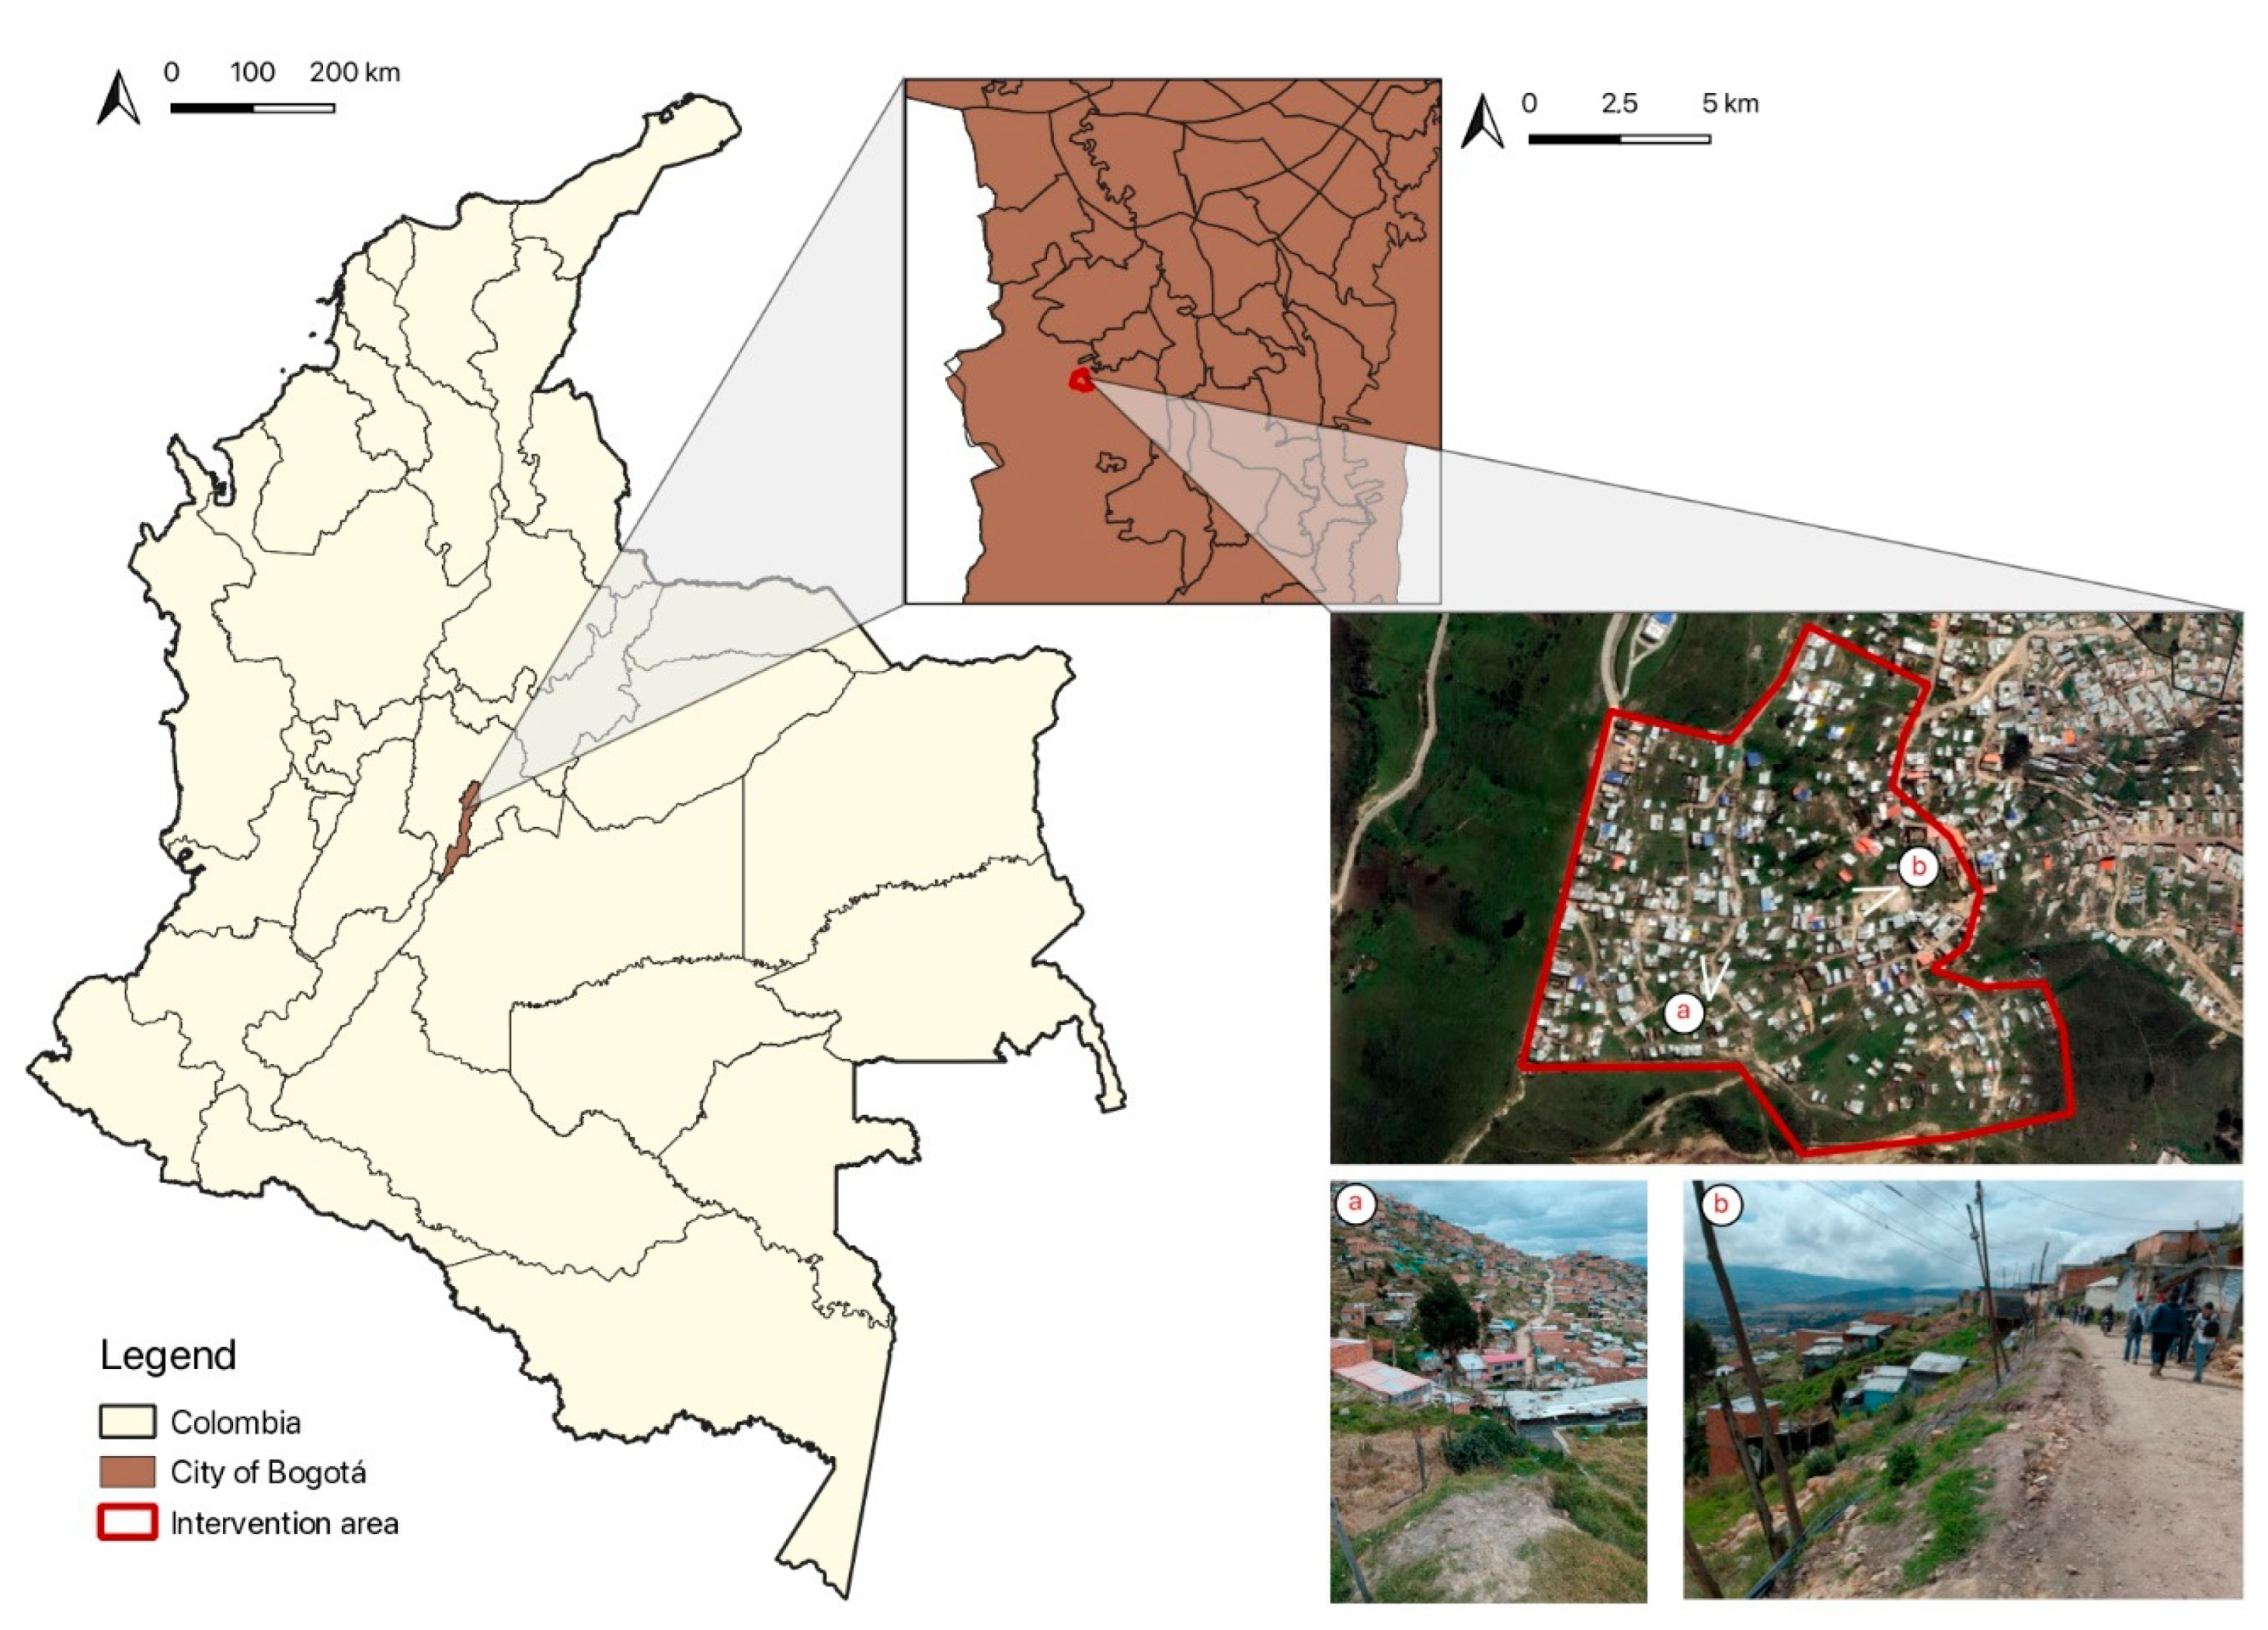
The territory of Santa Marta is an informal settlement located on the border between Ciudad Bolívar in Bogotá and the Progreso neighborhood in the municipality of Soacha, Cundinamarca. The informal occupation of this sector began in the 1990s due to the displacement of people from rural areas of Colombia as a result of violence. This situation of displacement, which continues to grow exponentially at present, has increased problems in the neighborhood, such as a lack of formal public services, air pollution problems, soil and nearby water sources, lack of green areas, open dumps, the presence of pests and vectors, teenage pregnancy, citizen insecurity, poor conditions of primary and secondary roads, poor condition of pedestrian paths, high probability of natural emergencies, and insecurity in the tenure and self-construction of housing, among others. This situation has had a negative impact on the quality of life of the sector’s inhabitants, exposing them to a high probability of presenting episodes of physical and mental illnesses as a result of the neighborhood’s informality (
Figure 1).
2. Materials and Methods
To develop this work, mixed research was chosen to meet the proposed objectives, which allowed focusing on a nested or embedded concurrent dominant model design (DIAC), which simultaneously collects quantitative and qualitative data, and where a predominant method guides the scope of the project and the fulfillment of the objectives. Likewise, one approach can be framed within the other method, with the lower priority method being nested or embedded within the one that is considered central [
37].
For the purposes of the research, the central method was framed in the action-research design related to qualitative research. Its main purpose is focused on providing information to guide decision-making in the communities, promoting social change, contributing to the transformation of reality, and making people aware of their role in the process of appropriation of their territory. The three main phases of action research designs are: to observe, where the problem is visualized, and data are collected; the thinking phase, where the data obtained are analyzed and interpreted; and, finally, the acting phase, where the findings are presented to the community in order to promote solutions adjusted to the contexts where the first two phases were developed [
37].
The process to carry out this research variant was followed in the study in order to fulfill the objectives of: to establish participatively dependent and independent variables and to define indicators related to neighborhood informality, for which the study was conducted with the community. The variables and indicators were selected based on the identification of their needs in relation to the territory in a participatory work of social mapping, in addition to having as a basis for the exercise the antecedents related in this document.
Based on the action research approach, the phases of the methodology were developed as follows (
Figure 2):
- 1.1.
Selection of the neighborhood considered
The sampling implemented in the area of Santa Marta in Ciudad Bolivar was related to quantitative research, as the territory and a number of individuals were selected for the study, taking into account that they should be linked to the work developed in the neighborhood by the TECHO Colombia Organization, an organization that has an agreement with the Catholic University of Colombia to develop classroom work, research, and social projection aimed at overcoming poverty in informal contexts. For this specific case, we first proposed the definition of the unit of analysis, which focused on 20 people participating in the processes carried out by the infrastructure area of TECHO Colombia in the sector because they have been trained in environmental education, community infrastructure, and social entrepreneurship by the organization’s staff, which facilitated the work with the team proposing this research.
Taking into account the above, it was decided to delimit the unit of analysis to these participants since they know in depth the problems of habitability to which their relatives and neighbors are exposed, and they are also aware of the real situation of the territory. Therefore, a non-probabilistic sampling was carried out, where the choice of the elements did not depend on probability but on the causes related to the characteristics of the research and the interest of the researcher [
37], which is why, in these 20 people, the element of representativeness of the population necessary for the proposed research was found, as this small portion of the community of Santa Marta had the availability to attend the work sessions, confidence in the processes developed by the TECHO Colombia Organization, and recognition by the neighbors of the neighborhood as community leaders.
Likewise, 16 ninth-semester civil engineering students from the Community Development Project course participated, who supported the processes of collecting information in the field, developing the community work sessions and reporting data to the research team. It should be noted that the linkage of this group of students was carried out through a classroom project that was carried out since 2017 with the TECHO Colombia Organization, in which, every six months, students are linked to a volunteer program that promotes the design and construction of community infrastructure in informal territories attached to the TECHO Colombia Organization.
- 1.2.
Construction of the evaluation questionnaire
In order to conduct an analysis of the context of informality of the community of Santa Marta with respect to their conditions of occupation and sustainability, it was necessary to identify the units of analysis focused on the dependent and independent variables and indicators. Regarding the selected variables, these were identified together with the students and the participating community in a tour that was carried out in 4 evenly distributed groups (students and people from the community) accompanied by two professors from the Catholic University of Colombia of the Civil Engineering program.
During this tour, it became evident first hand that the problems observed by the team and those expressed verbally by the community should be categorized into two types of variables; dependent variables are those that are studied and measured based on the manipulation or variation in independent variables, which are those that have a direct effect on the dependent variable [
37]. Therefore, for the development of this day of recognition and categorization of the dependent and independent variables, the work team relied on the methodology of [
38], which aimed to collect data in the field presenting a series of variables and indicators organized in such a way that the territories could be categorized at the urban level considering three degrees of evaluation: precarious, consolidated, and semi-consolidated [
38].
Based on the above, the dependent and independent variables that were considered precarious during the field visit were taken into account for this study since, based on what was collected during the day by the students and what was expressed by the community, the variables that required priority attention to improve the informal conditions of the sector were:
Basic services: formal and informal infrastructure works arranged in a territory to meet the needs of the population in terms of public services at the urban level.
- 1.1.
Drinking water: water with disinfection processes suitable for human consumption and food preparation.
- 1.2.
Sanitation services: conventional or alternative system for the treatment and disposal of excreta at the household level.
- 1.3.
Cleaning services: storage, collection, and final disposal of household, commercial, municipal, hazardous, and debris solid waste.
- 1.4.
Energy: energy infrastructure and other fuel sources with formal or informal connection at the household level.
- 1.5.
Mobility: set of services and infrastructure that facilitate movement from one place to another by different means, whether motorized, non-motorized, or animal traction.
The uses of the peri-domicile: delimited urban environment, its resources, services, equipment, and neighborhood.
- 2.1.
Land uses: distribution of land uses in a territory established by land use plans.
- 2.2.
Public spaces: directly related to common goods where the ownership of these is not subordinated to a particular holder.
Risks on the ground: identification of areas with mass removal and flooding processes that affect security of tenure in a territory.
- 3.1.
Natural factors: set of risks present in a territory that may lead to flooding and mass removal effects.
Housing tenure: legally and socially defined perception that validates the recognition and possession of private property.
- 4.1.
Illegality: absence of an institutional recognition validated in administrative acts to corroborate the legality of housing units.
- 4.2.
Construction materials: raw materials and set of techniques protected by current legislation to build infrastructure works designed to improve the shelter of human beings.
- 4.3.
Sustainable systems: alternative systems of utilization at the household level.
Socioeconomic: social, cultural, and age characteristics linked to the person and defined by the territory and environment in which he/she develops.
- 5.1.
Social mix: denotes the social diversity of a delimited territory.
- 5.2.
Vulnerable population: population under 5 years of age and over 60 years of age.
To comply with the DIAC design, the nested approach to quantitative research relied on a trans-sectional or cross-sectional research design approach, which is based on data collection in a single moment at a single time. The purpose of this is to identify situations and analyze their incidence at a given time, which is why the single data collection may cover several groups or subgroups of people in the community, situations, or events [
37,
39].
Therefore, after identifying and defining the dependent and independent variables, the indicators to be evaluated were proposed during another day of field work with the same groups of students and community. The 31 proposed indicators were designed in two workshops in the subject of the Community Development Project, where, with the groups of students, the means of verification in the field were constructed and defined to categorize the territory in what was considered a precarious territory, which, according to [
38], is characterized by its high conditions of informality in its occupation, and the availability, access, and quality are difficult for its inhabitants in terms of: open physical spaces, permanent and temporary lodging, commerce, endowment use, recreation and sports, cultural, furniture, mobility, and comfort.
Having defined the indicators and their means of verification in the field, a second day of work was planned, for which, in the same groups formed, the indicators were applied, establishing a dynamic of direct and fluid communication between the community and the students. On this day, it was possible to identify that the indicators evaluated in the territory had a series of consequences according to the perception of the inhabitants, as, in the work groups, they stated that garbage; atmospheric pollution; the presence of rats, flies, and sick animals; accidents; insecurity; and lack of public services and urban furniture, among others, were caused by the precariousness of the neighborhood due to its informality in its urban consolidation.
Based on what was evidenced during the field work, in order to facilitate the identification of the relationships between the indicators and the consequences that the community expressed that directly affected their quality of life, causal diagrams (CDs) were used to identify the causal relationships between the different factors and events found in the territory. The CDs were dynamic, which means that they were updated as more information was obtained or changes were made to the system. This allowed teams to update and adjust their models as they learned more about the system in question [
40].
Therefore, in order to create the CDs by the group of researchers, they began with the identification of the factors that were contributing to the problem or situation being studied, in this case, how the community’s manifestations in the application of the indicators affected their quality of life from the informality of the territory. These factors were represented in the diagram as nodes or boxes. Then, the causal relationships between these factors were identified and represented as arrows connecting the nodes; the arrows indicate the direction of the causal correlation between two nodes. At these nodes, the type of causality that exists within both variables can be placed, being negative (inversely proportional) or positive (directly proportional). This facilitated the understanding of the behavior of the variables and, at the same time, the behavior of the system, which made it easier for the work team to classify the nuisances referred to by the community into impacts that were later discussed with the participating community [
41,
42].
Taking into account the causalities found, a third working day was planned to validate the impacts caused by the indicators evaluated in the field in a participatory manner. On this day, first-hand information was gathered, where the view of the inhabitants of the sector in relation to the territory was able to identify 17 impacts linked to the daily anthropic activities in the urban area that directly affected the quality of life of the population since a general dissatisfaction of the community was expressed in relation to the following impacts [
43,
44,
45]:
Accidents;
Rental of sanitary facilities;
Slum construction;
Landscape degradation;
Water pollution;
Excreta contamination;
Sewage contamination;
Structural vulnerability;
Fires;
Tenure insecurity;
Citizen insecurity;
Leachate;
Air pollution (particulate matter);
Vectors and pests;
Hazardous waste;
Solid waste;
Dumping.
The related impacts were categorized with the help of the students and the tutoring of the teachers to organize the ideas expressed by the population, for which they were supported by a social mapping, where the participants related the indicators with the inconveniences they generated, which served to facilitate the categorization.
Using visual techniques such as problem maps to graphically represent the relationships between different aspects of the environment and to point out problem areas, served for the community to communicate their felt needs with the environment, the need was created to share their views with students and teachers to achieve success in the work process, so that, in this part, thanks to the participation of the community, the local knowledge of the participants and the technical knowledge of the universities was integrated [
46,
47].
2.1. Standardization of Qualitative Judgments
After identifying the relationship between the indicators and the impacts they had on the inhabitants, we proceeded to quantify the level of these impacts in the territory, as, from the inhabitant’s perception, there was no clarity on the degree of affectation of the impacts manifested in the community and their incidence on the quality of life; therefore, we proceeded to review specific bibliography [
48,
49,
50,
51,
52,
53,
54,
55,
56] to evaluate the impacts caused by human activities, adopting an “ad hoc” qualification method based on the formula proposed by [
57,
58], where, based on the evaluation of biotic, abiotic, and anthropic indicators, the level of impact on a territory, ecosystem, or sector is reported from an environmental perspective, which is directly related to the concept of quality of life from Sustainable Development Goal 3: Ensure healthy lives and promote well-being for all at all ages from considering that a healthy environment is vital to ensure healthy lives and promote well-being for all at all ages.
In order to apply the formula by the authors in the assigned scale of values, it was necessary to carry out a fourth day of field work, which made it possible to identify, in a participatory manner, the existence, speed, importance, and permanence of each impact reported in the territory by the participants. With the above exercise, it was possible to quantify the perception of the inhabitant and thus identify the level of the impacts found in the application of the indicators in the territory.
2.2. Value of the Level of Impacts
The following mathematical formula was used to determine the value of the level of impacts [
57,
58]:
where each of the variables in the formula is described below (
Table 1):
Weight Balance Constant (C): 0.5
Taking into account the ranges and valuations of the variables described in the formula, we proceeded to determine the quantitative value of the impacts identified in the territory, taking into account the following categorization (
Table 2):
From the application of the mathematical formula, the assessment of the level of impacts was obtained.
- 3.1.
Definition of health impacts
Taking into account the previous quantitative hierarchy presenting the range and valuation of the level of impacts on the territory, in order to establish the relationship between an informal precarious territory and the direct consequences of this on the quality of life of the inhabitant, it was necessary to relate how the impacts could affect the inhabitant from the public health aspect. To each impact, health-disease episodes were related according to the provisions of the Faculty of Medicine of the National University of Colombia, which developed a transectional methodology in which the major risk factors that link physical and mental diseases with housing and environmental indicators are coded, with the objective of dimensioning a base epidemiological scenario in a territory [
59,
60].
To develop this correlation between impacts on the territory and physical and mental illnesses, the research developed by [
59] was reviewed. The physical and mental health episodes that occur in an urban settlement are related if the following conditions are not taken into account: comfort in housing, sufficient and separate spaces in housing, structurally safe housing, housing materials, security of tenure, access to public services, basic sanitation, storage and handling of water for human consumption, vectors, pests and sick animals, urban equipment, unsafe land, accidents, exposure to contamination, community participation, preventive health, diseases, and poverty.
After making this correlation, we proceeded to corroborate the morbidity and mortality episodes in the locality of Ciudad Bolivar in Bogotá, whose data were reviewed in [
61], which interprets individual, family and community health as the result of biological and psychological influences of a person’s immediate physical and social environment. This text provided a diagnosis of the quality of life, health and disease conditions of the population of Ciudad Bolivar in general, which, based on statistical, geographic and epidemiological data, facilitated the identification of patterns, variables and different social and population phenomena that affect health and disease processes in the community.
- 3.2.
Association between impact on the territory and health impact
Based on the information consulted, the number of impacts susceptible to materialize a disease was determined. In a fifth day of community work, the team of students presented the proposal of correlation between the categorized impacts and the health and disease processes they entailed, for which it was verified with the population that the pathologies did occur in the community, making the participants associate that the conditions of informality could be the cause of a high probability of the physical and mental diseases they had been diagnosed with or perceived, directly affecting their quality of life.
With regard to the thinking phase corresponding to data analysis, it was important to take into account the points of view of those directly affected and of the actors who intend to contribute to the generation of knowledge in the territory. Therefore, it was essential to involve the following actors: the community, the TECHO Colombia organization, researchers, and students; from work processes, it would be possible to understand the direct relationship between neighborhood informality and public health in the inhabitant, as without actively involving the community, it is unlikely to generate a long-term sustainable solution, reducing the group’s effort to little more than good intentions and paternalism [
62].
3. Results
The methodological framework made it possible to participatively establish 5 dependent variables and 13 independent variables, define 31 indicators, identify 17 impacts present in the territory, and determine a correlation between indicators and impacts linked to neighborhood informality, in order to relate 8 pathologies that directly affect the quality of life and well-being of the population from the health-disease processes linked to the territory of Santa Marta.
According to
Table 3 and
Table 4, it was established that the neighborhood is made up of 200 households, where one third of the population living in the territory is of Afro descendant and an indigenous origin. Due to the displacement of inhabitants from rural areas to urban peripheries, the total population is made up of displaced persons from different regions of the country, where approximately 10% of the people in the sector are adults over 60 years of age, and 20% of them are children under 5 years of age.
Regarding the basic services variable, the 200 families living in the neighborhood are supplied with illegal connections to access drinking water, using handmade connections made with polyethylene hoses and PVC fittings; this supply is illegally connected to a mother pipe of the Bogota aqueduct. There is no formalized sewage service; excreta are disposed of in open-air ditches that are gravity-fed to an environmental protection zone, and some houses rent sanitation services from their neighbors. Solid waste and debris are disposed of in three specific locations: in the Terreros wetland, along the main roads, and in the community park; although garbage collection is provided every other day, it is difficult to access because of the narrow, poorly maintained roads. The area lacks gas service, pedestrian walkways, bike paths, and bus stops. Energy connections are illegal and are supported by wooden poles, and the roads are in poor condition with a high presence of particulate matter.
Regarding peri-domicile uses, in relation to land uses, two commercial zones were identified, one in the upper zone and the other in the lower part of the sector, where the main roads are located; these zones offer basic family products and cleaning supplies, as well as taverns. The neighborhood only has two churches and a school; the other services are not covered, so the indicators are negative, and the inhabitants must move to other sectors of the city to meet these needs. In the residential area, ten blocks were identified where all the houses are of informal origin, and, on average, each house is 5 to 5.5 m wide. Also, in terms of public spaces, there is only one environmental protection area, the Terreros wetland on the border with the municipality of Soacha Cundinamarca, but it is contaminated by sewage discharges; apart from the wetland, there is an area with vegetation cover, a communal park in poor condition with the presence of solid waste, hazardous waste (dead animals), and debris, which serves as a place for meeting, recreation, sports practice, and consumption of psychoactive substances.
Regarding the variable of risks in the terrain, it was found that the natural factors of granular material detachment are present in the two main roads of the sector, perceiving a high risk on the part of the community during the rainy season since the runoff drags material from the soil in an approximate of 15 cm per year. There are also three areas with localized flooding due to the lack of mixed sewage systems and the use of artisanal sewage collection networks, which intensifies flooding episodes during the winter season.
Regarding housing tenure, in terms of legality, it was found that the territory is made up of informal dwellings since the people who live there do not have legal documentation accrediting them as owners of the land and buildings. All the houses are self-built and have between 1, 2, and 3 levels; the construction materials used for walls, floors, and roofs are in gray work, in poor condition, or in slum conditions. According to an estimate of the 180 houses identified, 80 are built with masonry and 100 with waste materials such as plastic, metal, and cardboard. No practices that promote the sustainable use of resources, such as rainwater harvesting systems, green roofs, or urban crops, were observed in the houses.
Taking into account the situational framework provided by the application of the indicators, a causal diagram was made (
Figure 3) that represents in a systemic way what was expressed by the community in relation to how living in an informal territory affects their quality of life based on the quantitative data collected in the field by the work team.
These causal correlations provided a dynamic and complex system in which it was possible to build a holistic scenario that facilitated the understanding of the impacts caused by the proposed indicators, making it possible to identify the impacts to be evaluated quantitatively in conjunction with the community (
Table 5).
Taking into account the above assessment, physical and mental health episodes were identified, which, due to the conditions of neighborhood informality, exposed the community of the Santa Marta sector from the impacts assessed in the territory (
Table 6).
4. Discussion
Taking into account the results obtained, it was inferred that the majority of children under 5 years of age suffer from moderate malnutrition and are susceptible to morbidities such as Acute Respiratory Infections (ARI) due to factors such as low family income, parents with low educational level, overcrowding and inadequate ventilation in the homes, lack of housing, and unsatisfied basic needs. Other factors identified in this situation are climate variability and environmental contamination, especially the impact on air quality related to particulate matter due to poor road conditions in the territory. On the other hand, factors such as overcrowding and housing conditions, where several household members must share the same room or there is a need to leave children in the care of other family members, may have an impact on the occurrence of sexual abuse and domestic violence.
It is also argued that in relation to the 60 year old adult, this focal group requires permanent help to carry out the activities of daily life; in addition, they are exposed to factors such as domestic violence, especially abandonment, as they do not have the basic needs of housing, employment, and public services covered, requiring them to go out to work despite their advanced age and depend on subsidies or contributions made by children, relatives, or, sometimes, neighbors or foundations. They are generally exposed to risk factors such as accidents, respiratory diseases, gastroenterogenic diseases, skin infections, mental illnesses, and psychoactive substance use. With regard to cardiovascular diseases, the community reported that high blood pressure is common in people over 60 years of age, either due to poor access to public services such as drinking water, poor nutrition, slum conditions of housing, and episodes of stress, anxiety, and neglect.
In addition, the inhabitants present adverse conditions of geographic accessibility and topographic characteristics that generate barriers to mobility, accidents, difficulty in accessing different health, supply, education, and public services. In correspondence with the episodes of accidents due to the high slopes of the territory, roads in poor condition, lack of sidewalks, housing design conditions related to spatial distribution and materials, and informal jobs that require physical effort, accidents such as traumas, burns, fractures, contusions, run overs, and sprains can occur. If the impacts related to informal work, structural vulnerability, slum housing, pedestrian and vehicular roads, and artisanal connections to basic services are improved, the probability of suffering from accidents would decrease in the territory.
Similarly, unemployment is high, which leads the population to engage in informal productive activities that are carried out in unsafe conditions and can lead to musculoskeletal accidents or direct exposure to hazardous chemicals, causing respiratory infections and poisoning. These negative effects on health due to physical and emotional alterations arise from being exposed to physical efforts, long working hours, and precarious environmental conditions, which can generate episodes of stress, accidents, and respiratory and gastroenterogenic diseases, affecting their wellbeing and quality of life.
Regarding the perception of public safety in the sector, the community feels partially safe, but this perception decreases when moving to other places necessary to meet the needs of infrastructure for public, commercial, and formal and informal work; so, if access to basic urban infrastructure in the sector is improved, the feeling of well-being of the inhabitants could increase from the perception of safety from theft, threats, extortion, homicides, and sexual abuse. On the other hand, the community stated that by improving housing conditions, domestic violence, personal injuries, and sexual abuse of children under 5 years of age, adolescents, and women would also decrease.
In addition, the inhabitants must travel long distances to work or to meet their basic infrastructure needs, exposing them to episodes of citizen insecurity such as sexual abuse, theft, personal injury, and homicides, which results in the inhabitants being exposed to constant episodes of stress and anxiety. In addition, the permanent lack of economic resources leads the inhabitants of the sector to face constant worries, and with it a high psychosocial burden with continuous states of hopelessness and stress, increasing the risk of suffering from mental illnesses, cardiovascular diseases, nervous system diseases, and consumption of psychoactive substances. In the territory, young people start the consumption of psychoactive substances from the age of 12 with cigarettes, followed by alcohol and marijuana.
Therefore, in the face of mental illnesses with episodes of depression, insecurity, stress, violence, alcoholism, and drug addiction in the community, it is necessary to improve the comfort and structural vulnerability in housing, citizen security in the territory, during the movements of the inhabitant, the abandonment and abuse of children under 5 years old and the elderly over 60 years old, and the degradation of the landscape, in addition to having safe spaces where physical and meeting activities can be carried out.
To reduce gastroenterogenic diseases reported by the population, such as gastrointestinal infections, food poisoning, and intestinal parasitosis, it is necessary to control and mitigate impacts such as the rental of sanitary facilities and water contamination by excreta due to the use of hoses in conduction and poor food handling. In addition to becoming aware of the constant risk to which they are exposed by these bad practices, it is also necessary to improve housing conditions and provision of formal public services.
Regarding the presence of slums, structural vulnerability, low security of tenure, and hygiene in housing, they increase the possibility of vector and pest diseases, respiratory and cardiovascular diseases, and gastroenterogenic diseases in the population due to constant overcrowding, lack of privacy, poor food handling, and consumption of contaminated water.
In order to reduce episodes related to respiratory diseases such as bronchitis, pneumonia, rhinitis, asthma, and COPD, it is necessary to mitigate the impacts on the territory related to the construction of slums; the degradation of the landscape due to contamination by excreta, sewage, and solid waste; improve the quality of roads in general; and improve comfort in housing. Likewise, with the implementation of sustainable systems such as green roofs, the thermo-acoustic conditions of the house can be improved, prior to a structural evaluation of the house.
Regarding hygiene, diseases caused by vectors and pests, such as rabies, schistosomiasis, and soil-transmitted helminthiasis, are present in the population of Santa Marta, which, by controlling the impacts on the territory of slum construction, contamination by excreta, pollution due to stagnant water, the presence of open conventional and hazardous solid waste, and wastewater discharges, would be considerably reduced in the sector since the population stated during the year that skin infections such as athlete’s foot, herpes, pediculosis, and insect bites were conditions that occurred endemically in the inhabitants. Therefore, if the impacts related to diseases were caused by vectors, consumption of contaminated water, poor food handling, and overcrowding in the home, these skin infections would decrease in terms of contagion and number of cases in the community.
Finally, the low quality of air inside homes and in urban areas, the poor disposal of solid waste, the structural and material conditions of the homes, the adverse geographical and topographic conditions, conflicts in land use [
63], the lack of infrastructure [
64], high migration, the expansion of the territory without planning, the lack of aqueduct and sewage services, and low economic income cause episodes of health disease in the inhabitants of the Santa Marta sector, which means that, if the indicators gradually improve, and the impacts are mitigated, the probability of presenting health-disease episodes in the population would circumstantially decrease.
5. Conclusions
The process of quantifying the indicators and evaluating their respective impacts on the territory to relate health-disease episodes in its inhabitants served to demonstrate the direct relationship that exists between neighborhood informality, poverty, and quality of life, as a person who suffers from physical and mental illness cannot be 100% productive and normalizes their habitability situation, unaware that it directly makes them sick, contradicting the collective thought that well-being, and quality of life is found in the city regardless of its location, level of formality, or consolidation of their territories.
Neighborhood informality, combined with the low economic income of families residing in the territory, implies not having the necessary means to meet basic needs in infrastructure, housing, education, and public services, which directly impacts the quality of life from the perspective of public health by constantly presenting episodes of morbidity and mortality in the inhabitants, which increases the perception of vulnerability in the person, normalizing unhealthy habits, unsafe working conditions, and environmental degradation in the territory in air, water, and the land due to its precarious and unsustainable habitability.
The strategy of relating the daily living conditions of the population with variables, indicators, impacts, morbidity, and mortality events helped the inhabitants of the Santa Marta sector to understand that the health-disease episodes they suffer are direct consequences of informality in the occupation of the territory, as the negative impacts identified are directly proportional to a high probability of physical and mental illnesses materializing in the population.
As for the groups of children under 5 years of age and adults over 60 years of age, within the framework of neighborhood informality in the territory, they increase their condition of vulnerability to being more exposed than other age groups to episodes of physical and mental illness given their circumstances. The settlement presents precarious conditions of habitability and sustainability at the urban level. The above, combined with the situation of displacement of the majority of family units, exacerbates the cases of respiratory, gastroenterogen, and mental diseases in the population.
Housing can be considered a determining factor in terms of how the inhabitant relates to their territory in the Santa Marta sector, as, from its illegality, location, construction, and design, bad practices begin that give way to present the identified impacts. With this, the report of the health-disease episodes in the population manifested. It is important that projects framed in the principle of healthy housing in the territory are designed and executed as a strategy to improve the physical and mental health of the inhabitant.


 ,
, 


