Article

Mapping Green View Index for Urban Parks with Varied Landscape Metrics and Distances toward the Chinese Eastern Railway Network

1
Postgraduate College, Foshan University, Foshan 528225, China
2
College of Art and Design, Jilin Jianzhu University, Changchun 130118, China
3
School of Architecture and Urban Planning, Jilin Jianzhu University, Changchun 130118, China
*
Author to whom correspondence should be addressed.
Sustainability 2024, 16(5), 1977; https://doi.org/10.3390/su16051977
Submission received: 27 December 2023 / Revised: 30 January 2024 / Accepted: 12 February 2024 / Published: 28 February 2024

Abstract

:
The Chinese Eastern Railway (CER) has been identified as a heritage site that has witnessed industrial and social developments and changes over the past 100 years. Many old infrastructures have transitioned from civil use to historical conservation, but the spatial distributions and driving forces of ecosystem service functions provided by local ecological infrastructures are still unclear. The green view index (GVI) is a flexible parameter that measures the ratio of pixels accounted for by greeneries to those in an intact street view image; hence, it is widely recognized as a reliable variable for assessing the magnitude of ecosystem services provided by ecological infrastructures at a regional scale. In this study, a total of 42 urban parks were selected from regions covered by CER routes and adjacent cities without its involvement. No difference in GVI was found among cities regardless of distance from CER routes, and the distance of a park to the nearest CER line was found to have only indirect and negative effects on GVI. Correlation analysis indicated that the logarithms of both green and blue space areas had positive relationships with GVI. Regression analysis indicated that the logarithm of the blue space area, together with elevation and longitude, had positive effects on GVI, while latitude resulted in a negative effect. Overall, low GVI values (~6.0%) in the parks of Tsitsihar resulted from the effect of high closeness with the CER route, and high GVI values (over ~40%) in the parks of Changchun were indicated by the joint characteristics of local landscape metrics.

1. Introduction

Railway heritage serves as a witness not only to historical progression and regression in social development but also to routes across architectures with varied functions. The Chinese Eastern Railway (CER) was established on 31 May 1924, along with the Sino-Soviet “Agreement on General Principles for the Settlement of the Questions Between the Republic of China and the Union of Soviet Socialist Republics” [1]. The CER network starts from the western station of Manchuria, Inner Mongolia province, and extends up to the eastern end at Suifenhe, Heilongjiang Province [2]. The middle section is interrupted by the station of Harbin, Heilongjiang Province, and extends southward through Changchun and Shenyang until it reaches the terminal at Dalian, Liaoning Province [3]. The use of the CER has led to social development through alternative old and new industrial stages [2]. It also has value in the cultural service of architectural conservation of Chinese Eastern Railway Historic Culture [4]. Currently, the CER functions as a type of urban infrastructure that connects built-up regions among small towns [3,4]. It is reasonable to conserve the landscape across the CER, which is determined by the sustainable use of urban infrastructures in cities located in the areas covered by the CER.
The conservation of railway heritage is challenged by abandonment and urbanization [5]. It is contradictory that relic infrastructures may have lost their functions in previous eras; yet, they cannot be directly rebuilt because many of them are regarded as architectural masterpieces [6]. Initial land uses along CER routes were planned with ecological and urban infrastructures constructed to provide social services in previous years. Changes in the functions of these infrastructures along CER routes stimulate the shift in public attitudes toward these infrastructures from the lens of urban planning to one of heritagization [7]. Therefore, people must discern the connection between material ontology and its meaning for infrastructures [8]. According to Li et al. (2023), the CER can be characterized as architectural heritage, encompassing 92 stations covering five levels of regions across the whole area [3]. Recently, people have begun characterizing architectural heritage by recognizing building facades and mapping their distributions [3,5]. Relatively few studies have documented the landscape characteristics of ecological infrastructures along CER routes. It is, thus, valuable to determine the spatial relationship between these landscape characteristics and CER locations.
Urban parks are a major type of ecological infrastructure distributed in cities along CER routes [2]. The value of park services to the public accounts for an important proportion of the value of a heritage site [9]. Many urban parks have been constructed in cities distributed along CER routes since the early years. It was confirmed that the environmental features of an urban park near an industrial heritage site determined the satisfaction levels of its users [10,11]. Vegetation and greeneries established in these parks were designed to attract users. In cities distributed along CER routes, heavy industries mainly depend on natural resource utilization [12]; hence, local parks function not only to provide places for recreation and leisure but also as holders of environmental capacity [13,14]. A heavily polluted environment is often associated with sad emotions [13,14]; hence, it is necessary to design urban parks that increase environmental capacity and alleviate the trade-off with low attractiveness. Research has identified that interacting with nature in forested parks can serve as a driving force in promoting health and wellbeing [15,16]. Knowledge about this ecosystem service is important for increasing the heritage values of ecological infrastructures in cities distributed along CER routes. The importance of monitoring natural resources to evaluate their relationships with anthropogenic activities in historical [17], cultural [18], and industrial [19] heritage sites has been highlighted. To our knowledge, little is known about the typical characteristics of green spaces in parks located near CER routes.
In cities built with stations along CER routes, potential visitors include populations of both local residents and tourists. The level of exposure to nature that a local resident can experience in a neighboring urban park is correlated with the efficacy of achieving mental wellbeing [20]. The distance from a host city to the nearest CER route is considered a factor that characterizes industrial affordability through railway transport [21]. Railways placed in routes through or between cities can increase the transport connectivity of regional urban spaces but may fragment other types of land uses [22]. For tourists, the distance to railway stations is important for their accessibility and interest in visiting [23]. Therefore, a clear inventory of distances between cities and CER routes is necessary for decision makers and urban planners to determine strategies for the spatial placement of urban park uses aimed at protecting the industrial heritage of the CER. A flexible parameter should be established as a dependent variable for assessing the level of exposure to nature in urban parks and should be easily used for mapping spatial distributions with varied distances from CER routes.
The green view index (GVI) is calculated as the ratio of visible greenery to intact sight at places within or around green space [24]. Data on the GVI are usually extracted from street view images downloaded from online maps or social media platforms [25,26]. Deep learning is a practical approach for rating the GVI and extracting data from street view images [26,27]. It has been identified that the GVI can efficiently predict self-reported health and wellbeing, suggesting that this parameter is indicative of the level of exposure required to experience nature [28,29]. The GVI is a flexible variable that changes in response to the variation in greeneries that can be seen along a street. Therefore, the spatial distribution of the GVI among streets can be referred to when mapping geographic patterns of the chance to experience nature [30,31]. However, the GVI has been employed in most of the current studies to assess a single city [32,33], and less is known about the GVI with regard to regional areas of special interest. Areas covered by the CER network have been mapped to analyze the spatial distributions of different types of urban infrastructures [3,5]. This supports the idea that regional distributions of landscape surface functions can be characterized by patterns framed with distances to railway lines and landscape metrics. These factors together govern the distributions of infrastructures and their functions. However, the ecosystem services of green spaces assessed via the GVI have not yet been investigated from this perspective. Consequently, the specific landscape metrics that can impact GVI distribution are still unclear.
In this study, we conducted a regional investigation in an area covered by CER routes. The GVI values of urban parks were considered objective parameters; these were detected in cities both along CER lines and those located far away. Our objectives were to (i) detect the spatial distribution of GVI in parks of cities located at different distances from CER routes and (ii) predict a map of GVI values across the whole area according to the geometrics of parks and their distances from the CER. Our results are highly valuable for predicting the level of exposure to nature that visitors can experience in parks, with regard to their geometrics and distances from the CER.

2. Materials and Methods

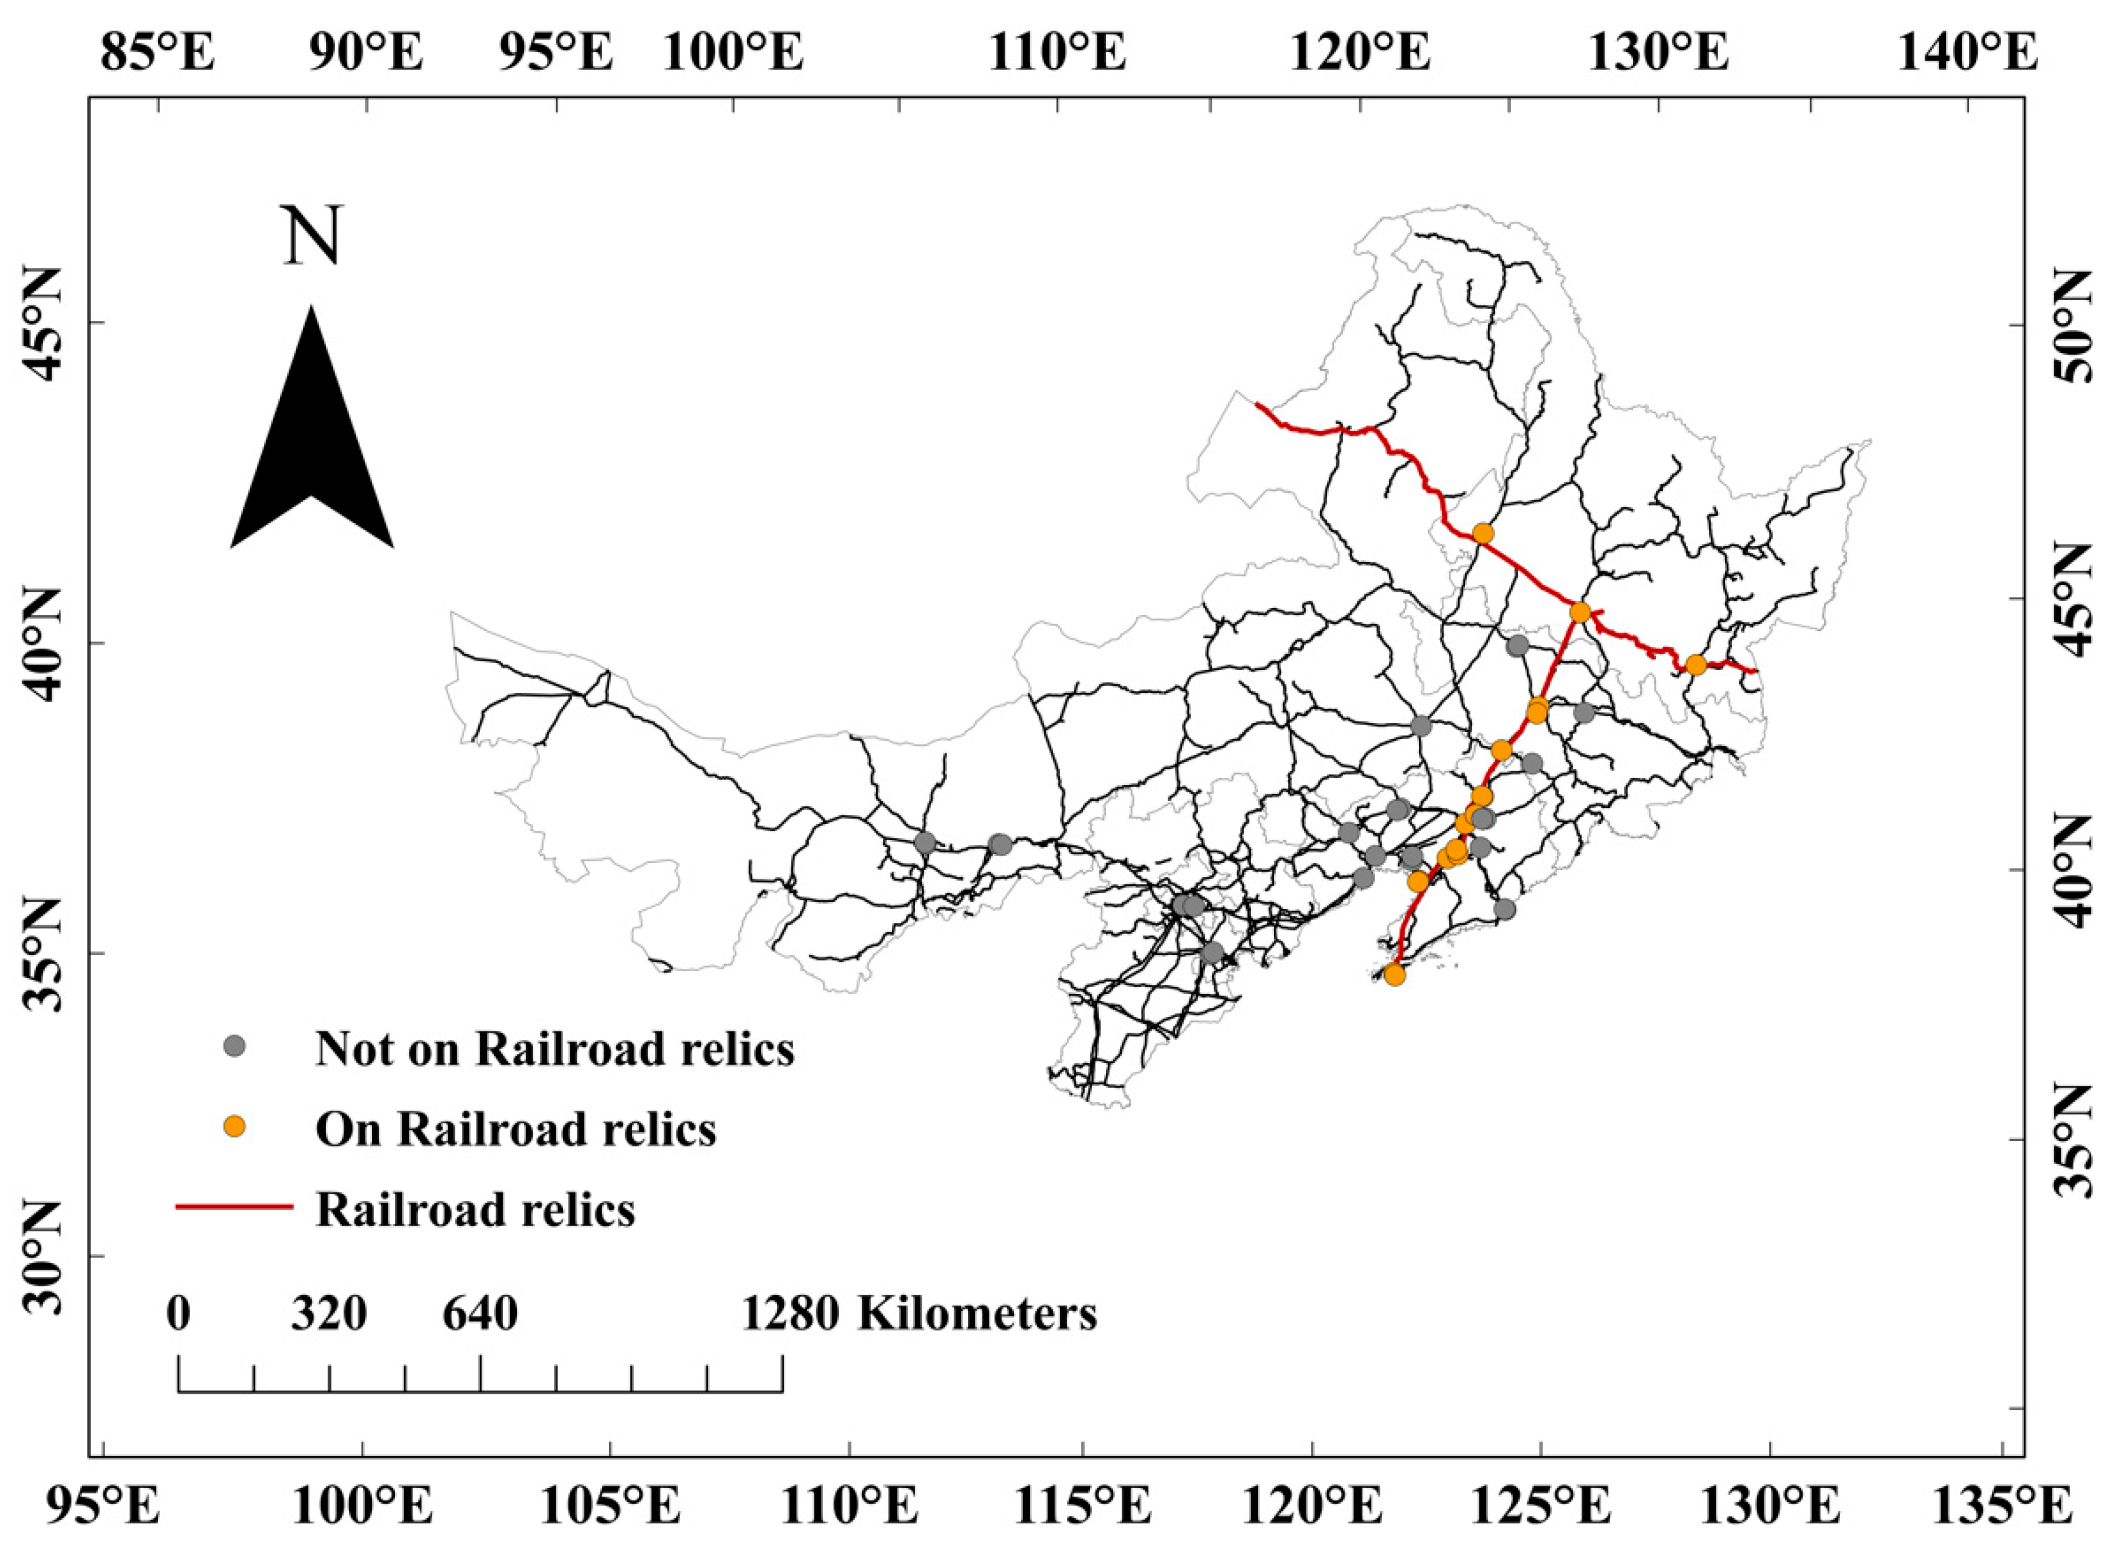
2.1. Study Area and Plots

Northeast provinces (Heilongjiang, Jilin, and Liaoning) with cities covered by CER routes were chosen as the study area, as well as regions within Inner Mongolia (Figure 1). The municipalities of Beijing and Tianjin were also considered as study areas because they are unaffected by CER lines. Therefore, cities therein can be used as references with long distances to increase spatial variation. A total of 42 urban parks were selected as objective regions because each of them can enable the collection of at least 100 street view images obtained from the application programming interface (API) of the Baidu map. Images were crawled from streets within or nearest to the selected parks. Parks that did not yield 100 street images during the crawling process were excluded from this study. Specific details about selected parks and their host cities are listed in Table 1.

2.2. Data Collection

All cities presented in Table 1 were outlined by their municipal boundaries, which were overlapped by layers of urban road networks across four levels [34]. Thereafter, the boundaries of the parks were further outlined via a human–computer interactive approach [35], and their areas were enlarged to include ranges of nearest roads. The area surrounding a park was separated into 2 m × 2 m grids. Python ver. 3.6 (Python Software Foundation, Python, Beaverton, ON, USA) was used to connect with the API of Baidu Map and download street view images from the coordinates of grids in the outlined ranges. At least 100 images were obtained, but only the first 100 were reserved, to keep a uniform number of images per park. The DeepLabV3+ model was employed for extracting pixels of vegetation from images. The GVI was estimated by the ratio of vegetation pixels to pixels across an intact image. Typical GVI recognitions across different ratios of an image are shown in Figure 2.
Landscape metrics included the total area of a park, green space area, blue space area, elevation, and vegetation height. Green space area was calculated using the normalized difference vegetation index (NDVI):
N D V I = B a n d n i B a n d r e d B a n d n i + B a n d r e d
where Bandni is the surface reflection at the near-infrared band, and Bandred is the surface reflection at the red-light band. Blue space area was calculated using the normalized difference water index (NDWI):
N D W I = B a n d g r e e n B a n d n i B a n d g r e e n + B a n d n i
where Bandgreen is the surface reflection at the green light band. Elevation was estimated using the digital elevation model (DEM) [36], and vegetation height was estimated using the difference between a digital surface model (DSM) and DEM. ArcGIS 10.2 (Eris, Shanghai-Branch, China) was used to measure air-line distance between a park and the nearest CER route.

2.3. Statistical Analysis

Statistical analysis was conducted using SPSS software ver. 21.0 (SPSS Statistics, IBM, Watson, GA, USA). All landscape metrics were transformed to logarithms to ensure that their distribution was acceptable for analyses using general linear models. Parks were divided into two types, namely, “close” and “far”. Close-type parks were located in cities where CER lines passed through, and far-type parks were located in cities where no CER lines passed. Analysis of variance (ANOVA) was used to detect the combined effects of park location and host provinces or municipalities on GVI. Maximum likelihood analysis (MLA) was used to detect the combined effects of landscape metrics plus distance from the CER on the GVI using a model that matched the rule of data distribution. When a series of estimates were indicated for independent parameters, their relationship was fitted via linear correlation with 95% confidence, and the predicted range was detected [37]. The values of GVI- and MLA-estimated effects were mapped in the study area to ensure that their distributions were visible. Furthermore, MLA effects were interpolated across the whole study area to map distance-related effects on the GVI. Finally, multivariate linear regression (MLR) was used to detect the combined effects of geographical information, landscape metrics, and distance on GVI, and all significant parameter effects were mapped to layers, which were further fused with estimated parameters as coefficients to interpolate the regional distribution of GVI across the whole area with CER placement [38,39].

3. Results

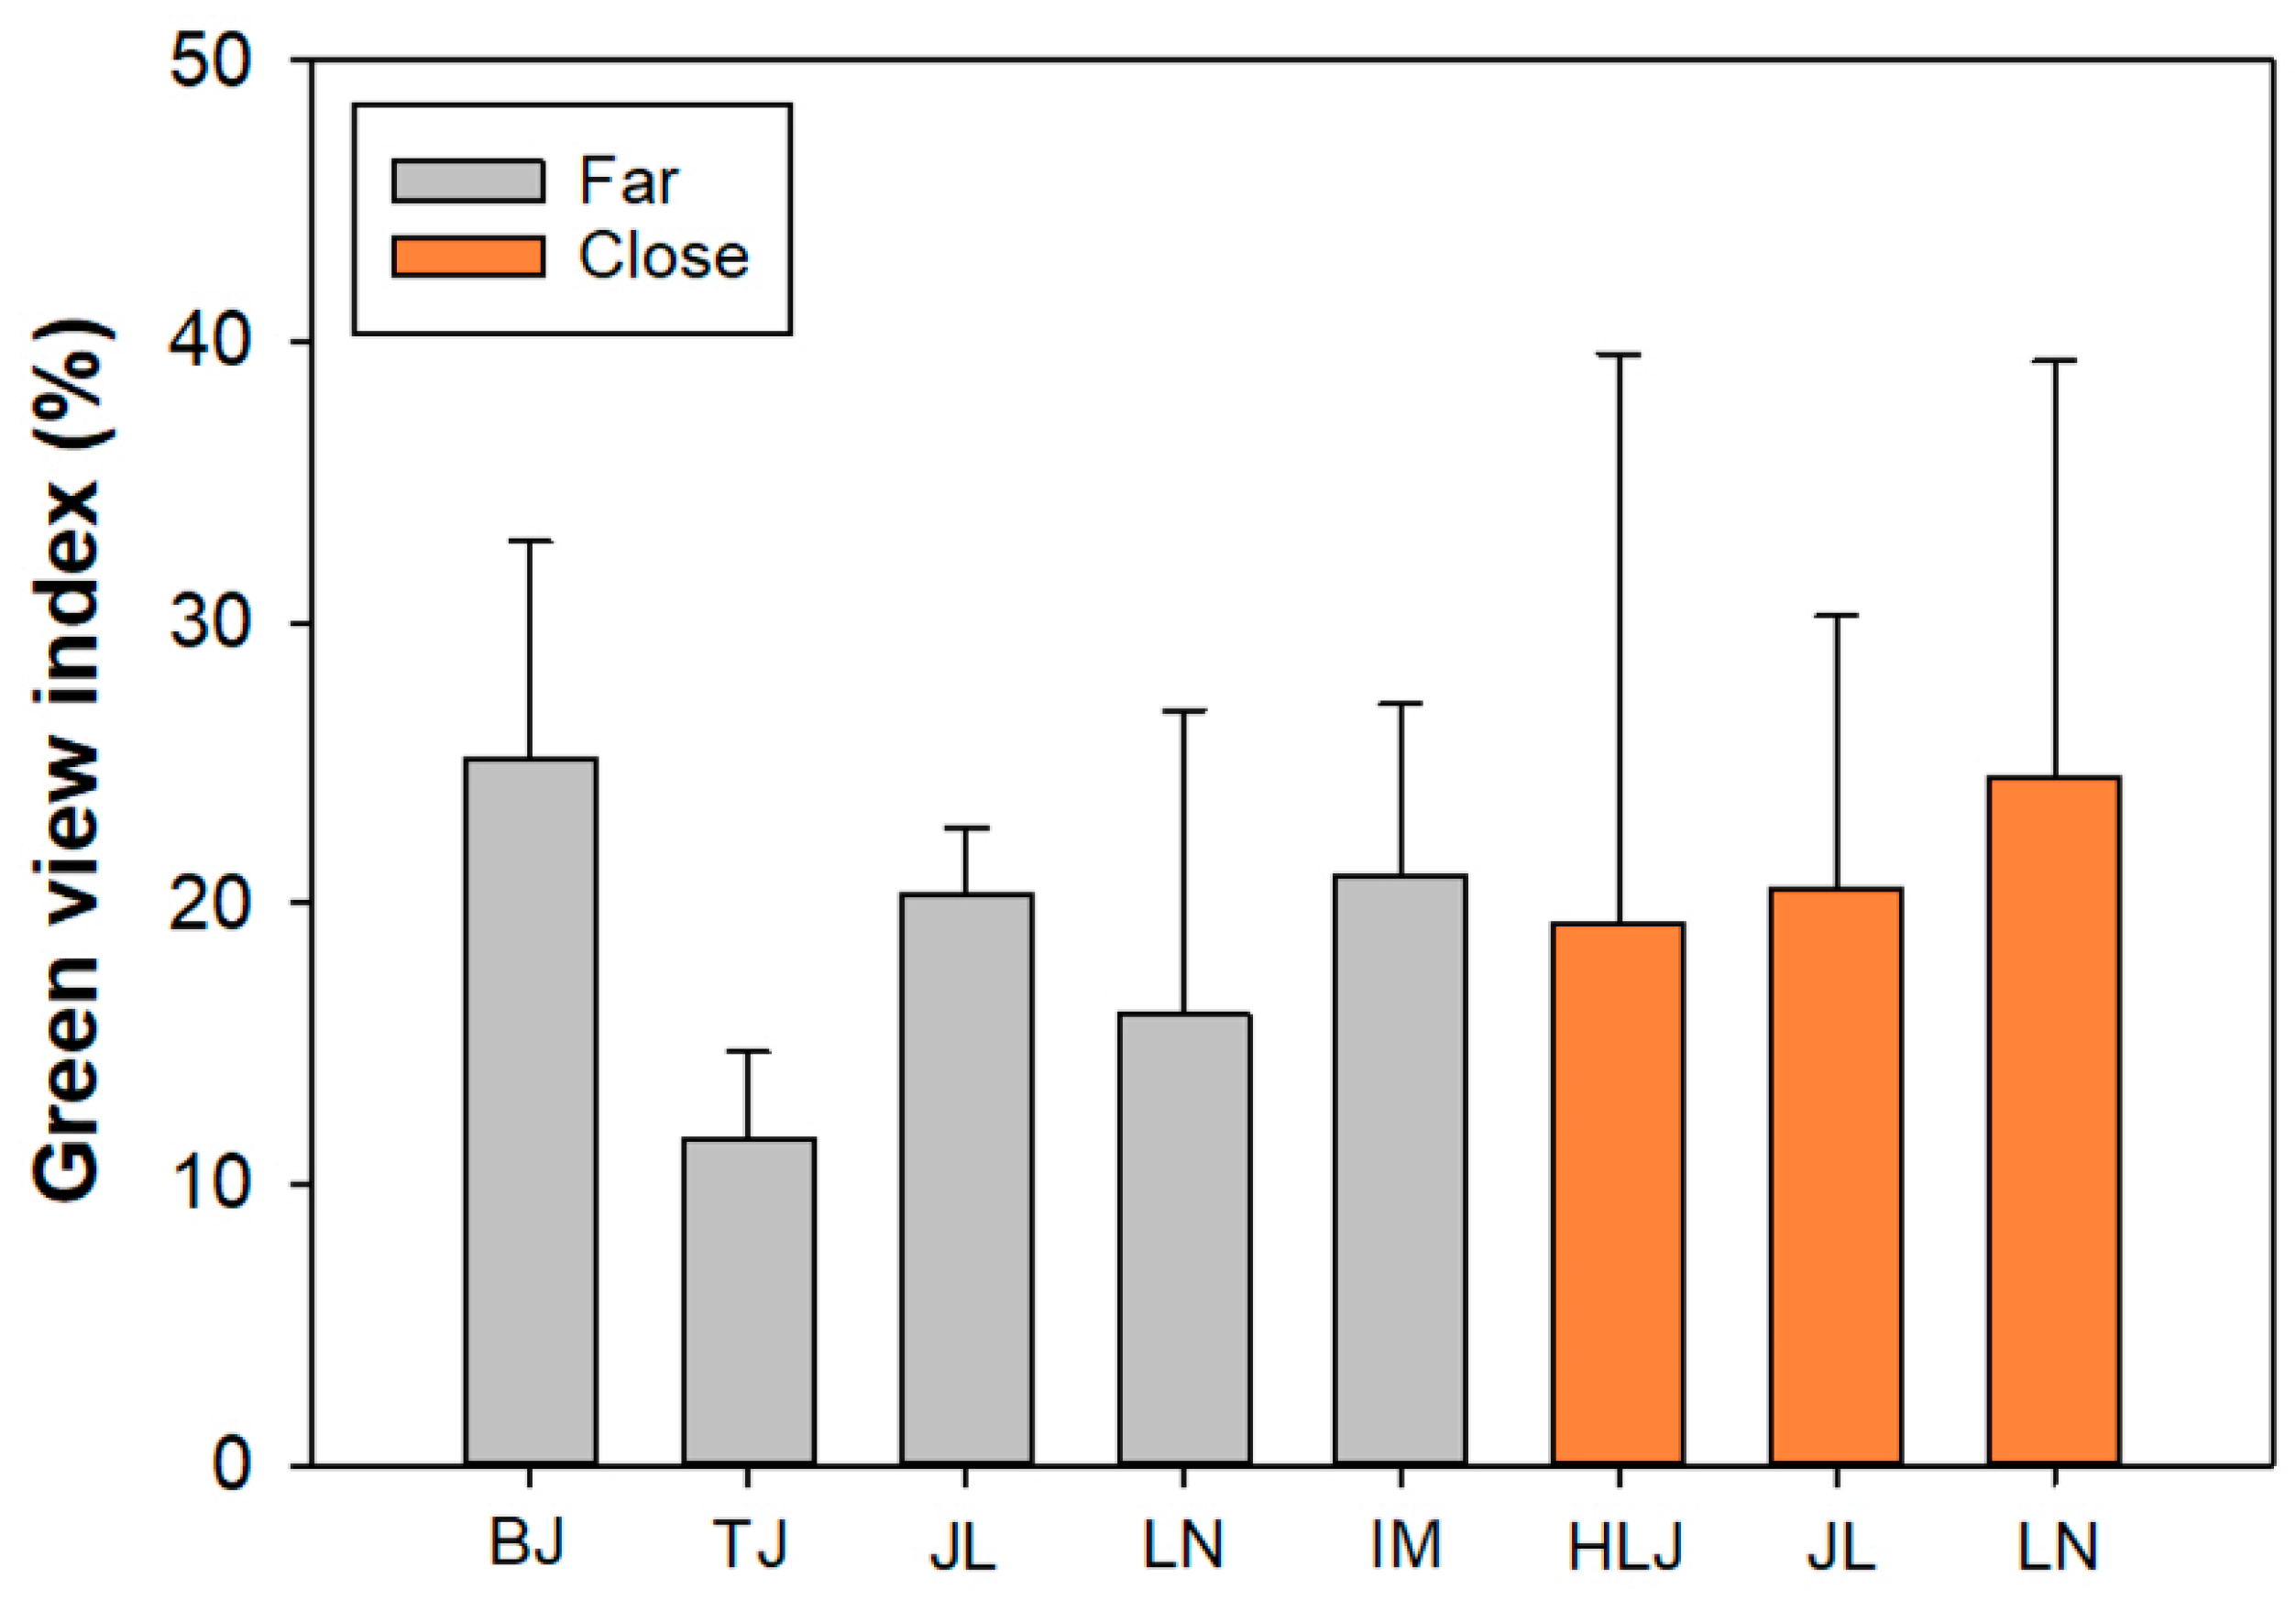
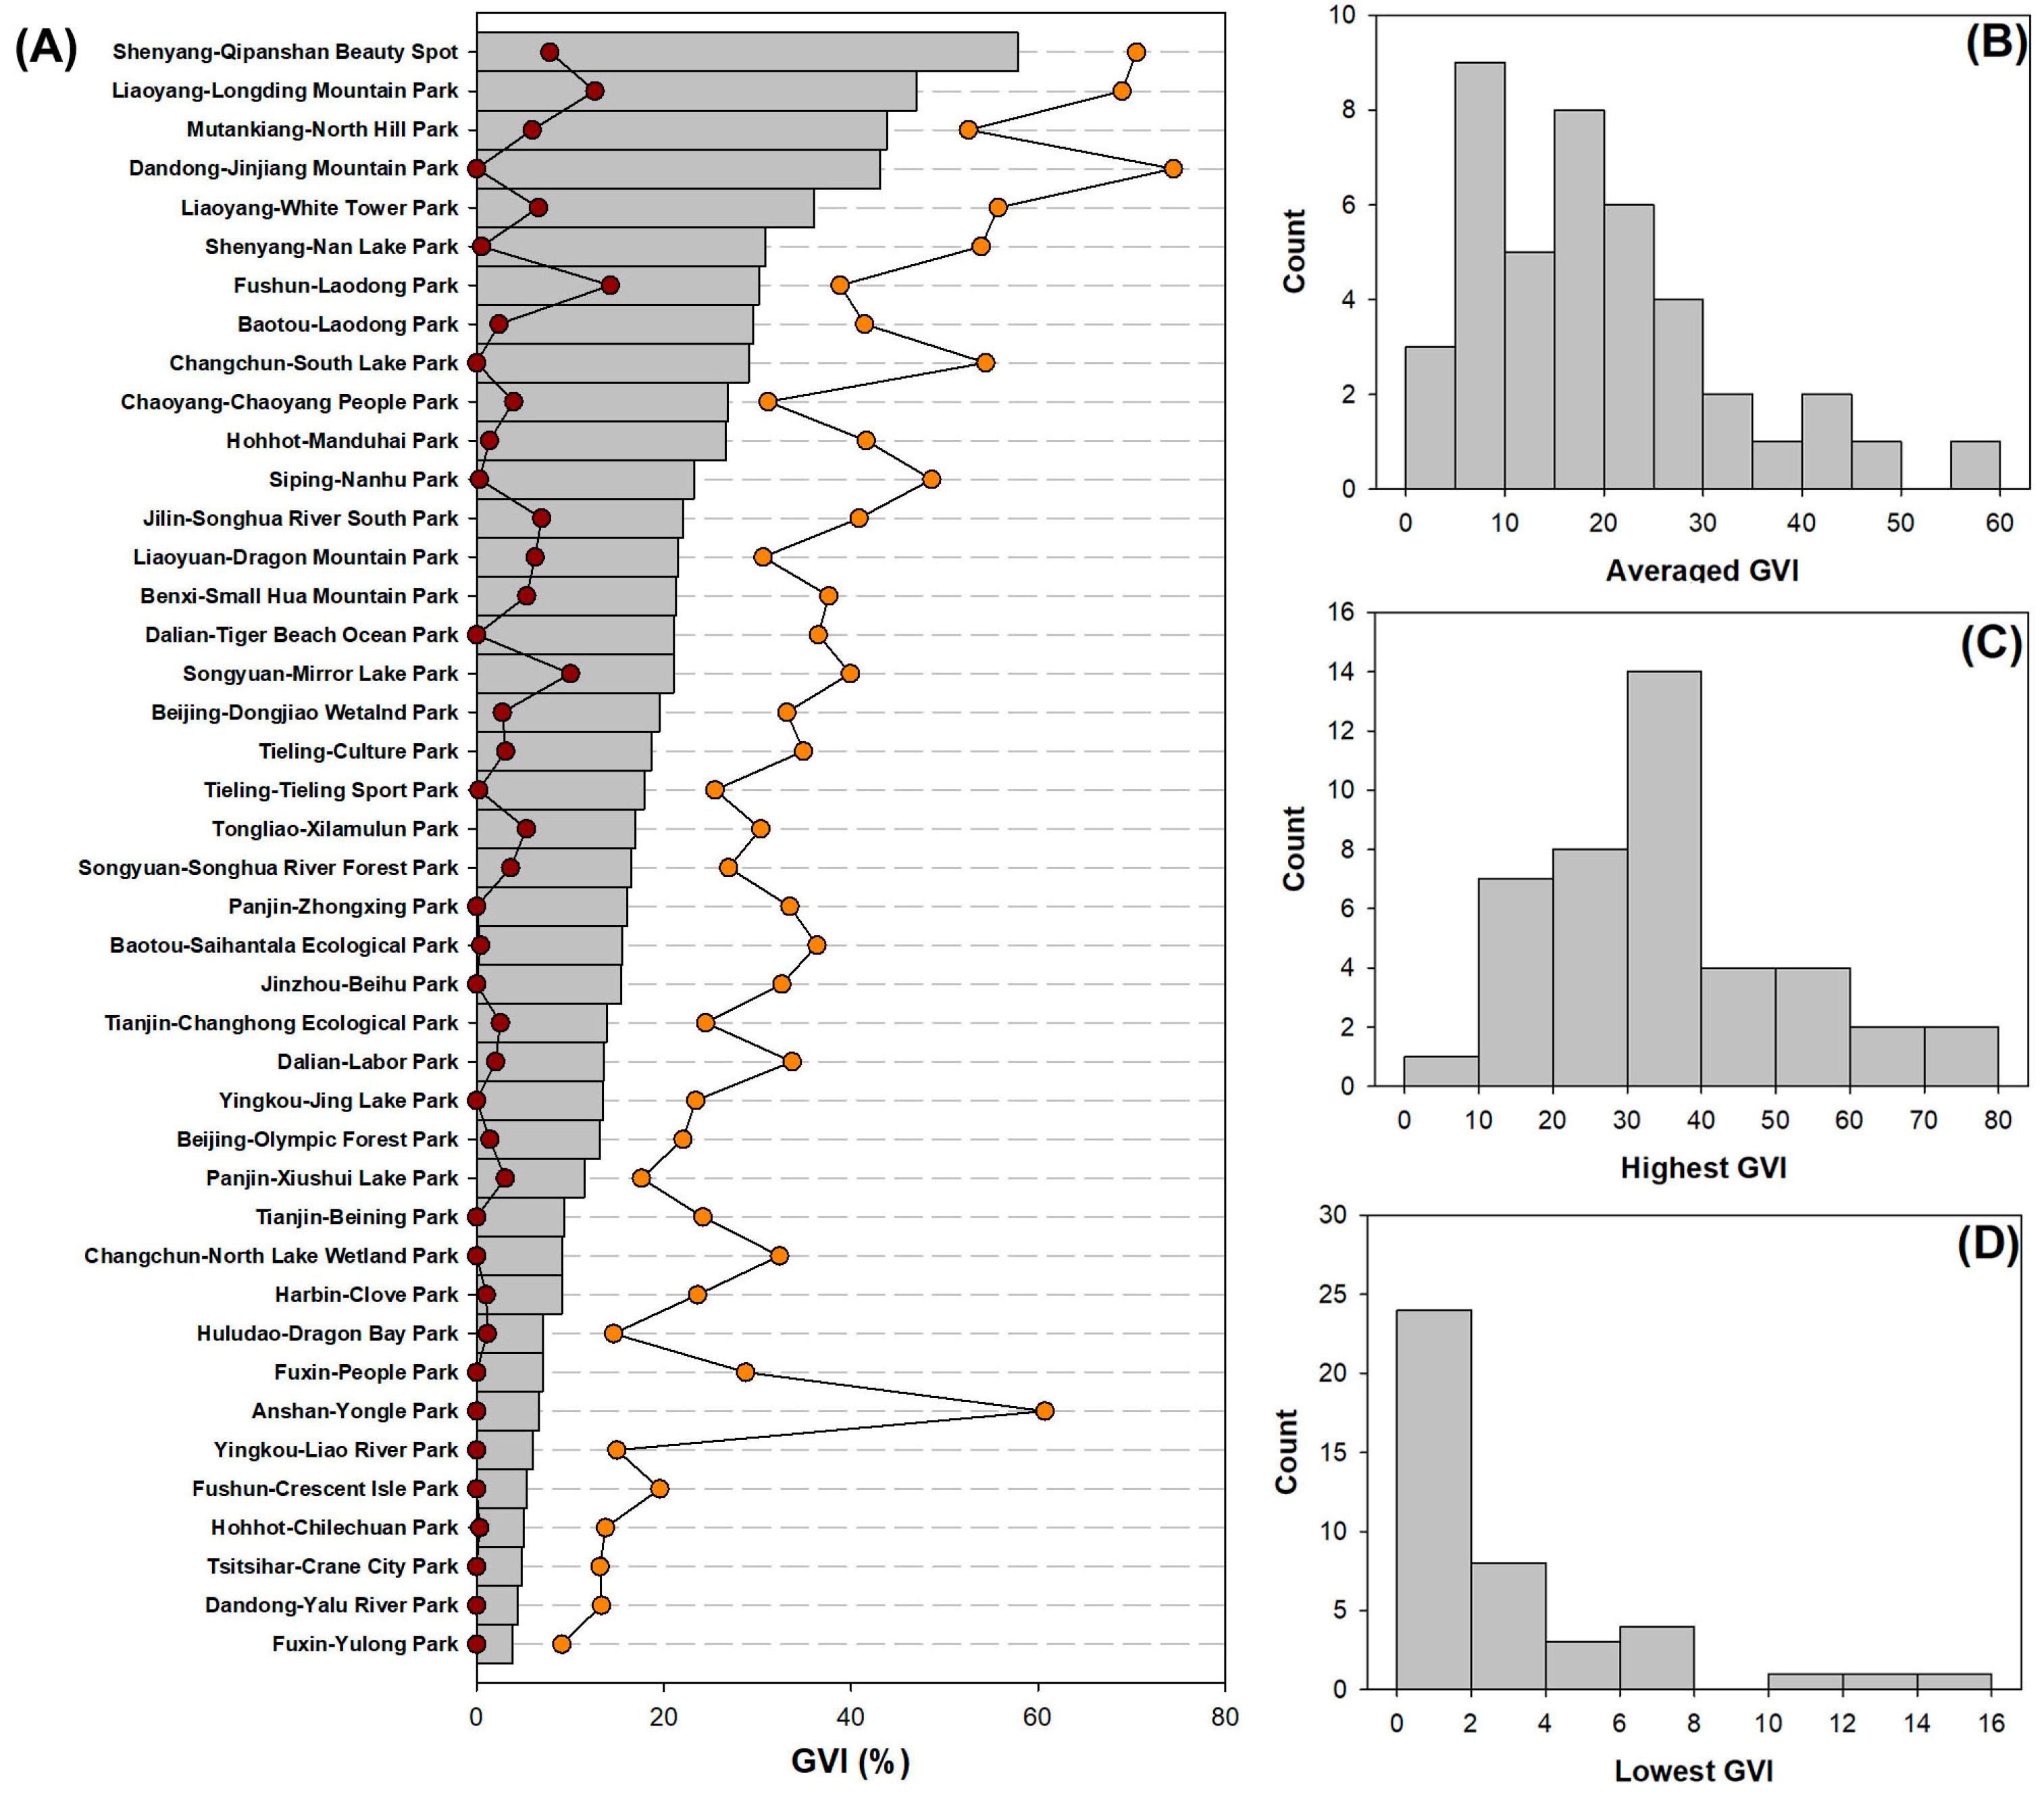
3.1. Spatial Distribution of GVI

ANOVA did not indicate any significant effects between province or municipality and park type on the GVI (Figure 3). Provincial variation resulted in an F-value of 0.53 and a p-value of 0.4724. Parks in cities far away from the CER had GVI values ranging between 11.63 ± 3.06% (Tianjin) and 25.18 ± 7.68% (Beijing). Parks located near the CER had GVI values of 24.48 ± 14.80% (Liaoning) and 19.25 ± 20.28% (Heilongjiang).
According to Figure 4, the lowest GVI values mainly resulted from the recognition of greeneries as bushes and dwarf tree canopies, and the highest GVI value was mainly obtained by extracting data from the canopies of tree lines. Most of the GVI values were obtained from street images in roads and streets immediately adjacent to the studied parks instead of those placed inside them.
According to Figure 5A, with the decline in averaged GVI values, both the highest and lowest values generally showed decreasing trends with occasionally abnormal values. The highest GVI value, for example, in the image of the street surrounding Yongle Park at Anshan, was higher than those in most other parks, reaching upward until that in Jinjiang Mountain Park at Dandong. The lowest GVI value, however, was higher in Mirror Lake Park at Songyuan than those in parks ranked with lower GVI averages.
Histogram analysis indicates that averaged values of the GVI showed an approximately normal distribution pattern (Figure 5B). Although the highest GVI values showed a normal distribution pattern (Figure 5C), the lowest GVI values showed a zero-inflation negative binomial distribution pattern (Figure 5D). These results together affected the distribution of averaged GVI values, resulting in asymmetry, which can be described using the Poisson distribution pattern.

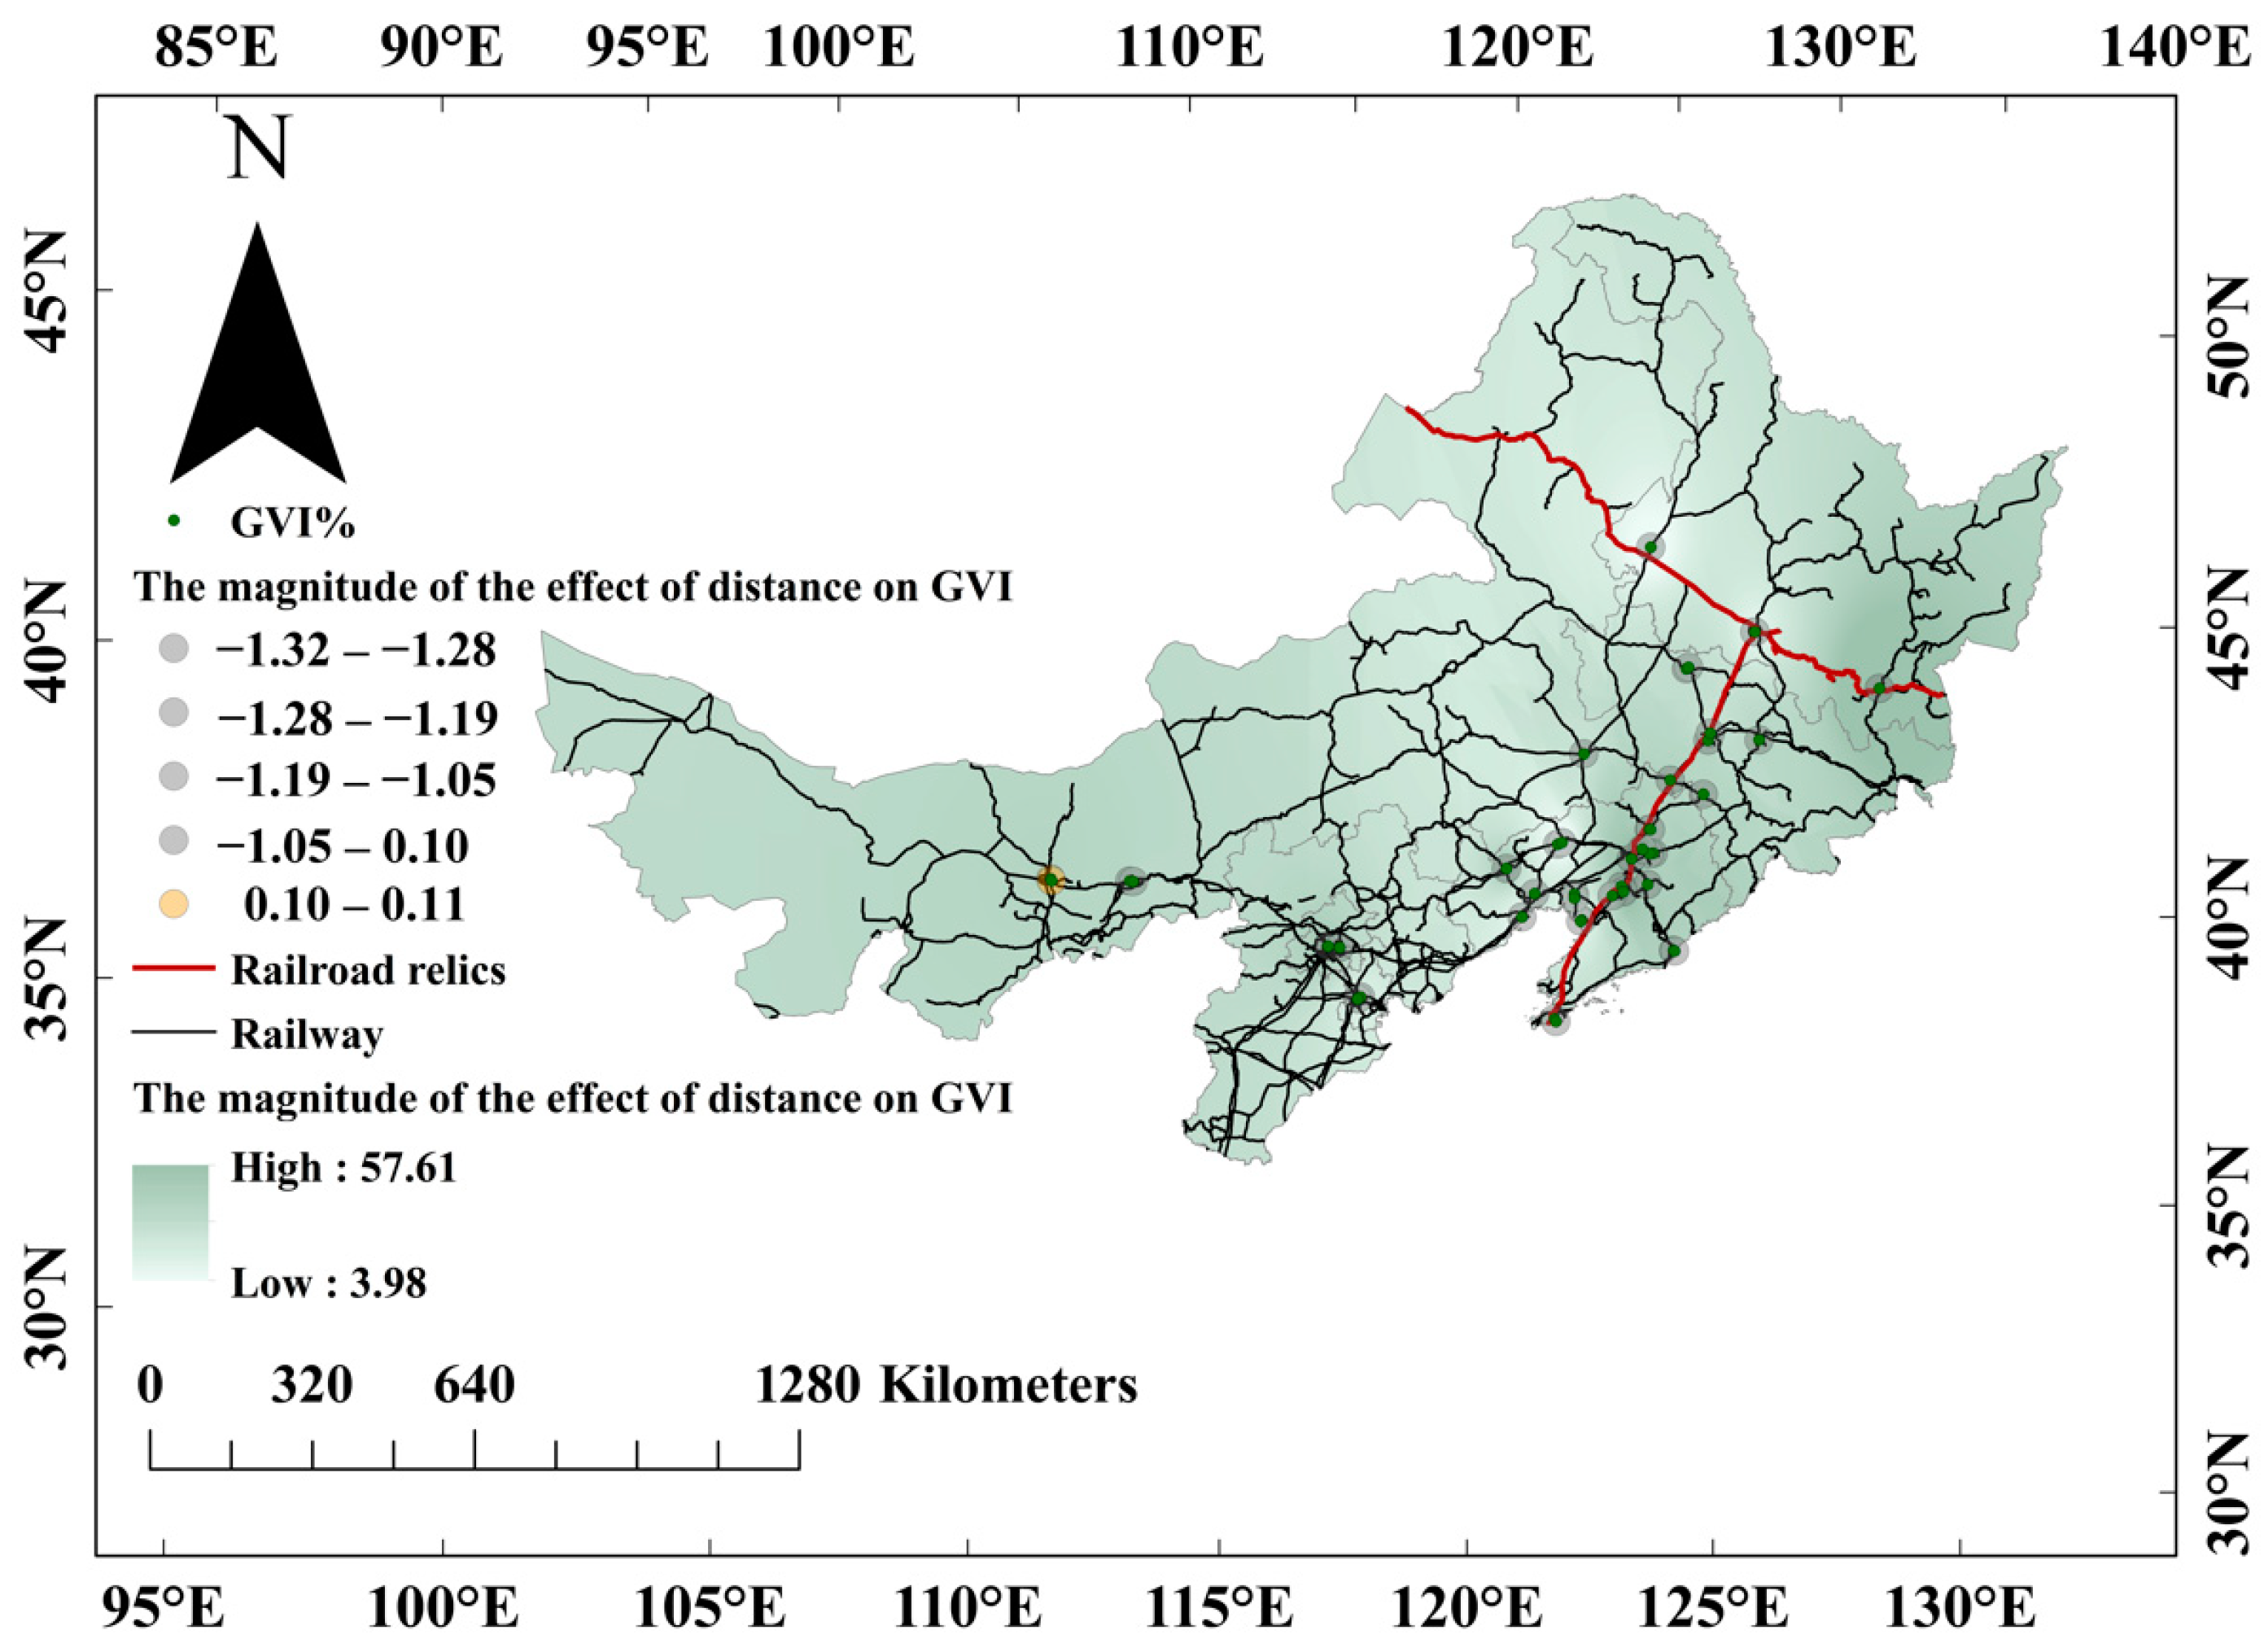
3.2. Maximum Likelihood Analysis of Landscape and Distance Effects on GVI

Based on the previous analyses, the Poisson regression model was selected for MLA. The results indicated that only the distance from the park to the nearest CER line showed significant parameter effects on the GVI, while neither of the logarithms of landscape metrics were estimated to have significant effects. Therefore, the relationship between the distance to the CER (Di) and its effect on GVI (Ef) was fitted as a linear curve (Figure 6). This relationship can be further modeled as follows:
E f = 0.0014 × D i 1.3204
where R2 is calculated to be 40.46%, and the p-value is estimated to be <0.0001. Most of the estimated effects on GVI were negative, although these increased with the increase in the distance from the CER. Approximately ~80% of scattered dots were distributed outside the 95% confidence band range, and those distributed within the band showed negative effects quantified in a range between −1 and −2.
Overall, the MLA of the effects of distance to the CER on the GVI can be mapped for the study area (Figure 7). Most parks showed negative distance effects on GVI except for the two in Hohhot, which were distributed in regions further away from CER routes than most other parks. Distance effects on GVI were interpolated across the whole area, which shows that low values mainly occurred in three regions. One was predicted in Tsitsihar of Heilongjiang, the other was in Panjin of Liaoning, and the third was in Harbin of Heilongjiang

3.3. Multivariate Linear Regression of GVI against Landscape Metrics

Pearson correlation indicated positive relationships between the GVI and green space area (R2 = 0.3450; p = 0.0252) and blue space area (R2 = 0.3737; p = 0.0148) across all parks (n = 42). MLR was used to detect the effects of multiple factors of landscape metrics on the GVI (Table 2). Most screened parameters showed positive effects except for latitude. These four parameters were mapped to generate four layers, which were fused with parameter estimates as coefficients. As shown in Figure 8, the northern part of the CER routes was indicated to be accompanied by parks with low GVI values (<10%), such as those in Tsitsihar in western Heilongjiang Province. In the southern part, parks in Yingkou were indicated to have low GVI values. In contrast, parks in Changchun around CER routes were indicated to have high GVI values.

4. Discussion

4.1. Attributes of GVI in Urban Parks Distributed along CER Routes

Our averaged GVI values showed a nonsymmetrical distribution, with a positive skewness observed from streets near parks distributed in cities around CER routes. This distribution pattern was generated by an approximately normal distribution of the highest values together with a highly positive skewness in the distribution of the lowest values. The distribution of our GVI averages aligns with the distribution of values collected from streets in Hartford, CT, USA [40], and in two wards of Yokohama city, Japan [41]. These results together suggest that the GVI is a parameter that is more likely to indicate lower levels of data in a pool, which does not follow normal distribution patterns. Similarly, the frequencies of extremely emotional expressions among urban park visitors also showed nonsymmetrical distribution patterns with positive skewness [42]. The descending order of GVI averages was not fully matched by the order of the highest values, but could be better fitted by that of the lowest values. These findings suggest that the variation in data in terms of GVI averages is mainly governed by that of the lowest values, which were mostly lower than 10%. A recent study revealed that industrial parks are a type of urban infrastructure that attracts urban planning with vegetation, maintaining a GVI of over 20%. The functions of old infrastructure in cities near CER lines were mainly intended for civil uses, such as business, medicine, education, and religion, among others [5]. There has been little evidence demonstrating the establishment of industrial parks in regions near CER routes. Moreover, several cities in this area are dependent on natural resources [43]. As such, a large number of heavy industrial factories could be found around 40 years ago [3,6]. However, the visible canopies in the urban landscape surrounding these factories are not comparable to those in industrial parks. Most industrial parks are clusters of businesses in the knowledge-based services and intelligent manufacturing sectors that are highly dependent on the efficiencies of knowledge-based labor forces. Factories, however, are more reliant on machine manufacturing, which does not necessitate being surrounded by trees. When the CER was frequently used, human development had not reached a level that required information technologies similar to that in the current era [1].

4.2. Distance from CER Route Affects GVI in Nearby Parks

Urban parks in cities distributed along CER routes were expanded to increase connectivity among their green spaces, as observed in another case study in Zhengzhou, Central China [22]. For tourists from cities further away from CER routes, their desire to visit local urban parks may be reduced due to low accessibility [23]. These results together suggest a trend that GVIs in cities that are closer to CER routes are likely higher compared to cities that are farther away. In our study, however, neither correlation nor MLR indicated any significant relationships between distance and GVI. Instead, distance was estimated to have potential effects on the GVI, as indicated via MLA. This indicates that distance can only generate indirect effects on the GVI without any possibility of generating direct contributions. There were no differences between the locations of parks in cities located on CER routes and those farther away from them. Therefore, urban planners may not consider the frequency of visitors seeing greenery on streets around urban parks in cities, regardless of how far they are from the nearest CER routes. Theories on the positive effects of exposure to nature on health and wellbeing have only been proposed and popularized in recent decades [44,45]. The importance of increasing the frequency of exposure to green spaces has only been highlighted in cities close to CER routes in the past five years [46,47]. Hence, the designers of the CER in the 1920s may not have been equipped with the relevant awareness and knowledge to promote urban greening in cities near the CER.
We confirmed the assumption that the effect of distance to the CER line was indirect, exhibiting a potential impact that was negative. This may explain why parks in the distant city of Baotou showed the highest effect of distance, but parks in Tsitsihar, Harbin, and Panjin—cities near CER routes—exhibited lower effects of distance. Although we cannot provide any relevant evidence that directly illustrates these results, we can explain this using the previous findings that the CER routes were likely established in cities with the primary aim of utilizing local resources instead of promoting greening. Distant cities, such as Baotou, may not have been planned to facilitate local manufacturing, but urban greening could have been planned in historical municipal budgets. According to spatial interpolation using multiple data fusion, the negative effect of distance was verified with low GVI values in the parks of Tsitsihar, which serves as an important transportation hub between Inner Mongolia and Heilongjiang Provinces. The section of the CER in Tsitsihar was constructed with the expectation of activating trade and commerce between South Manchurian and China through Tsitsihar [48,49]. This municipal function is unlikely to have encouraged any policies to allocate domestic budgets for urban greening. The other region that verifies our findings was the low GVI values in the parks of Yingkou–Panjin urban–rural agglomerations. We surmise that this region was linked via the CER route to promote ocean transportation, and, once again, greenery should not be considered to share urban spaces.

4.3. Landscape Metrics and GVI in Cities along CER Routes

Green space areas in parks were evaluated via remote analyses on satellite imageries, and they were found to make a positive contribution to the increase in the local GVI. For districts of a city, historical roads or streets that tend to collect large areas of green space, as well as high GVI values, have positive relationships with each other [26,50]. This is because a large area of greenery can support large canopies, which are more frequently seen by visitors. Our results also indicated a positive relationship between blue space areas and the GVI; however, scarce evidence can be referred to. We have three possible explanations for this. Firstly, local blue spaces were mainly constructed in wetlands, where aquatic habitat plants account for the majority of the GVI [51]. Secondly, local waterbodies were segmented into small patches in the urban landscape, mostly adjacent to greenery along streets [16]. Thirdly, cities were constructed along large watersheds, where large areas of tree lines were built that increased the GVI.
MLR indicated a group of significant parameters of landscape metrics that together contributed to the increase in GVI. The positive effects of longitude along with the negative effects of latitude together suggest a trend of a higher GVI occurring in southeastern cities and a lower GVI occurring in northwestern cities. Blue space areas and park elevation also made positive contributions to the GVI in parks. Taken together, one can propose that a high GVI tends to be found in the southeastern cities, where local parks have large areas of waterbodies and high elevations. In contrast, parks in northwestern cities tend to show lower GVIs due to the small areas and low elevations of local parks. These findings suggest that parks with high GVI values were concentrated in Changchun, a city with a history of strengthening urban greening [46,47,52,53]. In light of this, the CER still played a role in this promotion because it increased accessibility among countries in East Asia.

5. Conclusions

Cities distributed in regions covered by CER routes did not show any difference in GVI values from those in distant regions. The park GVI values ranged between 10% and 25% in cities across a vast range, including the distant cities of Beijing and Tianjin, as well as those located along CER routes. The distance from the CER had an indirect negative effect on GVI values, and both green and blue space areas had direct positive effects. The blue space area, elevation, and longitude of parks together exhibited positive effects on the GVI, while latitude had a jointly negative effect. Low GVI values observed for parks in Tsitsihar effectively illustrated the effects of both distance and landscape metrics, and parks in Changchun exhibited high GVI values. Overall, the GVI, as a parameter for assessing the greening of a city, appeared to be at odds with the function of the industrial infrastructures of host cities, regardless of their distance from CER routes.
Given that the GVI is assessed from street views mostly around urban infrastructures, we suggest that future works transition the focus toward distances of GVI locations from railway stations in the same host city. Inner-city distance is useful to assess the level of exposure to green areas that local residents can experience on their way to railway stations. Our study confirms that the GVI represents a reliable variable that can be used to measure geometric factors that influence human perceptions in cities located near CER routes. In future studies, more specific cities and districts should be considered to strengthen the data pool for robust analysis.

Author Contributions

Conceptualization, W.M. and M.S.; methodology, M.S.; software, M.S.; validation, W.M., M.S. and T.L.; formal analysis, W.M.; investigation, M.S.; resources, M.S.; data curation, W.M.; writing—original draft preparation, W.M.; writing—review and editing, T.L.; visualization, W.M.; supervision, T.L.; project administration, W.M.; funding acquisition, W.M. and M.S. All authors have read and agreed to the published version of the manuscript.

Funding

This research was funded by the National Natural Science Foundation of China “Research on the Form Construction and Protection Mode of Chinese Eastern Railway Industrial Heritage Corridor based on Digital Technology” (grant number: 52078238).

Institutional Review Board Statement

Not applicable.

Informed Consent Statement

Not applicable.

Data Availability Statement

The data presented in this study are available on request from the corresponding author.

Acknowledgments

The authors acknowledge the professionals who helped to enhance the English in this manuscript. Qiyue Yan from Nanjing No. 5 Senior High School is warmly acknowledged for his contribution to analysis of programmed data obtained from deep learning.

Conflicts of Interest

The authors declare no conflicts of interest.

References

  1. Vul, N. He, Who Has Sown the Wind: Karakhan, the Sino-Soviet conflict over the Chinese Eastern Railway, 1925–1926, and the failure of Soviet policy in northeast China. Mod. Asian Stud. 2014, 48, 1670–1694. [Google Scholar] [CrossRef]
  2. Zhao, Z.Q.; Wang, Q.L. Exploring the Protection Strategy of the Chinese Eastern Railway Culture Town under the Low-Carbon Background. In Proceedings of the 1st International Conference on Energy and Environmental Protection (ICEEP 2012), Hohhot, China, 23–24 June 2012; pp. 2799–2803. [Google Scholar]
  3. Li, Q.; Liu, D.P.; Song, J.S. The Chinese Eastern Railway: Geostrategic heritage from the turn of the twentieth century in Northeast China. J. Asian Archit. Build. Eng. 2023, 22, 2704–2723. [Google Scholar] [CrossRef]
  4. Zhao, Z.Q.; Wang, Q.L. Shaping the Vitality of the National List Historic Culture Town Based on the Theory of Urban Catalysts. In Proceedings of the 2nd International Conference on Structures and Building Materials (ICSBM), Hangzhou, China, 9–11 March 2012; pp. 1637–1641. [Google Scholar]
  5. Li, P.L.; Zhao, Z.Q.; Zhang, B.C.; Chen, Y.L.; Xie, J.Y. Understanding the Visual Relationship between Function and Facade in Historic Buildings Using Deep Learning-A Case Study of the Chinese Eastern Railway. Sustainability 2023, 15, 15857. [Google Scholar] [CrossRef]
  6. Zhao, Z.Q.; Li, S. The Design Framework of Spatial Nodes of Chinese Eastern Railway Culture Town—Case Study of National List Culture Town of Hengdaohezi Town. In Proceedings of the 2nd International Conference on Structures and Building Materials (ICSBM), Hangzhou, China, 9–11 March 2012; pp. 1395–1399. [Google Scholar]
  7. Dabezies, J.M. Heritagization of nature and its influence on local ecological knowledge in Uruguay. Int. J. Herit. Stud. 2018, 24, 828–842. [Google Scholar] [CrossRef]
  8. Kirshenblatt-gimblett, B. Intangible Heritage as Metacultural Production1. Mus. Int. 2004, 56, 52–65. [Google Scholar] [CrossRef]
  9. Hazen, H. Valuing natural heritage: Park visitors’ values related to World Heritage sites in the USA. Curr. Issues Tour. 2009, 12, 165–181. [Google Scholar] [CrossRef]
  10. Wang, S.J.; Duan, W.; Zheng, X.D. Post-Occupancy Evaluation of Brownfield Reuse Based on Sustainable Development: The Case of Beijing Shougang Park. Buildings 2023, 13, 2275. [Google Scholar] [CrossRef]
  11. Zhang, Q.; Lee, J.; Jiang, B.; Kim, G. Revitalization of the Waterfront Park Based on Industrial Heritage Using Post-Occupancy Evaluation-A Case Study of Shanghai (China). Int. J. Environ. Res. Public Health 2022, 19, 9107. [Google Scholar] [CrossRef]
  12. Zhu, A.L. Investigation on the Status Quo of Ecological Environment Construction in Northeast China from the Perspective of Dual Carbon Goals. J. Environ. Public Health 2022, 2022, 8360888. [Google Scholar] [CrossRef] [PubMed]
  13. Wang, X.P.; Meng, L.Q.; Liu, Y.F.; Wei, H.X. Facial Expressions of Urban Forest Visitors Jointly Exposed to Air Pollution and Regional Climate. Forests 2023, 14, 1571. [Google Scholar] [CrossRef]
  14. He, Q.; Wang, Y.; Qiu, Q.; Su, Y.; Wang, Y.; Wei, H.X.; Li, J.Y. Joint effects of air PM2.5 and socioeconomic dimensions on posted emotions of urban green space visitors in cities experiencing population urbanization: A pilot study on 50 cities of East China. Sci. Total Environ. 2023, 861, 160607. [Google Scholar] [CrossRef] [PubMed]
  15. He, Q.; Wang, Y.; Qiu, Q.; Su, Y.; Wei, H.X.; Li, J.Y. Posted Sentiments toward Experiences in Degraded Forests Are Shaped Jointly by Landscape Structure and Microclimate. Ecosyst. Health Sustain. 2023, 9, 0004. [Google Scholar] [CrossRef]
  16. Wei, H.X.; Hauer, R.J.; Sun, Y.X.; Meng, L.Q.; Guo, P. Emotional perceptions of people exposed to green and blue spaces in forest parks of cities at rapid urbanization regions of East China. Urban For. Urban Green. 2022, 78, 127772. [Google Scholar] [CrossRef]
  17. Hemeda, S. Geo-environmental monitoring and 3D finite elements stability analysis for site investigation of underground monuments. Horemheb tomb (KV57), Luxor, Egypt. Herit. Sci. 2021, 9, 17. [Google Scholar] [CrossRef]
  18. Anzani, A.; Invernizzi, F.C.; Maroldi, F.; Mura, R. Cultural potential of green spaces in urban areas. Setup o fknowledge tools. In Proceedings of the 10th International Technology, Education and Development Conference (INTED), Valencia, Spain, 7–9 March 2016; pp. 1135–1145. [Google Scholar]
  19. Pancewicz, A. Contemporary Parks in Post-Industrial Cities of Upper Silesian-Zaglebie Metropolis. In Proceedings of the 3rd World Multidisciplinary Civil Engineering, Architecture, Urban Planning Symposium (WMCAUS), Prague, Czech Republic, 18–22 June 2018. [Google Scholar]
  20. Dong, H.W.; Qin, B. Exploring the link between neighborhood environment and mental wellbeing: A case study in Beijing, China. Landsc. Urban Plan. 2017, 164, 71–80. [Google Scholar] [CrossRef]
  21. Huang, W.C.; Zhang, Y.; Shuai, B.; Xu, M.H.; Xiao, W.; Zhang, R.; Xu, Y.F. China railway industry reform evolution approach: Based on the Vertical Separation Model. Transp. Res. Part A-Policy Pract. 2019, 130, 546–556. [Google Scholar] [CrossRef]
  22. Mu, B.; Mayer, A.L.; He, R.Z.; Tian, G.H. Land use dynamics and policy implications in Central China: A case study of Zhengzhou. Cities 2016, 58, 39–49. [Google Scholar] [CrossRef]
  23. Fernandes-Ferreira, A.; Damaceno-Leite, A.; Chang, S.K.J. Accessible Tourism and the Role of Public Transport Provision: Comparing the Access to Attractions for Tourists with and without Disabilities in Bangkok. In Proceedings of the 13th Asia Pacific Transportation Development Conference—Resilience and Sustainable Transportation Systems, Shanghai Univ Engn Sci, Shanghai, China, 27–30 May 2020; pp. 19–27. [Google Scholar]
  24. Li, X.J. Examining the spatial distribution and temporal change of the green view index in New York City using Google Street View images and deep learning. Environ. Plan. B-Urban Anal. City Sci. 2021, 48, 2039–2054. [Google Scholar] [CrossRef]
  25. Yu, X.Y.; Qi, W. Measuring vegetation greenery in park using iPhone panoramic image and a new green vegetation extraction index. Urban For. Urban Green. 2021, 65, 127310. [Google Scholar] [CrossRef]
  26. Huang, S.Y.; Zhu, J.J.; Zhai, K.B.; Wang, Y.; Wei, H.X.; Xu, Z.H.; Gu, X.R. Do Emotional Perceptions of Visible Greeneries Rely on the Largeness of Green Space? A Verification in Nanchang, China. Forests 2022, 13, 1192. [Google Scholar] [CrossRef]
  27. Sun, Y.; Ma, X.T.; Liu, Y.F.; Meng, L.Q. Salary Satisfaction of Employees at Workplace on a Large Area of Planted Land. Land 2023, 12, 2075. [Google Scholar] [CrossRef]
  28. Luo, J.; Zhai, S.; Song, G.; He, X.; Song, H.; Chen, J.; Liu, H.; Feng, Y. Assessing Inequity in Green Space Exposure toward a “15-Minute City” in Zhengzhou, China: Using Deep Learning and Urban Big Data. Int. J. Environ. Res. Public Health 2022, 19, 5798. [Google Scholar] [CrossRef]
  29. Li, D.; Xu, H.Y.; Kang, Y.; Steemers, K. Systematic Review: Landscape Characteristics Correlated with Physical Activity of the Elderly People. Land 2023, 12, 605. [Google Scholar] [CrossRef]
  30. Gou, A.P.; Zhang, C.; Wang, J.B. Study on the identification and dynamics of green vision rate in Jing’an district, Shanghai based on deeplab V3+model. Earth Sci. Inform. 2022, 15, 163–181. [Google Scholar] [CrossRef]
  31. Xue, C.L.; Jin, C.; Zhou, L.C.; Li, G.N. Exploring the distribution of city street greenery from eye-level: An application of Baidu Map panoramic images data. Geogr. Tidsskr.-Dan. J. Geogr. 2022, 122, 73–86. [Google Scholar] [CrossRef]
  32. Zhu, J.; Qiu, L.; Su, Y.; Guo, Q.; Hu, T.; Bao, H.; Luo, J.; Wu, S.; Xu, Q.; Wang, Z.; et al. Disentangling the effects of the surrounding environment on street-side greenery: Evidence from Hangzhou. Ecol. Indic. 2022, 143, 109153. [Google Scholar] [CrossRef]
  33. Bilgili, B.C.; Satir, O.; Muftuoglu, V.; Ozyavuz, M. A simplified method for the determination of monitoring of green areas in urban parks using multispectral vegetation indices. J. Environ. Prot. Ecol. 2014, 15, 1059–1065. [Google Scholar]
  34. NASA Socioeconomic Data and Applications Center. Global Roads Open Access Data Set (gROADS), v1 (1980–2010). Available online: https://doi.org/10.7927/H4VD6WCT (accessed on 1 September 2023).
  35. Zhang, J.; Yang, Z.; Chen, Z.; Guo, M.Y.; Guo, P. Optimizing Urban Forest Landscape for Better Perceptions of Positive Emotions. Forests 2021, 12, 1691. [Google Scholar] [CrossRef]
  36. NASA Jet Propulsion Laboratory. ASTER Global Digital Elevation Map Announcement. Available online: https://asterweb.jpl.nasa.gov/gdem.asp (accessed on 1 September 2023).
  37. Li, H.Y.; Wang, X.G.; Wei, H.X.; Xia, T.T.; Liu, M.N.; Ai, S.S. Geographical Distribution and Driving Meteorological Forces of Facial Expressions of Visitors in Urban Wetland Parks in Eastern China. Front. Earth Sci. 2022, 10, 781204. [Google Scholar] [CrossRef]
  38. Duan, Y.; Guo, B.; Zhang, L.; Li, J.; Li, S.; Zhao, W.; Yang, G.; Zhou, S.; Zhou, C.; Song, P.; et al. Interactive climate-soil forces shape the spatial distribution of foliar N:P stoichiometry in Vaccinium uliginosum planted in agroforests of Northeast China. Front. Ecol. Evol. 2022, 10, 1065680. [Google Scholar] [CrossRef]
  39. Li, Y.J.; Sun, Y.X.; Zhao, Y.; Wang, Y.; Cheng, S.P. Mapping seasonal sentiments of people visiting blue spaces in urban wetlands: A pilot study on inland cities of China. Front. Ecol. Evol. 2022, 10, 969538. [Google Scholar] [CrossRef]
  40. Li, X.; Zhang, C.; Li, W.; Kuzovkina, Y.A.; Weiner, D. Who lives in greener neighborhoods? The distribution of street greenery and its association with residents’ socioeconomic conditions in Hartford, Connecticut, USA. Urban For. Urban Green. 2015, 14, 751–759. [Google Scholar] [CrossRef]
  41. Kumakoshi, Y.; Chan, S.Y.; Koizumi, H.; Li, X.; Yoshimura, Y. Standardized Green View Index and Quantification of Different Metrics of Urban Green Vegetation. Sustainability 2020, 12, 7434. [Google Scholar] [CrossRef]
  42. Wei, H.; Hauer, R.J.; Guo, S. Daytime dynamic of spontaneous expressions of pedestrians in an urban forest park. Urban For. Urban Green. 2021, 65, 127326. [Google Scholar] [CrossRef]
  43. Zhang, J.; Yang, Z.; Sun, Y.X.; Xu, Z.H.; Hui, T.F.; Guo, P. Experiencing urban forests for mitigation of negative emotions of people exposed to seasonal PM2.5 in Northeast China. J. For. Res. 2023, 34, 1245–1261. [Google Scholar] [CrossRef]
  44. Ulrich, R.S.; Simons, R.F.; Losito, B.D.; Fiorito, E.; Miles, M.A.; Zelson, M. Stress recovery during exposure to natural and urban environments. J. Environ. Psychol. 1991, 11, 201–230. [Google Scholar] [CrossRef]
  45. Kaplan, R.; Kaplan, S. The Experience of Nature: A Psychological Perspective; Cambridge University Press: New York, NY, USA, 1989. [Google Scholar]
  46. Wei, H.X.; Hauer, R.J.; Chen, X.; He, X.Y. Facial Expressions of Visitors in Forests along the Urbanization Gradient: What Can We Learn from Selfies on Social Networking Services? Forests 2019, 10, 1049. [Google Scholar] [CrossRef]
  47. Wei, H.; Ma, B.; Hauer, R.J.; Liu, C.; Chen, X.; He, X. Relationship between environmental factors and facial expressions of visitors during the urban forest experience. Urban For. Urban Green. 2020, 53, 126699. [Google Scholar] [CrossRef]
  48. Chia-pin, L. History of the Chinese Eastern Railway: A Chinese Version. Pac. Aff. 1930, 3, 188–211. [Google Scholar] [CrossRef]
  49. Norton, H.K. International Aspects of the Chinese Eastern Railway. Ann. Am. Acad. Political Soc. Sci. 1930, 152, 308–317. [Google Scholar] [CrossRef]
  50. Wang, J.B.; Liu, W.; Gou, A.P. Numerical characteristics and spatial distribution of panoramic Street Green View index based on SegNet semantic segmentation in Savannah. Urban For. Urban Green. 2022, 69, 127488. [Google Scholar] [CrossRef]
  51. Zheng, Y.; Zhu, J.L.; Wang, S.; Guo, P. Perceived Economic Values of Cultural Ecosystem Services in Green and Blue Spaces of 98 Urban Wetland Parks in Jiangxi, China. Forests 2023, 14, 273. [Google Scholar] [CrossRef]
  52. An, B.Y.; Wang, D.; Liu, X.J.; Guan, H.M.; Wei, H.X.; Ren, Z.B. The effect of environmental factors in urban forests on blood pressure and heart rate in university students. J. For. Res. 2019, 24, 27–34. [Google Scholar] [CrossRef]
  53. Guan, H.; Wei, H.; He, X.; Ren, Z.; An, B. The tree-species-specific effect of forest bathing on perceived anxiety alleviation of young-adults in urban forests. Ann. For. Res. 2017, 60, 327–341. [Google Scholar] [CrossRef]
Figure 1. Spatial distribution of Chinese East Railway and cities selected in this study.
Sustainability 16 01977 g001
Figure 2. Typical recognitions of green view index (GVI) for greeneries in cities attached to areas covered by CER routes.
Sustainability 16 01977 g002
Figure 3. Combined effects of province and park type on green view index in parks. Abbreviations: BJ—Beijing; TJ—Tianjin; JL—Jilin; LN—Liaoning; IM—Inner Mongolia; HLJ—Heilongjiang.
Sustainability 16 01977 g003
Figure 4. Extreme and average values of green view index (GVI) in all 42 parks detected using deep learning recognition. Coupled GVI examples are listed in cells following the order of (AC).
Sustainability 16 01977 g004
Figure 5. Ranks (A) and histograms of GVI averages (B), highest values (orange dots in (A)) (C), and lowest values (dark red in (A)) (D) among parks.
Sustainability 16 01977 g005
Figure 6. Relationship between distance from CER and estimated effects via analysis of maximum likelihood parameter analysis.
Sustainability 16 01977 g006
Figure 7. Distributions of GVI values in parks scattered across cities along CER routes.
Sustainability 16 01977 g007
Figure 8. Spatial distribution of interpolated GVI values predicted by fusing four distribution patterns of blue space area (logarithm), elevation (logarithm), latitude, and longitude of urban forest parks distributed along CER routes.
Sustainability 16 01977 g008
Table 1. Geographical information for urban parks distributed within the area covered by the Chinese Eastern Railway network.
No.ProvinceCityPark NameLongitudeLatitude
1HeilongjiangHarbinClove Park126.56145.742
2HeilongjiangMutankiangNorth Hill Park129.58844.605
3HeilongjiangTsitsiharCrane City Park123.95047.298
4JilinJilinSonghua River South Park126.55243.826
5JilinChangchunSouth Lake Park125.30243.852
6JilinChangchunNorth Lake Wetland Park125.35843.974
7JilinSipingNanhu Park124.35743.160
8JilinLiaoyuanDragon Mountain Park125.14842.895
9JilinSongyuanMirror Lake Park124.80445.128
10JilinSongyuanSonghua River Forest Park124.85945.156
11LiaoningBenxiSmall Hua Mountain Park123.78541.310
12LiaoningYingkouLiao River Park122.23940.679
13LiaoningYingkouJing Lake Park122.21440.658
14LiaoningFuxinPeople Park121.65442.020
15LiaoningFuxinYulong Park121.74842.050
16LiaoningLiaoyangWhite Tower Park123.17041.277
17LiaoningLiaoyangLongding Mountain Park123.20941.184
18LiaoningPanjinZhongxing Park122.06241.139
19LiaoningPanjinXiushui Lake Park122.06141.064
20LiaoningTielingCulture Park123.83542.291
21LiaoningTielingTieling Sport Park123.86342.286
22LiaoningChaoyangChaoyang People Park120.44741.569
23LiaoningHuludaoDragon Bay Park120.84540.715
24LiaoningAnshanYongle Park122.95041.112
25LiaoningDalianLabor Park121.64138.917
26LiaoningDalianTiger Beach Ocean Park121.67138.871
27LiaoningDandongJinjiang Mountain Park124.36940.132
28LiaoningDandongYalu River Park124.39240.122
29LiaoningFushunLaodong Park123.91941.865
30LiaoningFushunCrescent Isle Park123.83441.858
31LiaoningJinzhouBeihu Park121.12841.137
32LiaoningShenyangNan Lake Park123.40741.768
33LiaoningShenyangQipanshan Beauty Spot123.66541.938
34Inner MongoliaHohhotManduhai Park111.68240.815
35Inner MongoliaHohhotChilechuan Park111.76040.814
36Inner MongoliaBaotouLaodong Park109.86940.657
37Inner MongoliaBaotouSaihantala Ecological Park109.89740.627
38Inner MongoliaTongliaoXilamulun Park122.25543.630
39BeijingBeijingOlympic Forest Park116.38740.026
40BeijingBeijingDongjiao Wetalnd Park116.65440.021
41TianjinTianjinBeining Park117.20739.169
42TianjinTianjinChanghong Ecological Park117.14639.133
Table 2. Results of multivariate linear regression of GVI against topographical and landscape metrics.
VariableParameterStandardType II SS 1F ValuePr > F
EstimateError
Intercept−28.5749.6938.710.330.5688
Log(WA) 232.0513.14696.675.950.0197
Longitude1.390.56722.366.170.0177
Latitude−3.471.37749.366.40.0158
Log(DEM) 311.953.841135.509.690.0036
1 SS—sum of squares; 2 Log(WA)—logarithm of waterbody area per park; 3 Log(DEM)—logarithm of digital elevation model value.
Disclaimer/Publisher’s Note: The statements, opinions and data contained in all publications are solely those of the individual author(s) and contributor(s) and not of MDPI and/or the editor(s). MDPI and/or the editor(s) disclaim responsibility for any injury to people or property resulting from any ideas, methods, instructions or products referred to in the content.

