Article

Exploring the Effects of Multi-Governance Mechanisms throughout the Dynamic Evolution of the Cooperative Innovation Network

1
School of Business, Changzhou University, Changzhou 211130, China
2
Department of Circulation Economics, Institute of Western China Economic Research, Southwestern University of Finance and Economics, Chengdu 611130, China
*
Author to whom correspondence should be addressed.
Sustainability 2024, 16(5), 2002; https://doi.org/10.3390/su16052002
Submission received: 9 January 2024 / Revised: 23 February 2024 / Accepted: 24 February 2024 / Published: 28 February 2024
(This article belongs to the Section Economic and Business Aspects of Sustainability)

Abstract

:
The sustainable evolution of cooperative innovation networks is determined to a great extent by the effectiveness of their governance mechanisms. In this study, we draw from social network and stakeholder theories to emphasize two types of mechanisms that coordinate cooperative innovation: the internal drivers of transitivity and status, which are endogenous mechanisms of network embeddedness, and the external drivers of association autonomy, industrial policy support, and institutional environment establishment, which are the governing effects of external stakeholders. We constructed cooperative innovation networks using a dataset on joint applications for patents in China’s electronics information industry during 2006–2018 and applied a Stochastic Actor-Oriented Model (SAOM) for analytical purposes. The findings show that as networks evolve, the effect of transitivity on cooperative innovation first slightly decreases and then intensifies. The influence of status and industrial policy support intensifies first and then weakens. The impact of association autonomy remains stable, and institutional environment establishment on cooperative innovation intensifies. We also provide theoretical and managerial implications for the dynamic evolution of cooperative innovation networks.

1. Introduction

As industrial technology becomes increasingly complex, a multitude of enterprises are seeking to acquire complementary resources for innovation through collaborative efforts [1]. Entities immersed in cooperative innovation have emerged as a collective for value co-creation, with their interrelationships evolving into a networked structure [2]. Owing to varying interests and objectives, networked collaborations have a loosely coupled structure. The inherent vulnerability of such networks, alongside the bounded rationality of decision-makers, implies that the emergence of sustainable cooperative innovations is not a natural process [3,4]. Remarkably, nearly 34% of cooperation networks ultimately result in failure [5].
Therefore, it is imperative to implement governance mechanisms to safeguard the sustainable evolution of cooperative innovation networks [6]. Nevertheless, to date, most studies have focused on dyadic interfirm relationships, such as those to promote individual cooperative innovation performance through contractual and relational governance mechanisms [7,8,9]. In the realm of cooperative innovation networks, distinguished by their complex interrelationships, these approaches may be found to be insufficient. A limited number of studies on the governance mechanisms of network organizations have predominantly concentrated on the informal social systems derived from network embeddedness [8,10,11]. From the perspective of network analysis, the formation and continuity of networked cooperative relationships are simultaneously influenced by external stakeholders [12,13]. However, the role of these stakeholders has not been explored in depth.
Cooperative relationships, in a networked context, arise from the cumulative influence of diverse governance mechanisms [14]. On the one hand, cooperative innovation behaviors tend to follow a path-dependent trajectory. This is primarily attributed to endogenous mechanisms within networks. These mechanisms, originating from earlier connections, lead to the reemergence of these linkages, thereby reinforcing the existing network structure [15,16]. On the other hand, pivotal stakeholders, such as associations and governments, emerge as orchestrators of collaborations. Associations, encompassing a considerable proportion of enterprises within an industry, define and promote mutual benefits [17,18]. Furthermore, the government functions as a formulator of industrial policies and a facilitator of the institutional environment [19,20].
More importantly, over time, notable dynamic changes in cooperative innovation networks occur due to the corresponding alterations in the linkages among enterprises [21]. However, most studies on governance mechanisms are mainly static, given that they pay attention to the network structure rather than its dynamics according to an evolution perspective [11,22,23,24]. In addition, the industry life cycle theory posits that technologically progressive industries undergo a development trajectory from emergence to maturity [25,26]. Typically, the firm population within these industries evolves over time, beginning with a few firms. Following a period of rapid growth in new entrants, the rate of new firm entry may eventually decline [27]. The entry and exit of firms lead to the continuous reconfiguration of interrelationships within the network [28]. Therefore, with the evolution of networks, changes in aspects such as the number of actors and the intensity of relationships may alter the impact of governance mechanisms on cooperative innovation [29]. Nevertheless, the role of various governance mechanisms in cooperative innovation network dynamics remains unclear, as does the manner in which their influence changes as the network evolves.
To address these issues, we developed a conceptual model in which dynamic changes in the cooperative innovation network are connected to multi-governance mechanisms. The internal drivers of network change include specific endogenous mechanisms of network embeddedness, such as transitivity and status, which represent structural embeddedness and positional embeddedness, respectively [30,31,32]. By external drivers, we refer to the governing mechanisms of stakeholders to establish or maintain relational ties [33,34,35,36]. This concept is operationalized as the association autonomy based on common agreements, along with industry policy support and the institutional environment establishment led by local government.
We constructed cooperative innovation networks using a dataset on joint applications for patents in China’s electronics information industry during 2006–2018 and studied the dynamics over time. We investigated the structural properties of these networks through social network analysis. Moreover, we applied a Stochastic Actor-Oriented Model (SAOM) to analyze the multi-governance mechanisms driving network evolution. We focused on network dynamics and explored how these effects change as the network evolves, from the emergence phase to the mature phase.
Thus, this study contributes to the extant literature in three ways. Firstly, it combines social network theory and stakeholder theory in providing a research model to conceptualize the simultaneous influence of multi-governance mechanisms. The network analysis approach, beyond the dyadic level, has more potential for explaining forces predicting organizational cooperative innovation. It considers the multiple interactions comprising both the internal interrelationships and external stakeholder environments, and has more potential for explaining forces predicting organizational cooperative innovation. Secondly, we attempt to unveil how these mechanisms dominate the formation or reemergence of ties as collaborative innovation networks continue to change. Thus, this study adds to the body of literature on governance mechanisms by shifting the focus from static structures to network dynamics. Lastly, by considering network evolution, the current study also extends the literature by detailing the variations in different mechanisms at each development phase of collaborative innovation networks.

2. Theoretical Foundation and Hypothesis

2.1. Cooperative Innovation Network Dynamics and Governance

The structure of a network can be decomposed into network nodes, the ties that connect these nodes, and the relational schemas that arise from these interconnections. Therefore, the term cooperative innovation network dynamics refers to the various changes in the network structure over time, such as the increase or decrease in the number of members or the transformations in the attributes of interconnections [21]. The entry and exit of network members lead to the formation or dissolution of relationships [37]. Concurrently, the relationship ties may also shift, such as evolving from a nonrelated state to a cooperative relationship. The interconnections between members can manifest diverse alterations when embodied in the form of multiple linkages.
The evolution of a cooperative innovation network is facilitated by mechanisms that stimulate the formation, continuity, or dissolution of connections between nodes and also shape the essence of these relationships [16]. Social network theory suggests that the dynamic evolution of macrostructures within networks is a complex process that is influenced by various micro-level forces [14]. Firstly, the proximity of actors within a network is related to their collaborative behaviors [38]. Organizations with similar professional market domains, technologies, and conventions are more likely to collaborate [39,40,41]. Secondly, pre-existing relationships between network actors may determine their subsequent interactions, especially in the formation of their linkages with others [15]. Significantly, previous collaborative relationships in a network have a profound impact on the establishment of future relational ties in that network [30,42,43]. Lastly, the network dynamics may display more intricate paths. A common view is that the realization of network evolution is a consequence of the synergistic interplay of multiple mechanisms, both internal and external to the network [44].
Governance mechanisms in cooperative innovation networks are the guidance, encouragement, and regulation approaches to coordinate bilateral and multilateral network relationships. These mechanisms are embodied in conflict resolution, the maintenance of order, and the enhancement of collective efficiency [45,46]. Network governance has the feasibility and efficacy to overcome challenges associated with coordination, trust, and information sharing in cooperative innovation activities [47,48,49]. In this sense, the competitiveness of a cooperative innovation network is a result of its governance.
According to network governance theory, the horizontal, hierarchical, and interactive relationships between diverse actors influence the mode of network operation [50,51,52]. Governance provides institutional arrangements for each actor to exert its influence, and establishes an environment conducive to cooperation and information exchange [29,53]. However, most studies on network governance mechanisms have emphasized the informal or social principles (e.g., trust-building, commitment, and reputation) to promote the cooperation performance of individual enterprises [8,9]. Little attention has been directed toward the methods provided by actors external to the network. Thus, the extent to which those critical stakeholders contribute towards supporting governance for sustainable cooperative innovation behaviors within the network remains unclear.
From a network perspective, the stakeholder environment reflects the influence of societal sectors, comprising a range of organizations operating within the same domain alongside critical constituencies that have interests in their business activities [7,54,55]. External pressures originate from entities that shape and enforce institutional rules and beliefs, as well as those who control scarce resources [12,56]. In response to these external pressures, management decisions and organizational survival are contingent on compliance with the expectations of formal or semi-formal institutions. These institutions include industrial associations and local governments. The theory of national competitive advantage suggests that the appropriate role of government is to stimulate innovation by firms [57]. The execution of government policies creates favorable conditions that promote innovation [58,59,60]. Local governments can provide actors with institutional arrangements conducive to protecting property rights and strengthening the enforceability of contracts, thus reducing transaction costs [61]. Industry associations, representing the majority of firms within an industry, contribute to the enhancement and enforcement of cooperation for innovation. They also facilitate multilateral network interactions, as evidenced by their coordination efforts [53,62,63].
On the basis of this discussion, we propose that the dynamic changes in cooperative innovation relationships in the network are jointly driven by multi-governance mechanisms. Our research models are presented in Figure 1. These mechanisms integrate the governing effects of internal and external factors, that is, endogenous network embeddedness and key stakeholders, respectively. In particular, this study focuses on how these effects of multi-governance mechanisms on cooperative innovation would change as networks continue to evolve across different phases.

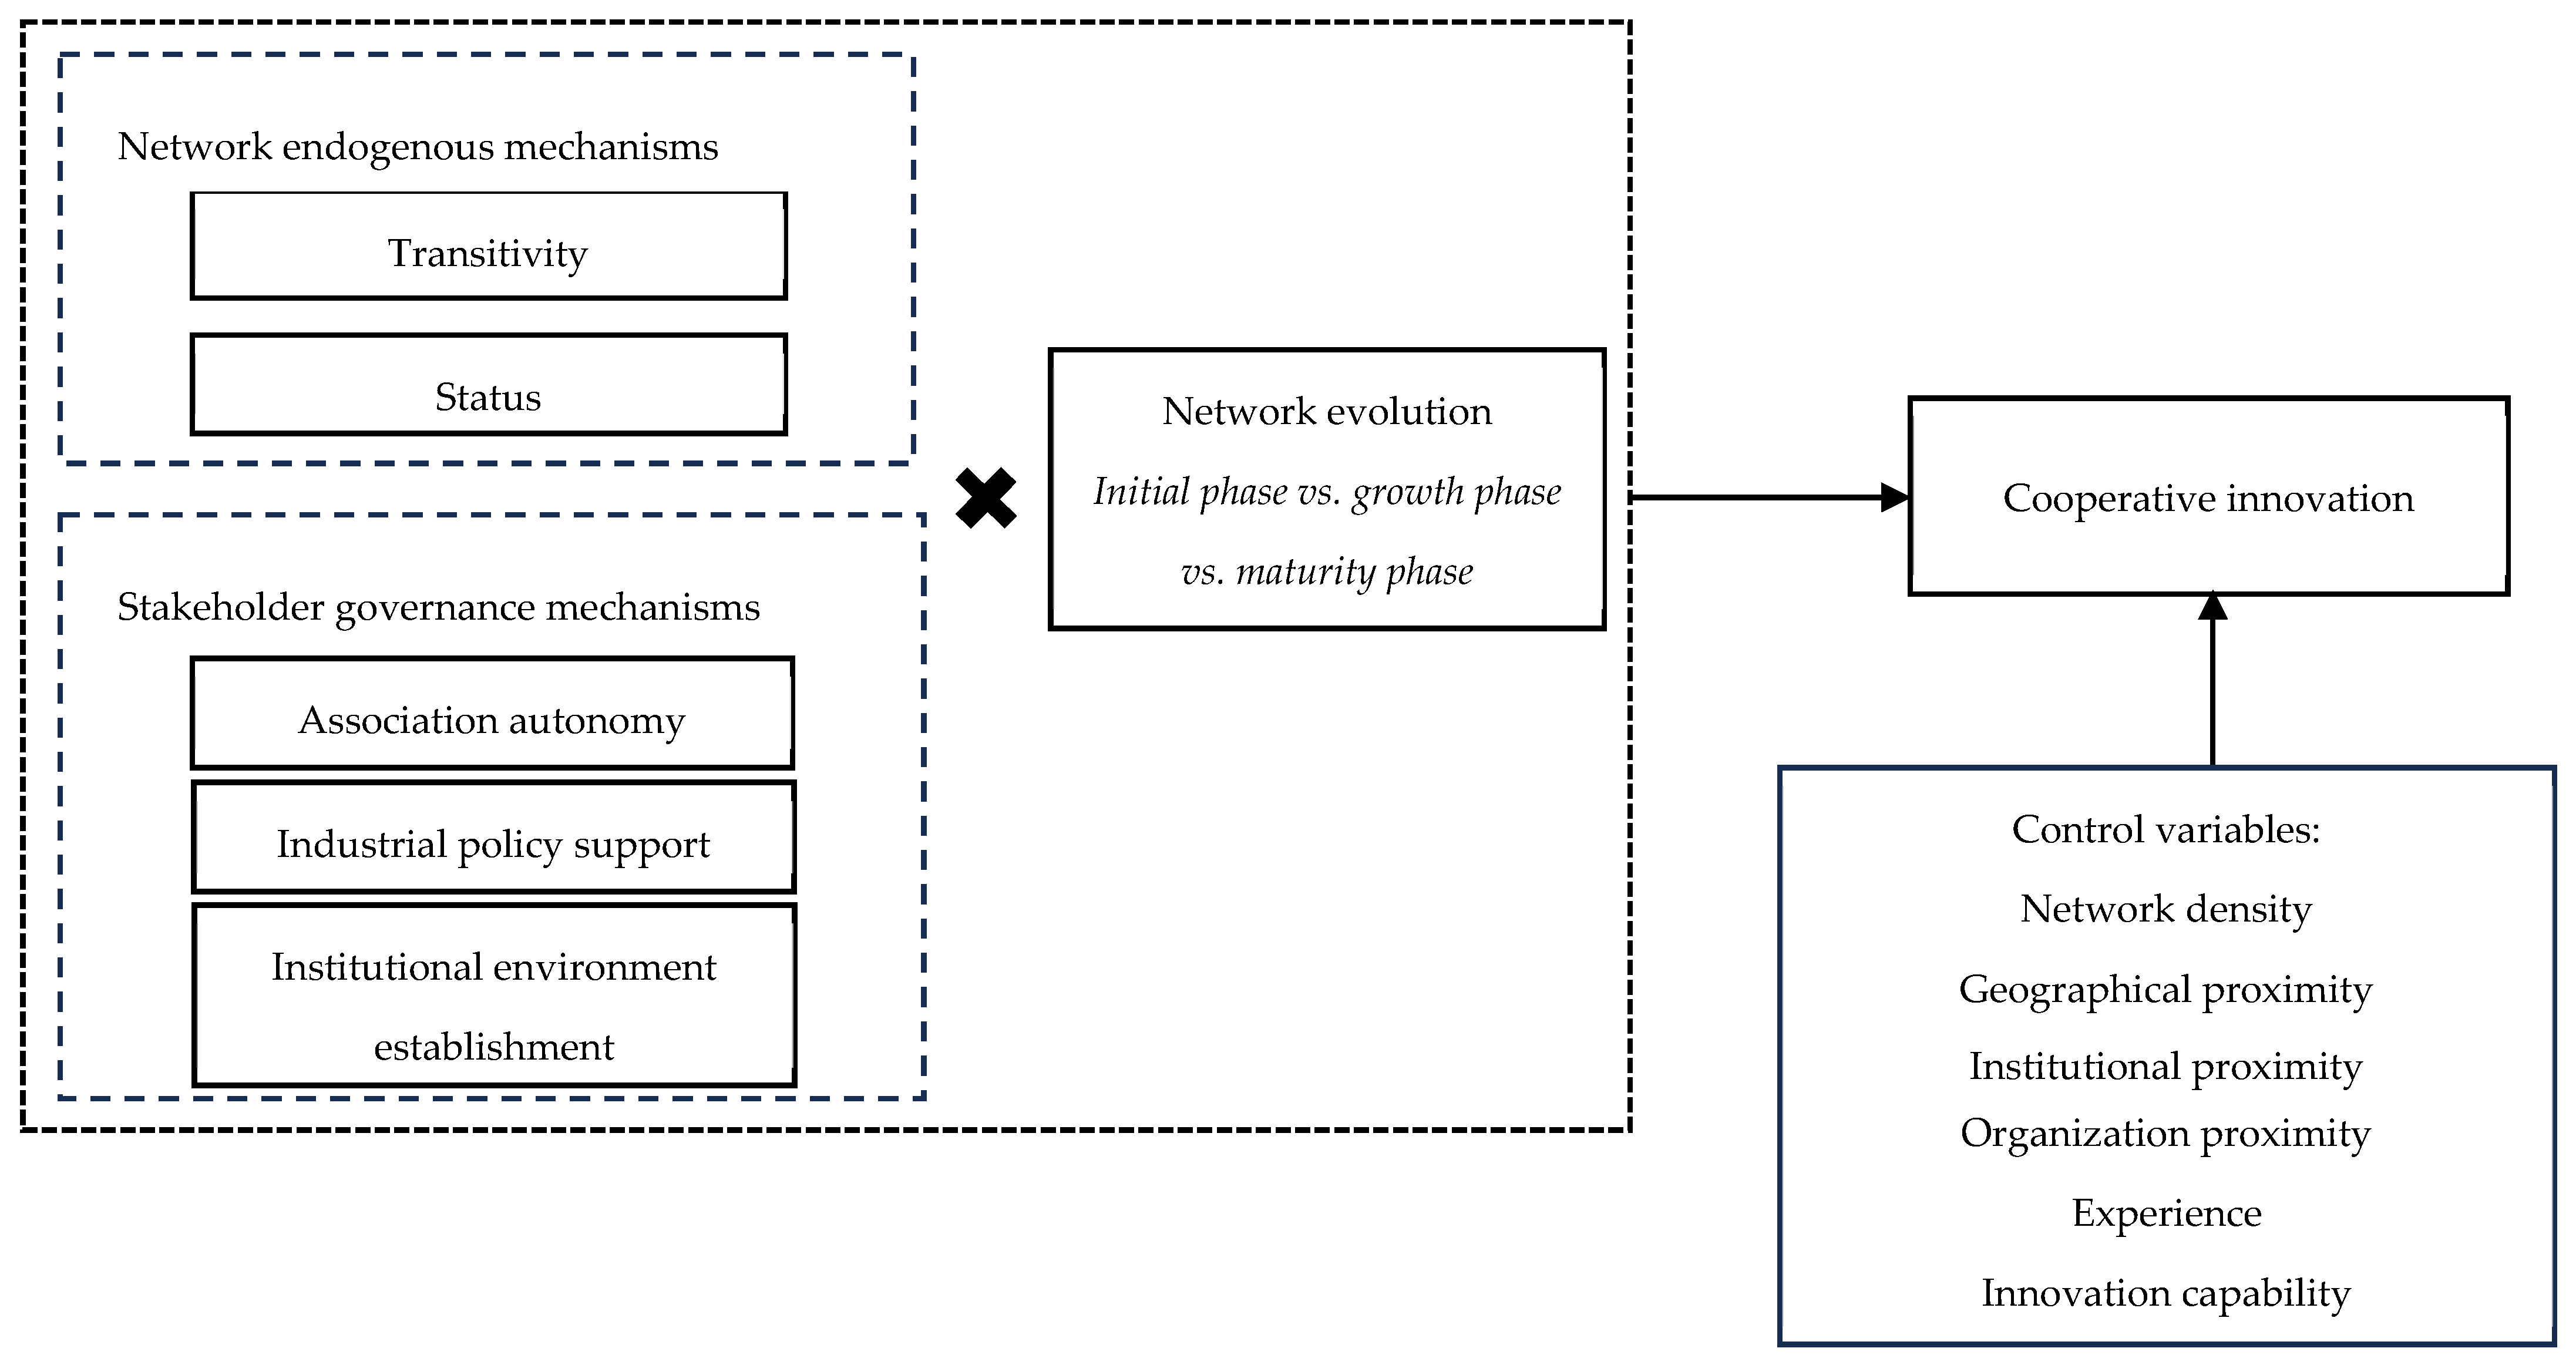
2.2. Network Endogenous Mechanisms and Cooperative Innovation

Pre-existing relationships between firms inherently affect the continuity of cooperative innovation networks. The fundamental principle of network endogenous mechanisms is to maintain the orderly operation of the network. This goal is achieved through informal governance approaches established according to previous interconnections between actors [64,65]. In this study, we explored two network endogenous mechanisms: transitivity and status. Transitivity is characterized as the formation of a new link between two actors who share a link with a common third actor. It reflects the network’s structural embeddedness that strengthens existing direct or indirect connections [28,44]. In addition, status refers to the actor’s position within the network, and those occupying more central positions within the network often tend to receive more connection requests. Thus, their network position serves as a signal of high levels of expertise and reputation, thereby giving them the potential to link others who were previously unconnected [66,67].

2.2.1. Transitivity and Cooperative Innovation

Transitivity suggests that in a network, if two entities are linked to a common third party, it increases the probability of a new link forming between them. This results in a triadic closure relationship structure among these actors [68]. Before the establishment of such cooperative relationships, information asymmetry among network members leads to an inadequate understanding of potential partners among them, thereby increasing the risk of opportunism. Shared partners can offer valuable information to both parties, which reduces the uncertainty regarding their capabilities and credibility [69,70]. Therefore, the common third party can act as a reliable intermediary and help them save the costs associated with the search for partners [28,36,44].
Furthermore, triadic closure relationships are often viewed as indicators of social capital [65]. Through strategic partner selection based on transitivity, actors within the network can effectively stimulate a more seamless flow of knowledge and technology exchanges [71,72]. Indeed, it is more likely for them to share complex or tacit knowledge [72]. Consequently, the shorter the network distance between any two actors, the higher their propensity to collaborate for innovation, which, in turn, leads to a more tightly interconnected network [73].
With the continuous growth of the network scale, this process involves the reallocation of resources and the restructuring of network connections [74,75]. This shift is crucial to maintain a heightened awareness of changes in the institutional and market environments. Network participants aim to augment their resource base by establishing connections with enterprises from diverse backgrounds, many of which have been previously unknown to them. Within these weakly tied networks, the level of trust and reciprocity is relatively low, which thereby inhibits the effective utilization of information [76]. In the absence of trust and shared norms, knowledge sharing, technical exchanges, and large-scale interfirm cooperation can be challenging [77,78]. Furthermore, a lack of powerful group control mechanisms leaves these collaborations vulnerable to opportunistic behaviors from other parties [79,80]. These concerns are particularly prevalent in the context of cooperative innovation, a process that requires stringent safeguards to prevent unauthorized access to and misappropriation of exclusive competitive knowledge [81].
In such circumstances, actors tend to form collaborative partnerships owing to the presence of transitivity. Given that tacit knowledge increasingly constitutes a core competitive advantage as innovative activities progressively deepen, there is an urgent need to mitigate the risks associated with plagiarism and infringement [82,83]. The enhancement of trust within cooperative endeavors is facilitated by the ability to monitor interaction activities with unfamiliar connections via shared partners [84]. In essence, the intermediary role of transitivity contributes to the understanding of partners and mitigates the risk of opportunistic behaviors. It influences the willingness to engage in collaborations among diverse entities, thereby driving the evolution of the cooperative network over time. Therefore, we hypothesize that
H1: 
As networks evolve, the positive effect of transitivity on cooperation innovation increases.

2.2.2. Status and Cooperative Innovation

In addition to closed triadic relationships resulting in an increase in network connections, status effects can influence the evolution of cooperative innovation networks [85]. The more central the entity’s status in the network, the greater the number of connections they maintain with other members or the more frequently they feature in the path of other connections [86,87]. More importantly, because of their extensive connections, they dominate the dynamics of the entire network interaction activities, such as the types, objects, and frequencies of knowledge exchanges [88]. These focal actors contribute substantially to the advancement and innovation performance of the network.
Social network analysis suggests that network status plays a crucial role in determining the connections with which entities choose to link. Status reflects the perceived quality of the actors, with a noteworthy status suggesting a considerable degree of expertise and reputation [89]. Network actors tend to collaborate with individuals of superior status [85]. In the early stages of network development, actors operating under resource constraints often experience limitations in their observational capabilities. This restricts their ability to gather and accumulate credible information about other network members. In this instance, establishing connections with central enterprises emerges as a strategic decision. Firstly, the network status effect can significantly streamline the process of identifying partners, thereby reducing search costs. Secondly, cooperative engagement with reputable actors may serve as a strong indication of quality. Consequently, in order to gain network legitimacy, individuals within a network are incentivized to form connections with enterprises that hold central positions [90]. Lastly, obtaining contact with higher-status actors can help them attract more attention. This, in turn, can facilitate the expansion of their relationship network [44].
To reap the benefits of member clustering, a number of new actors may emerge during the growth phase of a network [91]. At this stage, they may be deficient in comprehensive information about other companies within the competitive environment. The scale of the network may also hinder the precise identification of all potential collaborators. To integrate into cooperative activities efficiently and exhibit strengths, status becomes a valid criterion for establishing network connections [28]. However, after a certain period of engagement, the transparency of member information improves. The role of network status as a reliability indicator is weakened when actors develop cooperative partnerships [30]. Moreover, with the evolution of the network, entities engaging in innovation activities increasingly explore more complex domains. This complexity necessitates the integration of a diverse array of heterogeneous knowledge to effectively overcome technological bottlenecks. It is more probable for actors to diversify innovative collaborations emanating from the network periphery, as opposed to solely depending on central enterprises [92]. Therefore, we hypothesize that
H2: 
As networks evolve, the positive effect of status on cooperation innovation first increases and then reduces.

2.3. Stakeholder Governance Mechanisms and Cooperative Innovation

In addition to uncovering the internal endogenous principles that shape the evolution of cooperative innovation networks, we consider the governing effect of two key external stakeholders: industry associations and governments. As for the effect of the former, association autonomy is the governance mechanism by which network members organize collective behavior and coordinate multilateral relationships. This is achieved through the spontaneous establishment of industry associations or chambers of commerce, which operate based on common consultation principles [17,18,93]. As regards the government, the logic of its engagement in cooperative innovation is that it uses its legal power to implement industrial development policies and establish institutional environments [60,94]. Industrial policy support constitutes a strategic framework, which the government implements within a certain period in order to realize development goals and upgrade industrial chains [36,58,95]. In addition, the government establishes the external institutional environment for enterprise competition and cooperation. The institutional environment refers to a series of fundamental political, social, and legal rules that establish the basis for production, exchange, and distribution [56].

2.3.1. Association Autonomy and Cooperation Innovation

Enterprises attempt to engage in collective actions to gather resources with other actors to obtain market benefits, particularly in complex technology development contexts [96]. Nonetheless, the sustainability of their collective actions is influenced by issues such as the presence of discrepancies in interest claims. In this context, industry associations, as organizations dedicated to nurturing collaboration, can assume a pivotal role. Firstly, these associations emphasize the shared identity among members through self-initiated common agreements, which define and promote common interests [97]. Through collaboration, members benefit from the use of collective resources to promote market growth [98,99]. Secondly, industrial associations facilitate member interactions to foster the development of cooperative relationships. This goal is accomplished through formal or informal knowledge-sharing activities, which involve the exchange of ideas, rules, and customs [23]. Frequent interactions allow members to gain a comprehensive understanding of each other. This comprehension can mitigate the potential moral risks associated with information asymmetry [48]. Thirdly, associations possess extensive industry-specific information, including critical market intelligence and information on market dynamics, which may not be readily accessible from public sources [100,101]. Thus, they act as intermediaries for information transmission, which results in the establishment of networks of multilateral connections among members [63,102].
The widespread exchange of innovative components within the cooperative innovation network makes it easier for other, similar competing firms to replicate and engage in reverse engineering. The prevalence of these threats impedes the collaborative innovation intentions of network actors. Through its inherent authority, an association has the capacity to institute self-regulatory mechanisms within the industry [63]. These mechanisms can include the collaborative establishment of industry standards that regulate product or service quality and prevent the adverse selection dilemma. This process can also accelerate the professionalization of enterprises, thereby promoting modularity and scalability in production to encourage technological coordination among related products [36,62]. Furthermore, industry associations leverage collective strength to establish joint monitoring and punishment mechanisms, such as a joint boycott against collaboration with unethical enterprises and a ban on untrustworthy enterprises. Since members are embedded in social relationship networks, information on any opportunistic behavior is quickly disseminated across the entire group [103]. The implementation of collective punishment ensures that the cost of unethical behavior outweighs the potential benefits. This mechanism effectively restrains individuals from engaging in such behavior, thereby reducing the risks of cooperative innovation [93].
The sustainable evolution of collaborative innovation networks has led to a heightened focus on the protection of knowledge assets among its actors. It is critical to have robust monitoring and punishment mechanisms to curb the opportunistic behavior of enterprises. Continuous interaction among association members can further consolidate the clustered social network [18,23]. This enhanced interaction can assist industry associations in more proficiently executing their governance roles. Therefore, we hypothesize that
H3: 
As networks evolve, the positive effect of association autonomy on cooperation innovation increases.

2.3.2. Industrial Policy Support and Cooperation Innovation

Prior studies have demonstrated the positive impact of industrial policy support on innovation. Market innovation often suffers from intellectual property infringement and negative spillover effects, which diminish the returns from engaging in innovative activities. Thus, market forces alone are insufficient to address these issues [104]. The government, through industrial policies, functions as both an investor and a promoter, incentivizing research and development (R&D) [105,106]. This support is particularly critical for small and medium-sized enterprises grappling with inherent resource constraints.
The government’s industrial policy support stimulates innovation collaboration among actors. Firstly, enterprises that are beneficiaries of industrial policies are able to gain preferential access to a range of resources, such as collaborative environments, investment prospects, and capital. This strategic support reasonably reduces their R&D costs and enhances their risk resistance capabilities [95,107]. Secondly, when the potential for knowledge spillover is high, government support serves as an effective public policy instrument. Following government intervention, targeted subsidies for collaborative research can be used to internalize the impact of knowledge spillover, benefiting all parties involved [108,109]. Lastly, industrial policy support represents a government forecast of future economic prospects, with the objective of promoting cooperation to drive industry upgrades. Involvement in these industrial development policies exerts normative institutional pressures on network members, obliging entrepreneurs to conform to governmental expectations and foster relationships with other actors [36].
Moreover, the exponential growth of cooperative networks, characterized by substantial expansion, necessitates abundant resources to sustain it. Industrial policy support, designed to mitigate such resource constraints, can help companies enhance their capability to manage the risks associated with collaboration [110]. However, in the mature phase of a cooperative network, sustainable innovation ability is enhanced through long-term self-accumulation, which minimizes resource constraints. Despite the potential benefits of industrial policies, their efficacy in fostering cooperative innovation among enterprises with strong operational capabilities may be limited. Direct government research support could, in fact, result in a crowding-out effect, potentially weakening the cooperative innovation intention [111]. Therefore, we hypothesize that
H4: 
As networks evolve, the positive effect of industrial policy support on cooperation innovation first increases and then reduces.

2.3.3. Institutional Environment Establishment and Cooperation Innovation

The institutional environment is a critical determinant of enterprise behavior and strategic activities, and it also influences the scope and number of innovation activities [112]. Competition within industries is governed by a blend of formal and informal institutional frameworks. These frameworks provide a standardized platform, ensuring that all enterprises operate under the same set of rules [113]. Scholars have highlighted that the institutional environment serves to maintain fair competition, while simultaneously encouraging collaborations with external organizations [114]. For instance, the strength of intellectual property protection is an important factor in cooperative innovation activities involving technology transfers [115].
The government establishes the external institutional environment that fosters conducive conditions for cooperation. Firstly, an imperfect institutional environment leads to a lack of transparent information, which exacerbates information asymmetry. This may also create barriers for enterprises to acquire resources through network interactions [116]. Consequently, the risk and cost associated with the selection of partners for cooperative innovation may increase. Secondly, these formal and informal rules safeguard the legal rights of corporations and foster confidence in enterprises when they engage in collaborations within a cooperative innovation network [117]. Lastly, a favorable institutional environment is instrumental in ensuring the reliability and enforceability of contracts. Contracts provide a fundamental mechanism for enterprise coordination and conflict prevention. They clarify roles and responsibilities, guide behaviors, and establish procedures to adapt to environmental uncertainty [118,119]. The prompt execution of contracts can stimulate actors’ willingness to engage in collaborative innovation.
In the initial stages of network evolution, certain factors such as resource endowments or relevant historical events can stimulate the agglomeration of innovation actors [63]. However, during this phase, the primary mode of information and knowledge transfer is confined to a select few enterprises. As interaction among members increases, knowledge exchange and interactive learning became crucial sources of new knowledge acquisition or creation [120]. With the maturation of the cooperative innovation network, the extent of technological and knowledge spillovers reaches its maximum, benefiting the entire network. To ensure the sustainable advancement of cooperative innovation activities, it is imperative to establish a more perfect institutional environment. This environment guarantees the effectiveness and enforceability of contracts and acts as a deterrent against potential technological imitation and intellectual property infringement issues. Therefore, we hypothesize that
H5: 
As networks evolve, the positive effect of the institutional environment establishment on cooperation innovation increases.

3. Research Design

3.1. Data Collection

Cooperative innovation, often referred to as networked innovation, has become a necessary strategy for companies to overcome existing challenges and enhance their market competitiveness. This cooperative process is generally focused on emerging technologies and high-tech industries, with R&D cooperation as the main form. The joint application for patents is a substantial outcome of R&D cooperation activities [121]. Patents are the world’s largest technology information source. Their essence is based on the positive integration between organizations for knowledge sharing and transfer, which is embedded in social networks. Consequently, joint patent applications have become an important data source for studying cooperative innovation networks.
In this study, we decided to collect data from 1998 to 2018 on joint patent applications by two or more listed electronic information companies in China in order to identify cooperative innovation networks. The Chinese Patent Law establishes an examination procedure for patent application including five stages: acceptance, preliminary examination, publication, substantive examination, and grant and announcement. The duration of this entire process for invention patents typically ranges from 18 months to 5 years. Given the likelihood that patents filed in 2019 may still be undergoing the substantive examination stage, the data after 2018 are incomplete and therefore unsuitable for reference. In addition, this study focuses on the cooperative ties between actors, with the joint application for patents being regarded as an output of cooperation. It is noteworthy that the cooperative ties must be active. The date the patent office received the cooperative patent application indicates the existence of an active cooperative tie and the production of an output in the particular year. These cooperative ties would be reconfigured following the completion of patent acceptance. However, the time expended during the examination process is for the patent office to verify the validity of the patent. It does not reflect the cooperative innovation activities between actors. Therefore, we used the date of patent acceptance for analysis, which is the date the patent office received the cooperative patent application. We sourced the data from the patent information service platform of the State Intellectual Property Office for the electronic information industry. We selected this industry because it is one of the emerging high-tech sectors actively promoted by the Chinese Government. It has achieved continuous advancement in areas such as 5G, the Internet of Things, and quantum communication. The number of patent applications in this industry has consistently risen, with annual applications exceeding 100,000. This indicates that this industry has transitioned from a phase of scale-based benefits to one characterized by industrial innovation. Therefore, data on this industry can be used to construct cooperative networks and to examine their dynamic evolution mechanisms.
We used the following procedures to screen and select data. (1) We extracted data for 1998–2018 on the patent applications of listed companies in the electronic information industry. We retained data on the joint applications filed by two or more organizations, and excluded applications filed by a single enterprise or individuals. We obtained 38,590 joint applications for patents, as shown in Figure 2. (2) The number of joint applications in each year was less than 200 during 1998–2005, accounting for only 1.37% of the total applications. It was in the early stages of the initial phase of industrialization, and the technical prospects remained uncertain. The level of stability of the network was insufficient to maintain the convergence of the approximation algorithm used to model the network dynamics. This would lead to unreliable results. Therefore, we decided to focus on the governance mechanisms that drove the dynamic evolution of the cooperative innovation network in China’s electronic information industry during 2006–2018. (3) In line with Balland et al. (2013) [28] and Lazzeretti and Capone (2016) [40], from the perspective of industry life cycle, we divided the 2006–2018 period into initial, growth, and maturity phases. Each phase spans five years (i.e., 2006–2010, 2011–2015, and 2016–2018) and includes the current year and the subsequent four years (owing to data availability, the last stage is 2016–2018). These phases are also consistent with the timeframe of China’s 11th, 12th, and 13th Five-Year Plans for National Economic and Social Development (for 2006–2010, for 2011–2015, and for 2016–2020, respectively). We will discuss the rationality of the three-phase division in detail later.

3.2. Methodology

The empirical study of a network’s dynamic evolution necessitates the use of specific statistical models, given the complexity of the relationship structures involved [122]. These models are important in understanding the conditional correlations between observations, particularly those within binary relationship groups that share common effects [38]. The network correlation, which violates traditional regression models such as ordinary least squares and logistic regression because of their assumption of independence among variables, can lead to unreliable estimates of parameter coefficients and variance [123]. To address these issues, scholars have developed statistical models for network panel data, based on Markov random graphs. The SAOM is a widely accepted empirical tool that integrates random effect models, Markov processes, and simulation. In this study, we used SAOM because it is a statistical model for network dynamics that simultaneously allows us to model network endogenous mechanisms and stakeholder governance mechanisms, while controlling for the network density, proximity between actors and the heterogeneity of the actors. Furthermore, it is particularly effective in explaining the dynamic evolution of the network, rather than merely its static state [124].
The SAOM is predicated on three fundamental principles, each of which is contingent on network characteristics. Firstly, the network structure evolves into a continuous-time Markov random chain, with the network at time t + 1 being randomly generated based on time t. Secondly, the network evolution is continuous, implying that observed changes are viewed as accumulated outcomes of numerous unobserved alterations in each step. Each change step allows the behavioral subject to alter only one relationship connection. Thirdly, the model supposes that the network dynamics result from preferences and constraints selected by behavioral subjects, thereby making the model “behavioral-oriented”. The alterations in the network structure are perceived as rational choices made by participants, who rationally analyze the network status of other behavioral subjects to either maintain, dissolve, or establish connections with them [122]. The applicability of these principles is evident in the context of the cooperative innovation network within the electronic information industry. This is primarily due to the continuous dynamism of these cooperative innovation networks from 2006 to 2018, which is a result of the strategic decisions made by behavioral subjects. These decisions are based on the network status in the time t − 1.
In the SAOM, the behavioral subject’s connectivity alterations drive the dynamic evolution of the network. These changes can occur randomly, influencing the relationships with other participants through the creation, maintenance, or dissolution of connections. The changes in cooperative relationships are determined by the rate function p i , which is based on the Poisson process. Any modification in a behavioral subject’s relationship with a specific individual will lead to the creation of a new network state x , x C x 0 .   The possible new states of the network C are based on the initial state of the network. The SAOM employs the logistic regression model to model the probability of selection, as defined by Snijders et al. (2010) [124]. The rate function equation is as follows:
p i x 0 , x , v , w = e x p f i x 0 , x , v , w x ϵ C x 0 exp f i x 0 , x , v , w
where x 0   is the initial state of the network, x is the possible new state of the network, v is the individual attributes of a behavioral subject, and w represents the binary relationship characteristics between behavioral subjects.
The SAOM defines the utility function f i as the objective function of the behavioral subject, with subjects always attempting to maximize the utility function when selecting partners. The evolution of cooperative innovation is simulated using the utility function of the subject by taking into account the effects of the network structure, individual attributes, and proximity. The estimation of β k is achieved through the Markov chain Monte Carlo algorithm. This random approximation algorithm is designed to simulate the network evolution, aiming to minimize the observed difference between the actual network and the simulated network, in order to estimate β k .
f i x 0 , x , v , w = k β k s k i x 0 , x , v , w
where β k are the estimated parameters, and s k i are factors affecting the dynamic evolution of the network.

3.3. Variable Description

3.3.1. Cooperative Innovation Network

We constructed the cooperative innovation network using the following principles: (1) This study concentrated on collaborative innovation activities that have yielded substantial outcomes. Normally, the cooperative innovation activity is structured project-by-project, with the partnership being reconfigured following the completion of each project [125]. We assumed that relationships between network members are active in the specific year of their joint application for a patent. For instance, if members i and j cooperate to apply for a patent in 2006, we presumed that there was a collaborative relationship between them in that year. It means that the tie would be dissolved in 2007 if i and j do not cooperate to develop any patent together again. Note that the potential for rebuilding that tie exists as long as they jointly participate in innovative activities afterwards. (2) The interactive nature of collaborative relationships between network members was represented by 0 and 1. We assumed that if members i and j collaborate to develop patents (regardless of the quantity), their cooperative relationship is denoted as 1 within the network. (3) Owing to the model settings, each year in one stage corresponds to a collaboration relationship matrix with the same nodes n × n, but subjects could enter and exit the network. (4) The temporary entry or exit of subjects who exhibit a certain behavior would lower network stability, leading to unreliable results in the analysis of the dynamic evolution of networks.
We adopted the method used by Balland et al. (2013) [28] to build the cooperative network for each phase (2006–2010, 2011–2015, 2016–2018). The subjects of analysis are those who have appeared for at least two years and formed collaborative relationships at least twice within this phase. Consequently, 26,516 items of joint applications for patents were screened, with 758 participating behavioral subjects in all the three stages. The cooperative innovation networks were constructed separately for the three phases of 2006–2010 (five binary matrices of 176 × 176), 2011–2015 (five binary matrices of 402 × 402), and 2016–2018 (three binary matrices of 419 × 419).

3.3.2. Explanatory Variables

The explanatory variables are the network endogenous mechanisms and the stakeholder governance mechanisms. For the endogenous mechanisms, we examined the effects of transitivity and status, using the triadic closure relationship to describe the transitivity effect and the degree centrality to describe the status effect. For stakeholder governance mechanisms, we analyzed the effects association autonomy, industrial policy support, and institutional environment establishment.
  • Transitivity
Transitivity occurs when a new connection is formed between two nodes that are linked to a common third party [41,44]. The connection i → j is proportional to the total number of transitive triplets that it forms. These triplets can be of the type [i → j → h; i → h] as well as [i → h → j; i → j].
T i = j , h x i j x i h x j h
The nodes j and h, excluding i, are interconnected, as indicated by the value of x j h   being 1. The values of x i j , x i h , which can be either 1 or 0, denote whether there is a connection between node i and nodes j and h.
2.
Status
Network status signifies the propensity of actors with numerous relationships within the network to attract more members to form connections with them. We measured network status through degree centrality, defined as the cumulative number of other actors directly connected to node i within the network. We used the square root to reduce collinearity and other endogenous effects.
C i = j x i j h x j h
The values of x i j and x j h are either 1 or 0, representing whether there is a connection between node i and node j, and between node j and node h, respectively.
3.
Association autonomy
Association autonomy is reflected in the proactive engagement of network members in collectively formed organizations [93]. We measured association autonomy as the count of associations related to the electronic information industry in which network members are involved. We identified members from 40 electronic information industry associations, such as the China Electronic Information Industry Federation, China Electronics Enterprises Association, China Electronic Components Association, China Electronic Instrument Industry Association, China Computer Industry Association, China Software Industry Association, and regional associations in areas where cooperative innovation network actors are clustered, including Guangdong Province Electronic Information Industry Association, Beijing Information Industry Association, and Shanghai Information and Communication Industry Association. Then, we cross-referenced these members with the actors in the cooperative innovation network to obtain the number of associations in which each actor participates.
4.
Industrial policy support
Industrial policy refers to a series of specific policies used to guide and promote the formation, upgradation, and adjustment of industries with the aim of achieving industrial development goals over a certain period [126]. We summarized the contents of the Five-Year Plan outline documents formulated by the provinces where the network members are located, across the stages (2006–2010, 2011–2015, 2016–2018). The provincial Five-Year Plan is a long-term program, designed in accordance with China’s National Five-Year Plan. It is formulated by considering the specific conditions of each province, including its natural resources and industrial characteristics. These plans aim to develop a roadmap for aspects such as the region’s economic industrial layout, economic transformation and upgrading, and innovation-driven strategies and priorities. Therefore, the Five-Year Plan sets general goals and directions for economic development [126,127]. We measured industry policy support using a 4-point scale—if it is not listed, this variable takes the value of 0; if it is an encouraged industry, it takes 1; if it is a supported industry, it takes 2; and if it is a key supported industry, it takes the value of 3.
5.
Institutional environment establishment
The institutional environment reflects the government’s provision of a more favorable and transparent environment that helps to promote market operation. Following Fan et al. (2017) [117], we used the institutional competitiveness score ranking of the province in which the member is located from the China City Competitiveness Annual Report jointly released by the Chinese Academy of Social Sciences and the Economic Daily from 2006 to 2018. We reversed the ranking, indicating that a higher value corresponds to a more comprehensive property rights protection system and a more equitable legal system.
6.
Control variables
To eliminate the influence of other factors along the dynamic evolution of cooperative innovation networks, we included three types of control variables identified in prior studies: network density, proximity between actors, and heterogeneity of actors [36,124,128].
The first, network density, is the general propensity to form connections within a cooperative innovation network [124,129]. It can be interpreted as the balance between the advantages and costs associated with having additional links. Therefore, the lower the network density, the costlier it is for actors to establish a new collaborative relationship [130]. Network density is measured by the out degree of actors:
D i = j x i j
The second factor is proximity between actors. That is, actors are more likely to engage in collaborative efforts when they have similar characteristics, such as geographical location, knowledge base, or belonging to same business group [128]. It is correlated with reduced cost or risks and increased information about the trustworthiness of potential partnerships. In the context of interorganizational cooperative innovation, proximity in geographical distance and similarity in organizational and institutional types may be important factors [41]. Therefore, we controlled the effects of multi-dimensions of proximity, including geographical, institutional, and organizational proximity.
Geographical proximity, which denotes the spatial distance between actors within a network, serves as a fundamental precondition for the realization of recurrent collaboration, information exchange, and multilateral social ties [131]. According to the method proposed by Lazzeretti and Capone (2016) [40], we classified the geographical proximity between two actors into three distinct categories. This was represented by a dummy variable that we assigned a value to, as follows: 0 if the actors are located in different provinces, 1 if the actors are located in the same province but different cities, and 2 if the actors are located in the same city in a given province.
Institutional proximity reflects the propensity for cooperation when actors are subject to the same laws and rules and have a common culture, norms, and values. The shared culture, norms, and values serve to mitigate uncertainty and transaction costs, thereby laying the groundwork for economic coordination and interactive learning [132]. Adopting the method proposed by Lazzeretti and Capone (2016) [40], we categorized actors into three groups: enterprises, universities and research institutions, and public institutions. This variable takes the value of 1 when two network actors belong to the same category, and 0 otherwise.
Organization proximity refers to the procedures that link organizations within the same framework, implying that they have similar conventions and incentive mechanisms [39]. The development of organizational conventions serves to diminish the uncertainty associated with the behavior of future partners, thereby promoting the capacity for collaborative endeavors and participation in innovation networks. Adopting the method proposed by Balland et al. (2013) [28], we collated data about the ownership structures of all actors within the network. We differentiated each actor based on their equity structure, subsidiaries, and any historical alterations to these structures. Consequently, this variable takes the value of 1 when two actors are part of the same legal entity, and 0 otherwise.
Regarding the third factor, the literature has argued that the heterogeneity of actors may also take an active role in influencing their decisions to collaboration [133]. To control such effects, we measured the experience and innovation capability of each actor.
The experience of an actor represents its tenure of operation within the electronic information industry, serving as a proxy for R&D capabilities. Those with extensive experience tend to have a more profound understanding of consumer needs and market fluctuations and demonstrate an ability to manage R&D risks. This proficiency typically leads to a greater propensity for identifying and attracting potential collaborators [28]. Accordingly, we incorporated experience, measured as an actor’s operation tenure in the electronic information industry, as a control variable.
Innovation capability reflects a wealth of internal knowledge that can be used and potentially shared with other nodes within the network [36,134]. Members who are innovative tend to collaborate with diverse sources of knowledge. Therefore, we included it as a control variable, measured by the number of cooperative patents of each actor in the past five years. The variables and their definitions are presented in Table 1.

4. Analyses and Results

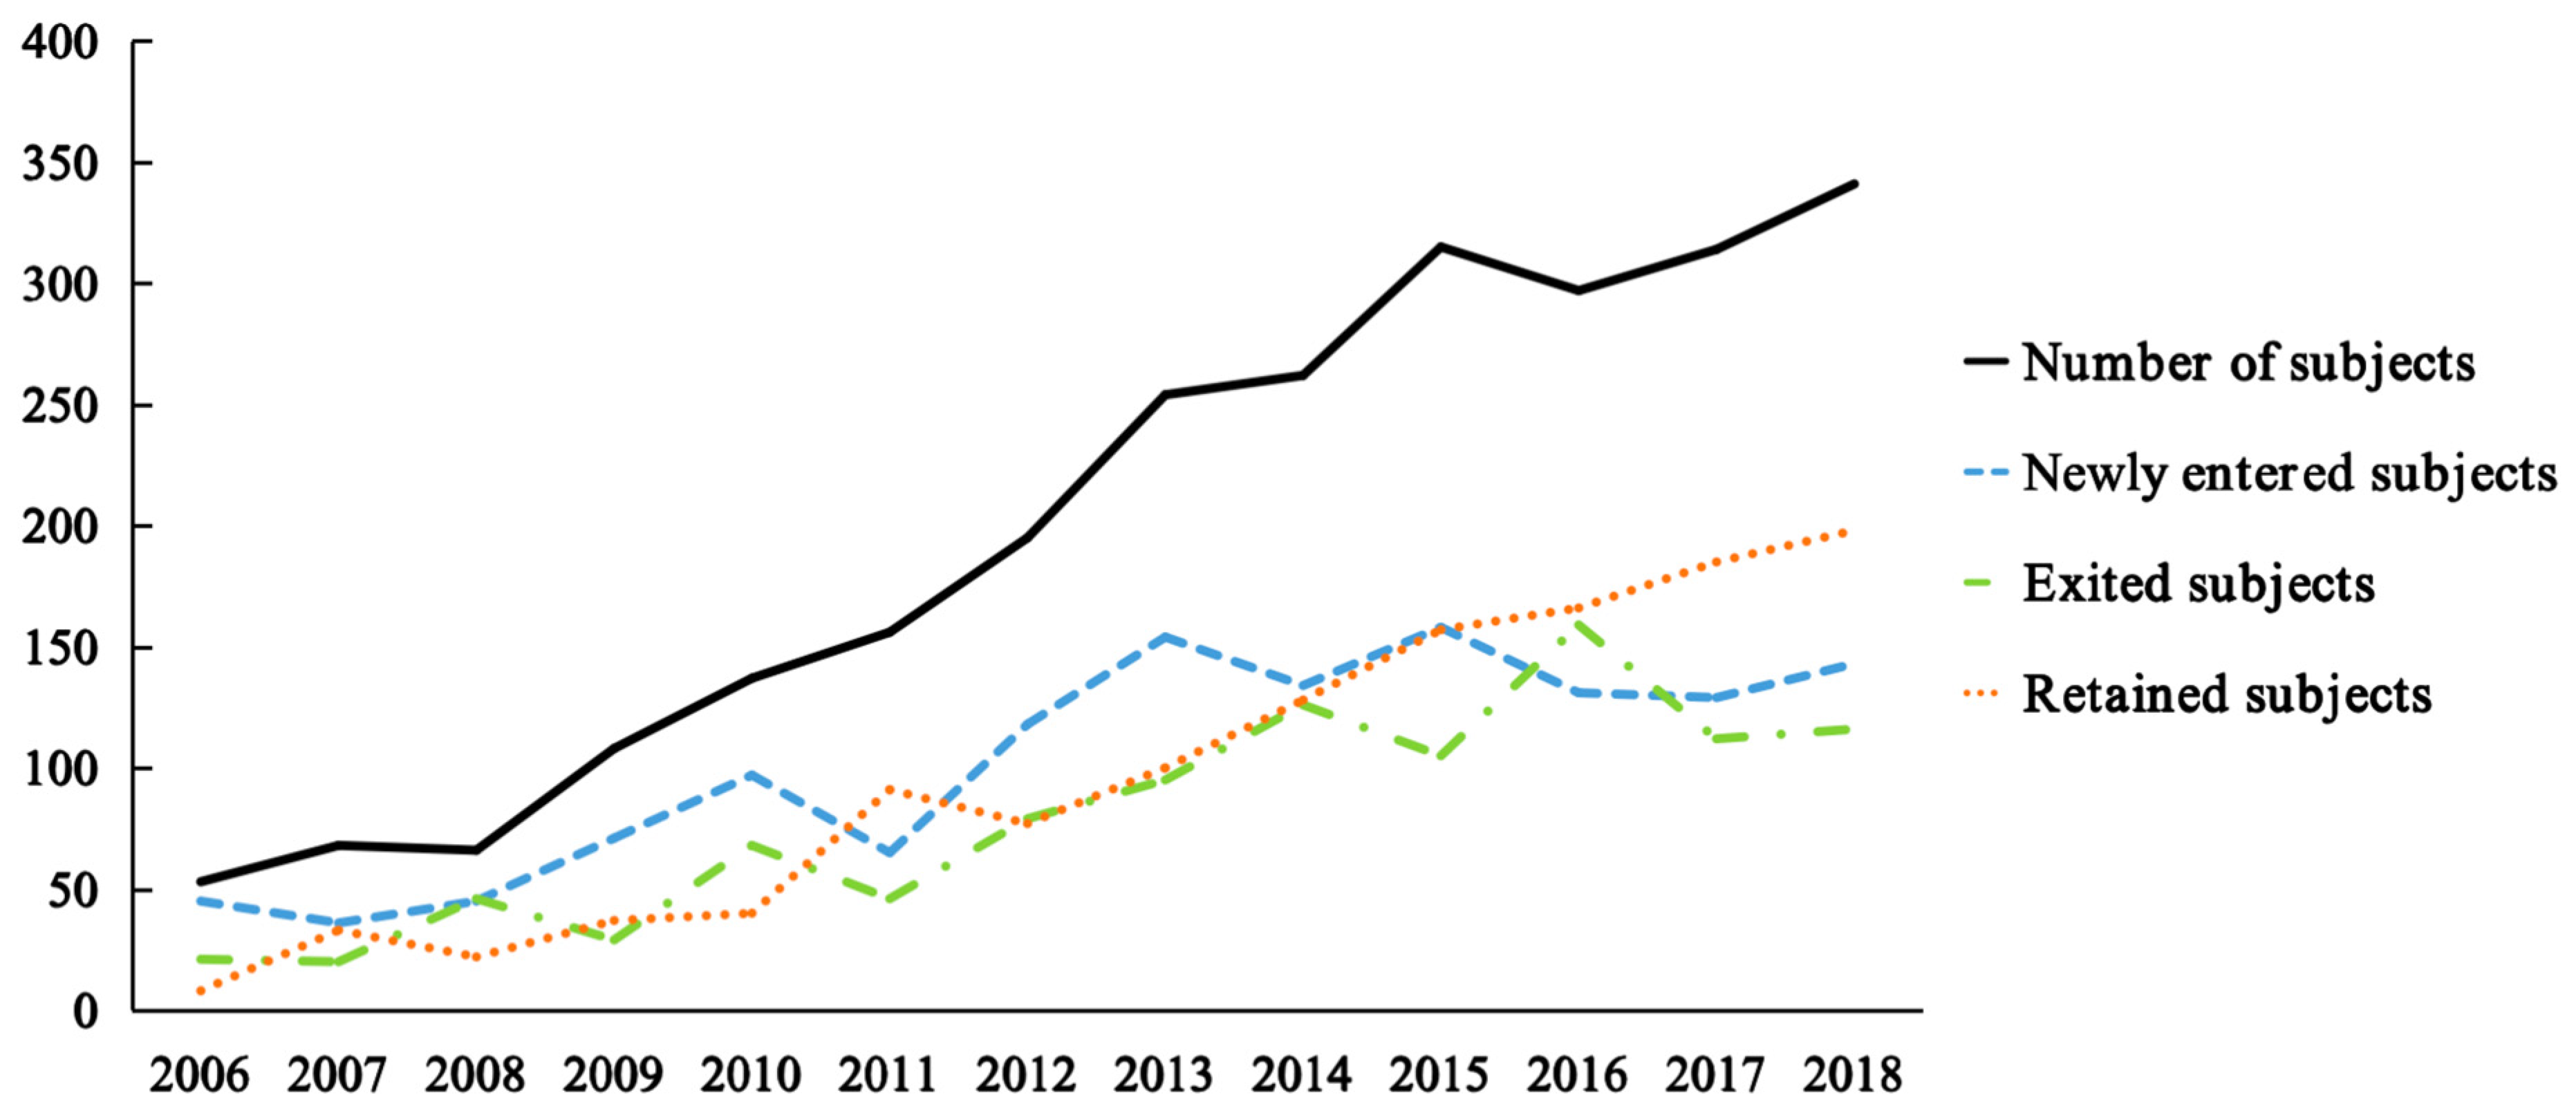
4.1. Structural Evolution of the Cooperative Innovation Network

We used UCINET and R to analyze the structure of the selected cooperative innovation network during 2006–2018. Figure 3 shows the number of newly entered, exited, and retained behavioral subjects. The data reveal a consistent integration of new members into the cooperative innovation network throughout the study period, which contributed to the overall expansion of the network scale. To identify the state of different phases, this study selected several indexes based on the industrial life cycle theory and the research context of this study. These indexes include the quantity of behavioral subjects, entry barrier, exit barrier, and growth rate of output [25,26].
Firstly, the quantity of behavioral subjects was represented by the average of behavioral subjects. As shown in Table 2, the first phase was characterized by a relatively small number of behavioral subjects, with an average of 87 subjects annually. During the second phase, the cooperative innovation network underwent substantial changes, with an average of 237 subjects annually. This indicates a 172.4% increase compared to the first phase. The third phase was characterized by a steady evolution following an average of 317 behavioral subjects annually. This demonstrates a stable 33.8% increase compared to the second phase. The findings also suggest a sharp increase in the average newly entered subjects from the first phase (59) to the second phase (126), followed by a stable trend at the third phase (134). Therefore, the quantity of behavioral subjects experiences a significant increase from the first phase, with fewer subjects, to the second phase. Subsequently, it reaches a maximum value in the third phase. The increase rate initially accelerated sharply before slowing down.
Secondly, the entry barrier refers to the difficulty of a new enterprise entering into a specific industry [135]. The degree of entry barrier can be assessed directly through the results of changes in newly entered subjects. In the context of this study, it was measured by the average annual increase rate of newly entered subjects. The observed higher value represents more newly entered subjects in the subsequent year compared to the previous year, and indicates a lower entry barrier. The results show that in the first phase, the newly entered subjects increased by average 25% in the subsequent year relative to the previous year, indicating a lowest entry barrier. In the second phase, the entry barrier intensified, with a lower average annual increase rate of newly entered subjects (0.17). The entry barrier reached its maximum in the third phase, with the newly entered subjects decreasing by an average of 3% compared to the previous year.
Thirdly, the exit barrier refers to the difficulty encountered by subjects when exiting a specific industry [136]. The degree of exit barrier can be assessed directly through the results of changes in exited subjects. In the context of this study, it was measured by the average annual increase rate of exited subjects. The observed rise in the number of subjects exiting the industry in the subsequent year suggests a more flexible exit option. The higher value implies a lower exit barrier for participants. This study found out that in the first phase, subjects can exit flexibly with an average 56% rise in the subsequent year relative to the previous year. In the second phase, the exited barrier intensifies with a lower average annual increase rate of exited subjects (0.15). The exit barrier reaches its maximum in the third phase, with the exited subjects only increasing by an average of 8% compared to the previous year.
Lastly, in the context of this study, cooperative patents serve as the production outputs. The growth rate of output is measured by the average annual increase rate of cooperative patents. The patent applications during the first phase account for only 4.9%, with a minimum annual average increase rate of 17%. The number of patent applications in the second phase accounts for 32% and also demonstrates a maximum average annual increase rate of 67%. In the third phase, the quantity of patent implications constitutes a substantial proportion of 63.2%, albeit with a comparatively slower average annual increase rate of 20%.
In summary, from the four indexes mentioned above, it is evident that in the first phase, the quantity of behavioral subjects and the growth rate of output are relatively small. However, it has the lowest entry and exit barriers. The second phase exhibits the highest growth rate of output, accompanied by a sharp increase in behavioral subjects, but with an intensified entry and exit barriers. In the third phase, the quantity of behavioral subjects and cooperative patents reaches its maximum, while the growth rate of output remains stable. The barriers to entry and exit are the highest, and there is a noticeable trend of declining newly entered subjects annually.
The existing theory of industrial life cycle has demonstrated the characteristics of these indexes across three development phases. It is argued that the initial phase typically exhibits the lowest number of behavioral subjects, the smallest barriers to entry and exit, and the slowest growth rate of output. The growth phase has the highest rise in the quantity of behavioral subjects and growth rate of output, and increased entry and exit barriers compared to the initial phase. The maturity phase shows the maximum quantity of behavior subjects and entry and exit barriers, but the growth rate of output tends to slow down [26,27]. Therefore, the results of indexes in this study are consistent with the characteristics of industrial development phases derived from the existing theory of industrial life cycle. We identified the state of these three phases as the initial phase (2006–2010), growth phase (2011–2015), and maturity phase (2016–2018).
We can also find support for the identification of the aforementioned three-phase through comparing the average of newly established, dissolved, and sustained cooperative relationships in each phase (See Table 3). In the first phase, the average count of sustained relationships is 256, far more than the average of newly formed relationships (49). This aligns with the characteristics of the initial phase, where cooperation primarily followed a relational-centric mechanism, occurring predominantly within preexisting relationships [137]. The second phase was marked by the highest average number of established and discontinued relationships (254 and 194, respectively), outweighing the average number of sustained relationships (155). This is consistent with the features of the growth phase, when innovative collaborations extended beyond the boundaries of preexisting relationships. Subjects actively sought to forge ties with diverse partners to access a broader range of resources [138]. As the network evolved into the third phase, the proportion of cooperative relationships originating from sustained relationships was 52%, larger than those newly established. The data indicate a similar trend as the maturity phase, with partnerships exhibiting a propensity toward stability [139]. Therefore, the quantity of established and discontinued relationships showed a rapid rise followed by a stable trend. Conversely, the number of sustained relationships exhibited a U-shaped curve of change. These findings align with the existing literature on the evolution of relational ties throughout the life cycle [140].
Table 4 summarizes the evolutionary characteristics of the network structure. It highlights the mean value of average linkages across three phases, which declines from 1.7 to 0.92 before gradually increasing to 1.16. This suggests a shift from the expansion state to one that is gradually approaching stability. Furthermore, the average network density initially exhibits a sharp downward trend, declining from 0.01 to 0.002, before gradually stabilizing at 0.003. The observed decline in density indicates a more loosely coupled network structure. This may imply that the cooperative innovation network progressively evolves from a closed state to an increasingly open one. As the network scale expands, it facilitates collaborations among a diverse set of partners. This transition ultimately culminates in the stabilization of the network.

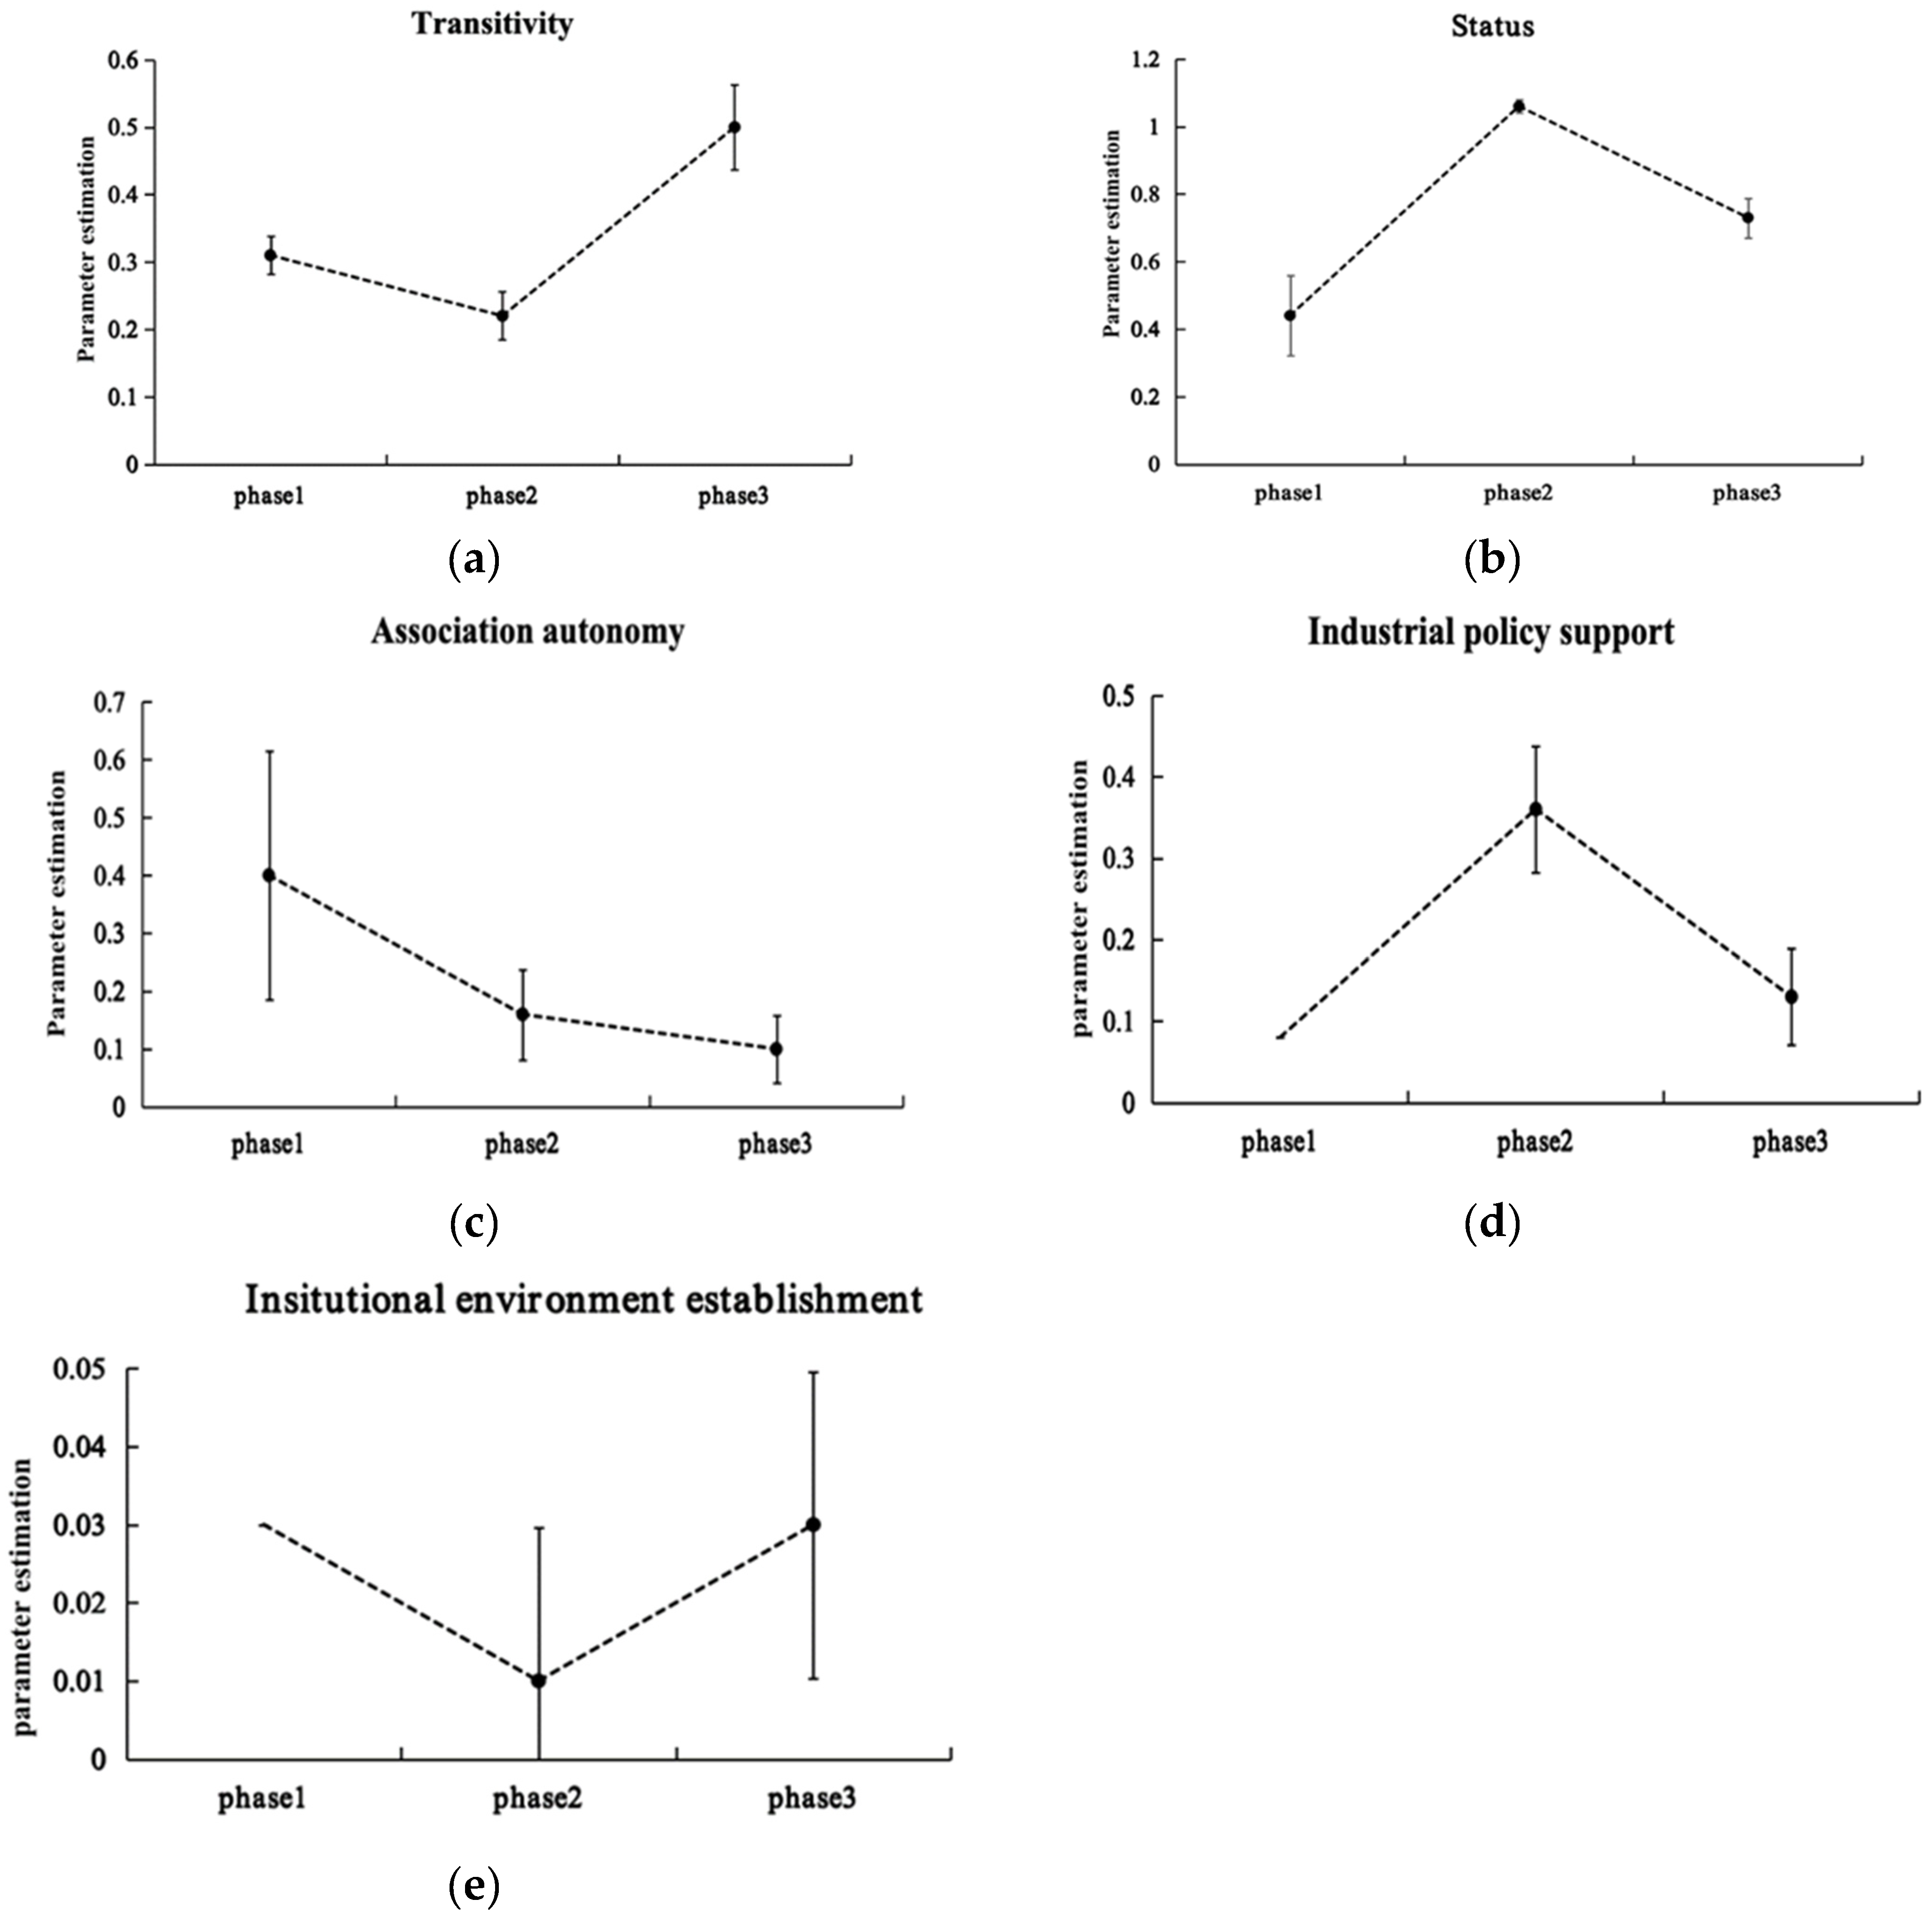
4.2. Examining the Role of Multi-Governance Mechanisms

The descriptive statistics of each variable across three phases are provided in Table 5, excluding those of endogenous effect variables and binary relationship variables such as geographical proximity. It can be observed that there is a difference in the operation tenure among members. Furthermore, the divergence between the minimum and maximum values of the actors’ innovation capability in the second and third phases covers a large range. This indicates that as networks evolve, the heterogeneity of the actors continues to increase.
We employed the RSiena module and selected a unilateral initiative and reciprocal confirmation model to analyze undirected networks. This model characterizes the formation of undirected relationships, wherein actor i endeavors to engage in innovative activities with actor j, aiming to optimize its objective function. A cooperative connection between the two actors is formed when actor j reciprocates the acceptance of the collaboration, contingent on its objective function. Through 1000 iterations of the Markov chain Monte Carlo method, we obtained the parameter estimates for the rate and objective functions within the SAOM. The t-ratios for all variables are close to 0, and the maximum convergence ratios for the models at each phase are consistently below 0.25. These results suggest a satisfactory level of model convergence (see Table 6).
The parameter estimates of the SAOM can be interpreted as non-standardized coefficients obtained through logistic regression analysis [123]. The coefficients, as reported in Table 6, indicate how the change in the log probability of forming a cooperative relationship corresponds to unit changes in the independent variables. Owing to the non-standardization of these coefficients, the magnitude of the parameter estimates is sensitive to the scale of the independent variables, making it impossible to compare the magnitudes of the coefficients of different variables. If the measurement scale of the independent variables does not change over time, the coefficient values of the same variable at different phases can be compared. To test whether the differences between the coefficients of the same variable at different phases are statistically significant, we adopted the method of Balland et al. (2013) [28] to plot the 95% confidence intervals of the coefficients (see Figure 4). If the confidence intervals of the coefficients at different phases overlap, it implies that the effect size of the variable has not changed over time.
As for H1, the results show that transitivity is positively related to the formation of cooperative innovation relationships between network actors (βtrans1 = 0.31, p < 0.01; βtrans2 = 0.22, p < 0.01; βtrans3 = 0.55, p < 0.01). As observed from Figure 4a, the effect of transitivity in the maturity phase is larger relative to the initial and growth phases. However, its influence in the growth phase is slightly reduced compared to the initial phase. Therefore, H1 is partially supported, rather than fully validated.
In line with H2, the effect of network status promotes the formation of cooperative innovation relationships between actors (βstatus1 = 0.44, p < 0.01; βstatus2 = 1.06, p < 0.01; βstatus3 = 0.73, p < 0.01). Moreover, its influence intensifies first and then weakens (see Figure 4b). Further, the results show that association autonomy positively affects the formation of cooperative innovation relationships among network actors (βasso1 = 0.40, p < 0.01; βasso2 = 0.16, p < 0.01; βasso3 = 0.10, p < 0.01). Figure 4c illustrates that the association autonomy coefficients in the three phases show a gradually decreasing trend, but the confidence intervals between the initial phase and growth phase, as well as the growth phase and maturity phase, overlap. This result suggests that in the evolution of networks, the positive effect of association autonomy on cooperation innovation has not changed significantly. Therefore, H3 is not supported.
Next, as shown in Table 6, although in the initial phase, the industrial policy support does not appear to have a significant impact, it does show a positive effect during the growth and maturity phases. The influence of industrial policy support intensifies first and then weakens (βindp1 = 0.08, p > 0.1; βindp2 = 0.36, p < 0.01; βindp3 = 0.13, p < 0.01). Thus, this result supports H4. Moreover, Figure 4e shows that although the confidence intervals for the growth phase and the maturity phase overlap, the coefficient of the initial phase is not significant. This result indicates that the positive effect of institutional environment establishment shows an increasing trend (βine1 = 0.03, p > 0.1; βine2 = 0.02, p < 0.1; βine3 = 0.03, p < 0.01), and thus supports H5.
In addition, among the control variables, geographic proximity is positively related to cooperative innovation (βgep1 = 0.81, p < 0.1; βgep2 = 0.39, p < 0.1; βgep3 = 0.48, p < 0.01), indicating that collaborations often occur between actors at a short geographical distance from each other. The effects of institutional proximity in the growth and maturity phases are negatively related to cooperative innovation (βinp1 = 0.14, p < 0.1; βinp2 = −0.98, p < 0.1; βinp3 = −0.63, p < 0.01). This result demonstrates that as the network evolves, actors are more likely to cooperate with members of different types. For instance, enterprises, universities, and research institutions may cooperate with each other to form an industry–university–research collaboration.

5. Discussion

5.1. Theoretical Implications

The combination of the social network and stakeholder theories underscore the importance of multi-actor involvement in the analysis of governance mechanisms within cooperative innovation networks. The literature has recognized that networked collaborations often exhibit a loosely coupled structure and that the endeavors of enterprises acting alone fall short in fostering sustainable cooperation. These findings highlight the governance effects of informal or social principles, such as trust-building, commitment, and reputation [8,9]. However, the complexity of networked organizations necessitates multiple approaches to governance, which can manage interconnected relationships effectively. In this study, we integrate the governing effects of internal and external factors, that is, endogenous network embeddedness and key stakeholders. Therefore, our analysis model, beyond the dyadic level, offers an in-depth exploration of the mechanisms that coordinate the cooperative innovation relationships among network members. The findings show that the network endogenous mechanisms (i.e., transitivity and status) and the governance mechanisms of external stakeholders (i.e., association autonomy, industrial policy support, and institutional environment establishment) can effectively promote the cooperative innovation between enterprises.
Thus, we have extended the governance theory from the network evolution perspective by exploring how various governance mechanisms affect the formation and change of cooperative innovation network relationships. Prior studies primarily evaluated the impact of governance mechanisms on a network’s static structure. However, given the continuous evolution of networks, the number of network node changes or relationships can be established or dissolved. Dynamic changes in the network structure comprise a complex process that is influenced by various micro-level forces [14]. It remains unclear how such governance mechanisms, particularly those of stakeholders, influence the evolution of cooperative innovation networks. The results of the present study suggest that the governance effects of endogenous network embeddedness and key stakeholders drive the formation or reemergence of ties as collaborative innovation networks continue to change.
This study, which focused on network evolution, has also extended the literature through investigating the evolving trend of the influence exerted by governance mechanisms. Prior studies mainly adopted a static viewpoint, using cross-sectional data to examine the effects of governance mechanisms at a specific point in time. However, according to the industry life cycle theory, as the technologically progressive industries evolve from emergence to maturity phase, the rate of firm entry undergoes a transformation from rapid increase to decline [27]. This results in changes in the quantity of network nodes, the scale of the network, and the reconfigurations of network relationships, subsequently influencing the evolution of network structure [29]. Therefore, all of these conditions are crucial in determining the effectiveness and feasibility of governance mechanisms. Consequently, it is imperative to assess how their impact would change considering the three phases of industrial development. The findings show that as networks evolve, the effect of transitivity on cooperative innovation first slightly decreases and then intensifies. The influence of status and industrial policy support intensifies first and then weakens. The impact of association autonomy remains stable, and institutional environment establishment on cooperative innovation intensifies.

5.2. Managerial Implications

We suggest that the dynamic evolution of cooperative innovation networks necessitates the implementation of governance mechanisms. We emphasize the importance of maintaining existing relationship networks and provide valuable insights for enterprises engaging in collaborative efforts. As the network expands, newly entered members who lack sufficient cooperative ties can seek cooperation with central enterprises. Simultaneously, enterprises should proactively respond to industrial policy support and engage in various activities organized by the government and industry associations. In today’s rapidly shifting global market environment, it is crucial to capitalize on the opportunities provided by stakeholders to establish connections with other members, thereby acquiring mutual benefits. As the network matures, when confronted with the risk of knowledge spillover, enterprises can enhance their cooperation with other members by reinforcing their closed triadic relationships. The presence of mutual partners can stimulate social monitoring effects, thereby facilitating cooperative innovation.
Given the multi-actor characteristic of cooperative innovation networks, we underscore the crucial role of external stakeholders, that is, governments and industry associations, in enabling collaboration. We also offer meaningful insights for these stakeholders, aiming to enhance their collaborative strategies. Industrial associations are encouraged to take an active role in the industrial development process by functioning as a collective organization that identifies and advocates the shared interests of the market. In situations where the connections between members are sparse, it is noteworthy that associations should exert influence through their extensive network of members and serve as a coordinating entity to facilitate cooperative interactions.
Furthermore, we highlight that in the initial and growth phases of cooperative innovation networks, it is necessary for local governments to strategically use industrial policy support to mitigate resource constraints and encourage cooperative interactions among members. As the cooperative network matures, the formulation of industrial policy support requires careful consideration. For enterprises that have developed strong operational capabilities, the focus should move towards fostering autonomous cooperative innovation, rather than merely providing support. At that time, the direct support of local government industrial policies can lead to an excessive dependence of members on external assistance. The government’s industrial policies may have a crowding-out effect on the cooperative innovation motivation of members, which would undermine the sustainable vitality of the network. This might explain why, despite the widespread adoption of industrial policies to foster industrial upgrading, many governments have not achieved the expected outcomes. In addition, local governments should also persistently optimize the institutional environment for sustainable cooperative interactions. In particular, as the cooperative innovation network evolves, it becomes increasingly critical to have a perfect institutional framework for alleviating the risks associated with technological and knowledge spillovers.

5.3. Limitations and Further Research

This study has several limitations, which serve to inform future research directions. Firstly, we illustrated multi-governance mechanisms within the cooperative innovation network. However, we did not investigate the interrelationships between these mechanisms. Thus, future studies may explore the influence of the interplay between a network’s endogenous and stakeholder governance mechanisms. Secondly, the effectiveness of governance mechanisms depends on environmental uncertainty, which we did not consider in this study. Hence, future researchers could explore the influence of environmental factors, such as competitive intensity, on the performance of multi-governance mechanisms. Lastly, we used cooperative patent data from the electronic information industry to test the proposed hypothesis. Due to the long-term process of patent examination, we were unable to collect data on joint applications for patents after 2018, particularly those within the scope of the maturity phase (2019 and 2020). This period also contained the final two years of the 13th Five-Year Plan. Future research could supplement these data and concurrently gather joint applications for patents from other industries to validate the conclusions of this study.

Author Contributions

Conceptualization, methodology, data curation, analysis, writing, J.W.; conceptualization, resources, Q.X.; editing and supervision, X.G. All authors have read and agreed to the published version of the manuscript.

Funding

This work was supported by the General Project of Philosophy and Social Science Research in Colleges and Universities in Jiangsu Province [grant number 2023SJYB1267].

Institutional Review Board Statement

Not applicable.

Informed Consent Statement

Not applicable.

Data Availability Statement

The data presented in this study are available on request from the corresponding author.

Conflicts of Interest

The authors declare no conflicts of interest.

References

  1. Wang, C.; Hu, Q. Knowledge Sharing in Supply Chain Networks: Effects of Collaborative Innovation Activities and Capability on Innovation Performance. Technovation 2020, 94–95, 102010. [Google Scholar] [CrossRef]
  2. Singh, R.; Chandrashekar, D.; Subrahmanya Mungila Hillemane, B.; Sukumar, A.; Jafari-Sadeghi, V. Network Cooperation and Economic Performance of SMEs: Direct and Mediating Impacts of Innovation and Internationalisation. J. Bus. Res. 2022, 148, 116–130. [Google Scholar] [CrossRef]
  3. Felzensztein, C.; Gimmon, E.; Deans, K.R. Coopetition in Regional Clusters: Keep Calm and Expect Unexpected Changes. Ind. Mark. Manag. 2018, 69, 116–124. [Google Scholar] [CrossRef]
  4. Gereffi, G.; Lee, J. Economic and Social Upgrading in Global Value Chains and Industrial Clusters: Why Governance Matters. J. Bus. Ethics 2016, 133, 25–38. [Google Scholar] [CrossRef]
  5. Reuer, J.J.; Zollo, M. Termination Outcomes of Research Alliances. Res. Policy 2005, 34, 101–115. [Google Scholar] [CrossRef]
  6. Dhanaraj, C.; Parkhe, A. Orchestrating Innovation Networks. Acad. Manag. Rev. 2006, 31, 659–669. [Google Scholar] [CrossRef]
  7. Xie, X.; Liu, X.; Chen, J. A Meta-Analysis of the Relationship between Collaborative Innovation and Innovation Performance: The Role of Formal and Informal Institutions. Technovation 2023, 124, 102740. [Google Scholar] [CrossRef]
  8. Jones, C.; Hesterly, W.S.; Borgatti, S.P. A General Theory of Network Governance: Exchange Conditions and Social. Acad. Manag. J. 1997, 22, 911–945. [Google Scholar] [CrossRef]
  9. Lin, H.M. The Dynamic Evolution and Technological Diffusion in Taiwan’s TFT-LCD Industrial Cluster: A Network Perspective. Technol. Anal. Strateg. Manag. 2012, 24, 435–451. [Google Scholar] [CrossRef]
  10. Wang, L.; Yeung, J.H.Y.; Zhang, M. The Impact of Trust and Contract on Innovation Performance: The Moderating Role of Environmental Uncertainty. Int. J. Prod. Econ. 2011, 134, 114–122. [Google Scholar] [CrossRef]
  11. Bouncken, R.B.; Clauß, T.; Fredrich, V. Product Innovation through Coopetition in Alliances: Singular or Plural Governance? Ind. Mark. Manag. 2016, 53, 77–90. [Google Scholar] [CrossRef]
  12. Rowley, T.J. Moving beyond Dyadic Ties: A Network Theory of Stakeholder Influences. Acad. Manag. Rev. 1997, 22, 887–910. [Google Scholar] [CrossRef]
  13. Leite, E. Innovation Networks for Social Impact: An Empirical Study on Multi-Actor Collaboration in Projects for Smart Cities. J. Bus. Res. 2022, 139, 325–337. [Google Scholar] [CrossRef]
  14. Owen-Smith, J.; Powell, W.W. Knowledge Networks as Channels and Conduits: The Effects of Spillovers in the Boston Biotechnology Community. Organ. Sci. 2004, 15, 5–21. [Google Scholar] [CrossRef]
  15. Glückler, J. Economic Geography and the Evolution of Networks. J. Econ. Geogr. 2007, 7, 619–634. [Google Scholar] [CrossRef]
  16. Rosenkopf, L.; Padula, G. Investigating the Microstructure of Network Evolution : Alliance Formation in the Mobile. Organ. Sci. 2008, 19, 669–687. [Google Scholar] [CrossRef]
  17. Abbey, P.; Tomlinson, P.R.; Branston, J.R. Perceptions of Governance and Social Capital in Ghana’s Cocoa Industry. J. Rural. Stud. 2016, 44, 153–163. [Google Scholar] [CrossRef]
  18. Bello, D.C.; Katsikeas, C.S.; Robson, M.J. Does Accommodating a Self-Serving Partner in an International Marketing Alliance Pay Off? J. Mark. 2010, 74, 77–93. [Google Scholar] [CrossRef]
  19. Liu, R.; Weng, Q.; Mao, G.; Huang, T. Industrial Cluster, Government Agency and Entrepreneurial Development: A Case Study of Wenzhou City, Zhejiang Province. Chin. Manag. Stud. 2013, 7, 253–280. [Google Scholar] [CrossRef]
  20. Nishimura, J.; Okamuro, H. Subsidy and Networking: The Effects of Direct and Indirect Support Programs of the Cluster Policy. Res. Policy 2011, 40, 714–727. [Google Scholar] [CrossRef]
  21. Ahuja, G.; Soda, G.; Zaheer, A. The Genesis and Dynamics of Organizational Networks. Organ. Sci. 2012, 23, 434–448. [Google Scholar] [CrossRef]
  22. Murray, J.Y.; Kotabe, M. Performance Implications of Strategic Fit between Alliance Attributes and Alliance Forms. J. Bus. Res. 2005, 58, 1525–1533. [Google Scholar] [CrossRef]
  23. Paswan, A.K.; Hirunyawipada, T.; Iyer, P. Opportunism, Governance Structure and Relational Norms: An Interactive Perspective. J. Bus. Res. 2017, 77, 131–139. [Google Scholar] [CrossRef]
  24. Zhang, C.; Li, J.J.; Huang, Y. Sustaining Relationships after Opportunism and Misunderstanding: The Role of Formalization and Socialization. Mark. Lett. 2017, 28, 305–319. [Google Scholar] [CrossRef]
  25. Williamson, O.E. Markets and Hierarchies: Analysis and Antitrust Implications; The Free Press: New York, NY, USA, 1975. [Google Scholar]
  26. Klepper, S. Entry, Exit, Growth, and Innovation over the Product Life Cycle. Am. Econ. Rev. 1996, 86, 562–583. [Google Scholar]
  27. Peltoniemi, M. Reviewing Industry Life-Cycle Theory: Avenues for Future Research. Int. J. Manag. Rev. 2011, 13, 349–375. [Google Scholar] [CrossRef]
  28. Balland, P.A.; De Vaan, M.; Boschma, R. The Dynamics of Interfirm Networks along the Industry Life Cycle: The Case of the Global Video Game Industry, 1987–2007. J. Econ. Geogr. 2013, 13, 741–765. [Google Scholar] [CrossRef]
  29. Dagnino, G.B.; Levanti, G.; Mocciaro Li Destri, A. Structural Dynamics and Intentional Governance in Strategic Interorganizational Network Evolution: A Multilevel Approach. Organ. Stud. 2016, 37, 349–373. [Google Scholar] [CrossRef]
  30. Balland, P.A.; Belso-Martínez, J.A.; Morrison, A. The Dynamics of Technical and Business Knowledge Networks in Industrial Clusters: Embeddedness, Status, or Proximity? Econ. Geogr. 2016, 92, 35–60. [Google Scholar] [CrossRef]
  31. Lin, H.M.; Huang, H.C.; Lin, C.P.; Hsu, W.C. How to Manage Strategic Alliances in OEM-Based Industrial Clusters: Network Embeddedness and Formal Governance Mechanisms. Ind. Mark. Manag. 2012, 41, 449–459. [Google Scholar] [CrossRef]
  32. Polidoro, F.; Ahuja, G.; Mitchell, W. When the Social Structure Overshadows Competitive Incentives: The Effects of Network Embeddedness on Joint Venture Dissolution. Acad. Manag. J. 2016, 4, 64–75. [Google Scholar] [CrossRef]
  33. DiMaggio, P.J.; Powell, W.W. The Iron Cage Revisited: Institutional Isomorphism and Collective Rationality in Organizational Fields. Am. Sociol. Rev. 1983, 48, 147. [Google Scholar] [CrossRef]
  34. McDermott, G.A.; Corredoira, R.A.; Kruse, G. Public-Private Institutions as Catalysts of Upgrading in Emerging Market Societies. Acad. Manag. J. 2009, 52, 1270–1296. [Google Scholar] [CrossRef]
  35. Perez-Aleman, P. Collective Learning in Global Diffusion: Spreading Quality Standards in a Developing Country Cluster. Organ. Sci. 2011, 22, 173–189. [Google Scholar] [CrossRef]
  36. Giuliani, E.; Balland, P.A.; Matta, A. Straining but Not Thriving: Understanding Network Dynamics in Underperforming Industrial Clusters. J. Econ. Geogr. 2019, 19, 147–172. [Google Scholar] [CrossRef]
  37. Boschma, R.; Frenken, K. The Emerging Empirics of Evolutionary Economic Geography. J. Econ. Geogr. 2011, 11, 295–307. [Google Scholar] [CrossRef]
  38. Rivera, M.T.; Soderstrom, S.B.; Uzzi, B. Dynamics of Dyads in Social Networks: Assortative, Relational, and Proximity Mechanisms. Annu. Rev. Sociol. 2010, 36, 91–115. [Google Scholar] [CrossRef]
  39. Broekel, T.; Boschma, R. Knowledge Networks in the Dutch Aviation Industry: The Proximity Paradox. J. Econ. Geogr. 2012, 12, 409–433. [Google Scholar] [CrossRef]
  40. Lazzeretti, L.; Capone, F. How Proximity Matters in Innovation Networks Dynamics along the Cluster Evolution. A Study of the High Technology Applied to Cultural Goods. J. Bus. Res. 2016, 69, 5855–5865. [Google Scholar] [CrossRef]
  41. Balland, P.A. Proximity and the Evolution of Collaboration Networks: Evidence from Research and Development Projects within the Global Navigation Satellite System (GNSS) Industry. Reg. Stud. 2012, 46, 741–756. [Google Scholar] [CrossRef]
  42. Gulati, R.; Gargiulo, M. Where Do Interorganizational Networks Come From? Am. J. Sociol. 1999, 104, 1439–1493. [Google Scholar] [CrossRef]
  43. Orsenigo, L. The (Failed) Development of a Biotechnology Cluster. Small Bus. Econ. 2001, 17, 77–92. [Google Scholar] [CrossRef]
  44. Giuliani, E. Network Dynamics in Regional Clusters: Evidence from Chile. Res. Policy 2013, 42, 1406–1419. [Google Scholar] [CrossRef]
  45. Thorgren, S.; Wincent, J.; Örtqvist, D. Designing Interorganizational Networks for Innovation: An Empirical Examination of Network Configuration, Formation and Governance. J. Eng. Technol. Manag. 2009, 26, 148–166. [Google Scholar] [CrossRef]
  46. Sun, Y.; Wang, T.; Gu, X. A Sustainable Development Perspective on Cooperative Culture, Knowledge Flow, and Innovation Network Governance Performance. Sustainability 2019, 11, 58–70. [Google Scholar] [CrossRef]
  47. Cropanzano, R.; Mitchell, M.S. Social Exchange Theory: An Interdisciplinary Review. J. Manag. 2005, 31, 874–900. [Google Scholar] [CrossRef]
  48. Mesquita, L.F. Starting over When the Bickering Never Ends: Rebuilding Aggregate Trust among Clustered Firms through Trust Facilitators. Acad. Manag. Rev. 2007, 32, 72–91. [Google Scholar] [CrossRef]
  49. Ooms, W.; Ebbekink, M. In Search of the Sweet Spot: The Role of Personal Proximity in Three Dutch Clusters. J. Bus. Res. 2018, 92, 48–60. [Google Scholar] [CrossRef]
  50. Klijn, E.; Koppenjan, J.F.M. Public Management and Policy Networks : The Theoretical Foundation of the Network Approach to Governance. Public Manag. Rev. 2000, 2, 135–158. [Google Scholar] [CrossRef]
  51. Cassanego Júnior, P.V.; Boaventura, J.M.G.; Azevedo, A.C.; Telles, R. Governance in Business Clusters: Proposal for an Application of an Analytical Model. Entrep. Reg. Dev. 2019, 31, 984–1010. [Google Scholar] [CrossRef]
  52. Wang, H.; Ran, B. Network Governance and Collaborative Governance: A Thematic Analysis on Their Similarities, Differences, and Entanglements. Public Manag. Rev. 2021, 25, 1187–1211. [Google Scholar] [CrossRef]
  53. Arikan, A.T.; Schilling, M.A. Structure and Governance in Industrial Districts: Implications for Competitive Advantage. J. Manag. Stud. 2011, 48, 772–803. [Google Scholar] [CrossRef]
  54. Loureiro, S.M.C.; Romero, J.; Bilro, R.G. Stakeholder Engagement in Co-Creation Processes for Innovation: A Systematic Literature Review and Case Study. J. Bus. Res. 2020, 119, 388–409. [Google Scholar] [CrossRef]
  55. Aarikka-Stenroos, L.; Sandberg, B.; Lehtimäki, T. Networks for the Commercialization of Innovations: A Review of How Divergent Network Actors Contribute. Ind. Mark. Manag. 2014, 43, 365–381. [Google Scholar] [CrossRef]
  56. North, D.C. Institutions, Institutional Change and Economic Performance; Cambridge University Press: Cambridge, UK, 1990. [Google Scholar]
  57. Porter, M.E. The Competitive Advantage of Nations. Harv. Bus. Rev. 1990, 68, 73–93. [Google Scholar]
  58. Lai, Y.L.; Hsu, M.S.; Lin, F.J.; Chen, Y.M.; Lin, Y.H. The Effects of Industry Cluster Knowledge Management on Innovation Performance. J. Bus. Res. 2014, 67, 734–739. [Google Scholar] [CrossRef]
  59. Lawton, T.; Mcguire, S.; Rajwani, T. Corporate Political Activity: A Literature Review and Research Agenda. Int. J. Manag. Rev. 2013, 15, 86–105. [Google Scholar] [CrossRef]
  60. Lux, S.; Crook, T.R.; Woehr, D.J. Mixing Business with Politics: A Meta-Analysis of the Antecedents and Outcomes of Corporate Political Activity. J. Manag. 2011, 37, 223–247. [Google Scholar] [CrossRef]
  61. Kano, L. Global Value Chain Governance: A Relational Perspective. J. Int. Bus. Stud. 2018, 49, 659–683. [Google Scholar] [CrossRef]
  62. Albino, V.; Carbonara, N.; Giannoccaro, I. Supply Chain Cooperation in Industrial Districts: A Simulation Analysis. Eur. J. Oper. Res. 2007, 177, 261–280. [Google Scholar] [CrossRef]
  63. Ingstrup, M.B.; Damgaard, T. Cluster Facilitation from a Cluster Life Cycle Perspective. Eur. Plan. Stud. 2013, 21, 556–574. [Google Scholar] [CrossRef]
  64. Granovetter, M. Economic Action and Social Structure: The Problem of Embeddedness. Am. J. Sociol. 1985, 91, 481–510. [Google Scholar] [CrossRef]
  65. Coleman, J.S. Social Capital in the Creation of Human Capital. Am. J. Socilogy 1988, 94, 95–120. [Google Scholar] [CrossRef]
  66. Giuliani, E. The Selective Nature of Knowledge Networks in Clusters: Evidence from the Wine Industry. J. Econ. Geogr. 2007, 7, 139–168. [Google Scholar] [CrossRef]
  67. Ter Wal, A.L.J. Cluster Emergence and Network Evolution: A Longitudinal Analysis of the Inventor Network in Sophia Antipolis. Reg. Stud. 2011, 47, 651–668. [Google Scholar] [CrossRef]
  68. Holland, P.W.; Leinhardt, S. Transitivity in Structural Models of Small Groups. Comp. Group Stud. 1971, 2, 107–124. [Google Scholar] [CrossRef]
  69. Uzzi, B. Social Structure and Competition in Interfirm Networks: The Paradox of Embeddedness. Adm. Sci. Q. 1997, 42, 35–67. [Google Scholar] [CrossRef]
  70. Cowan, R.; Jonard, N.; Zimmermann, J.-B. Evolving Networks of Inventors Evolving Networks of Inventors. J. Evol. Econ. 2006, 16, 155–174. [Google Scholar] [CrossRef]
  71. McEvily, B.; Perrone, V.; Zaheer, A. Trust as an Organizing Principle. Organ. Sci. 2003, 14, 91–103. [Google Scholar] [CrossRef]
  72. Zaheer, A.; Bell, G.G. Benefiting from Network Position: Firm Capabilities, Structural Holes, and Performance. Strateg. Manag. J. 2005, 26, 809–825. [Google Scholar] [CrossRef]
  73. Menzel, M.P.; Feldman, M.P.; Broekel, T. Institutional Change and Network Evolution: Explorative and Exploitative Tie Formations of Co-Inventors during the Dot-Com Bubble in the Research Triangle Region. Reg. Stud. 2017, 51, 1179–1191. [Google Scholar] [CrossRef]
  74. Håkansson, H.; Snehota, I. Developing Relationships in Business Networks; Routledge: London, UK, 1995. [Google Scholar]
  75. Guo, C.; Miller, J.K. Guanxi Dynamics and Entrepreneurial Firm Creation and Development in China. Manag. Organ. Rev. 2010, 6, 267–291. [Google Scholar] [CrossRef]
  76. Rindfleisch, A.; Moorman, C. The Acquisition and Utilization of Information in New Product Alliances: A Strength-of-Ties Perspective. J. Mark. 2001, 65, 1–18. [Google Scholar] [CrossRef]
  77. Vilana, J.R.; Rodríguez-Monroy, C. Influence of Cultural Mechanisms on Horizontal Inter-Firm Collaborations. J. Ind. Eng. Manag. 2010, 3, 138–175. [Google Scholar] [CrossRef]
  78. Balliet, D.; Van Lange, P.A.M. Trust, Conflict, and Cooperation: A Meta-Analysis. Psychol. Bull. 2013, 139, 1090–1112. [Google Scholar] [CrossRef] [PubMed]
  79. Luo, Y. An Integrated Anti-Opportunism System in International Exchange. J. Int. Bus. Stud. 2007, 38, 855–877. [Google Scholar] [CrossRef]
  80. Ali, T.; Larimo, J. Managing Opportunism in International Joint Ventures: The Role of Structural and Social Mechanisms. Scand. J. Manag. 2016, 32, 86–96. [Google Scholar] [CrossRef]
  81. Hervas-Oliver, J.L.; Albors-Garrigos, J. Are Technology Gatekeepers Renewing Clusters? Understanding Gatekeepers and Their Dynamics across Cluster Life Cycles. Entrep. Reg. Dev. 2014, 26, 431–452. [Google Scholar] [CrossRef]
  82. Fang, S.C.; Yang, C.W.; Hsu, W.Y. Inter-Organizational Knowledge Transfer: The Perspective of Knowledge Governance. J. Knowl. Manag. 2013, 17, 943–957. [Google Scholar] [CrossRef]
  83. Gooderham, P.; Minbaeva, D.B.; Pedersen, T. Governance Mechanisms for the Promotion of Social Capital for Knowledge Transfer in Multinational Corporations. J. Manag. Stud. 2011, 48, 123–150. [Google Scholar] [CrossRef]
  84. Shipilov, A.V.; Li, S.X. The Missing Link: The Effect of Customers on the Formation of Relationships among Producers in the Multiplex Triads. Organ. Sci. 2012, 23, 472–491. [Google Scholar] [CrossRef]
  85. Lazega, E.; Mounier, L.; Snijders, T.; Tubaro, P. Norms, Status and the Dynamics of Advice Networks: A Case Study. Soc. Netw. 2012, 34, 323–332. [Google Scholar] [CrossRef]
  86. Ramirez, M.; Clarke, I.; Klerkx, L. Analysing Intermediary Organisations and Their Influence on Upgrading in Emerging Agricultural Clusters. Environ. Plan. A Econ. Space 2018, 50, 1314–1335. [Google Scholar] [CrossRef]
  87. Ye, D.; Wu, Y.J.; Goh, M. Hub Firm Transformation and Industry Cluster Upgrading: Innovation Network Perspective. Manag. Decis. 2020, 58, 1425–1448. [Google Scholar] [CrossRef]
  88. Anokhin, S.; Wincent, J.; Parida, V.; Chistyakova, N.; Oghazi, P. Industrial Clusters, Flagship Enterprises and Regional Innovation. Entrep. Reg. Dev. 2019, 31, 104–118. [Google Scholar] [CrossRef]
  89. Gould, R.V.; Bearman, P. The Origins of Status Hierarchies: A Formal Theory and Empirical Test. Am. J. Sociol. 2002, 107, 1143–1178. [Google Scholar] [CrossRef]
  90. Lunnan, R.; McGaughey, S.L. Orchestrating International Production Networks When Formal Authority Shifts. J. World Bus. 2019, 54, 101000. [Google Scholar] [CrossRef]
  91. Sonderegger, P.; Täube, F. Cluster Life Cycle and Diaspora Effects: Evidence from the Indian IT Cluster in Bangalore. J. Int. Manag. 2010, 16, 383–397. [Google Scholar] [CrossRef]
  92. Sacchetti, S.; Tomlinson, P.R. Economic Governance and the Evolution of Industrial Districts under Globalization: The Case of Two Mature European Industrial Districts. Eur. Plan. Stud. 2009, 17, 1837–1859. [Google Scholar] [CrossRef]
  93. Wei, J.; Zhou, M.; Greeven, M.; Qu, H. Economic Governance, Dual Networks and Innovative Learning in Five Chinese Industrial Clusters. Asia Pac. J. Manag. 2016, 33, 1037–1074. [Google Scholar] [CrossRef]
  94. Kumar, M.; Pullman, M.; Bouzdine-Chameeva, T.; Sanchez Rodrigues, V. The Role of the Hub-Firm in Developing Innovation Capabilities: Considering the French Wine Industry Cluster from a Resource Orchestration Lens. Int. J. Oper. Prod. Manag. 2022, 42, 526–551. [Google Scholar] [CrossRef]
  95. Berisha, E.; Cotella, G.; Janin Rivolin, U.; Solly, A. Spatial Governance and Planning Systems in the Public Control of Spatial Development: A European Typology. Eur. Plan. Stud. 2021, 29, 181–200. [Google Scholar] [CrossRef]
  96. Santos, F.M.; Eisenhardt, K.M. Constructing Markets and Shaping Boundaries: Entrepreneurial Power in Nascent Fields. Acad. Manag. J. 2009, 52, 643–671. [Google Scholar] [CrossRef]
  97. Sine, W.D.; Haveman, H.A.; Tolbert, P.S. Risky Business? Entrepreneurship in the New Independent Power Sector. Adm. Sci. Q. 2005, 50, 200–232. [Google Scholar] [CrossRef]
  98. Humphreys, A.; Carpenter, G.S. Status Games: Market Driving through Social Influence in the U.S. Wine Industry. J. Mark. 2018, 82, 141–159. [Google Scholar] [CrossRef]
  99. Maciel, A.F.; Fischer, E. Collaborative Market Driving: How Peer Firms Can Develop Markets Through Collective Action. J. Mark. 2020, 84, 41–59. [Google Scholar] [CrossRef]
  100. Caner, T.; Cohen, S.K.; Pil, F. Firm Heterogeneity in Complex Problem Solving: A Knowledge-Based Look at Invention. Strateg. Manag. J. 2017, 38, 1791–1811. [Google Scholar] [CrossRef]
  101. Nair, S.; Nisar, A.; Palacios, M.; Ruiz, F. Impact of Knowledge Brokering on Performance Heterogeneity among Business Models. Manag. Decis. 2012, 50, 1649–1660. [Google Scholar] [CrossRef]
  102. Hoffmann, V.E.; Lopes, G.S.C.; Medeiros, J.J. Knowledge Transfer among the Small Businesses of a Brazilian Cluster. J. Bus. Res. 2014, 67, 856–864. [Google Scholar] [CrossRef]
  103. Hu, Q.; Chan, S.F.; Zhang, G.; Yang, Z. The Joint-Liability Mechanism: Controlling Opportunism through Peer Monitoring among Chinese Supplier Groups. J. Bus. Ind. Mark. 2016, 31, 640–653. [Google Scholar] [CrossRef]
  104. Kang, K.N.; Park, H. Influence of Government R&D Support and Inter-Firm Collaborations on Innovation in Korean Biotechnology SMEs. Technovation 2012, 32, 68–78. [Google Scholar] [CrossRef]
  105. Dahan, N.M.; Doh, J.P.; Raelin, J.D. Pivoting the Role of Government in the Business and Society Interface: A Stakeholder Perspective. J. Bus. Ethics 2015, 131, 665–680. [Google Scholar] [CrossRef]
  106. Feldman, M.P.; Kelley, M.R. The Ex Ante Assessment of Knowledge Spillovers: Government R&D Policy, Economic Incentives and Private Firm Behavior. Res. Policy 2006, 35, 1509–1521. [Google Scholar] [CrossRef]
  107. Cheng, B.; Christensen, T.; Ma, L.; Yu, J. Does Public Money Drive out Private? Evidence from Government Regulations of Industrial Overcapacity Governance in Urban China. Int. Rev. Econ. Financ. 2021, 76, 767–780. [Google Scholar] [CrossRef]
  108. Halkier, H. Knowledge Dynamics and Policies for Regional Development: Towards a New Governance Paradigm. Eur. Plan. Stud. 2012, 20, 1767–1784. [Google Scholar] [CrossRef]
  109. Hsieh-Sheng, C. The Relationship between Technology Industrial Cluster and Innovation in Taiwan. Asia Pac. Manag. Rev. 2011, 16, 277–288. [Google Scholar] [CrossRef]
  110. Leckel, A.; Veilleux, S.; Dana, L.P. Local Open Innovation: A Means for Public Policy to Increase Collaboration for Innovation in SMEs. Technol. Forecast. Soc. Chang. 2020, 153, 119891. [Google Scholar] [CrossRef]
  111. Getahun, T.D.; Villanger, E. Active Private Sector Development Policies Revisited: Impacts of the Ethiopian Industrial Cluster Policy. J. Dev. Stud. 2019, 55, 1548–1564. [Google Scholar] [CrossRef]
  112. Wang, J.J.; Li, J.J.; Chang, J. Product Co-Development in an Emerging Market: The Role of Buyer-Supplier Compatibility and Institutional Environment. J. Oper. Manag. 2016, 46, 69–83. [Google Scholar] [CrossRef]
  113. Vargo, S.L.; Akaka, M.A.; Wieland, H. Rethinking the Process of Diffusion in Innovation: A Service-Ecosystems and Institutional Perspective. J. Bus. Res. 2020, 116, 526–534. [Google Scholar] [CrossRef]
  114. De Clercq, D.; Danis, W.M.; Dakhli, M. The Moderating Effect of Institutional Context on the Relationship between Associational Activity and New Business Activity in Emerging Economies. Int. Bus. Rev. 2010, 19, 85–101. [Google Scholar] [CrossRef]
  115. Scuotto, V.; Beatrice, O.; Valentina, C.; Nicotra, M.; Di Gioia, L.; Farina Briamonte, M. Uncovering the Micro-Foundations of Knowledge Sharing in Open Innovation Partnerships: An Intention-Based Perspective of Technology Transfer. Technol. Forecast. Soc. Chang. 2020, 152, 119906. [Google Scholar] [CrossRef]
  116. Meyer, K.E.; Estrin, S.; Bhaumik, S.K.; Peng, M.W. Institutions, Resources, and Entry Strategies in Emerging Economies. Strateg. Manag. J. 2009, 30, 61–80. [Google Scholar] [CrossRef]
  117. Fan, J.P.H.; Huang, J.; Morck, R.; Yeung, B. Institutional Determinants of Vertical Integration in China. J. Corp. Financ. 2017, 44, 524–539. [Google Scholar] [CrossRef]
  118. Bai, X.; Sheng, S.; Li, J.J. Contract Governance and Buyer-Supplier Conflict: The Moderating Role of Institutions. J. Oper. Manag. 2016, 41, 12–24. [Google Scholar] [CrossRef]
  119. Zhou, K.Z.; Zhang, Q.; Sheng, S.; Xie, E.; Bao, Y. Are Relational Ties Always Good for Knowledge Acquisition? Buyer-Supplier Exchanges in China. J. Oper. Manag. 2014, 32, 88–98. [Google Scholar] [CrossRef]
  120. Barbieri, E.; Di Tommaso, M.R.; Pollio, C.; Rubini, L. Getting the Specialization Right. Industrialization in Southern China in a Sustainable Development Perspective. World Dev. 2020, 126, 104701. [Google Scholar] [CrossRef]
  121. Kim, C.; Song, J. Creating new technology through alliances: An empirical investigation of joint patents. Technovation 2007, 27, 461–470. [Google Scholar] [CrossRef]
  122. Snijders, T.A.B. The Statistical Evaluation of Social Network Dynamics. Sociol. Methodol. 2001, 31, 361–395. [Google Scholar] [CrossRef]
  123. Steglich, C.; Snijders, T.A.B.; Pearson, M. Dynamic Networks and Behavior: Separating Selection from Influence. Sociol. Methodol. 2010, 40, 329–393. [Google Scholar] [CrossRef]
  124. Snijders, T.A.B.; van de Bunt, G.G.; Steglich, C.E.G. Introduction to Stochastic Actor-Based Models for Network Dynamics. Soc. Netw. 2010, 32, 44–60. [Google Scholar] [CrossRef]
  125. Bosch-Sijtsema, P.M.; Postma, T.J.B.M. Cooperative innovation projects: Capabilities and governance mechanisms. J. Prod. Innov. Manag. 2009, 26, 58–70. [Google Scholar] [CrossRef]
  126. Wu, Y.; Zhu, X.; Groenewold, N. The Determinants and Effectiveness of Industrial Policy in China: A Study Based on Five-Year Plans. China Econ. Rev. 2019, 53, 225–242. [Google Scholar] [CrossRef]
  127. Wu, H.; Xu, L.; Ren, S.; Hao, Y.; Yan, G. How Do Energy Consumption and Environmental Regulation Affect Carbon Emissions in China? New Evidence from a Dynamic Threshold Panel Model. Resour. Policy 2020, 67, 101678. [Google Scholar] [CrossRef]
  128. Boschma, R.A. Proximity and Innovation: A Critical Assessment. Reg. Stud. 2005, 39, 61–74. [Google Scholar] [CrossRef]
  129. McPherson, M.; Smith-Lovin, L.; James, M. Birds of a Feather: Homophily in Social Networks. Annu. Rev. Sociol. 2001, 27, 415–444. [Google Scholar] [CrossRef]
  130. Ter Wal, A.L.J. The Dynamics of the Inventor Network in German Biotechnology: Geographic Proximity versus Triadic Closure. J. Econ. Geogr. 2014, 14, 589–620. [Google Scholar] [CrossRef]
  131. Rivera, L.; Sheffi, Y.; Knoppen, D. Logistics Clusters: The Impact of Further Agglomeration, Training and Firm Size on Collaboration and Value Added Services. Int. J. Prod. Econ. 2016, 179, 285–294. [Google Scholar] [CrossRef]
  132. Geldes, C.; Felzensztein, C.; Turkina, E.; Durand, A. How Does Proximity Affect Interfirm Marketing Cooperation? A Study of an Agribusiness Cluster. J. Bus. Res. 2015, 68, 263–272. [Google Scholar] [CrossRef]
  133. Cassiman, B.; Veugelers, R. R&D Cooperation and Spillovers: Some Empirical Evidence from Belgium. Am. Econ. Rev. 2002, 92, 1169–1184. [Google Scholar]
  134. Giuliani, E.; Bell, M. The Micro-Determinants of Meso-Level Learning and Innovation: Evidence from a Chilean Wine Cluster. Res. Policy 2005, 34, 47–68. [Google Scholar] [CrossRef]
  135. Robinson, K.C.; Mcdougall, P.P. Entry barriers and new venture performance: A comparison of universal and contingency approaches. Strateg. Manag. J. 2001, 22, 659–685. [Google Scholar] [CrossRef]
  136. Harrigan, K.R. Exit Barriers and Vertical Integration. Acad. Manag. J. 1985, 28, 686–697. [Google Scholar] [CrossRef]
  137. Academy, T.; Journal, M. The Conditioning Effect of Time on Firm Survival : An Industry Life Cycle. Acad. Manag. J. 2002, 45, 971–994. [Google Scholar]
  138. Cainarca, G.C.; Colombo, M.G.; Mariotti, S. Agreements between Firms and the Technological Life Cycle Model: Evidence from Information Technologies. Res. Policy 1992, 21, 45–62. [Google Scholar] [CrossRef]
  139. Ter Wal, A.L.J.; Boschma, R. Co-evolution of firms, industries and networks in space. Reg. Stud. 2011, 45, 919–933. [Google Scholar] [CrossRef]
  140. Markard, J. The Life Cycle of Technological Innovation Systems. Technol. Forecast. Soc. Chang. 2020, 153, 119407. [Google Scholar] [CrossRef]
Figure 1. Conceptual research model.
Sustainability 16 02002 g001
Figure 2. Cooperative patents of electronic information industry, listed companies (1998–2018).
Sustainability 16 02002 g002
Figure 3. Numbers of newly entered, exited, and retained behavioral subjects.
Sustainability 16 02002 g003
Figure 4. The 95% confidence interval graph of regression coefficients (a) for Transitivity (b) for status (c) for association autonomy (d) for industrial policy support (e) for institutional environment establishment .
Sustainability 16 02002 g004
Table 1. Variables’ operationalization.
VariablesOperationalization
Cooperative innovation network (Coop)Networks of collaborative relationships between actors [28]
Transitivity (Trans)Transitive triplets [44]
Status (Status)Degree centrality [28]
Association autonomy (Asso)Numbers of associations in which each actor is involved [93]
Industrial policy support (Indp)The extent of support for the electronic information industry in the five-year plan outline documents formulated by the provinces in which the actors are located (dummy) [126]
Institutional environment establishment
(Ine)
The institutional competitiveness score ranking of the province in which the actor is located in the “China City Competitiveness Annual Report” [117]
Network density (Den)Out degree [124]
Geographical proximity (Gep)Co-location (same city/province) between two actors (dummy) [40]
Institutional proximity (Inp)Same typology (enterprises, universities and research institutions, and public institutions) between two actors (dummy) [40]
Organization proximity (Orp)Same group of enterprises between two actors (dummy) [28]
Experience (Exp)Operation tenure [28]
Innovation capability (Inc)Number of cooperative patents in the past five years [36]
Table 2. Indexes of industrial development phases.
Quantity of
Behavioral Subjects
Entry BarrierExit BarrierGrowth Rate of Output
Average of
Behavioral Subjects
Average Annual
Increase Rate of
Newly Entered Subjects
Average Annual
Increase Rate of
Exited Subjects
Average Annual
Increase Rate of
Cooperative Patents
Phase 1
2006–2010
870.250.560.17
Phase 2
2011–2015
2370.170.150.67
Phase 3
2016–2018
313−0.030.080.2
Note: the higher value of average annual increase rates of newly entered/exited subjects represents the lower entry/exit barrier.
Table 3. Cooperative relationships of industrial development phases.
Average of Established RelationshipsAverage of Discontinued RelationshipsAverage of Sustained Relationships
Phase 1
2006–2010
4936256
Phase 2
2011–2015
254194155
Phase 3
2016–2018
254186271
Table 4. Cooperative innovation network structure of industrial development phases.
Average of
Cooperative
Relationships
Mean Value of
Average Linkages
Average of
Network Density
Phase 1
2006–2010
3001.70.01
Phase 2
2011–2015
3690.920.002
Phase 3
2016–2018
4891.160.003
Table 5. Descriptive statistics of each variable.
VariablePhase 1Phase 2Phase 3
MSDMinMaxMSDMinMaxMSDMinMax
Asso 0.600.93040.571.04060.591.31010
Indp1.480.65030.950.85031.180.7303
Ine5.994.702249.289.4313210.47.67127
Exp11.1410.3106911.388.2205613.788.78161
Inc0.350.73055.5312.26016513.3583.5801452
Table 6. Estimation results.
Phase 1Phase 2Phase 3
N = 176N = 402N = 419
Network endogenous mechanisms
Trans0.31 ***
(0.01)
0.22 ***
(0.02)
0.50 ***
(0.03)
Status0.44 ***
(0.06)
1.06 ***
(0.01)
0.73 ***
(0.03)
Asso0.40 ***
(0.11)
0.16 ***
(0.04)
0.10 ***
(0.03)
Inp0.08
(0.18)
0.36 ***
(0.04)
0.13 ***
(0.03)
Ine0.03
(0.03)
0.01 *
(0.01)
0.03 ***
(0.01)
Control variables:
Den−6.40 ***
(0.19)
−6.52 ***
(0.12)
−5.30 ***
(0.10)
Gep0.81 ***
(0.12)
0.39 ***
(0.04)
0.48 ***
(0.04)
Inp0.14
(0.23)
−0.98 ***
(0.09)
−0.63 ***
(0.08)
Orp3.52 ***
(0.23)
3.45 ***
(0.11)
3.04 ***
(0.11)
Exp0.01
(0.01)
−0.01
(0.01)
−0.01
(0.01)
Inc0.16
(0.12)
0.02
(0.04)
0.01 ***
(0.01)
Convergence ratios0.140.180.19
Note: * p < 0.1. *** p < 0.01.
Disclaimer/Publisher’s Note: The statements, opinions and data contained in all publications are solely those of the individual author(s) and contributor(s) and not of MDPI and/or the editor(s). MDPI and/or the editor(s) disclaim responsibility for any injury to people or property resulting from any ideas, methods, instructions or products referred to in the content.

