
A Techno-Economic-Environmental Feasibility Study of Residential Solar Photovoltaic/Biomass Power Generation for Rural Electrification: A Real Case Study


 ,
,  , , ,
, , ,  and
and 
Abstract
:1. Introduction
- It provides a first-of-its-kind comparison of on/off-grid PV/biomass power generation to meet the electric load of residential buildings for rural electrification in Egypt.
- It conducts a feasibility study for an HGEF using HOMER Pro software and arrives at an optimal solution.
- Economic and microeconomic parameters based on the real market of Egypt are used, except for the default values in the HOMER Pro software.
2. Literature Analysis
- By reviewing most of the previously published works, the PV/biomass renewable integration system has not yet been evaluated in Egypt.
- To enhance the HGEF in Egypt, no thorough TE-environmental assessment based on weather information has been carried out.
- There is no comprehensive comparison of HGEF based on TE-environmental factors, determining whether the on-grid or off-grid mode of operation represents the most cost-effective solution.
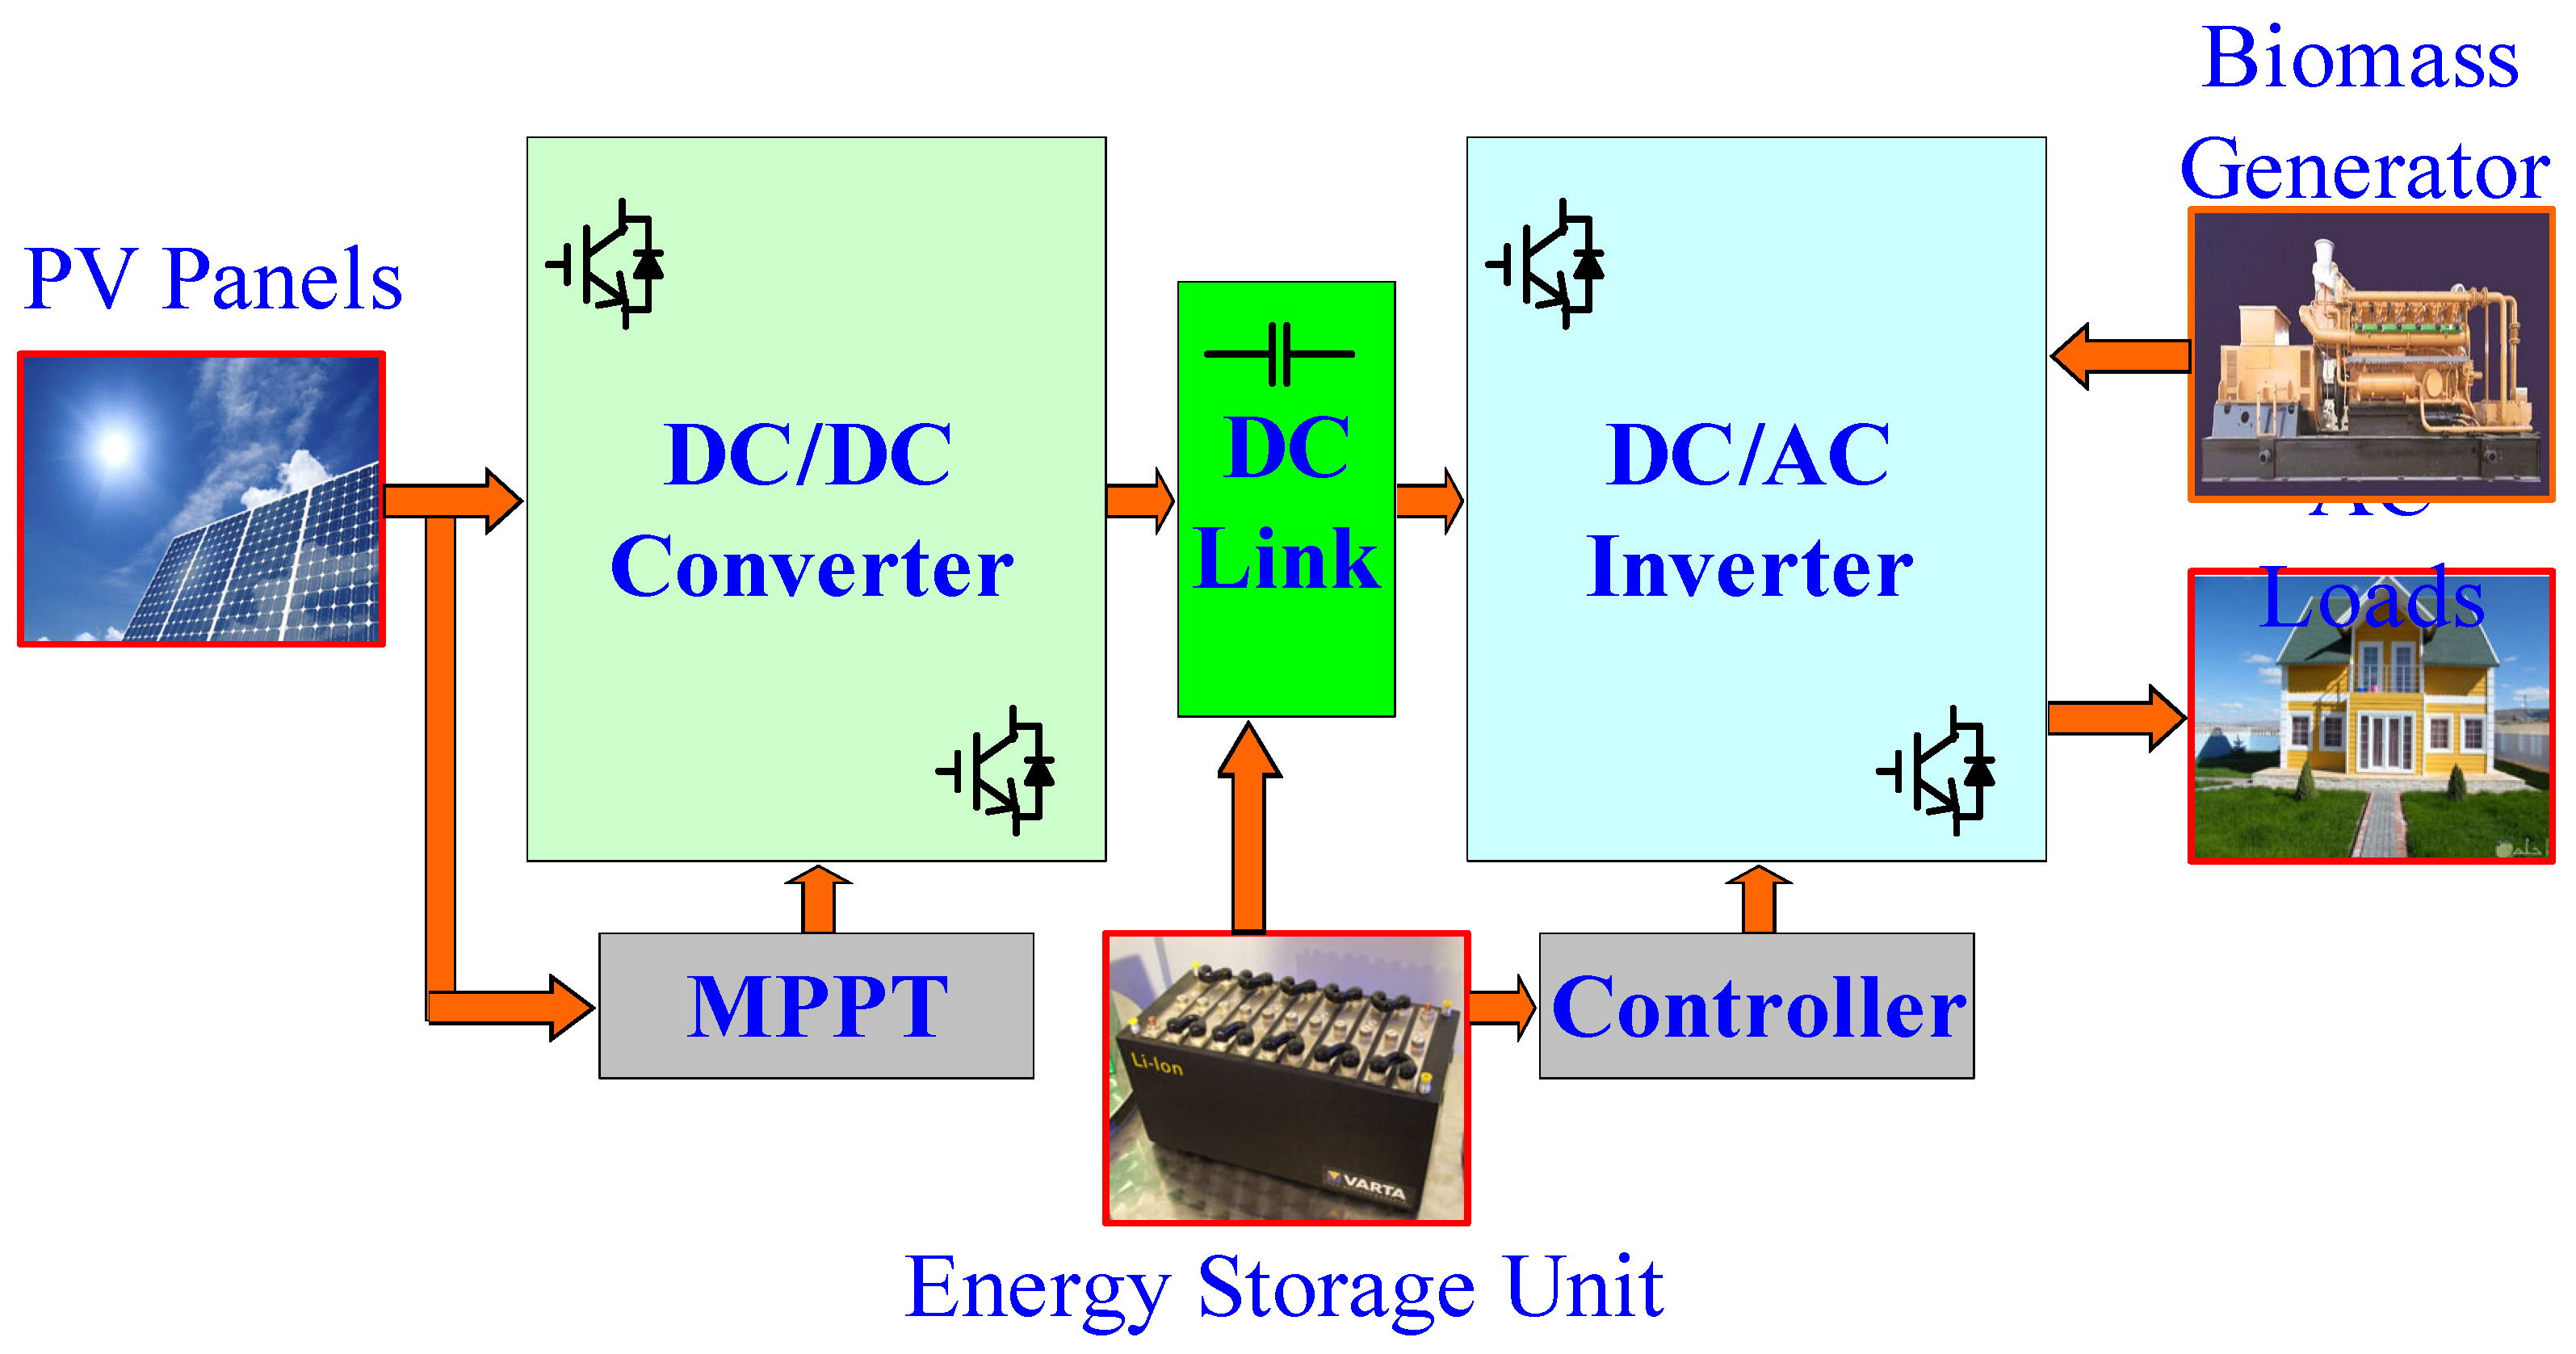
3. Off-Grid PV/Biomass System Design
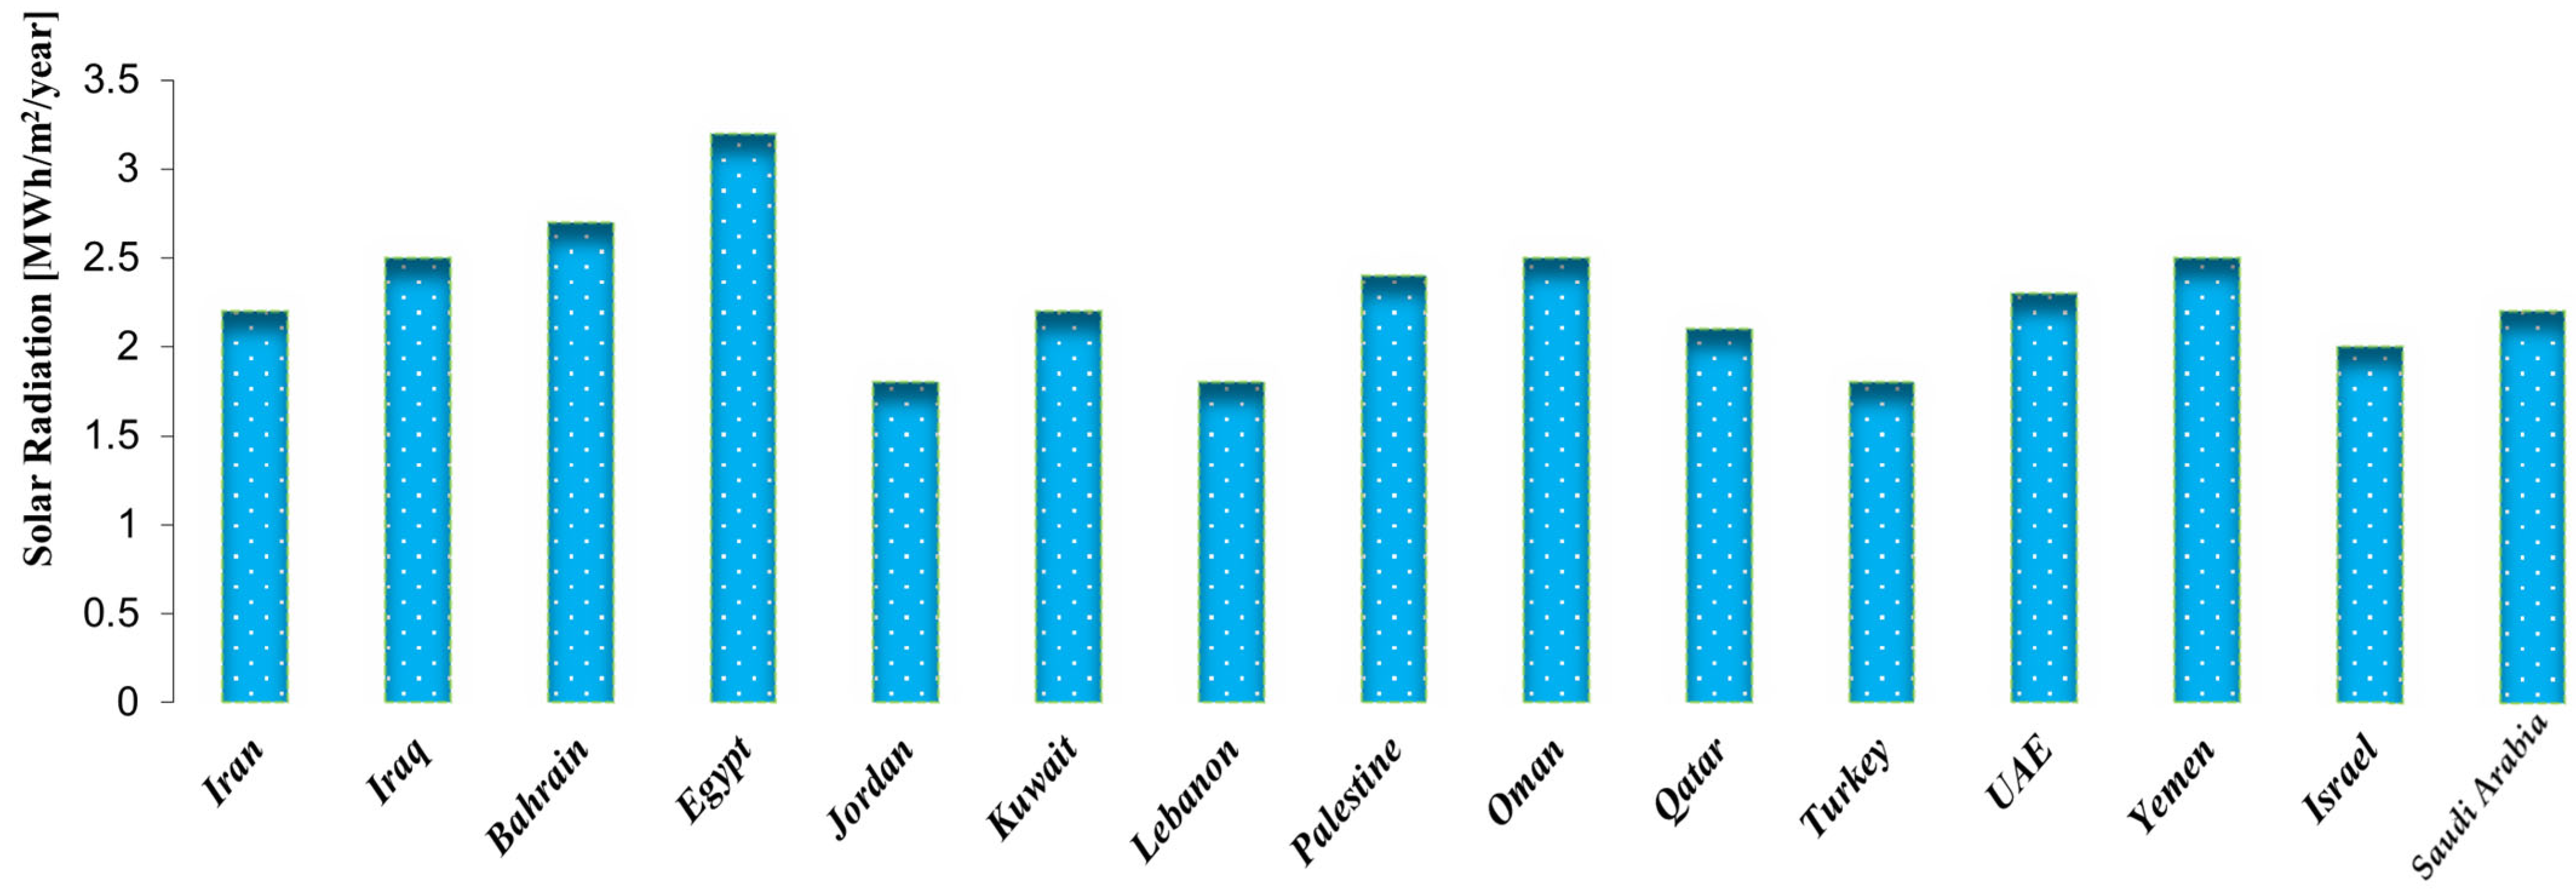
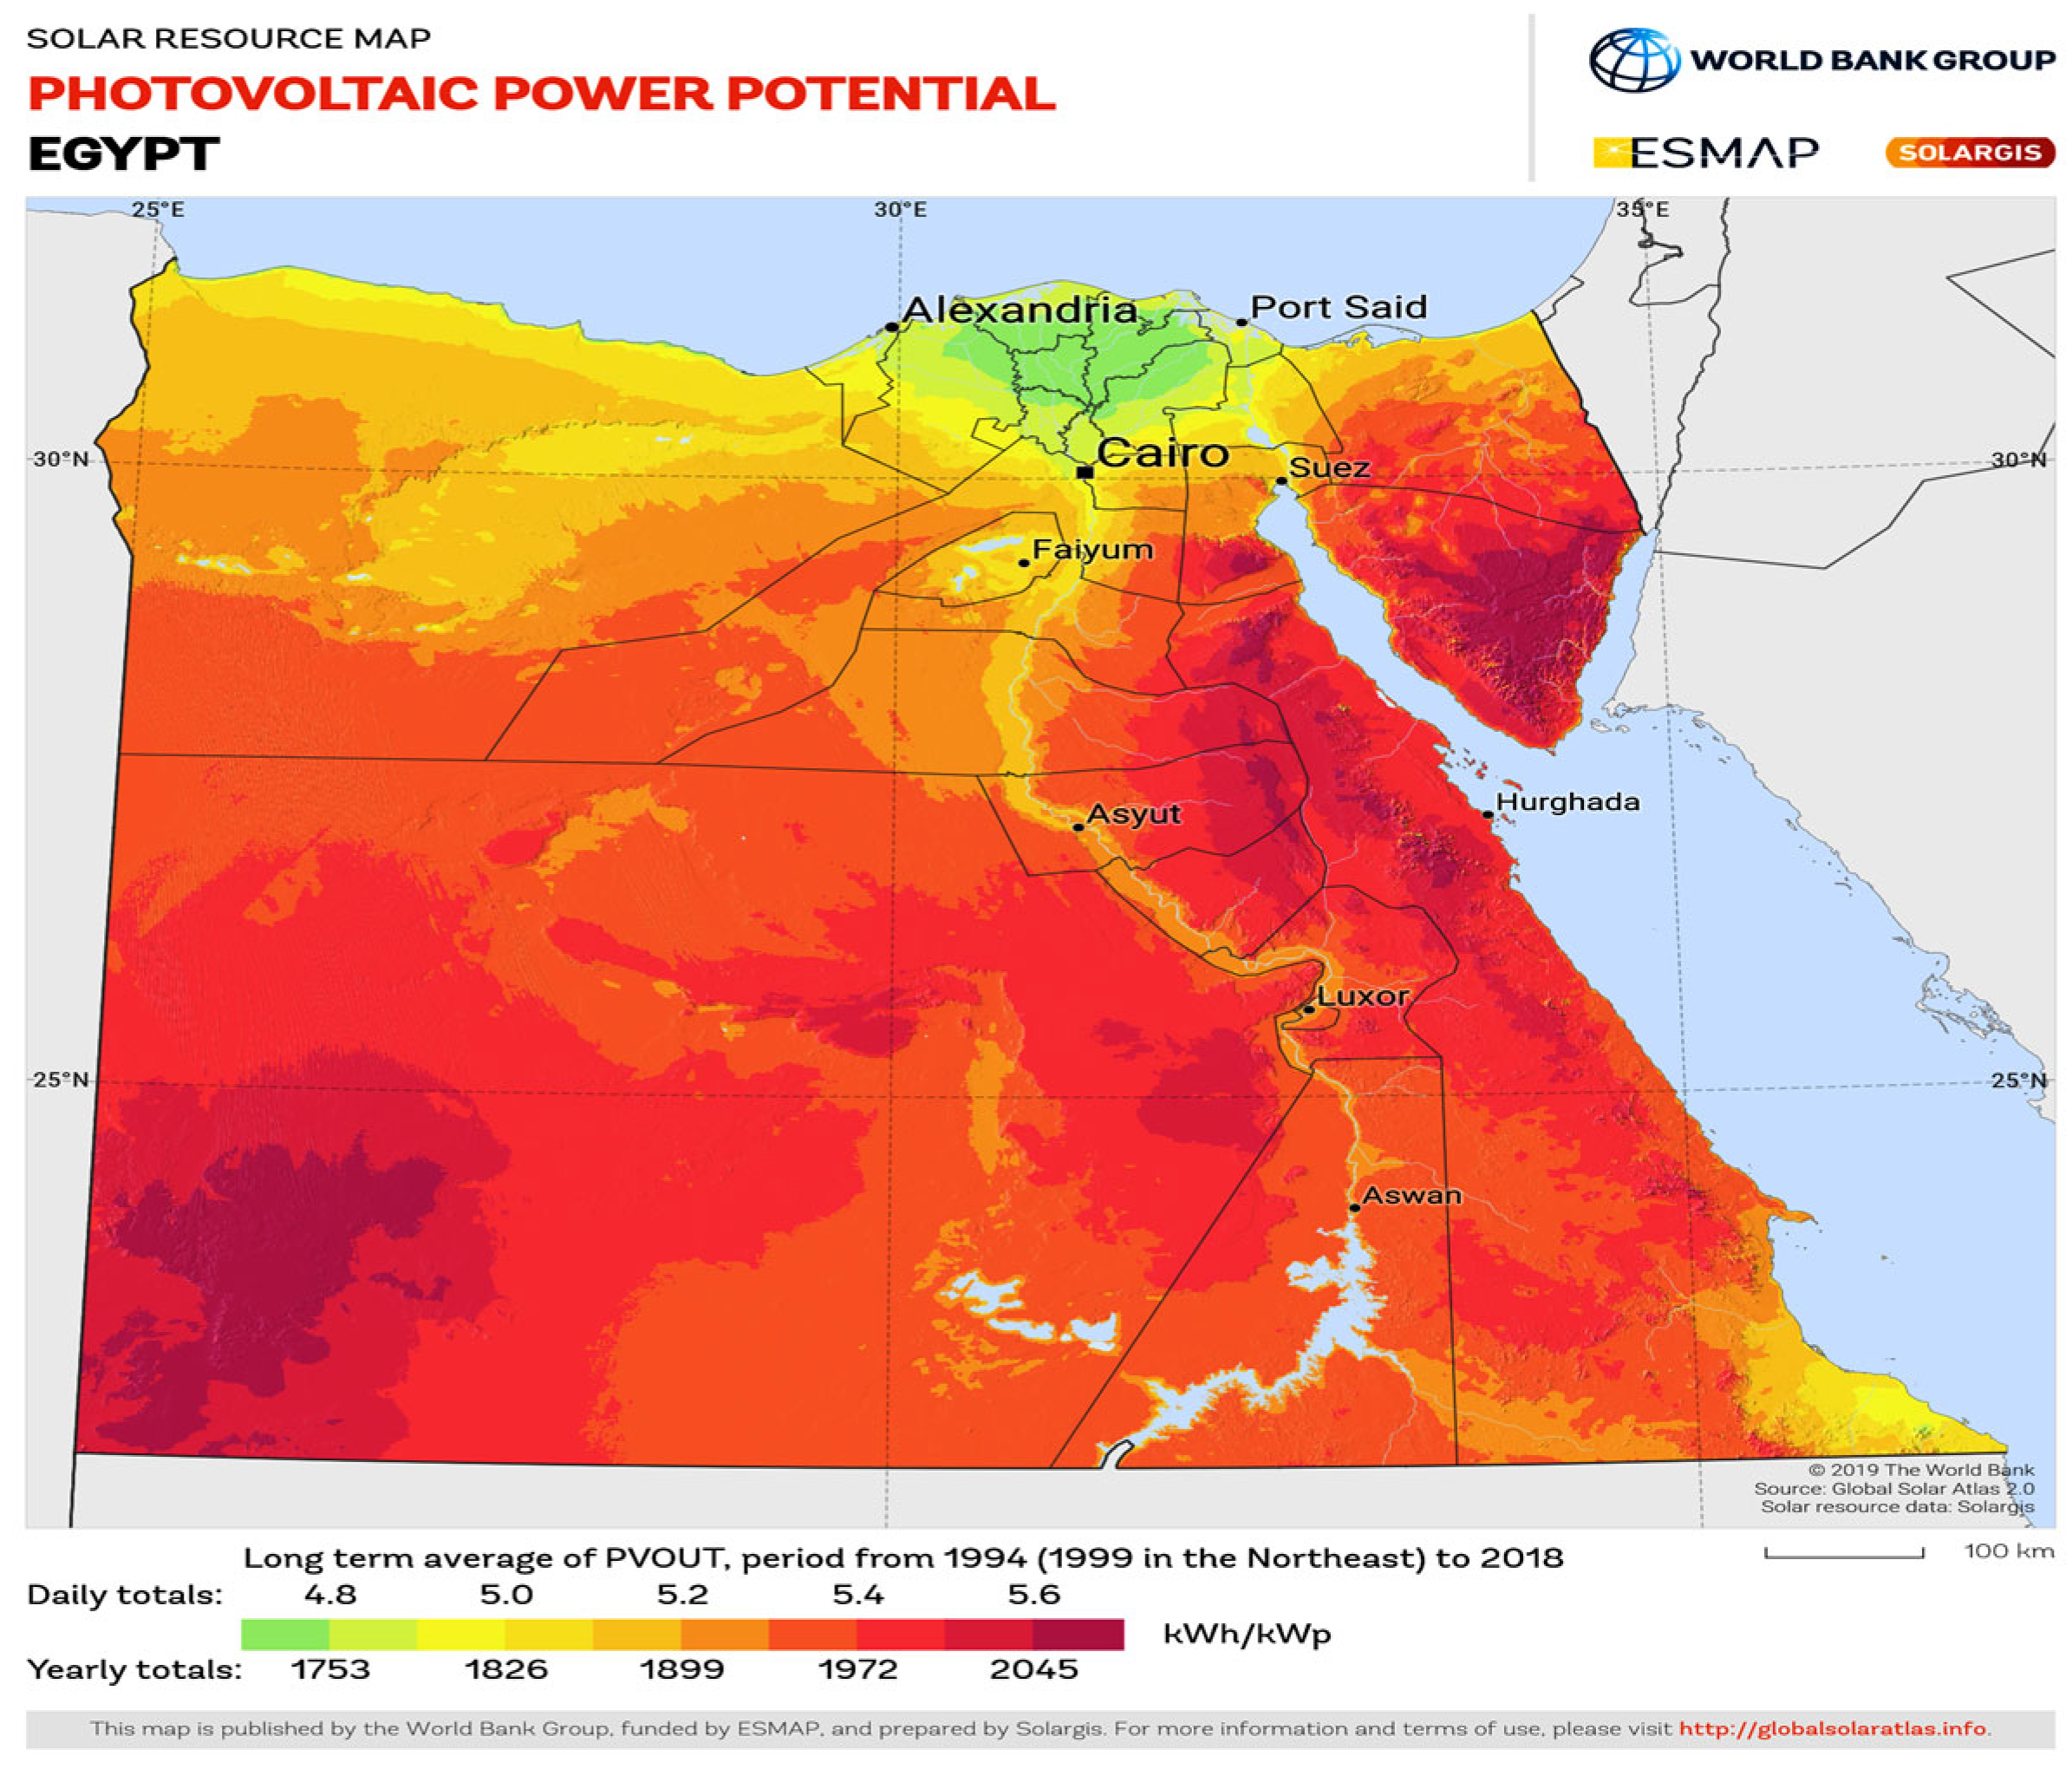
3.1. Solar Radiation in Egypt
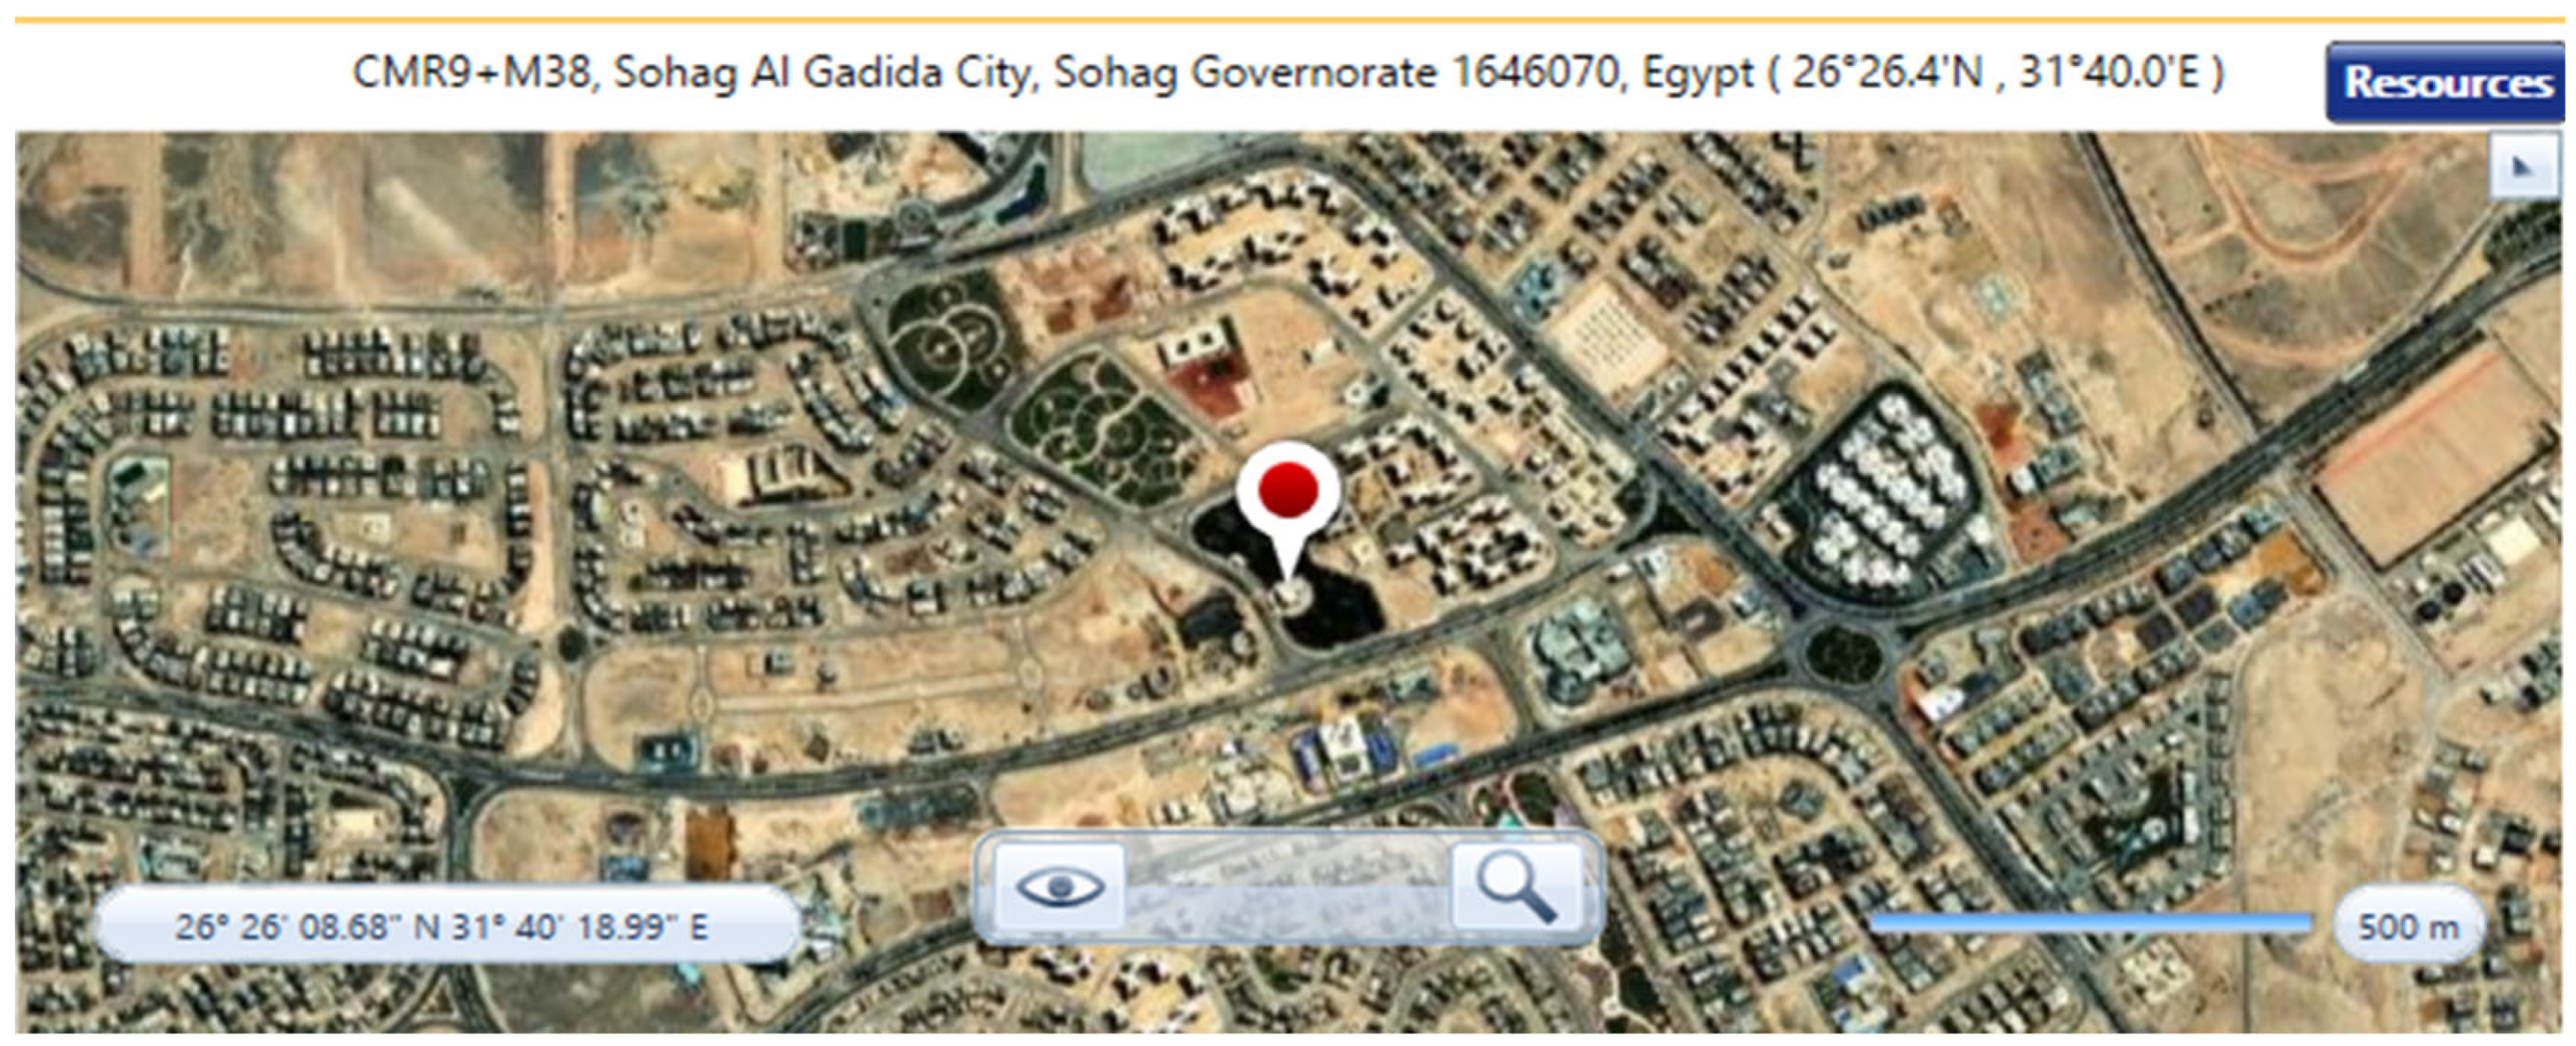
3.2. Site Location
3.3. SR Data for the Site
3.4. Load Data Analysis
3.5. PV Array Selection
3.6. Biomass Generator (BG) Selection
3.7. Battery Bank (BB) Selection
3.8. Solar Inverter (SI) Selection
3.9. Charge Controller (CC) Selection
4. Techno-Economic (TE)-Environmental Analysis (EA)
4.1. Technical Feasibility Assessment
4.2. Economic Feasibility Assessment
4.3. Environmental Feasibility Assessment
4.4. Sensitivity Analysis (SA)
5. Simulation Results
- The proposed HGEF model attained from the HOMER program was optimally feasible and had ideal attributes for an NPC of USD 11,026, an energy generation cost of 0.346 USD/kWh, an RF of 99.9%, and a CO2 emission of 0.9305 kg/year. The HGEF economic study revealed a payback period of 20 years and an annual real interest rate of 6% with an LCOE of 0.184 USD/kWh and an O and M cost of 50 USD/year.
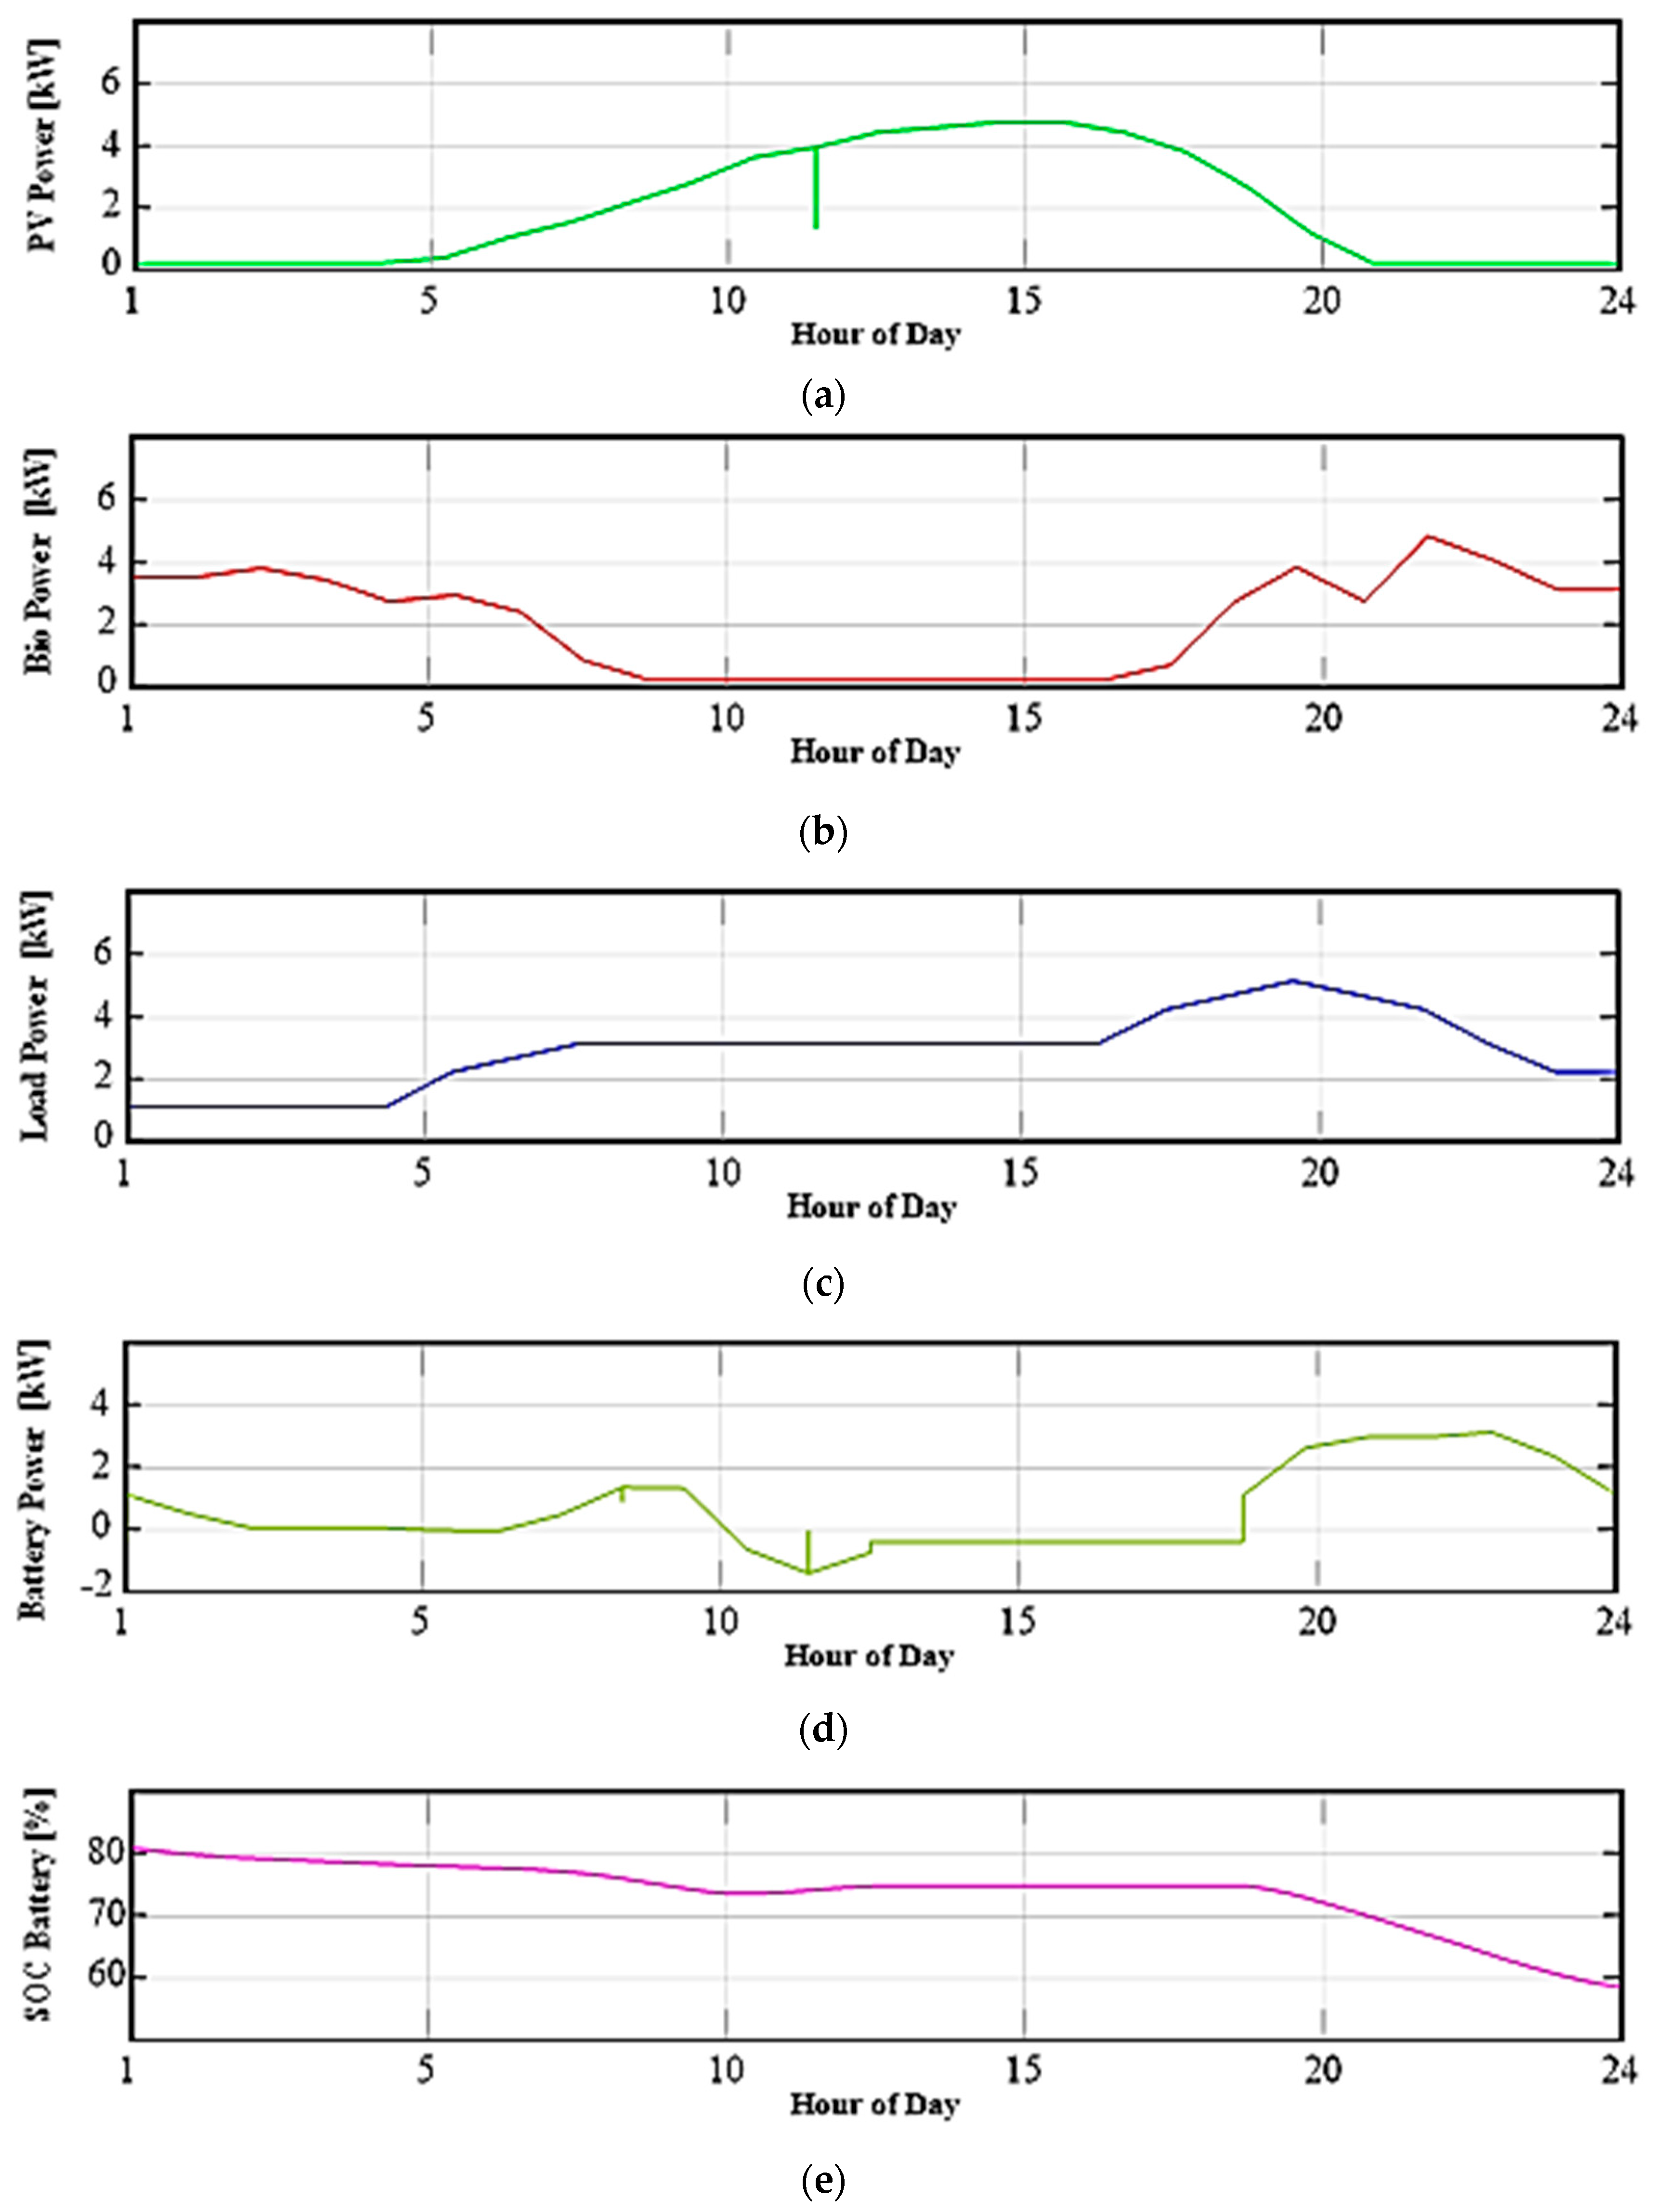
- According to the previously described results, the HGEF structure involves 20 PVAs with a total DC output power of 5 kW, and a 1 kW BG with a 2 kW solar inverter to meet all electrical loads. A storage system (lithium-ion batteries) consisting of 23 BBs with a total capacity of 612.5 Ah and a total energy of 29.4 kWh at 48 V. Depending on the required electrical loads and the amount of energy generated by the proposed HGEF, the BB is charged and discharged accordingly with a storage depletion of 0.201 kWh/year for 15 years.
- Simulation results are provided to confirm the suggested HGEF configuration using HOMER Pro and MATLAB/SIMULINK software. The simulation results show that both on-grid and off-grid HRES are economically feasible and more reliable and sustainable than using grid-based electricity or PV/DG alone.
- The grid-connected HGEF provides a more reliable, unchanging, and low-priced power supply with an energy cost of 0.18–0.28 USD/kWh. However, it depends on the location of the network infrastructure and resource capabilities and accessibility.
- In contrast, the proposed isolated HGEF offers very low annual CO2 emissions and a more independent energy supply. Nevertheless, the price of energy production is higher (COE: 0.184 USD/kWh) due to the capacity and cost of BG and BB.
6. Conclusions
- According to this analysis, the PV/BG hybrid configuration is the most efficient layout out of all options to satisfy the local power need at a minimal energy price. The results also indicate that using hybrid PV/biomass is an attractive choice with the initial capital cost (ICC: USD 8.144), net present cost (NPC: USD 11.026), a low cost of energy (LCOE: 0.184 USD/kWh), and the high renewable fraction (RF: 99.9%) of the system.
- The TE-EA of various off-grid HGEF strategies relying on available local resources was studied. Furthermore, a sensitivity analysis was performed for various structures to verify the effectiveness of the optimized system even under other design constraints, such as changes in project lifetime and PV array reduction factor at different % loads.
- Consequently, the decision between the two systems ought to be based on the particular requirements and constraints of the application and its place. It is crucial to remember that combining the two systems might give Egypt access to more reliable and adaptable energy sources. Therefore, the anticipated green power production system may support both the environmental and economic well-being of the RA.
Author Contributions
Funding
Institutional Review Board Statement
Informed Consent Statement
Data Availability Statement
Acknowledgments
Conflicts of Interest
Abbreviations
| AC | Alternating Current |
| BG | Bio-Gas |
| BGDG | Bio-Gas Diesel Generator |
| BM | Bio-Mass |
| BS | Battery Storage |
| BTUs | British Thermal Units |
| CRF | Capital Recovery Factor |
| DC | Direct Current |
| DG | Diesel Generator |
| DOA | Days of Autonomy |
| DOD | Depth of Discharge |
| EG | Energy Generation |
| FC | Fuel Cell |
| FF | Fossil Fuel |
| GC | Generation Cost |
| GE | Green Energy |
| GHGs | Greenhouse Gases |
| HFC | Hydrogen Fuel Cell |
| HGEF | Hybrid Green Energy Farm |
| HOMER | Hybrid Optimization of Multiple Energy Resources |
| HRES | Hybrid Renewable Energy Systems |
| ICC | Initial Capital Cost |
| LCOE | Lowest Cost of Energy |
| Li-Ion | Lithium Ion |
| MGPS | Micro Grid Power System |
| MPPT | Maximum Power Point Tracking |
| NASA | National Aeronautics and Space Administration |
| NPC | Net Present Cost |
| O and M | Operation and Maintenance |
| OC | Operational Cost |
| PV | Photovoltaic Panel |
| RC | Replacement Cost |
| RER | Renewable Energy Resource |
| RES | Renewable Energy Source |
| RF | Renewable Fraction |
| SE | Solar Energy |
| SOC | State of Charge |
| SR | Solar Radiation |
| STC | Standard Test Condition |
| TAC | Total Annual Cost |
| TV | Television |
| US | United States |
Appendix A

| References No./Year | Location | Optimal Hybrid Conf. | Summary of Results |
|---|---|---|---|
| [43], 2023 | Durham, Ontario | PV/WT/Nuclear | LCOE-0.26 USD/kWh. |
| [44], 2023 | Al-Karak, Jordan | PV/WT | LCOE-0.024 USD/kWh. |
| [45], 2023 | Chilubi Island, Zambia | PV/DG/BS | LCOE-0.182 USD/kWh. |
| [46], 2023 | Oyo State, Nigeria | PV only | LCOE-0.1904 USD/kWh. |
| [47], 2023 | Western Ethiopia | PV/WT/BS | LCOE-0.173 USD/kWh. |
| [48], 2022 | Punjab, India | PV/BG | NPC-21087 USD, LCOE-0.362 USD/kWh, RF-99.9%. |
| [49], 2022 | Gaza city | PV/BG/DG | LCOE-0.438 USD/kWh. |
| [50], 2022 | Nankese, Ghana | PV/grid, PV/Genset | PV-Grid, LCOE-0.0824 USD/kWh. PV-Genset, LCOE-0.309 USD/kWh. |
| [51], 2022 | Malaysia | PV/WT/BS/DG | LCOE-0.198 USD/kWh. |
| [52], 2022 | Chintalaya Palle, A.P., India. | PV/WT/DG/BS | NPC-5.48 M USD, LCOE-0.272 USD/kWh, RF-91.6%. |
| [53], 2022 | Diyala, Iraq | PV/FC | NPC-10,166 USD, LCOE-0.23 USD/kWh, RF-91.8%. |
| [54], 2022 | Korkadu East, Villiyanur Commune, Puducherry, India | PV/WT/BM | NPC-Rs.573 M USD, LCOE-Rs.7.886 USD/kWh, RF-86.2%. |
| [55], 2021 | Kanadripalle, Andhra Pradesh, India | PV/BS/DG | NPC-341,280 USD, LCOE-0.217 USD/kWh, RF-96.6%. |
| [56], 2021 | Ukai, Gujarat, India | PV/WT/BG/DG | NPC-831,217 USD, LCOE-0.196 USD/kWh, RF-81.2%. |
| [57], 2021 | North-East Indian States | PV/HFC | NPC in the range of USD (327,557–443,004), LCOE in the range of (0.509–0.689) USD/kWh, RF-100%. |
| [58], 2021 | Korkadu, Pondicherry, India | PV/WT/BM | NPC-Rs.11.9 M USD, LCOE-Rs.8.231 USD/kWh, RF-100%. |
| [59], 2021 | Gaharika, Kandhamal District, Odissa | WT/PV/BS | NPC-454,242 USD, LCOE-0.278 USD/kWh. |
| [60], 2021 | 14 Sites Across Gilgit-Baltistan | HG/WT/PV with DG or BS | LCOE in the range of (0.0470–0.0968) USD/kWh. |
| [61], 2021 | Suez University, Egypt | PV/WT/BS with DG | LCOE-0.343USD/kWh. |
| [62], 2021 | Xining, China | WT/FC/BS | NPC-59,611 USD, LCOE-1.278 USD/kWh. |
| [63], 2020 | Yalova University, Turkey | PV/WT/DG/BS | NPC-1.77 M USD, LCOE-0.145 USD/kWh, RF-75.2%. |
| [64], 2020 | Newcastle, UK | BGDG/WT/BS | NPC-14,507 USD, LCOE-0.588 USD/kWh, RF-82.3%. |
| [65], 2020 | West China | PV/WT/BGDG/BS | NPC-456,388 USD, LCOE-0.206 USD/kWh. |
| [66], 2020 | Fou ay Village, Benin Republic | PV/DG/BS | NPC-555,492 USD, LCOE-0.207 USD/kWh, RF-97.7%. |
| [67], 2020 | Adrar, Sahara of Algeria | PV/Li-Ion/BS | NPC-27,361 USD, LCOE-0.25 USD/kWh, RF-88.3%. |
| [68], 2019 | Jubail Industrial City, Saudi Arabia | PV/WT/DG/BS | NPC-555,492 M USD, LCOE-0.25 USD/kWh, RF-100%. |
| [69], 2019 | Southern Cameroons, the Central and West African Regions | PV/DG/BS | NPC-191,700 USD, LCOE-0.443 USD/kWh, RF-100%. |
| [70], 2019 | Diyala, Muqdadiyah District, Iraq | PV/BS/DG | NPC-110,191 USD, LCOE-0.21 USD/kWh, RF-35.6%. |
| [42], 2019 | Eskisehir, Turkey | PV only and PV/WT/DG | LCOE in the range of (0.052–0.055) USD/kWh. |
Appendix B
| Parameters | Value | Unit |
|---|---|---|
| Number of cows | 8 | …. |
| Absorbing the farm of cows | 12 | …. |
| Manure production per cow | 12 | kg/day |
| The length of stay in the fermenter required for the fermentation process | 30 | day |
| Cumulative production of biogas during the 30-day fermentation period | 48 | m3 |
| The highest production on the thirteenth day | 4.5 | m3 |
| The lowest production on the thirtieth day | 0.5 | m3 |
| The average daily production of biogas | 1.6 | m3 |
References
- Rebollal, D.; Carpintero-Rentería, M.; Santos-Martín, D.; Chinchilla, M. Microgrid and distributed energy resources standards and guidelines review: Grid connection and operation technical requirements. Energies 2021, 14, 523. [Google Scholar] [CrossRef]
- Xiao, W.; Ozog, N.; Dunford, W.G. Topology study of photovoltaic interface for maximum power point tracking. IEEE Ind. Electron. Mag. 2007, 54, 1696–1704. [Google Scholar] [CrossRef]
- Awad, M.; Said, A.; Saad, M.H.; Farouk, A.; Mahmoud, M.M.; Alshammari, M.S.; Alghaythi, M.L.; Aleem, S.H.A.; Abdelaziz, A.Y.; Omar, A.I. A review of water electrolysis for green hydrogen generation considering PV/wind/hybrid/hydropower/geothermal/tidal and wave/biogas energy systems, economic analysis, and its application. Alex. Eng. J. 2024, 87, 213–239. [Google Scholar] [CrossRef]
- Dağtekin, M.; Kaya, D.; Öztürk, H.H.; Kiliç, F.C. A study of techno-economic feasibility analysis of solar photovoltaic (PV) power generation in the province of Adana in Turkey. Energy Explor. Exploit. 2014, 32, 719–735. [Google Scholar] [CrossRef]
- Mahmoud, M.M. Improved current control loops in wind side converter with the support of wild horse optimizer for enhancing the dynamic performance of PMSG-based wind generation system. Int. J. Model. Simul. 2023, 43, 952–966. [Google Scholar] [CrossRef]
- Semeskandeh, S.; Hojjat, M.; Abardeh, M.H. Techno–economic–environmental feasibility study of a photovoltaic system in northern part of Iran including a two-stage multi-string inverter with DC–DC ZETA converter and a modified P&O algorithm. Clean Energy 2022, 6, 127–140. [Google Scholar] [CrossRef]
- Mahmoud, M.M.; Atia, B.S.; Esmail, Y.M.; Bajaj, M.; Wapet, D.E.M.; Ratib, M.K.; Hossain, B.; AboRas, K.M.; Abdel-Rahim, A.-M.M. Evaluation and Comparison of Different Methods for Improving Fault Ride-Through Capability in Grid-Tied Permanent Magnet Synchronous Wind Generators. Int. Trans. Electr. Energy Syst. 2023, 2023, 7717070. [Google Scholar] [CrossRef]
- Elmi, Y.K.; Jazayeri, M.; Salman, D. The feasibility of economic viability of hybrid PV-diesel energy system connect with the main grid in Somalia. Int. J. Smart Grid Clean Energy 2022, 11. [Google Scholar] [CrossRef]
- Kassem, Y.; Gökçekuş, H.; Güvensoy, A. Techno-economic feasibility of grid-connected solar pv system at near east university hospital, northern cyprus. Energies 2021, 14, 7627. [Google Scholar] [CrossRef]
- Olówósejéjé, S.; Leahy, P.; Morrison, A.P. Optimising photovoltaic-centric hybrid power systems for energy autonomy. Energy Rep. 2021, 7, 1943–1953. [Google Scholar] [CrossRef]
- Ibrahim, N.F.; Alkuhayli, A.; Beroual, A.; Khaled, U.; Mahmoud, M.M. Enhancing the Functionality of a Grid-Connected Photovoltaic System in a Distant Egyptian Region Using an Optimized Dynamic Voltage Restorer: Application of Artificial Rabbits Optimization. Sensors 2023, 23, 7146. [Google Scholar] [CrossRef]
- El Maysse, I.; El Magri, A.; Watil, A.; Alkuhayli, A.; Kissaoui, M.; Lajouad, R.; Giri, F.; Mahmoud, M.M. Nonlinear Observer-Based Controller Design for VSC-Based HVDC Transmission Systems Under Uncertainties. IEEE Access 2023, 11, 124014–124030. [Google Scholar] [CrossRef]
- Channi, H.K. Techno Economic Feasibility Analysis of Solar PV System in Jammu: A Case Study. In Solar Cells-Theory, Materials and Recent Advances; IntechOpen: London, UK, 2021. [Google Scholar] [CrossRef]
- Ibrahim, N.F.; Mahmoud, M.M.; Alnami, H.; Wapet, D.E.M.; Ardjoun, S.A.E.M.; Mosaad, M.I.; Hassan, A.M.; Abdelfattah, H. A new adaptive MPPT technique using an improved INC algorithm supported by fuzzy self-tuning controller for a grid-linked photovoltaic system. PLoS ONE 2023, 18, e0293613. [Google Scholar] [CrossRef] [PubMed]
- Zayed, M.E.; Zhao, J.; Li, W.; Elsheikh, A.H.; Elaziz, M.A. A hybrid adaptive neuro-fuzzy inference system integrated with equilibrium optimizer algorithm for predicting the energetic performance of solar dish collector. Energy 2021, 235, 121289. [Google Scholar] [CrossRef]
- Jahangiri, M.; Haghani, A.; Shamsabadi, A.A.; Mostafaeipour, A.; Pomares, L.M. Feasibility study on the provision of electricity and hydrogen for domestic purposes in the south of Iran using grid-connected renewable energy plants. Energy Strat. Rev. 2019, 23, 23–32. [Google Scholar] [CrossRef]
- Khan, M.J.; Yadav, A.K.; Mathew, L. Techno economic feasibility analysis of different combinations of PV-Wind-Diesel-Battery hybrid system for telecommunication applications in different cities of Punjab, India. Renew. Sustain. Energy Rev. 2017, 76, 577–607. [Google Scholar] [CrossRef]
- Kamel, O.M.; Diab, A.A.Z.; Mahmoud, M.M.; Al-Sumaiti, A.S.; Sultan, H.M. Performance Enhancement of an Islanded Microgrid with the Support of Electrical Vehicle and STATCOM Systems. Energies 2023, 16, 1577. [Google Scholar] [CrossRef]
- Dehghan, M.; Pfeiffer, C.F.; Rakhshani, E.; Bakhshi-Jafarabadi, R. A review on techno-economic assessment of solar water heating systems in the middle east. Energies 2021, 14, 4944. [Google Scholar] [CrossRef]
- Abubakr, H.; Vasquez, J.C.; Mahmoud, K.; Darwish, M.M.F.; Guerrero, J.M. Comprehensive Review on Renewable Energy Sources in Egypt—Current Status, Grid Codes and Future Vision. IEEE Access 2022, 10, 4081–4101. [Google Scholar] [CrossRef]
- Hani, E.H.B.; Sinaga, N.; Khanmohammdi, S.; Diyoke, C. Assessment of a waste energy recovery (WER) unit for power and refrigeration generation: Advanced thermodynamic examination. Sustain. Energy Technol. Assess. 2022, 52, 102213. [Google Scholar] [CrossRef]
- Hermann, D.T.; Donatien, N.; Armel, T.K.F.; René, T. Techno-economic and environmental feasibility study with demand-side management of photovoltaic/wind/hydroelectricity/battery/diesel: A case study in Sub-Saharan Africa. Energy Convers. Manag. 2022, 258, 115494. [Google Scholar] [CrossRef]
- Avila, D.; Marichal, G.N.; Hernández, Á.; Luis, F.S. Hybrid renewable energy systems for energy supply to autonomous desalination systems on Isolated Islands. In Design, Analysis and Applications of Renewable Energy Systems; Academic Press: Cambridge, MA, USA, 2021; pp. 23–51. [Google Scholar] [CrossRef]
- Shaahid, S.; El-Amin, I. Techno-economic evaluation of off-grid hybrid photovoltaic–diesel–battery power systems for rural electrification in Saudi Arabia—A way forward for sustainable development. Renew. Sustain. Energy Rev. 2009, 13, 625–633. [Google Scholar] [CrossRef]
- Khalil, A.K.; Mubarak, A.M.; Kaseb, S.A. Road map for renewable energy research and development in Egypt. J. Adv. Res. 2010, 1, 29–38. [Google Scholar] [CrossRef]
- Attia, S.; De Herde, A. Sizing photovoltaic systems during early design: A decision tool for architects. In Proceedings of the ASES 2010—39th Annual American National Solar Energy Conference, Phoenix, AZ, USA, 17–22 May June 2010; pp. 5186–5212. [Google Scholar]
- Palenzuela, P.; Alarcónpadilla, D.C.; Zaragoza, G.; Blanco, J. Comparison between CSP+MED and CSP+RO in Mediterranean Area and MENA Region: Techno-economic Analysis. Energy Procedia 2015, 69, 1938–1947. [Google Scholar] [CrossRef]
- Trieb, F. Trans-Mediterranean Interconnection for Concentrating Solar Power. In Proceedings of the Synergistic Supergrid Conference, London, UK, 19–21 January 2010; pp. 1–22. [Google Scholar]
- Gad, H.E.; El-Gayar, S.M. Performance prediction of a proposed photovoltaic water pumping system at South Sinai, Egypt climate conditions. In Proceedings of the Thirteenth International Water Technology Conference, IWTC13 2009, Hurghada, Egypt, 12–15 March 2009; Volume 13, pp. 739–752. [Google Scholar]
- Taha, A.T.H. Estimation of hourly global solar radiation in egypt using mathematical model. Misr J. Agric. Eng. 2010, 27, 2033–2047. [Google Scholar] [CrossRef]
- Abo-Khalil, A.G.; Abo-Zied, H. Modelling and simulation of a grid-connected photovoltaic system for an middle-class apartment in new assiut city. JES. J. Eng. Sci. 2012, 40, 1747–1757. [Google Scholar] [CrossRef]
- Abdel-Rehim, Z.S.; Lasheen, A. Experimental and theoretical study of a solar desalination system located in Cairo, Egypt. Desalination 2007, 217, 52–64. [Google Scholar] [CrossRef]
- Patchali, T.E.; Ajide, O.O.; Matthew, O.J.; Salau, T.A.O.; Oyewola, O.M. Examination of potential impacts of future climate change on solar radiation in Togo, West Africa. SN Appl. Sci. 2020, 2, 1941. [Google Scholar] [CrossRef]
- Salim, M.G. Selection of groundwater sites in Egypt, using geographic information systems, for desalination by solar energy in order to reduce greenhouse gases. J. Adv. Res. 2012, 3, 11–19. [Google Scholar] [CrossRef]
- Mandal, S.; Das, B.K.; Hoque, N. Optimum sizing of a stand-alone hybrid energy system for rural electrification in Bangladesh. J. Clean. Prod. 2018, 200, 12–27. [Google Scholar] [CrossRef]
- Jahangir, M.H.; Shahsavari, A.; Rad, M.A.V. Feasibility study of a zero emission PV/Wind turbine/Wave energy converter hybrid system for stand-alone power supply: A case study. J. Clean. Prod. 2020, 262, 121250. [Google Scholar] [CrossRef]
- Sayed, K.; El Zohri, E.H.; Mahfouz, H. Analysis and design for interleaved ZCS buck DC-DC converter with low switching losses. Int. J. Power Electron. 2017, 8, 210. [Google Scholar] [CrossRef]
- Markovic, D.; Cvetkovic, D.; Masic, B. Survey of software tools for energy efficiency in a community. Renew. Sustain. Energy Rev. 2011, 15, 4897–4903. [Google Scholar] [CrossRef]
- Fikri, M.A.; Samykano, M.; Pandey, A.; Kadirgama, K.; Kumar, R.R.; Selvaraj, J.; Rahim, N.A.; Tyagi, V.; Sharma, K.; Saidur, R. Recent progresses and challenges in cooling techniques of concentrated photovoltaic thermal system: A review with special treatment on phase change materials (PCMs) based cooling. Sol. Energy Mater. Sol. Cells 2022, 241, 111739. [Google Scholar] [CrossRef]
- Horne, S. 10—Concentrating Photovoltaic (CPV) Systems and Applications. BT—Concentrating Solar Power Technology. In Concentrating Solar Power Technology; Woodhead Publishing Series in Energy; Woodhead Publishing: Sawston, UK, 2012; pp. 323–361. Available online: http://www.sciencedirect.com/science/article/pii/B9781845697693500108 (accessed on 22 January 2024).
- Turkdogan, S. Design and optimization of a solely renewable based hybrid energy system for residential electrical load and fuel cell electric vehicle. Eng. Sci. Technol. Int. J. 2021, 24, 397–404. [Google Scholar] [CrossRef]
- Çetinbaş, I.; Tamyürek, B.; Demirtaş, M. Design, analysis and optimization of a hybrid microgrid system using homer software: Eskişehir osmangazi university example. Int. J. Renew. Energy Dev. 2019, 8, 65–79. [Google Scholar] [CrossRef]
- Gabbar, H.A.; Siddique, A.B. Technical and economic evaluation of nuclear powered hybrid renewable energy system for fast charging station. Energy Convers. Manag. X 2023, 17, 100342. [Google Scholar] [CrossRef]
- Al Afif, R.; Ayed, Y.; Maaitah, O.N. Feasibility and optimal sizing analysis of hybrid renewable energy systems: A case study of Al-Karak, Jordan. Renew. Energy 2023, 204, 229–249. [Google Scholar] [CrossRef]
- Mulenga, E.; Kabanshi, A.; Mupeta, H.; Ndiaye, M.; Nyirenda, E.; Mulenga, K. Techno-economic analysis of off-grid PV-Diesel power generation system for rural electrification: A case study of Chilubi district in Zambia. Renew. Energy 2023, 203, 601–611. [Google Scholar] [CrossRef]
- Amole, A.O.; Oladipo, S.; Olabode, O.E.; Makinde, K.A.; Gbadega, P. Analysis of grid/solar photovoltaic power generation for improved village energy supply: A case of Ikose in Oyo State Nigeria. Renew. Energy Focus 2023, 44, 186–211. [Google Scholar] [CrossRef]
- Benti, N.E.; Mekonnen, Y.S.; Asfaw, A.A. Combining green energy technologies to electrify rural community of Wollega, Western Ethiopia. Sci. Afr. 2023, 19, e01467. [Google Scholar] [CrossRef]
- Kumar, R.; Channi, H.K. A PV-Biomass off-grid hybrid renewable energy system (HRES) for rural electrification: Design, optimization and techno-economic-environmental analysis. J. Clean. Prod. 2022, 349, 131347. [Google Scholar] [CrossRef]
- Al-Najjar, H.; El-Khozondar, H.J.; Pfeifer, C.; Al Afif, R. Hybrid grid-tie electrification analysis of bio-shared renewable energy systems for domestic application. Sustain. Cities Soc. 2022, 77, 103538. [Google Scholar] [CrossRef]
- Asamoah, S.S.; Gyamfi, S.; Uba, F.; Mensah, G.S. Comparative assessment of a stand-alone and a grid-connected hybrid system for a community water supply system: A case study of Nankese community in the eastern region of Ghana. Sci. Afr. 2022, 17, e01331. [Google Scholar] [CrossRef]
- See, A.M.K.; Mehranzamir, K.; Rezania, S.; Rahimi, N.; Afrouzi, H.N.; Hassan, A. Techno-economic analysis of an off-grid hybrid system for a remote island in Malaysia: Malawali island, Sabah. Renew. Sustain. Energy Transit. 2022, 2, 100040. [Google Scholar] [CrossRef]
- Pujari, H.K.; Rudramoorthy, M. Optimal design, prefeasibility techno-economic and sensitivity analysis of off-grid hybrid renewable energy system. Int. J. Sustain. Energy 2022, 41, 1466–1498. [Google Scholar] [CrossRef]
- Hassan, Q.; Jaszczur, M.; Hafedh, S.A.; Abbas, M.K.; Abdulateef, A.M.; Hasan, A.; Abdulateef, J.; Mohamad, A. Optimizing a microgrid photovoltaic-fuel cell energy system at the highest renewable fraction. Int. J. Hydrogen Energy 2022, 47, 13710–13731. [Google Scholar] [CrossRef]
- Pandiyan, P.; Sitharthan, R.; Saravanan, S.; Prabaharan, N.; Tiwari, M.R.; Chinnadurai, T.; Yuvaraj, T.; Devabalaji, K. A comprehensive review of the prospects for rural electrification using stand-alone and hybrid energy technologies. Sustain. Energy Technol. Assess. 2022, 52, 102155. [Google Scholar] [CrossRef]
- Pujari, H.K.; Rudramoorthy, M. Optimal design and techno-economic analysis of a hybrid grid-independent renewable energy system for a rural community. Int. Trans. Electr. Energy Syst. 2021, 31, e13007. [Google Scholar] [CrossRef]
- Sawle, Y.; Jain, S.; Babu, S.; Nair, A.R.; Khan, B. Prefeasibility Economic and Sensitivity Assessment of Hybrid Renewable Energy System. IEEE Access 2021, 9, 28260–28271. [Google Scholar] [CrossRef]
- Pal, P.; Mukherjee, V. Off-grid solar photovoltaic/hydrogen fuel cell system for renewable energy generation: An investigation based on techno-economic feasibility assessment for the application of end-user load demand in North-East India. Renew. Sustain. Energy Rev. 2021, 149, 111421. [Google Scholar] [CrossRef]
- Krishnamoorthy, M.; Saisandeep, M.; Balasubramanian, K.; Srinivasan, S.; Thaniaknti, S.B. Techno economic performance analysis of hybrid renewable electrification system for remote villages of India. Int. Trans. Electr. Energy Syst. 2021, 31, e12515. [Google Scholar] [CrossRef]
- Sahu, P.K.; Jena, S.; Sahoo, U. Techno-Economic Analysis of Hybrid Renewable Energy System with Energy Storage for Rural Electrification. In Hybrid Renewable Energy Systems; Scrivener Publishing LLC: Beverly, MA, USA, 2021; pp. 63–96. [Google Scholar] [CrossRef]
- Ali, M.; Wazir, R.; Imran, K.; Ullah, K.; Janjua, A.K.; Ulasyar, A.; Khattak, A.; Guerrero, J.M. Techno-economic assessment and sustainability impact of hybrid energy systems in Gilgit-Baltistan, Pakistan. Energy Rep. 2021, 7, 2546–2562. [Google Scholar] [CrossRef]
- Elnozahy, A.; Yousef, A.M.; Ghoneim, S.S.M.; Abdelwahab, S.A.M.; Mohamed, M.; Abo-Elyousr, F.K. Optimal Economic and Environmental Indices for Hybrid PV/Wind-Based Battery Storage System. J. Electr. Eng. Technol. 2021, 16, 2847–2862. [Google Scholar] [CrossRef]
- Li, C. Technical and economic potential evaluation of an off-grid hybrid wind-fuel cell-battery energy system in Xining, China. Int. J. Green Energy 2021, 18, 258–270. [Google Scholar] [CrossRef]
- Kiliç, G.A.; Al, K.; Dağtekin, E.; Ünver, Ü. Technical, economic and environmental investigation of grid-independent hybrid energy systems applicability: A case study. Energy Sources Part A Recovery Util. Env. 2020, 1–16. [Google Scholar] [CrossRef]
- Miao, C.; Teng, K.; Wang, Y.; Jiang, L. Technoeconomic analysis on a hybrid power system for the uk household using renewable energy: A case study. Energies 2020, 13, 3231. [Google Scholar] [CrossRef]
- Li, J.; Liu, P.; Li, Z. Optimal design and techno-economic analysis of a solar-wind-biomass off-grid hybrid power system for remote rural electrification: A case study of west China. Energy 2020, 208, 118387. [Google Scholar] [CrossRef]
- Odou, O.D.T.; Bhandari, R.; Adamou, R. Hybrid off-grid renewable power system for sustainable rural electrification in Benin. Renew. Energy 2020, 145, 1266–1279. [Google Scholar] [CrossRef]
- Mokhtara, C.; Negrou, B.; Bouferrouk, A.; Yao, Y.; Settou, N.; Ramadan, M. Integrated supply–demand energy management for optimal design of off-grid hybrid renewable energy systems for residential electrification in arid climates. Energy Convers. Manag. 2020, 221, 113192. [Google Scholar] [CrossRef]
- Baseer, M.; Alqahtani, A.; Rehman, S. Techno-economic design and evaluation of hybrid energy systems for residential communities: Case study of Jubail industrial city. J. Clean. Prod. 2019, 237, 117806. [Google Scholar] [CrossRef]
- Muh, E.; Tabet, F. Comparative analysis of hybrid renewable energy systems for off-grid applications in Southern Cameroons. Renew. Energy 2019, 135, 41–54. [Google Scholar] [CrossRef]
- Aziz, A.S.; Tajuddin, M.F.N.; Adzman, M.R.; Mohammed, M.F.; Ramli, M.A. Feasibility analysis of grid-connected and islanded operation of a solar PV microgrid system: A case study of Iraq. Energy 2020, 191, 116591. [Google Scholar] [CrossRef]


| Month | Clearness Index | Daily SR * [kWh/m2/Day] | Daily Temperature ** [°C] |
|---|---|---|---|
| January | 0.593 | 3.850 | 12.420 |
| February | 0.657 | 5.020 | 14.090 |
| March | 0.675 | 6.150 | 18.240 |
| April | 0.670 | 6.940 | 23.680 |
| May | 0.666 | 7.370 | 28.100 |
| June | 0.720 | 8.130 | 30.390 |
| July | 0.710 | 7.910 | 31.210 |
| August | 0.709 | 7.500 | 30.810 |
| September | 0.709 | 6.740 | 28.580 |
| October | 0.685 | 5.520 | 24.640 |
| November | 0.630 | 4.240 | 18.840 |
| December | 0.584 | 3.570 | 13.980 |
| Devices | Number of Devices | Power [W] | Daily Operating Time [h/d] | Average Daily EC [Wh] |
|---|---|---|---|---|
| Indoor lighting | 10 | 12 | 12 | 1440 |
| Outdoor lighting | 5 | 18 | 6 | 540 |
| Ceiling fan | 4 | 50 | 10 | 2000 |
| Refrigerator | 1 | 50 | 24 | 1200 |
| TV and sat-receiver | 2 | 65 | 12 | 1560 |
| Laptop | 2 | 20 | 6 | 240 |
| Phone chargers | 3 | 18 | 1 | 54 |
| Electric stove | 1 | 500 | 1 | 500 |
| Water heater | 1 | 500 | 1 | 500 |
| Washing machine | 1 | 1000 | 2 | 2000 |
| Other loads | - | 500 | 1 | 500 |
| Total | 2733 | 10,534 |
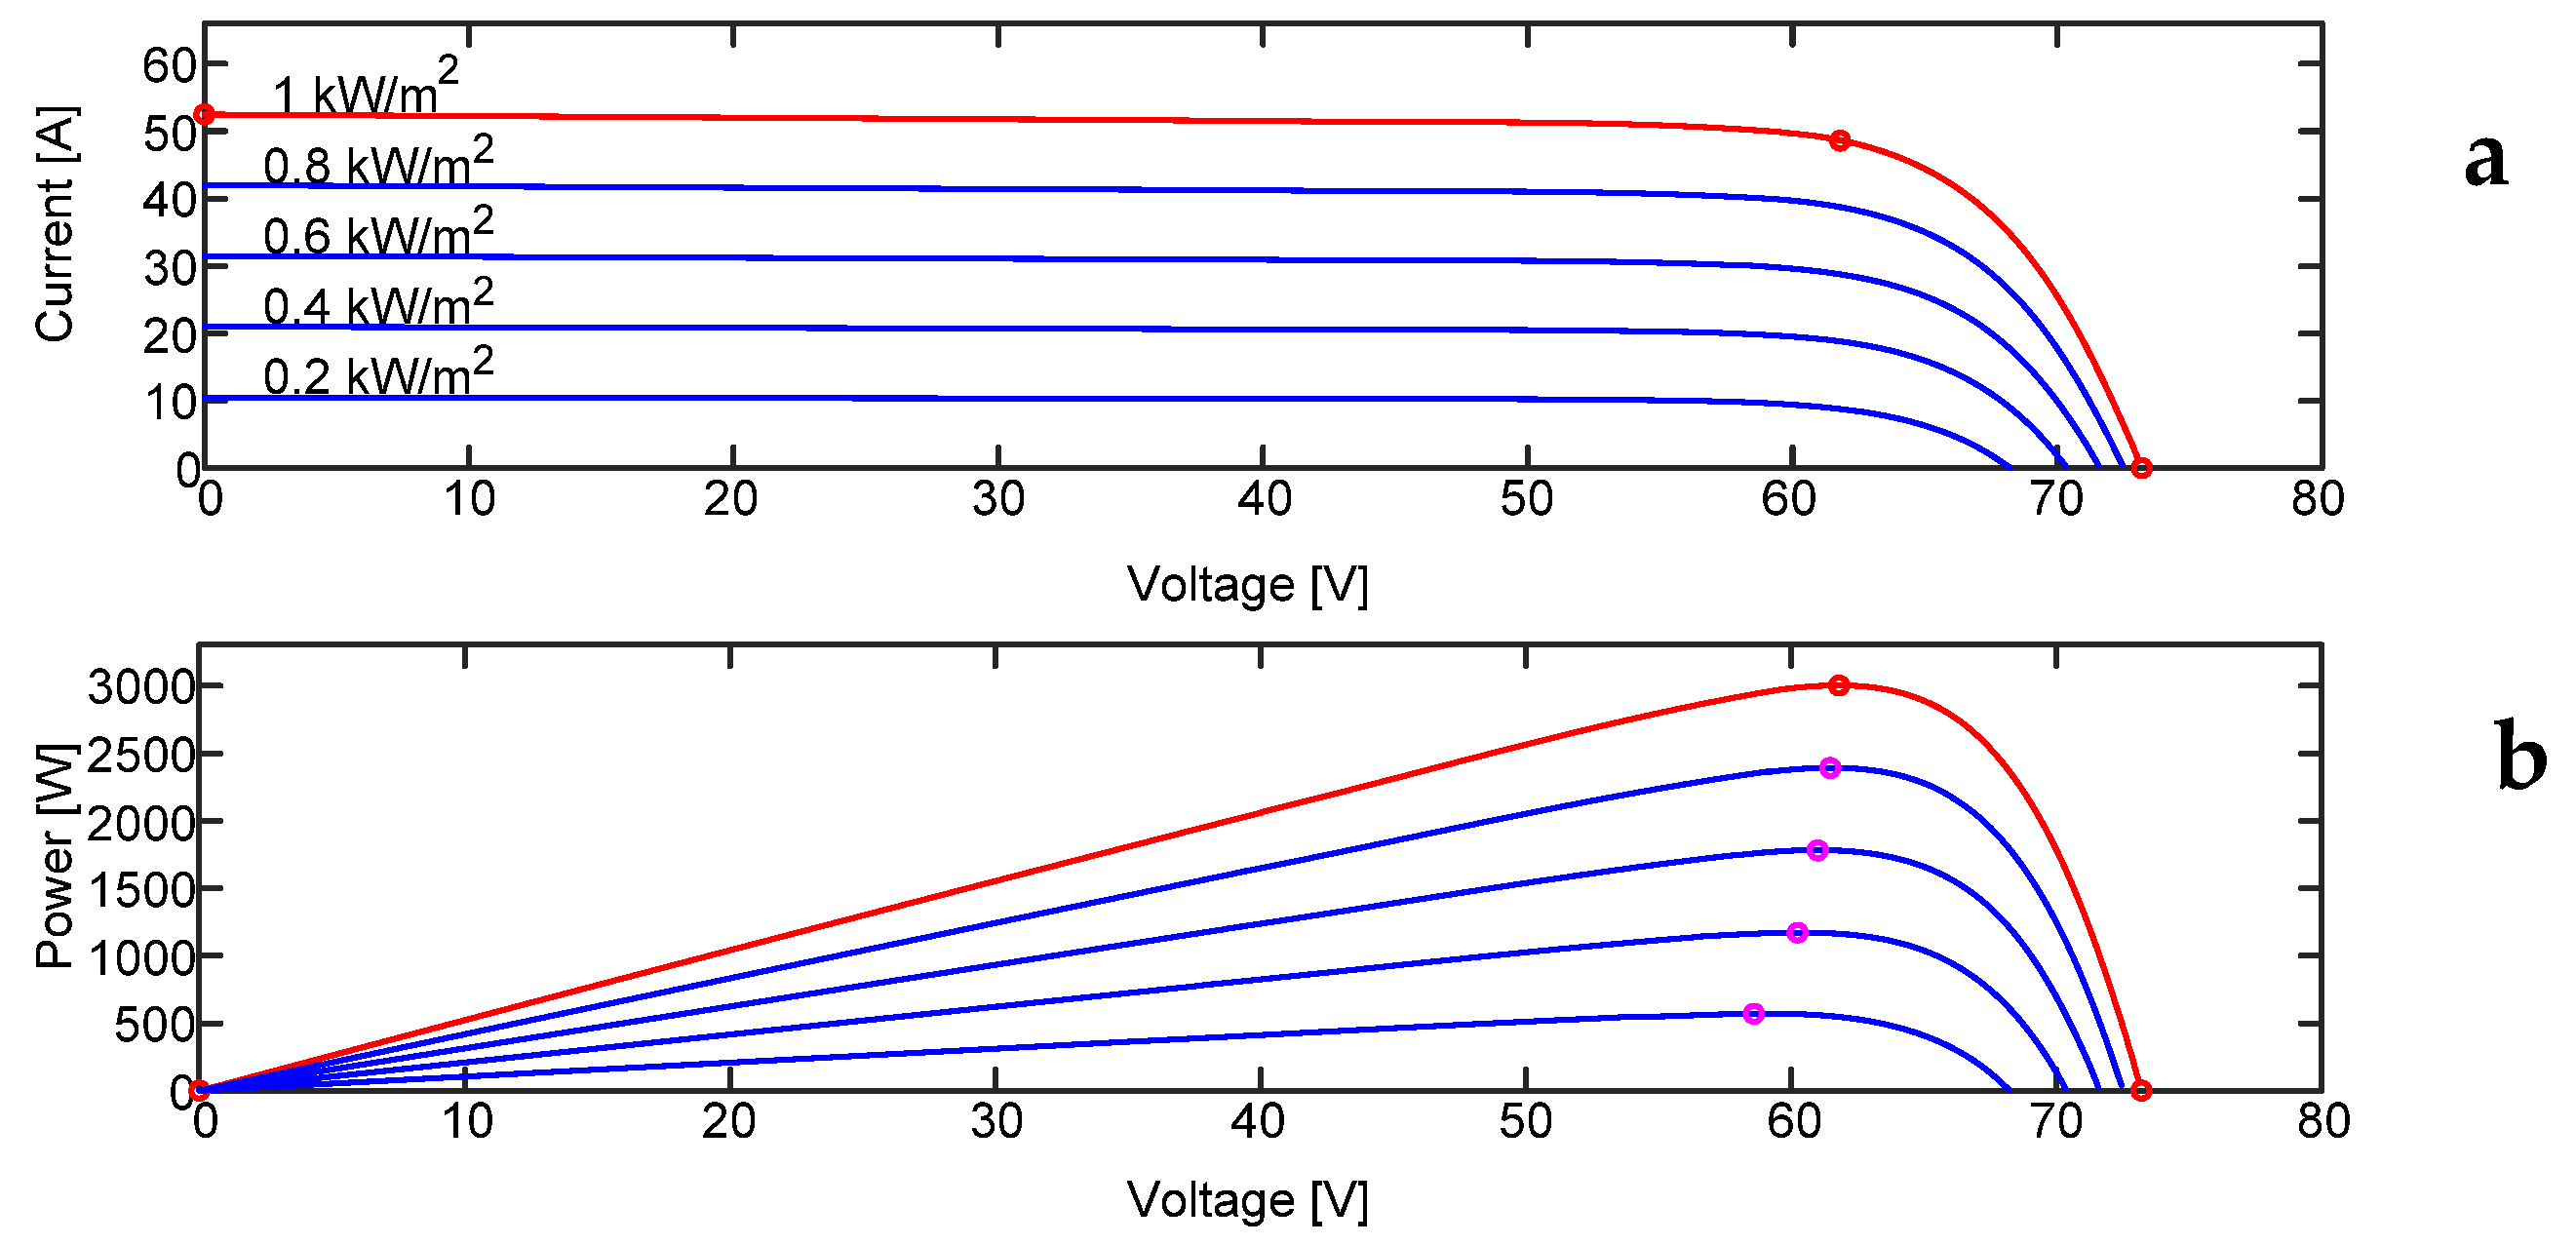
| Parameters | Values |
|---|---|
| Max. rate power | 250.29 W |
| Voltage at MPP (Vmpp) | 30.9 V |
| Current at MPP (Impp) | 8.1 A |
| Open circuit voltage (Voc) | 36.6 V |
| Short circuit current (Isc) | 8.75 A |
| Total energy of the array (Et) | 12.691 kWh/day |
| Peak power of the array (Pp) | 2.7 kW |
| Total number (TN) of modules (Nm) | 20 |
| TN of cells in series (Ns) | 2 |
| TN of cells in parallel (Np) | 10 |
| Parameters | Value |
|---|---|
| Fuel | Biogas |
| Available biomass | 0.1 Tonnes/day |
| Average price | 0.001 USD/Tonne |
| Carbon content | 55% |
| Density of biogas | 1.2 kg/m3 |
| LHV of biogas | 5.50 MJ/kg |
| Gasification ratio | 0.70 kg/kg |
| Fuel curve (FC) intercept | 0.480 kg/h |
| FC slope | 0.297 kg/h/kW |
| Parameters | Value |
|---|---|
| BB type | Lithium-ion |
| Nominal BB capacity | 100 Ah |
| Nominal BB voltage (Vb) | 12 V |
| Days of autonomy (DOA) | 24 h |
| Charging/discharging cycles | 3000 |
| Depth of discharge (DOD) | 80% |
| Round-trip efficiency of batteries (RTE) | 85% |
| TN of BBs in parallel (Nbp) | 6 |
| TN of BBs in series (Nbs) | 4 |
| TN of BBs (Nb) | 24 |
| Parameters | Value |
|---|---|
| Max. PV output power | 5 kW |
| Max. output current protection | 20 A |
| BB voltage | 48 V |
| Max. charge current | 75 A |
| Input AC voltage range | 100–230 VAC |
| AC output voltage | 100/110/220/230 VAC |
| SI efficiency | 98% |
| Parameters | Value |
|---|---|
| CC manufacturer | Sunny island |
| CC type | MPPT |
| Nominal voltage | 180–230 V |
| Max. continuous power | 2500 W |
| Input voltage range | 110–230 V |
| BB capacity | 100 Ah |
| Max. BB charging current | 75 A |
| BB voltage range | 36–60 V |
| CC efficiency | 95% |
| Architecture | Cost | System | Biomass Generator | |||||||||
|---|---|---|---|---|---|---|---|---|---|---|---|---|
| PV (kW) | BG (kW) | Battery (Number) | Converter (kW) | NPC (USD) | COE (USD) | OC (USD/Year) | ICC (USD) | RF (%) | TF (L/Year) | Hours | Production (kWh) | Fuel (L) |
| 5.75 | …… | 15 | 1.66 | USD 10.332 | USD 0.173 | USD 203.88 | USD 7.696 | 100 | 0 | …… | …… | ……. |
| 5.94 | 1.5 | 15 | 1.83 | USD 11.026 | USD 0.184 | USD 225.26 | USD 8.114 | 99.9 | 2.40 | 2 | 3 | 2.40 |
| …… | 1.5 | 5 | 1.5 | USD 486.637 | USD 8.13 | USD 37.493 | USD 1.950 | 0 | 3.995 | 3.329 | 4.994 | 3.995 |
| 39 | 1.5 | …… | 1.87 | USD 751.342 | USD 12.55 | USD 56.247 | USD 24.213 | 0 | 5.974 | 4.978 | 7.467 | 5.974 |
| …… | 1.5 | …… | …… | USD 1.27 M | USD 21.22 | USD 98.283 | USD 250 | 0 | 10.512 | 8.760 | 13.140 | 10.512 |
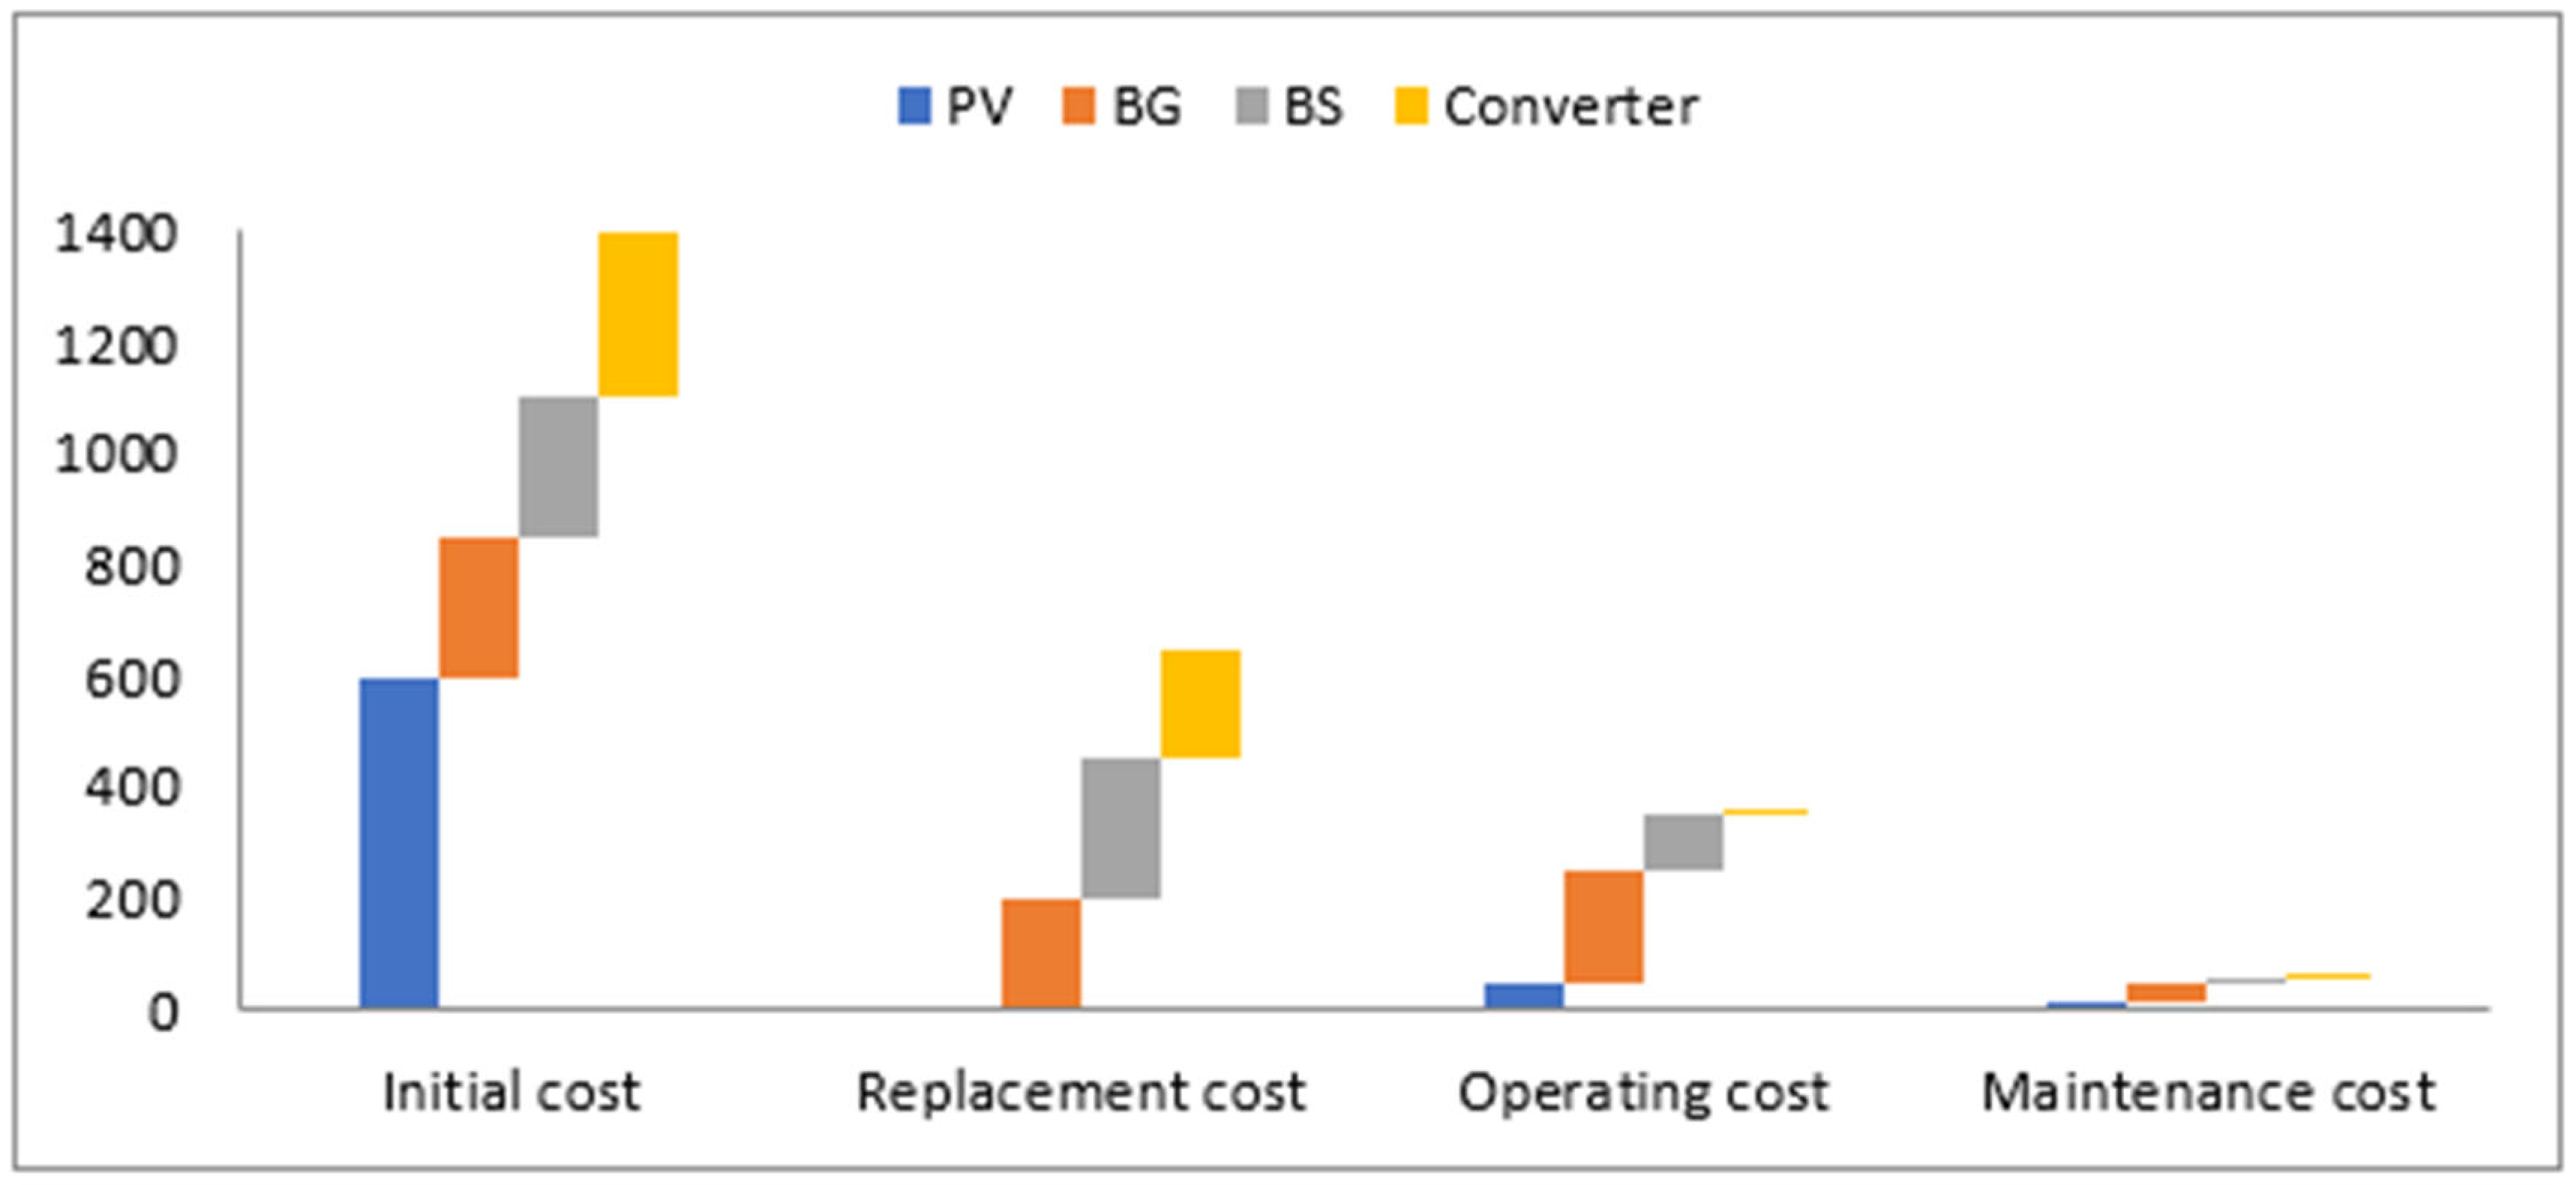
| HGEF Components | Parameters | Value | Unit |
|---|---|---|---|
| PV | Lifetime | 25 | y |
| Hours of operating | 4366 | h/y | |
| Initial cost | 600 | USD/kW | |
| Replacement cost | 0 | USD/kW | |
| O and M cost | 0.01 | USD/kW/y | |
| CO2 emission | 0.0225 | kg/kWh | |
| Operation temperature | 45 | °C | |
| Efficiency | 17.3 | % | |
| BG | Lifetime | 216,000 | h |
| Hours of operating | 603 | h/y | |
| Initial cost | 250 | USD/kW | |
| Replacement cost | 200 | USD/kW | |
| O and M cost | 0.59 | USD/kW/y | |
| Fixed generation cost | 0.633 | USD/h | |
| CO2 emission | 0.88 | kg/kWh | |
| BB | Lifetime | 10 | y |
| Expected life | 150,000 | kWh | |
| Initial cost | 250 | USD/kW | |
| Replacement cost | 250 | USD/kW | |
| O and M cost | 0.01 | USD/kW/y | |
| CO2 emission | 0.028 | kg/kWh | |
| Efficiency | 85 | % | |
| Converter | Lifetime | 15 | Y |
| Hours of operating | 8157 | h/y | |
| Initial cost | 300 | USD/kW | |
| Replacement cost | 200 | USD/kW | |
| Efficiency | 98 | % |
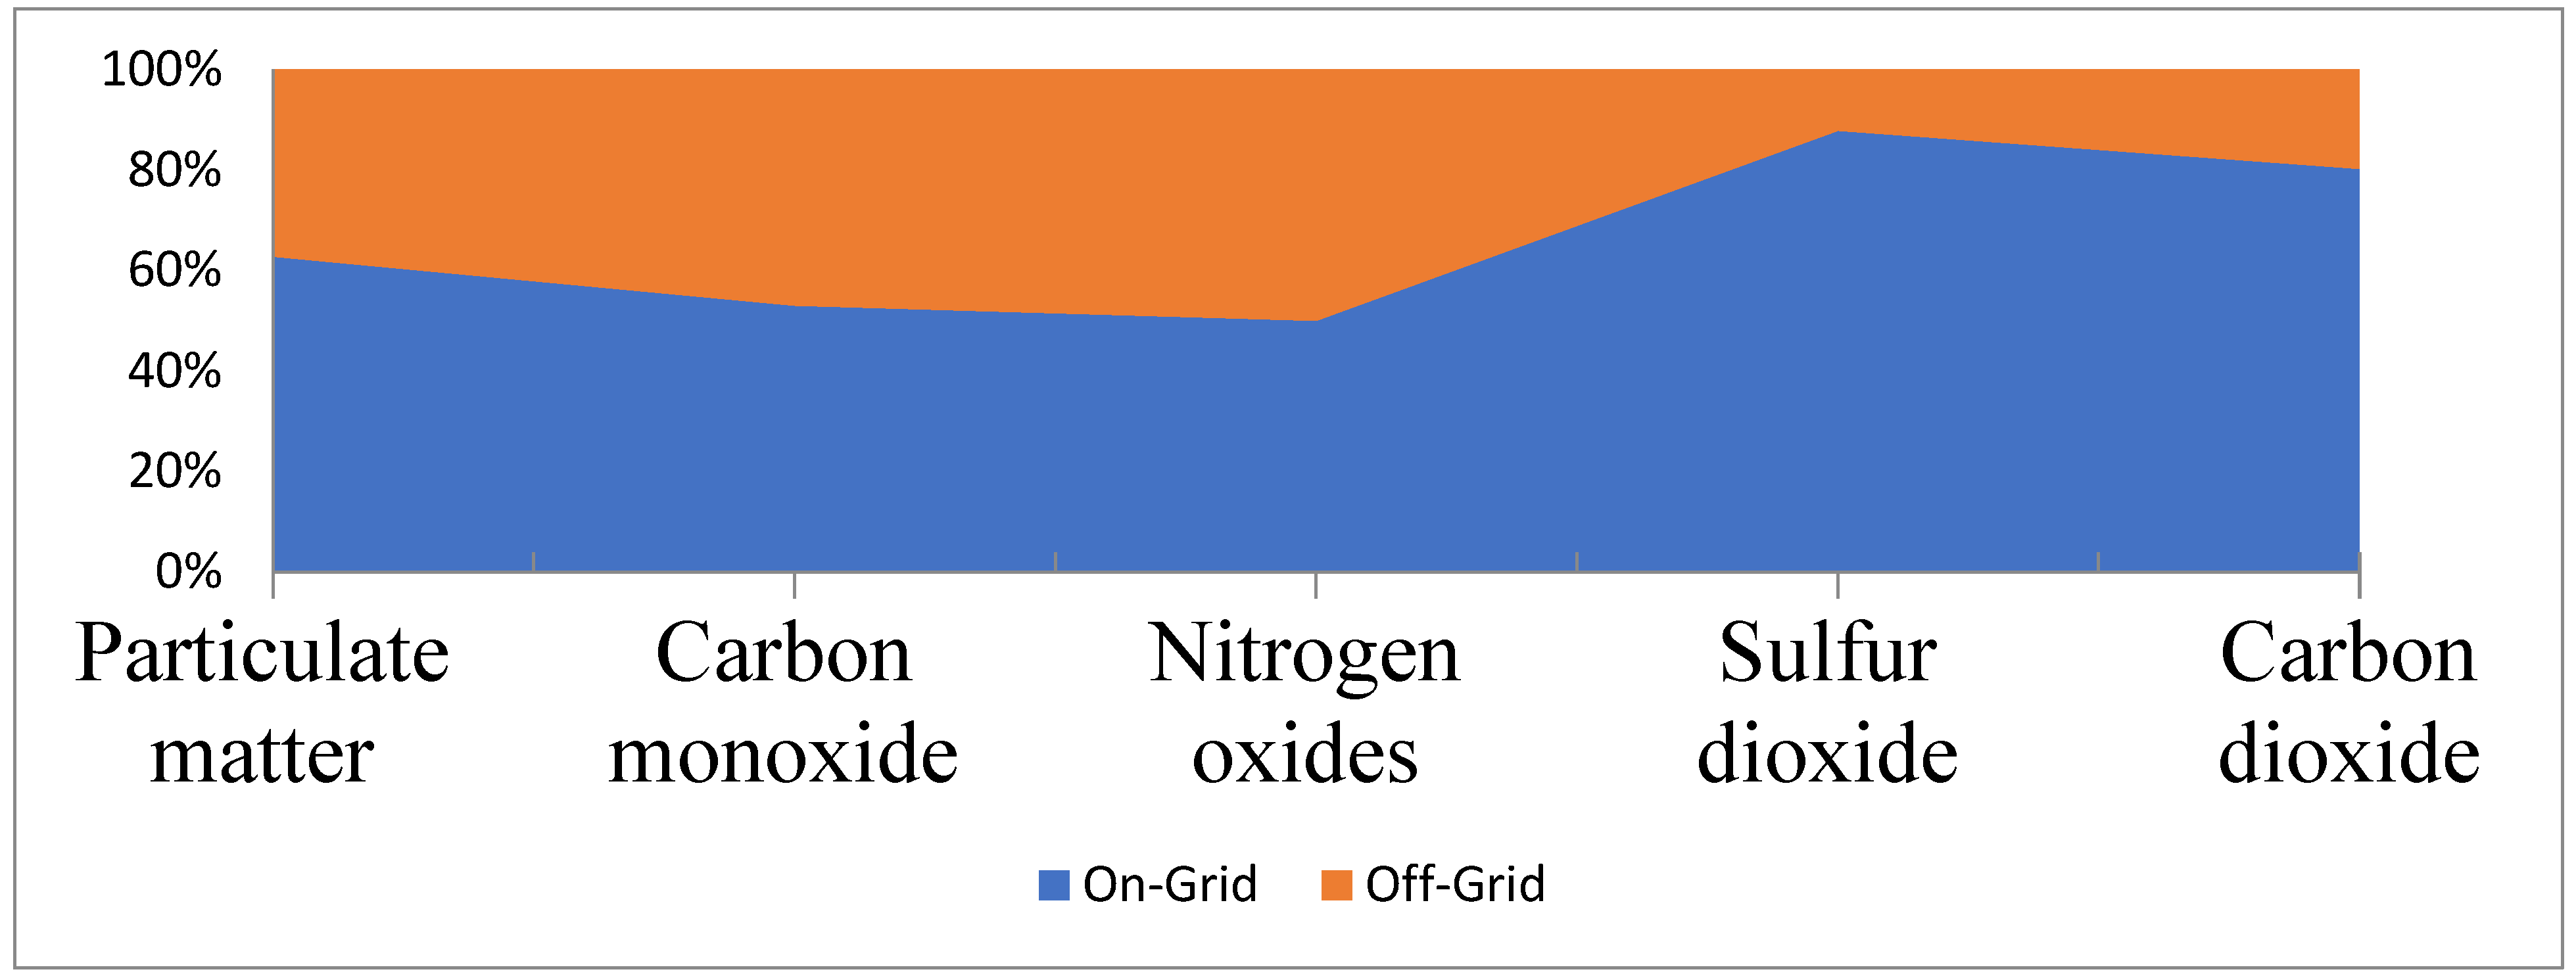
| GHG Emission | Formula | PV/BG | PV/Diesel | Grid Only |
|---|---|---|---|---|
| Factors (kg/Year) | ||||
| Particulate matter | PM2.5 | 0.00183 | 0.261 | 0.44 |
| Carbon monoxide | CO | 0.0301 | 4.3 | 4.85 |
| Nitrogen oxides | NOX | 0.0342 | 4.88 | 4.89 |
| Sulfur dioxide | SO2 | 0 | 1.39 | 10 |
| Carbon dioxide | CO2 | 0.9305 | 568 | 2307 |
Disclaimer/Publisher’s Note: The statements, opinions and data contained in all publications are solely those of the individual author(s) and contributor(s) and not of MDPI and/or the editor(s). MDPI and/or the editor(s) disclaim responsibility for any injury to people or property resulting from any ideas, methods, instructions or products referred to in the content. |
© 2024 by the authors. Licensee MDPI, Basel, Switzerland. This article is an open access article distributed under the terms and conditions of the Creative Commons Attribution (CC BY) license (https://creativecommons.org/licenses/by/4.0/).
Share and Cite
Kassem, R.; Mahmoud, M.M.; Ibrahim, N.F.; Alkuhayli, A.; Khaled, U.; Beroual, A.; Saleeb, H. A Techno-Economic-Environmental Feasibility Study of Residential Solar Photovoltaic/Biomass Power Generation for Rural Electrification: A Real Case Study. Sustainability 2024, 16, 2036. https://doi.org/10.3390/su16052036
Kassem R, Mahmoud MM, Ibrahim NF, Alkuhayli A, Khaled U, Beroual A, Saleeb H. A Techno-Economic-Environmental Feasibility Study of Residential Solar Photovoltaic/Biomass Power Generation for Rural Electrification: A Real Case Study. Sustainability. 2024; 16(5):2036. https://doi.org/10.3390/su16052036
Chicago/Turabian StyleKassem, Rasha, Mohamed Metwally Mahmoud, Nagwa F. Ibrahim, Abdulaziz Alkuhayli, Usama Khaled, Abderrahmane Beroual, and Hedra Saleeb. 2024. "A Techno-Economic-Environmental Feasibility Study of Residential Solar Photovoltaic/Biomass Power Generation for Rural Electrification: A Real Case Study" Sustainability 16, no. 5: 2036. https://doi.org/10.3390/su16052036
APA StyleKassem, R., Mahmoud, M. M., Ibrahim, N. F., Alkuhayli, A., Khaled, U., Beroual, A., & Saleeb, H. (2024). A Techno-Economic-Environmental Feasibility Study of Residential Solar Photovoltaic/Biomass Power Generation for Rural Electrification: A Real Case Study. Sustainability, 16(5), 2036. https://doi.org/10.3390/su16052036