Abstract
A profound analysis of China’s research achievements in the realm of carbon emissions holds the potential to furnish insightful references for analogous endeavors and inquiries in other nations. Employing the CiteSpace tool, this paper identifies five major focal points in Chinese scholars’ research on carbon emissions: carbon emission computation and prediction, influencing factors of carbon emissions, carbon footprint, carbon emission efficiency, and differential analysis of carbon emissions. Subsequently, this article systematically scrutinizes and dissects the outcomes of Chinese scholars’ endeavors in the aforementioned five focal points, culminating in recommending China’s forthcoming research on carbon emissions. (1) The research findings reveal a diversified evolution in the methods employed for calculating and predicting carbon emissions in China. However, due to the limited exploration of delineating carbon emission boundaries, instances of overlap and deviation in carbon emission quantification have emerged. (2) Factors influencing carbon emissions can be categorized into five major classes: economic, demographic, energy-related, policy-driven, and others. Yet, studies investigating industry-specific influencing factors remain relatively scarce. (3) Overcoming challenges associated with cross-boundary measurements, comprehensive effects, and policy applications is imperative in carbon footprint research. (4) Significantly disparate levels of carbon emission efficiency prevail across distinct regions or industries, with intricacies characterizing the influencing factors and a notable dearth of micro-level investigations. (5) The analysis of carbon emission differentials primarily encompasses regional disparities, industrial differentials, and temporal variations, lacking sustained tracking studies on the nuances of carbon emission disparities.
1. Introduction
Despite a deceleration in the global growth rate of carbon emissions since 2010 and a negative growth observed in global carbon emissions in 2020, the challenges posed by the global carbon emission issue persist. In 2022, global carbon emissions reached a staggering 366 billion tons, presenting a formidable challenge to the global ecological environment [1]. The management and mitigation of carbon emissions constitute a pivotal facet in realizing regional sustainable development, spanning across various dimensions encompassing environmental, economic, and societal realms. Carbon emissions, as a prominent greenhouse gas, directly influence climate dynamics. Excessive carbon emissions contribute to global temperature escalation, rising sea levels, and other environmental predicaments, precipitating irreversible impacts on regional ecosystems and natural resources. Addressing carbon emissions in the developmental context steers enterprises towards adopting more environmentally conscious production methods, augmenting resource efficiency, and thereby fostering regional economic sustainability. Carbon reduction endeavors can ameliorate air quality, mitigate environmental pollution, and elevate the quality of life for residents, bearing paramount significance for the health of regional societies and their residential environments.
As the world’s largest carbon emitter and the second-largest economy globally, China’s research achievements in carbon emissions wield a catalyzing effect on global carbon reduction [2]. For instance, the Chinese government’s initiatives, such as advancing carbon market construction and implementing carbon taxation policies, have proven effective in reducing the nation’s carbon emissions. Consequently, a comprehensive analysis of China’s research outcomes in the field of carbon emissions holds the potential to furnish valuable insights for analogous endeavors and inquiries in other countries. Furthermore, by comprehensively reviewing carbon emission research in China, this study contributes to a more nuanced understanding of the current state of research in the field. It provides a profound academic background and identifies potential avenues for future research, offering valuable insights for academic scholars. Additionally, such insights can serve as a scientific basis for decision making by the Chinese government, fostering sustainable economic development, enhancing environmental quality, and propelling the nation towards a low-carbon, green future.
The primary objective of this paper is to conduct an in-depth analysis of the developmental trajectory of carbon emission research in China. It systematically reviews pertinent themes, reveals their evolutionary trends, and explores potential challenges that may be encountered in the future. This paper employs the CiteSpace tool to conduct a quantitative and keyword analysis of research publications by Chinese scholars in the Web of Science database. This analysis aims to discern the evolving trends and research themes of Chinese scholars in the realm of carbon emissions. Subsequently, the paper systematically reviews and appraises the outcomes of Chinese scholars’ research on carbon emissions from five perspectives: carbon emission calculations and predictions, influencing factors of carbon emission (CE), carbon footprint, carbon emission efficiency (CEE), and differential analysis of CE. In conclusion, the paper provides recommendations for the next phase of CE research by Chinese scholars.
2. Research Design
2.1. Method Statement
Bibliometrics is a method of assessing the impact and contribution of research through a quantitative analysis of the scientific literature. There are numerous software tools available for conducting bibliometric analyses. Common bibliometric software tools include Bibexcel 1.0, Ucinet 6.8, and Citespace 6.2. Among them, Bibexcel is suitable for providing assistance as a visualization tool. Ucinet serves as a social network analysis tool, particularly adept at analyzing large datasets. Citespace, on the other hand, is a more comprehensive bibliometric software tool specialized for literature analysis [3]. In this paper, we utilize Citespace to analyze the research outcomes of Chinese scholars in the field of carbon emissions, encompassing analyses of research themes, evolutionary trends, and future challenges.
CiteSpace constructs a network graph of literature citations, utilizing algorithms to identify clusters and key nodes within the citation network. It incorporates temporal information for spatiotemporal analysis, aiding researchers in exploring academic literature and revealing evolutionary patterns and crucial insights within a discipline. Furthermore, compared to other bibliometric tools, CiteSpace boasts several advantages. As open-source software, CiteSpace benefits from widespread engagement and application within the research community. Its robust visualization capabilities generate citation networks, cluster maps, spatiotemporal evolution graphs, and other visual representations, offering an intuitive portrayal of literature relationships and disciplinary development trends. Moreover, it supports large-scale data analysis, making it suitable for handling extensive literature databases and providing users with comprehensive and in-depth bibliometric insights. Ultimately, CiteSpace stands as a potent open-source bibliometric tool with multifaceted functionalities. It facilitates the construction of visual citation networks through citation network analysis, allowing users to gain profound insights into citation chains and academic exchanges. With support for spatiotemporal analysis, CiteSpace enables users to observe the evolutionary processes of the literature over time, uncovering trends, key nodes, and research hotspots within a discipline. Additionally, CiteSpace provides clustering and keyword co-occurrence analysis, aiding users in identifying research hotspots and subfields within a discipline.
2.2. Data Statement
Web of Science (WOS) is a crucial platform for accessing academic information. In this study, we utilized the Social Sciences Citation Index (SSCI) within the WOS database, focusing on the theme “CE*”. We narrowed the search down to the document type “Article” and selected the country category as “PEOPLES R CHINA”. The retrieval spanned from 2003 to 2023, resulting in a total of 12,721 relevant papers. Subsequently, per CiteSpace tool requirements, we exported the retrieved paper data and employed the COOC tool to clean the exported data, specifically emphasizing merging and deleting synonyms within keywords. Finally, leveraging the specialized literature analysis tool CiteSpace, we analyzed the obtained literature, unveiling the research themes and evolutionary trends in the field of carbon emissions among Chinese scholars over the past two decades [4].
3. Review of Research Achievements in Carbon Emission in China
3.1. Analysis of Publication Volume, Journal Level, and Keyword Analysis
3.1.1. Analysis of Publication Volume
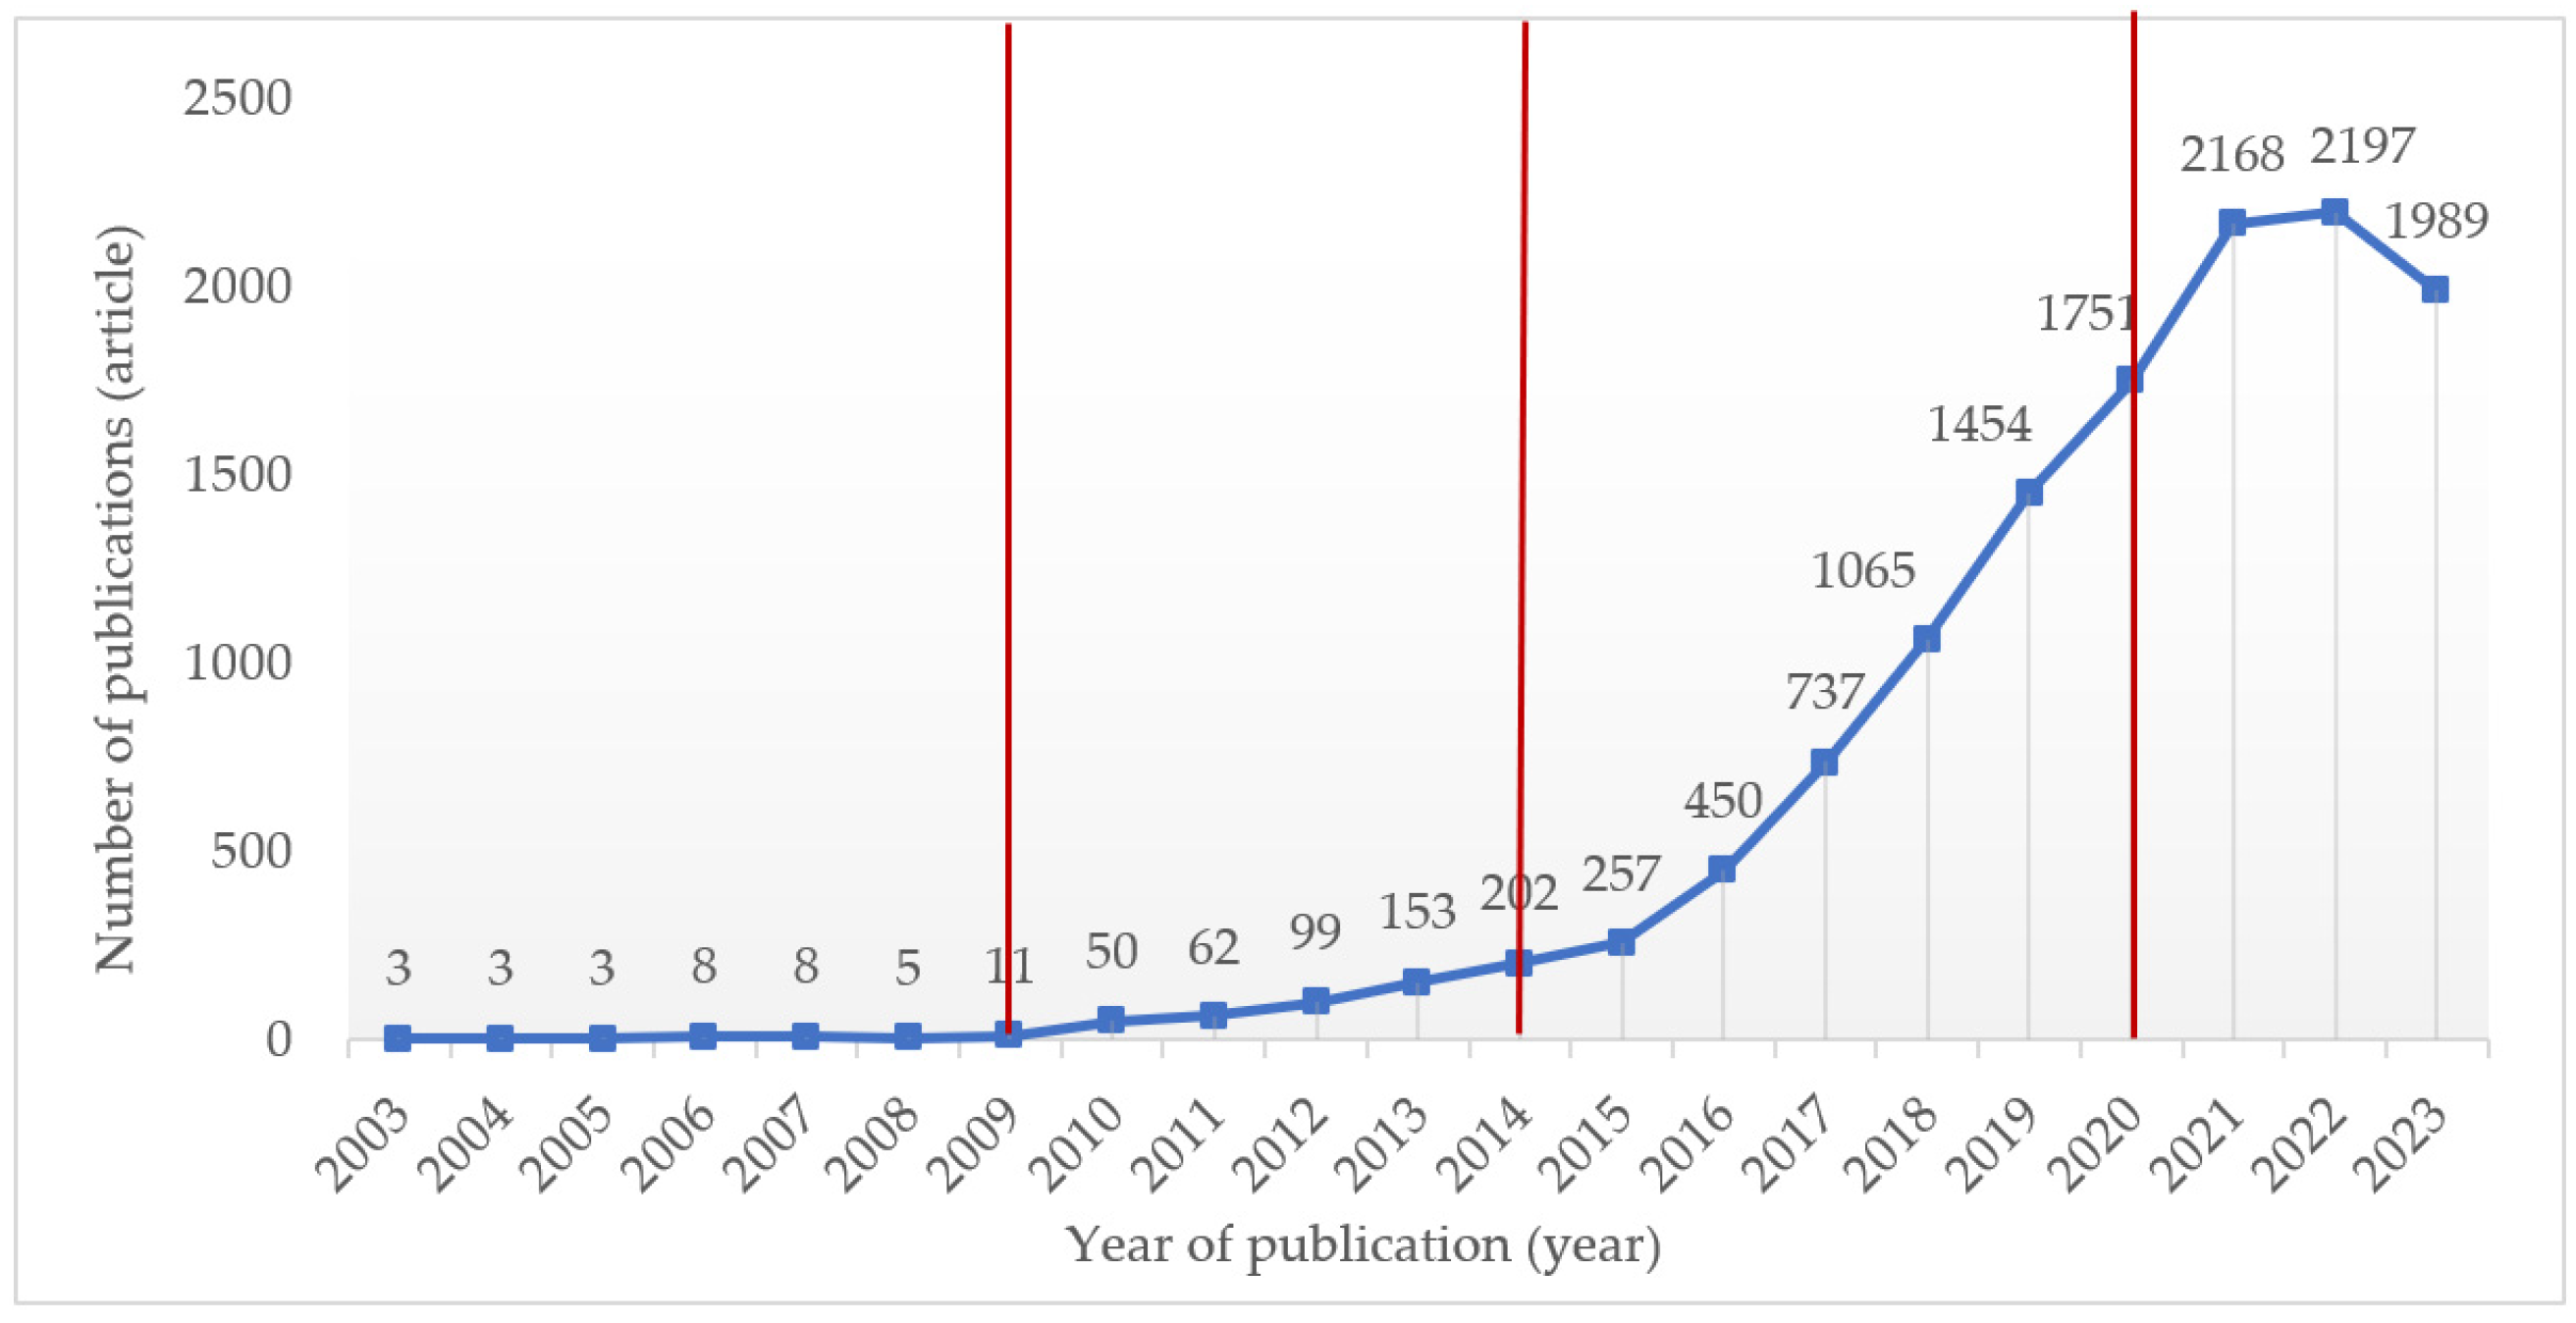
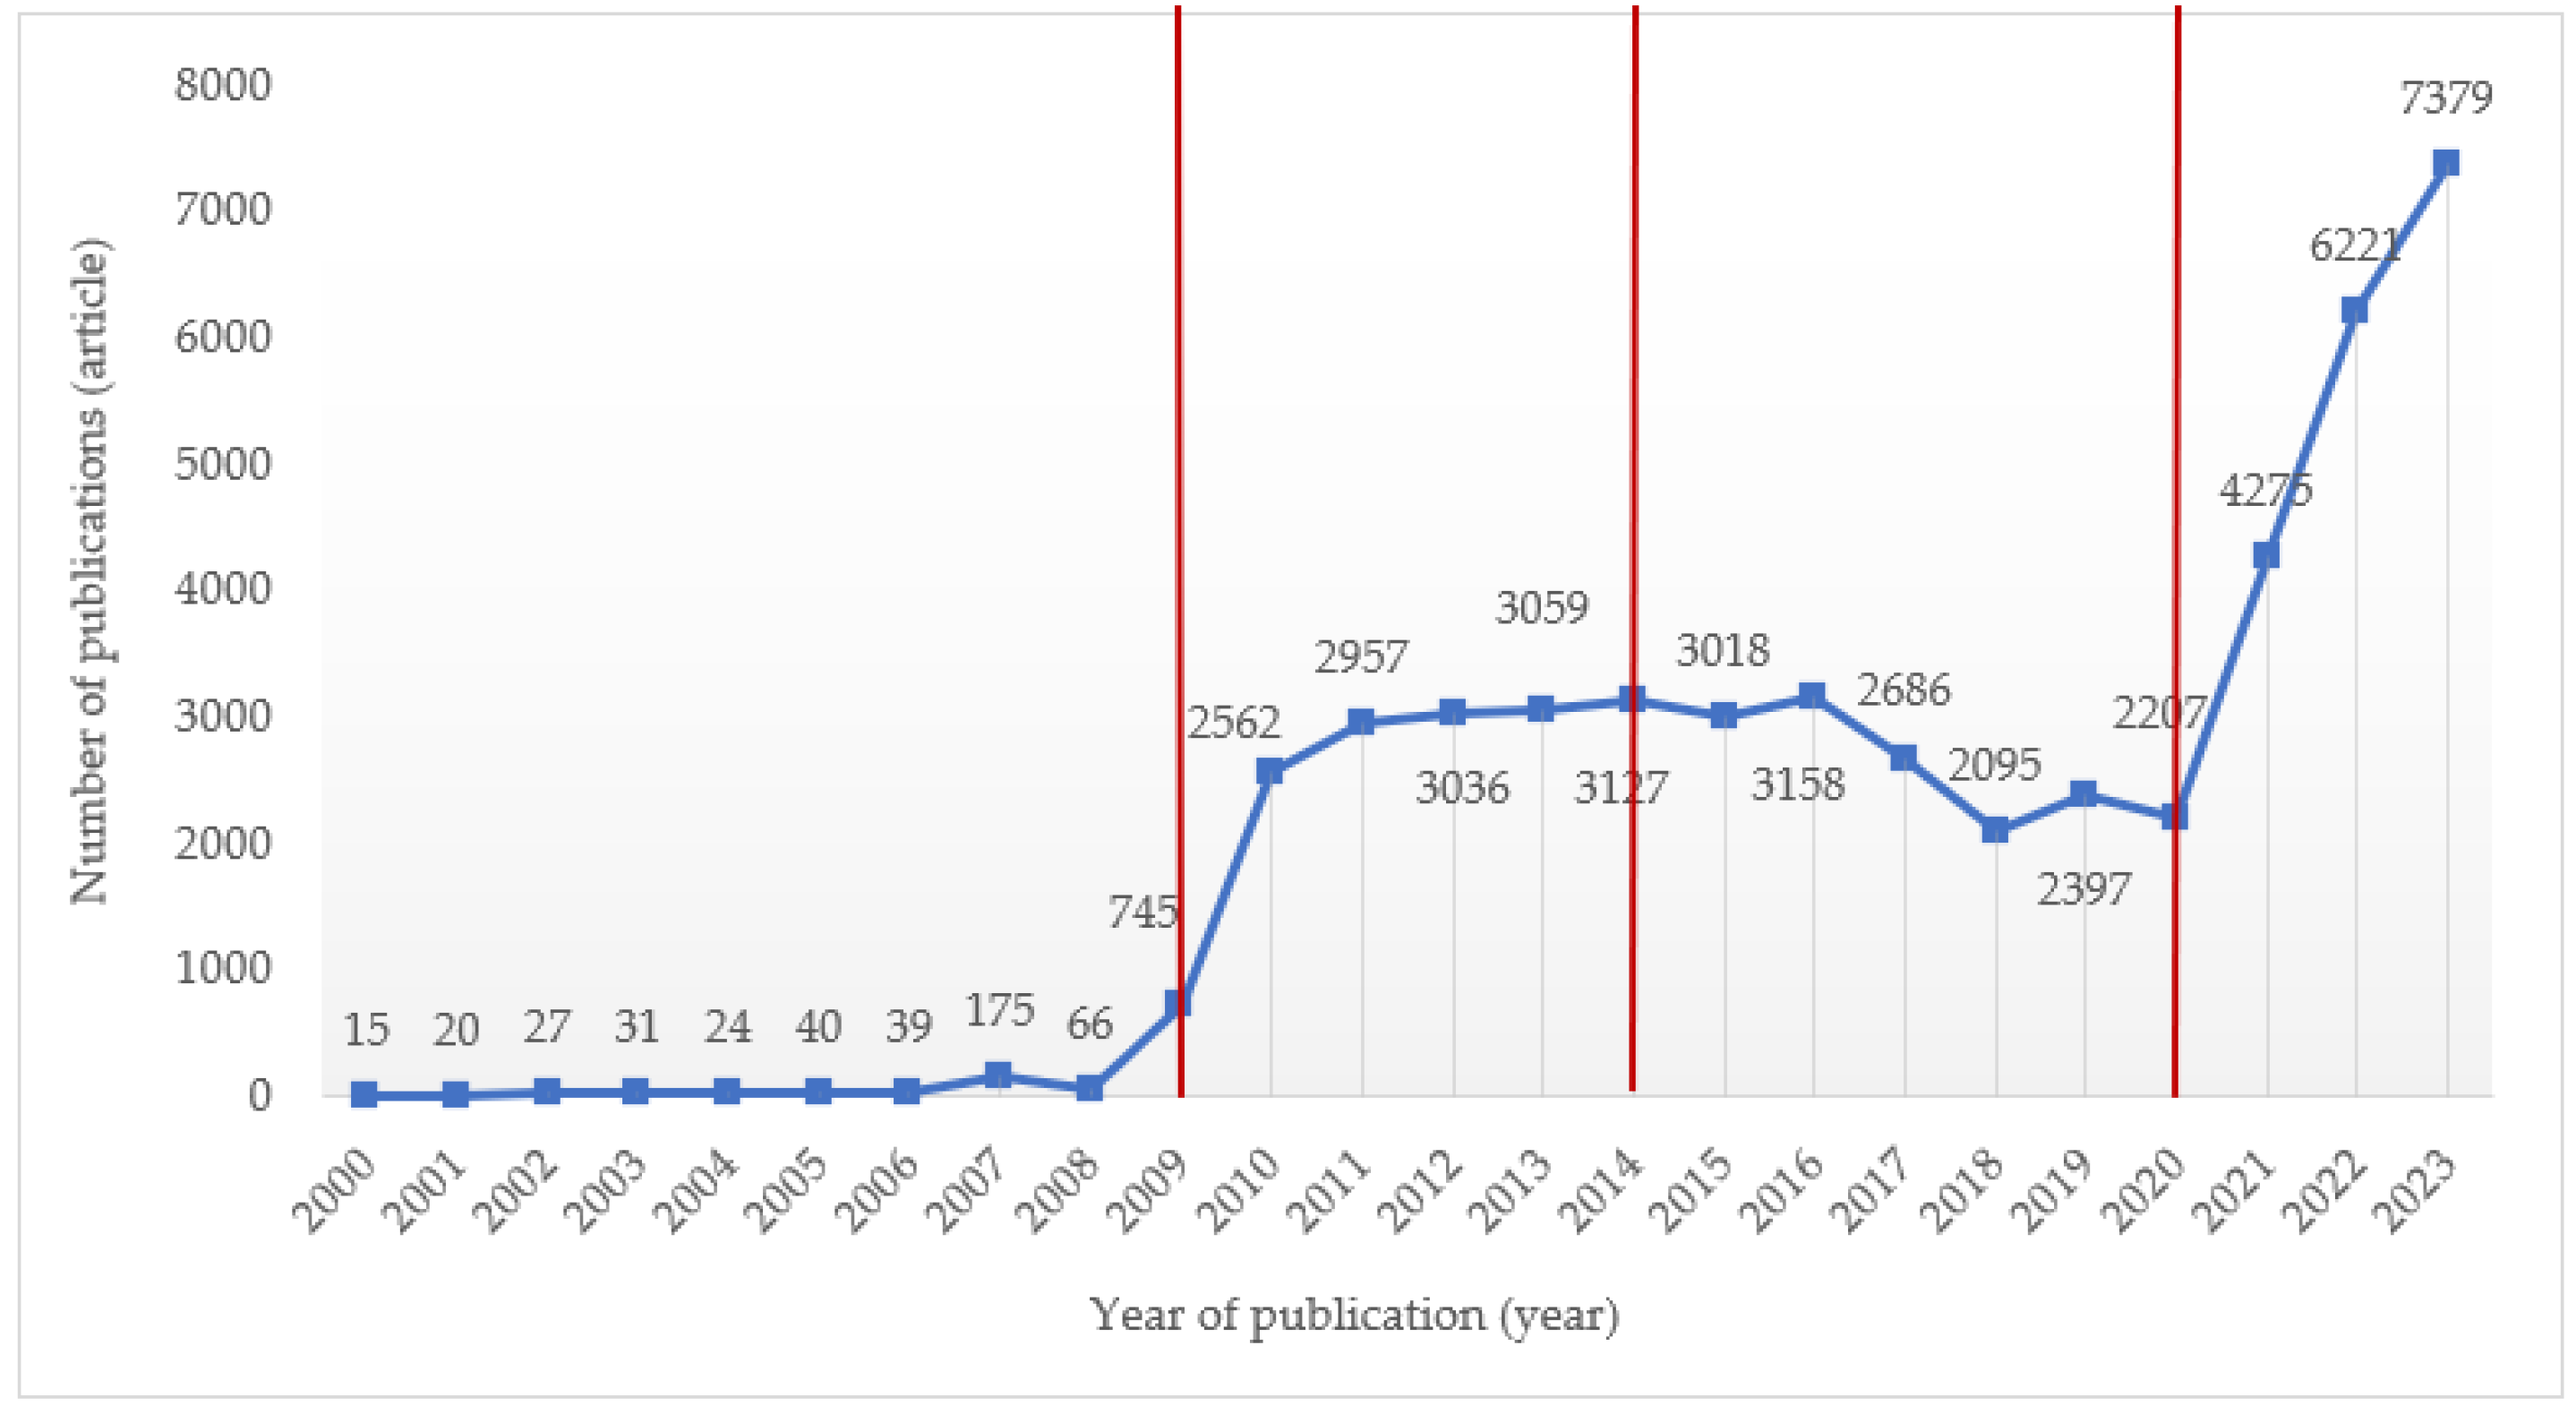
Carbon emissions represent a current focal point in academic research, with a sustained upward trajectory evident in the number of relevant papers authored by Chinese scholars, as illustrated in Figure 1 and Figure 2. Examining the distribution of paper quantities over the past two decades, the research journey of carbon emissions in China can be delineated into four distinct phases.
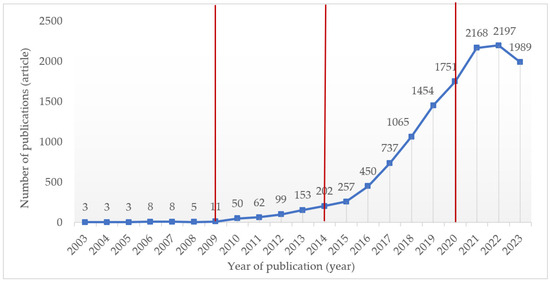
Figure 1.
Number of CE research papers published by Chinese scholars in international journals from 1 January 2003 to 31 December 2023.
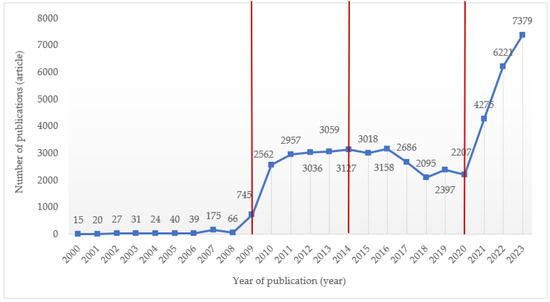
Figure 2.
Number of CE research papers published by Chinese scholars in Chinese journals from 1 January 2000 to 31 December 2023.
Phase One (2003–2009) marked the initial stage of research and policy formulation. The number of published papers increased from 3 to 11. During this phase, there were relatively few research outcomes on carbon emissions in China, reflecting a lower level of government attention to the issue, and CE control policies had yet to be implemented. Phase Two (2010–2014) witnessed incremental growth and policy deepening. The number of published papers increased from 50 to 202. CE research in China gradually increased, accompanied by the progressive implementation of government policies addressing carbon emissions. Initiatives such as evaluating carbon emissions per unit of GDP, advancing low-carbon cities, and piloting carbon markets were introduced during this period. Phase Three (2015–2019) was characterized by rapid growth and global attention. The number of published papers increased from 257 to 1751. The Chinese government committed to achieving a carbon peak by 2030, prompting Chinese scholars to actively explore carbon reduction strategies, leading to a sharp increase in research outcomes. Phase Four (2020–2023) represents continuous growth and a pursuit of carbon neutrality. The number of published papers has remained stable at around 2000. With the Chinese government setting the goal of carbon neutrality by 2060, research outcomes by Chinese scholars in the field of carbon emissions continue to escalate.
In summary, CE research in China has made significant strides over the past two decades. China has emerged as a key participant in the global field of CE research, providing crucial support in addressing climate change challenges.
3.1.2. Analysis of Journal Level
Utilizing the Journal Citation Reports (JCR) tool, we analyzed the impact factors of papers authored by Chinese scholars on carbon emissions. JCR employs statistical computations based on citation data among journals, categorizing them into different quartiles (Q1, Q2, Q3, Q4) according to their citation performance. A higher impact factor indicates increased citation rates for the articles within, signifying the influence of the research outcomes reported, and also underscores the elevated scholarly standing of the respective journal.
Among the 12,721 carbon emission-related papers published by Chinese scholars, contributions to Q1, Q2, Q3, and Q4 journals amounted to 4501, 2936, 4555, and 729, respectively. Notably, articles featured in Q1 journals constitute 35% of the total sample. The top-ranking Q1 journals include the Journal of Cleaner Production, Applied Energy, and Energy, highlighting the substantial quality and impact of Chinese scholars’ research achievements in the field of carbon emissions. This underscores their significant contributions to advancing the domain of carbon emissions.
3.1.3. Analysis of Keywords
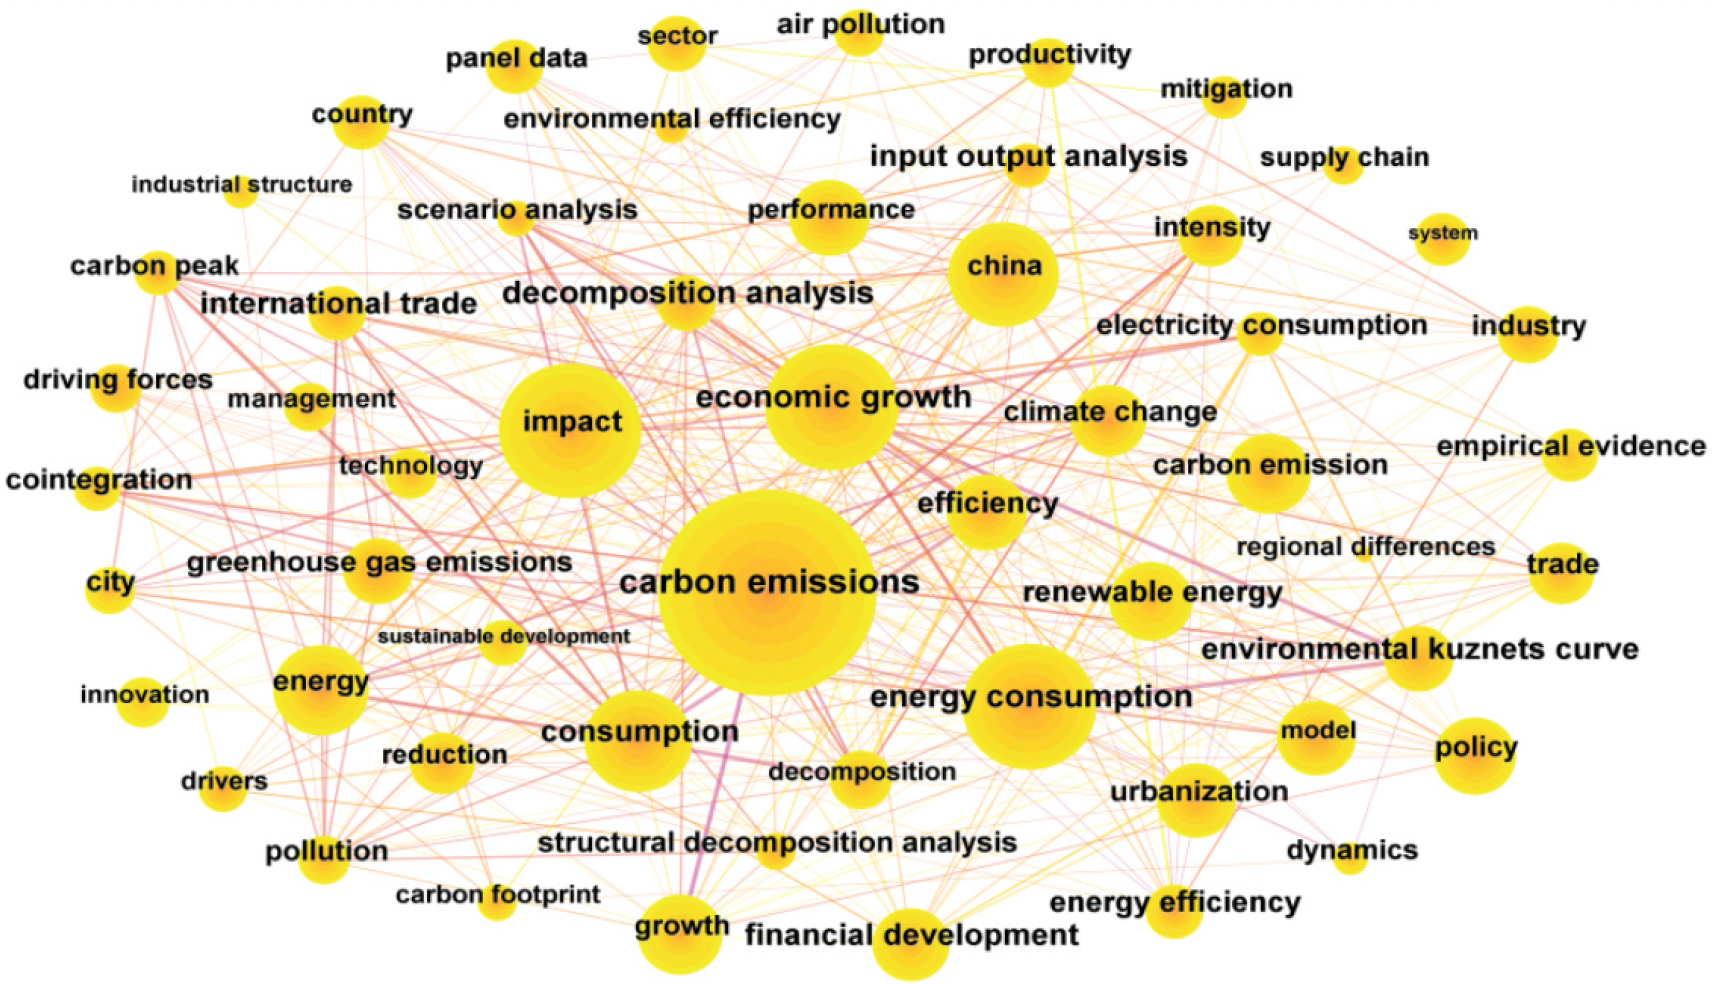
Keywords serve as the essence of a paper, encapsulating its core perspectives and providing a high-level summary. Leveraging the CiteSpace tool, this paper utilizes the generated keyword co-occurrence network (illustrated in Figure 3) and keyword timeline graph (illustrated in Figure 4) to systematically delineate the research themes and evolutionary trends in China’s CE studies over the past two decades.
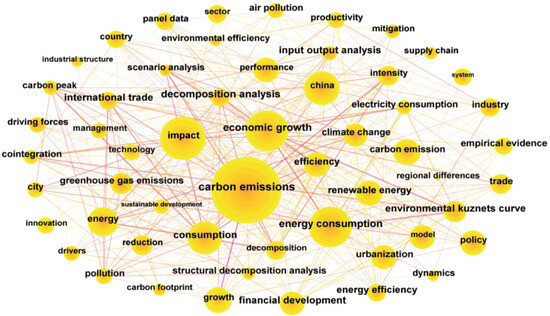
Figure 3.
The keyword co-occurrence network of China’s carbon emission research papers.

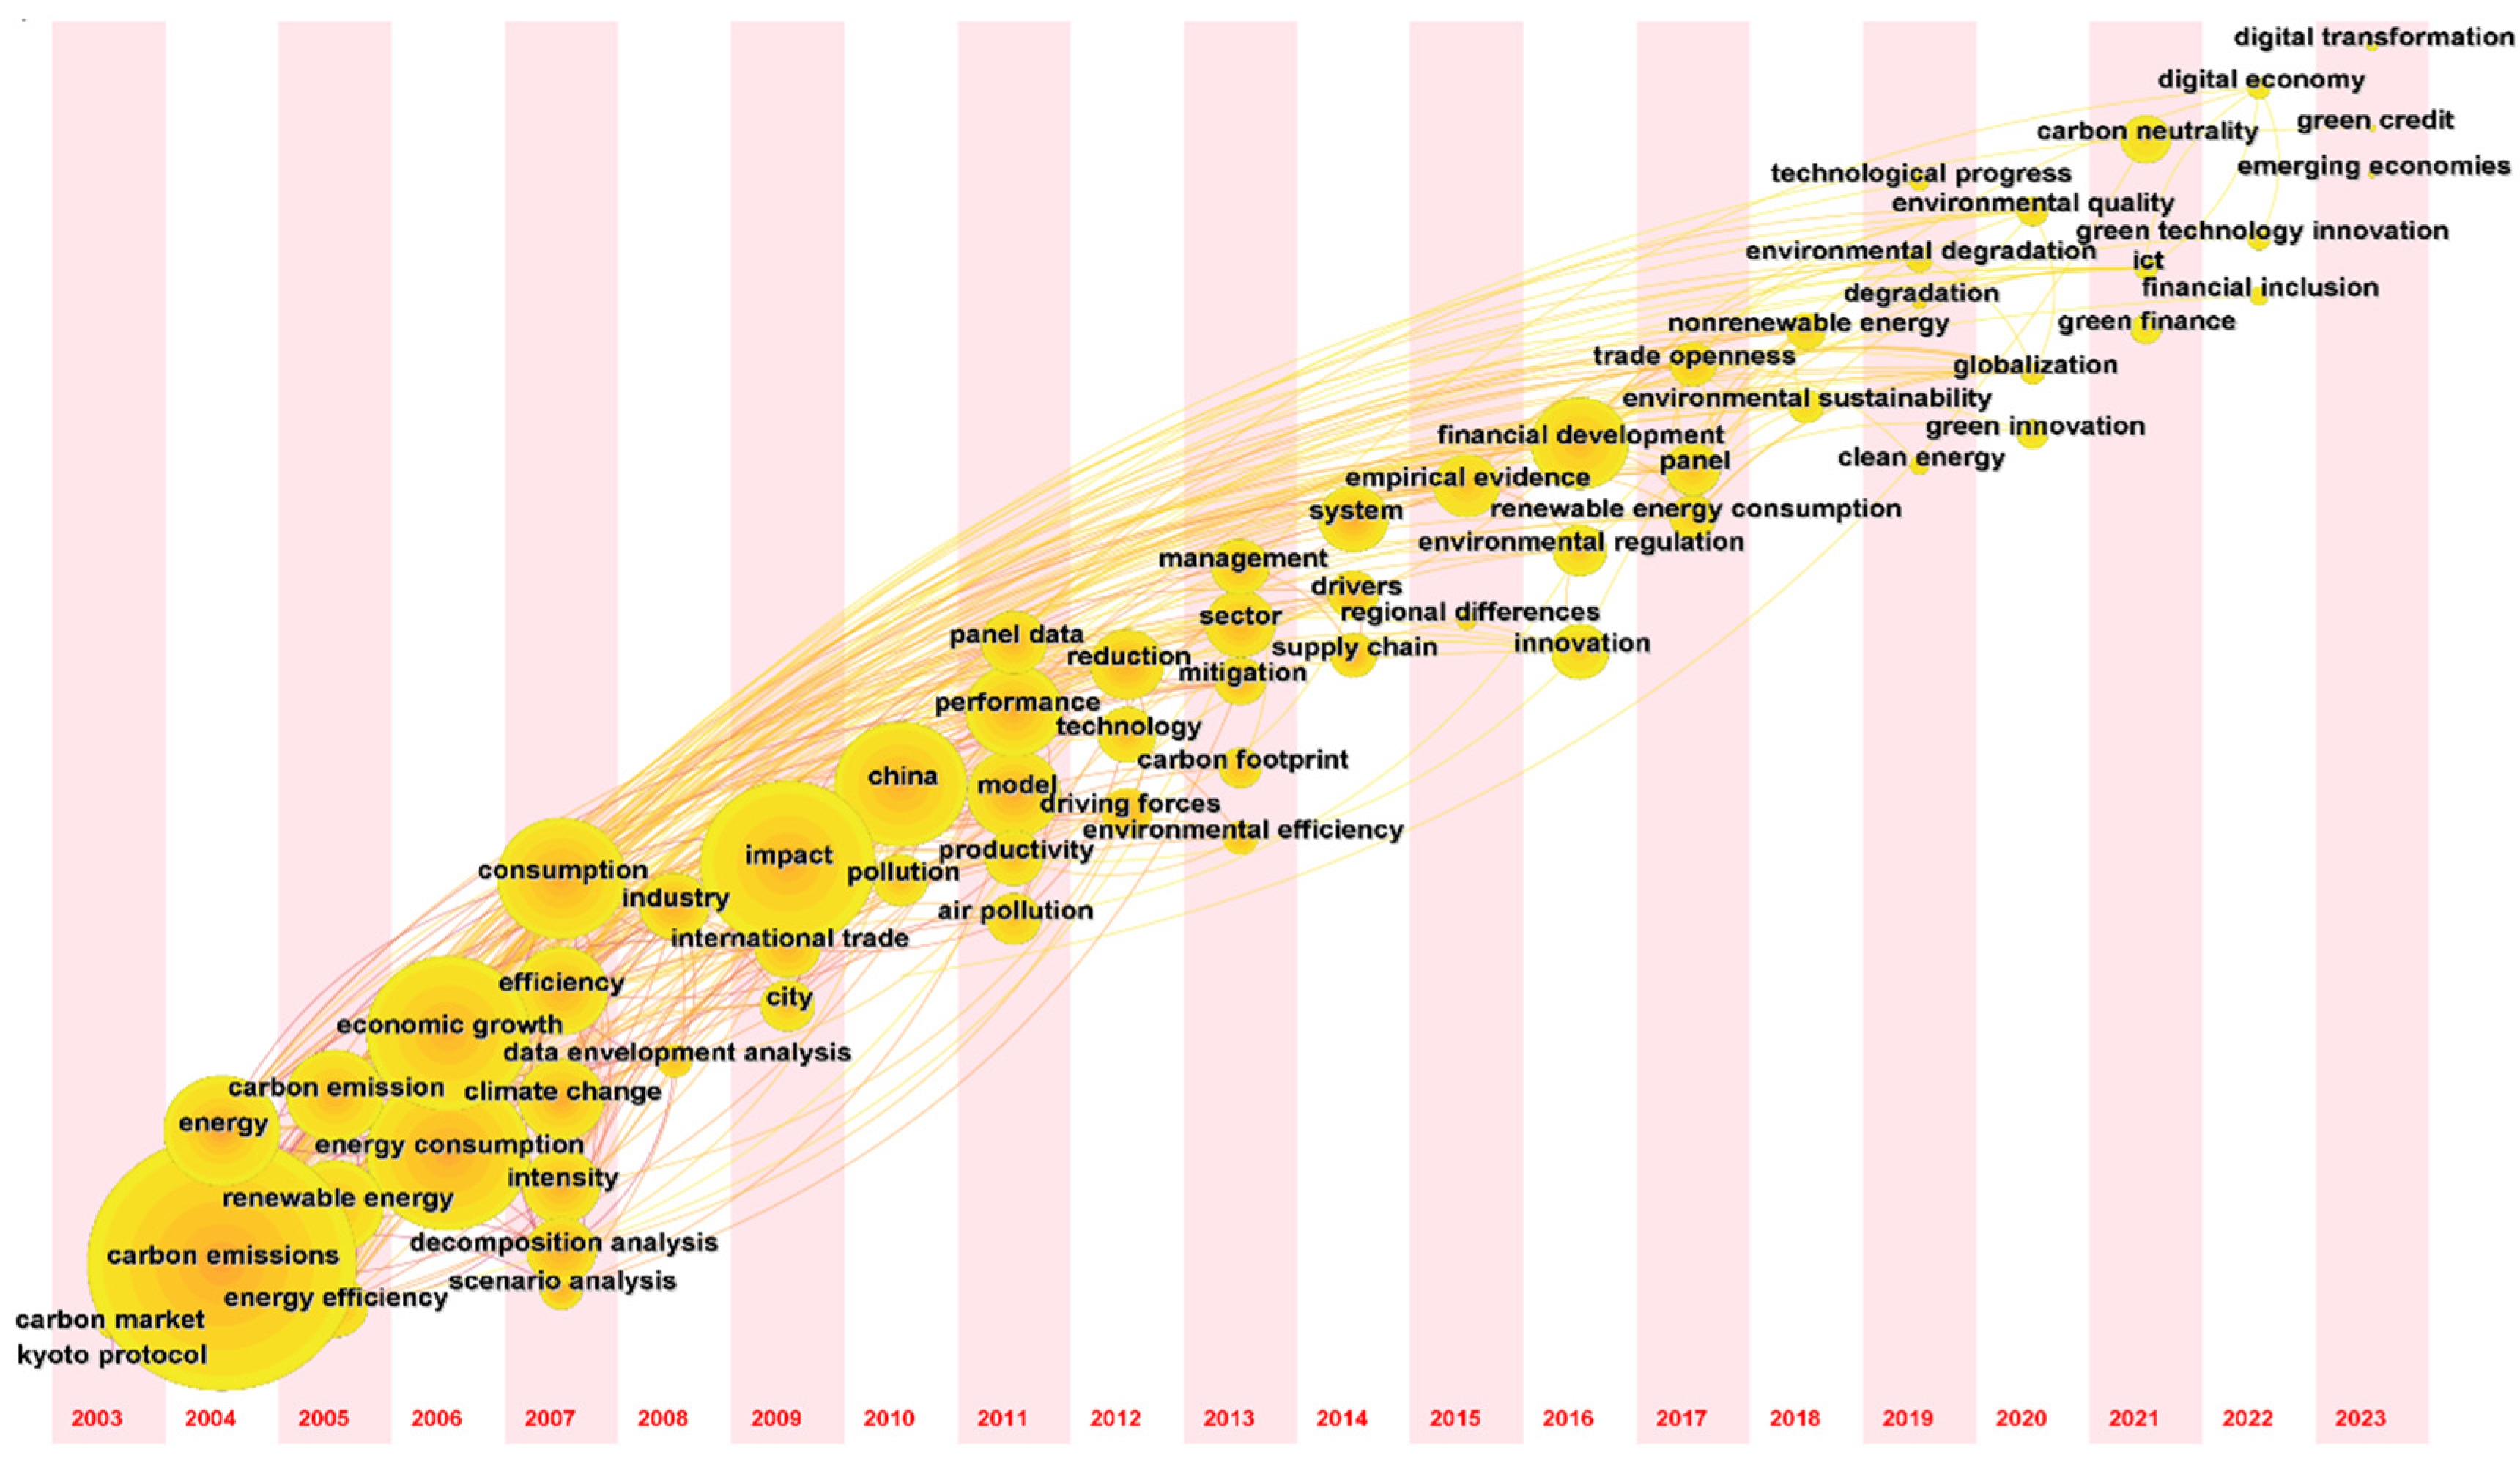
Figure 4.
The keyword timeline graph of China’s carbon emission research papers.
The keyword co-occurrence network comprises 674 nodes interconnected by 2424 links. Noteworthy keywords such as “carbon emissions”, “carbon peaking”, “energy consumption”, “intensity”, and “dynamics” are associated with research on CE computation and prediction. Keywords including “economic growth”, “impact”, “policy”, “urbanization”, “international trade”, “decomposition analysis”, foreign direct investment”, “innovation”, “driving forces”, and “industrial structure” are linked to studies on the influencing factors of carbon emissions. Keywords like “carbon footprint” and “supply chain” are intertwined with research on carbon footprints. Meanwhile, keywords such as “efficiency”, “energy efficiency”, and “environmental efficiency “ are tied to studies on CEE. Lastly, keywords including “China”, “industry”, “regional differences”, “sector”, “country”, and “city” are associated with research on the differential analysis of carbon emissions.
In summary, through a keyword analysis of the research outcomes by Chinese scholars on carbon emissions, this paper categorizes the research themes into the following five points: CE computation and prediction, influencing factors of carbon emissions, carbon footprint, CEE, and differential analysis of carbon emissions.
As depicted in the keyword timeline graph, research on carbon emissions in China commenced with the calculation of carbon emissions, and the study of factors influencing carbon emissions has been a continuous thread throughout. In the interim, topics such as carbon footprint, CEE, CE prediction, and differential analysis gradually evolved into focal research points.
Firstly, from 2003 to 2007, Chinese scholars conducted a significant amount of CE estimation research to comprehend the current state of carbon emissions. Key terms included “carbon emissions”, “energy consumption”, “intensity”, and others. Secondly, in pursuit of establishing carbon reduction pathways, Chinese scholars persisted in researching the factors influencing carbon emissions. This evolved from early research (2006–2010) focused on economic growth, decomposition analysis, international trade, and impact to mid-term studies (2011–2016) addressing technology, driving forces, management, carbon tax, financial development, environmental regulation, and innovation, and later studies (2017–present) exploring trade openness, renewable energy consumption, technological progress, globalization, green innovation, green finance, green credit, the digital economy, and others. Research on CE forecasting commenced in 2007 but has not received attention until recently. Following the Chinese government’s commitment in 2016 to achieve carbon peaking by 2030, Chinese scholars have conducted a considerable amount of empirical research on CE forecasting. Relevant keywords include “carbon peak”, “dynamics”, and others. Since 2005, CEE has gradually become a focus of Chinese scholars, with keywords such as “energy efficiency”, “efficiency”, “data envelopment analysis”, “environmental efficiency”, and others. Additionally, from 2013 onward, carbon footprint research has gradually attracted the attention of Chinese scholars, with keywords like “carbon footprint” and “supply chain”, among others. However, in recent years, research on carbon footprints has gradually decreased. Finally, after 2009, to understand regional and industry-specific CE characteristics, Chinese scholars have gradually turned their attention to CE differential analysis. Relevant keywords include “industry”, “city”, “panel data”, “sector”, “regional differences”, and others.
3.2. Review of Research Results on Carbon Emission Calculations and Predictions
3.2.1. Review of Research Results on Carbon Emission Calculations
Chinese scholars have extensively calculated carbon emissions for different regions and industries. Notably, scholars such as Xu [5], Shao [6], Han [7], Wang [8], Fan [9], and others have individually computed carbon emissions for entities like China, Beijing, industrial sectors, agriculture, and the transportation industry. Research indicates that Chinese scholars employ various methods for calculating carbon emissions, including the energy consumption method [10], life cycle assessments (LCAs) [11], and the input–output method [12]. A comparative evaluation of the results obtained from these methods is presented in Table 1.

Table 1.
Comparative analysis of CE calculation methods.
Over the past few decades, Chinese scholars have made significant strides in CE computation, yet they are still confronted with several challenges. Firstly, Chinese scholars often adopt a single method for calculating carbon emissions, with limited comparative studies across different methodologies. Secondly, the determination of CE sources within industries is not comprehensive. Existing research tends to focus on certain pre-production and production stages, overlooking calculations for post-production activities such as transportation, storage, and processing. Lastly, the absence of systematic research on regional and industry-specific CE boundaries leads to overlaps and deviations in the computation of carbon emissions.
3.2.2. Review of Research Results on Carbon Emission Prediction
Chinese scholars have extensively researched CE prediction using various forecasting models tailored to different research objectives. The research outcomes can be broadly categorized into two main types. First, efforts have been directed toward refining CE prediction models to enhance the precision of forecasts. Second, studies have focused on predicting carbon emissions for specific regions or industries, aiming to discern trends in the development of carbon emissions and subsequently formulate strategies for carbon reduction.
In the domain of model improvement, Fang et al. proposed an improved particle swarm optimization (PSO) algorithm-based Gaussian process regression method. This approach effectively optimizes the hyperparameters of the covariance function in Gaussian process regression [13]. Ma et al. introduced a mixed CE prediction model based on multi-factor identification, specifically utilizing a firefly algorithm-optimized multivariate gray model [14]. For the application of CE prediction, Sun et al. employed the IPAT model to design 48 scenarios for forecasting China’s carbon emissions. Based on the forecast results, they formulated developmental paths that could lead to carbon peaking by 2030 [15]. Li et al. predicted CE trends in the Chinese construction industry, revealing that the industry is projected to reach its carbon peak in 2045 [16]. Additionally, Cheng [17], Ma [18], Su [19], and others conducted CE prediction studies for Jiangsu Province, the Chinese tourism industry, and the manufacturing sector, respectively.
In summary, Chinese scholars have explored various methods for CE prediction. However, the theoretical foundations and supporting assumptions of different modeling approaches differ, leading to divergent prediction results. Furthermore, the focus of Chinese scholars on CE prediction research has primarily been at the macro-level, encompassing national, provincial, and industrial scales, with relatively fewer studies conducted at the micro-level, such as in the case of parks and individual enterprises.
3.3. Review of Research Results on Factors Influencing Carbon Emission
3.3.1. Review of Research Methods for Influencing Factors
A thorough analysis of the influencing factors of carbon emissions contributes to a more comprehensive understanding of the mechanisms behind CE growth or reduction. This understanding is crucial for the formulation of precise carbon reduction measures. Chinese scholars have employed various models for the analysis of factors influencing carbon emissions, including factor decomposition [20], the STIRPAT model [21], the environmental Kuznets curve [22], correlation coefficient analysis [23], regression analysis [24], causal analysis [25], and Computable General Equilibrium (CGE) models [26]. An evaluation of each method is summarized in Table 2.
Table 2.
Evaluation of research methods for influencing factors of carbon emissions.
3.3.2. Review of Influencing Factors
Chinese scholars have conducted numerous empirical studies from multiple perspectives on the influencing factors of carbon emissions. This paper categorizes the influencing factors proposed by Chinese scholars into five major classes: economy, population, energy, policy, and others. The specific influencing factors are outlined in Table 3.
Table 3.
Classification of CE-influencing factors.
In economic studies, Chinese scholars have delved extensively into the theoretical underpinnings and empirical analyses concerning the intricate relationship between the economy and carbon emissions. Notable contributions include Zhang’s exploration of economic growth [27], Zhou’s investigation into industrial structure [28], Raihan’s scrutiny of foreign direct investment (FDI) [29], Wang’s examination of international trade [30], Jiang’s insights into the insurance sector [31], Liu’s focus on industrial agglomeration [32], and Ma’s exploration of the digital economy [33], spanning across various economic domains. The research outcomes underscore the dependence of numerous economic activities on fossil fuels and other high-carbon energy sources, leading to an escalation in carbon emissions. However, carbon emissions reciprocally impact economic development, as excessive emissions can induce climate change and environmental issues, adversely affecting the economy. Divergent impacts on carbon emissions emanate from different economic perspectives, potentially fostering an escalation or reduction in carbon emissions. The detailed findings are elucidated in Table 4.
Table 4.
The primary conclusions of CE studies’ influencing factors from an economic perspective.
Secondly, Chinese scholars have extensively explored the impact of the population on carbon emissions from various perspectives. This includes Guo’s research on population structure [34], Chen’s work on population growth [35], Wang’s investigation into population aging [36], Wu’s analysis of population mobility [37], and Zhang’s examination of residents’ living standards [38]. The research findings indicate that population is a key factor influencing carbon emissions. On the one hand, it directly affects consumption-related carbon emissions through population structure effects. On the other hand, it indirectly influences production-related carbon emissions through its effects on the economy and energy. Different population perspectives have significant variations in their impact on carbon emissions. Population aging, education level, and income level exhibit negative effects on carbon emissions, while population growth has a positive effect. Population mobility has a dual impact. The specific impact conclusions are outlined in Table 5.
Table 5.
The primary conclusions of the study on CE-influencing factors from a population perspective.
An in-depth exploration of the impact of energy on carbon emissions has been undertaken by Chinese scholars, including Jiang [39], Zhang [40], Ma [41], Huang [42], and Su [43], among others, from various perspectives such as energy structure, energy efficiency, energy investment, energy supply chain, and household energy consumption. The research outcomes indicate that energy consumption is a direct source of carbon emissions. However, different energy sources and technologies exhibit varying levels of carbon emissions. Therefore, factors related to energy, such as energy structure and energy efficiency, have a significant influence on carbon emissions, as depicted in the detailed impact conclusions in Table 6.
Table 6.
The primary conclusions of the study on CE-influencing factors from an energy perspective.
Researchers such as Ding [44], Zhang [45], Chen [46], Yang [47], Hu [48], and others have extensively analyzed the impact of government policies on carbon emissions, focusing on perspectives such as carbon tax, CE trading, the Paris Agreement, GDP assessment, and resource tax. The research outcomes indicate that the government can influence carbon reduction through incentive measures and economic tools. However, the implementation of development and reform policies by the government may lead to an increase in carbon emissions. The detailed impact conclusions are outlined in Table 7.
Table 7.
The primary conclusions of the study on CE-influencing factors from a policy perspective.
The fifth aspect delves into the profound exploration by Chinese scholars of additional factors influencing carbon emissions. These encompass Li’s examination of the technological level [49], Xu’s scrutiny of urbanization [50], Shao’s analysis of employment rates [51], and Li’s assessment of public transportation levels [52]. The research findings show that technological proficiency, urbanization, employment rates, and public transportation levels all have a dual impact on carbon emissions, manifesting different emission effects under the influence of regional circumstances. The specific research conclusions are detailed in Table 8.
Table 8.
The primary conclusions of the study on CE-influencing factors from other perspectives.
Chinese scholars have made significant contributions to the field of CE factors. They have employed diverse analytical methods, expanded their research from single countries or regions to multi-regional comparative development, and continually enriched the factors under investigation. However, there are still several limitations. Firstly, the examined factors mainly include macro factors such as the economy, population, energy, and policies, with less consideration for micro factors like lifestyle and transportation and their impact on carbon emissions. Secondly, the focus has been primarily on national, provincial, and municipal levels, with relatively fewer studies at the micro-level, such as industrial parks, enterprises, or households. Additionally, in the study of CE factors in specific industries, it is essential to consider industry-specific factors that may influence carbon emissions in that sector. For example, in the transportation industry, factors like road congestion could be crucial. Lastly, many existing findings are based on computational models that analyze the impact of individual factors on carbon emissions, lacking an analysis of the combined effects of several factors.
3.4. Review of Research Results on Carbon Footprints
3.4.1. Review of Research Results on the Definition of Carbon Footprint
The concept of a carbon footprint originated from the ecological footprint proposed by Wack in 1996 [53]. Although Chinese scholars have conducted numerous studies on the definition of the carbon footprint, a consensus has not yet been reached, and there are three mainstream viewpoints. First, some scholars consider the carbon footprint to be the carbon emissions generated from burning fossil fuels during human activities [54]. Second, others define the carbon footprint as the CO2 and other greenhouse gas emissions, measuring the total emissions throughout the entire lifecycle, including raw material acquisition and the production, distribution, use, and recycling of a product [55]. Third, some scholars emphasize that the key to the concept of a carbon footprint lies in measuring direct and indirect CO2 conversions as a standard to quantify the impact of human activities on climate change [56]. In summary, there is controversy among Chinese scholars regarding the definition of the carbon footprint, especially concerning the measurement of greenhouse gas types and carbon boundaries.
3.4.2. Review of Research Results on Carbon Footprint Calculation
Chinese scholars primarily research carbon footprint calculation methods based on the principles of life cycle assessment. The research results can be categorized into two main types: process analysis and input–output analysis. On the one hand, scholars such as Wang [57], Qi [58], and Li [59] utilized a process analysis to calculate the carbon footprint of corn production, steel enterprises, and textiles, respectively. On the other hand, researchers like Zhen [60], Liang [61], and Fan [62] applied an input–output analysis to calculate the carbon footprint of the Yellow River basin, provinces, and industries in China.
Among the existing carbon footprint analysis methods, the process analysis method provides a relatively accurate research scale but struggles to avoid truncation errors arising from delineating system boundaries. Consequently, it faces difficulties in studying entities at the micro- and macro-levels. On the contrary, the input–output method relies on data primarily derived from average CE data, and its inseparable system boundaries prevent it from effectively describing carbon footprints at various stages. As a result, it cannot facilitate efficient micro-level research.
3.4.3. Review of Research Results on Carbon Footprint Applications
The characteristics of a carbon footprint vary across different study subjects. Chinese scholars have conducted numerous empirical studies on carbon footprints, examining products, individuals, households, businesses, projects, and services.
In product-focused carbon footprint research, the findings reveal significant disparities in carbon emissions among different products. These variations are primarily influenced by production, transportation, usage, and disposal processes. Some Chinese researchers have noted that food and beverages often exhibit high carbon footprints, whereas vegetables and plant-based food items tend to have lower carbon footprints [63]. Furthermore, the manufacturing and utilization of electronic products contribute substantially to carbon emissions, underscoring the importance of encouraging sustainable production and recycling practices [64]. Lastly, reducing carbon footprints is notably facilitated by adopting renewable energy sources, high-efficiency insulation materials in construction, and the widespread use of electric vehicles [65].
In individual-focused carbon footprint research, the findings indicate that personal choices regarding transportation, food consumption, energy usage, and shopping behaviors have a significant impact on carbon footprints. Chinese scholars have observed that utilizing public transportation, reducing meat consumption, adopting energy-saving measures, and purchasing sustainable products can effectively lower an individual’s carbon footprint [66,67]. Additionally, some studies have also shown that factors such as educational level [68], socio-economic status [69], and geographic location [70] play a role in influencing an individual’s carbon footprint.
Thirdly, research focusing on households as the subject of carbon footprints reveals that a household’s carbon footprint is significantly influenced by factors such as household size, living area, transportation mode, heating and cooling methods, food purchases, and the source of electricity [71]. Some studies further indicate that strategies to reduce households’ carbon footprints include improvements in energy efficiency, the adoption of renewable energy sources, waste reduction, sustainable improvements in food purchasing choices, and the adoption of sustainable transportation methods [72].
Fourthly, research focusing on enterprises as the subject of carbon footprints reveals that the carbon emissions of a business depend on factors such as its industry, production processes, supply chain, and energy usage. Some Chinese scholars have found that businesses can reduce their carbon footprint by improving energy efficiency, adopting clean energy sources, reducing logistics-related carbon emissions, and implementing carbon reduction measures [73]. Additionally, some studies suggest that social responsibility and principles of sustainable operation play a crucial role in business decisions related to emission reduction [74].
Fifthly, research focusing on specific projects as the subject of carbon footprints demonstrates that using green building materials, energy efficiency improvements, and the utilization of renewable energy can significantly reduce the carbon emissions of construction projects [75]. Some Chinese scholars have also discovered that using renewable energy, improving transportation efficiency, and enhancing transport management can reduce the carbon footprint of transportation projects [76]. Moreover, the carbon footprint of manufacturing projects is significantly influenced by production processes, energy usage, and the choice of raw materials [77].
Sixthly, research focusing on services as the subject of carbon footprints indicates that significant reductions in carbon footprints can be achieved in catering services by selecting local ingredients, reducing food waste, improving supply chain management, and enhancing food storage efficiency [78]. Hotels and tourism services can reduce their carbon footprint through energy efficiency improvements and measures to decrease the use of disposable items. Additionally, tourists opting for sustainable travel methods and low-carbon activities contribute to CE reduction [79]. The carbon footprint of healthcare services is associated with energy usage, waste management, and the selection of medical equipment [80]. The carbon footprint of retail and e-commerce services is linked to supply chain management, packaging choices, and decisions related to logistics and warehousing [81].
In summary, Chinese scholars have conducted extensive theoretical research and empirical analyses in the field of carbon footprints. However, challenges such as cross-boundary calculations, comprehensive effects, and policy applications need to be overcome. Firstly, with the development of globalization, the boundaries of carbon footprints have become blurred due to multinational companies and international supply chains, making the calculation and management of cross-boundary carbon footprints more complex. Secondly, existing carbon footprint studies often focus on the impact of individual factors, lacking a comprehensive analysis of the combined effects of multiple factors. Finally, although there are many studies on how to reduce carbon footprints, applying these studies to policies and practices still poses challenges.
3.5. Review of Research Results on Carbon Emission Efficiency
3.5.1. Review of Research Results on the Definition of Carbon Emission Efficiency
Chinese scholars have yet to reach a consensus on the definition of CEE, which is divided into narrow CEE and broad CEE. Narrow CEE primarily refers to CEE within the traditional single-factor framework, expressed as the ratio of total carbon emissions to a single factor [82]. Examples include carbon emissions per unit of GDP, carbon emissions per unit of energy consumption, and per capita carbon emissions per unit of GDP. Broad CEE refers to CEE within the overall factor framework, calculated based on the input–output indicator system [83]. Existing research results indicate that narrow CEE is often too direct and one-sided. For instance, defining CEE as carbon emissions per unit of GDP tends to favor developed countries. Therefore, broad CEE is increasingly gaining recognition among scholars.
3.5.2. Review of Research Results on Carbon Emission Efficiency Calculation
Chinese scholars have conducted extensive empirical research on broad CEE at regional and industrial levels using methods such as Data Envelopment Analysis (DEA) [84], CE weighting [85], and the Malmquist Carbon Efficiency Index [86]. The research scope includes countries [87], urban clusters [88], cities [89], industries [90], manufacturing [91], aviation [92], and more. The calculation method for narrow CEE is the use of the carbon production efficiency index, with countries being the primary research focus [93].
Different methods are suitable for different research objectives. DEA and CE weighting are applicable for assessing relative efficiency, aiding in identifying inefficient units and industries. However, DEA can only provide a relative efficiency assessment and cannot measure the absolute efficiency of units. The Malmquist Carbon Efficiency Index can evaluate the evolution of CEE. The carbon production efficiency index provides a unit carbon emission measure suitable for tracking absolute efficiency at the unit level. In practical applications, researchers and policymakers need to consider the strengths and weaknesses of different methods and choose the one that aligns with their research goals and data availability.
3.5.3. Review of Research Results on Carbon Emission Efficiency Applications
Different regions or industries exhibit significant differences in CEE levels, and Chinese scholars have delved into the factors influencing CEE. Firstly, in research on factors affecting regional CEE, Zhan et al. found that developed regions generally exhibit higher efficiency [94]. Zhou et al. discovered that industrial structure is also a crucial factor, with regions having a higher proportion of clean industries typically achieving more effective emission reduction [95]. Dong et al. found that energy structure and technological level play a critical role, as the use of clean energy and efficient technologies can enhance regional CEE [96]. Li et al. observed that higher levels of urbanization are typically associated with higher CEE [97]. Liu et al. found that the support of local policies and regulations also has a significant impact on regional CEE [98].
Secondly, in research on factors influencing industry CEE, Dan et al. found that asset structure and asset utilization efficiency play a crucial role across different industries, influencing production and investment decisions [99]. Li et al. identified transportation as another influencing factor with significant impacts on production and CEE across different industries, each affected differently [100]. Finally, Du [101], Yi [102], Li [103], and others discovered that spatial agglomeration, management level, and energy structure, respectively, have important effects on the CEE of the construction industry, logistics industry, and manufacturing industry.
Finally, Chinese scholars have further investigated the changing patterns of CEE from a spatiotemporal evolution perspective. Research findings from Ding [104], Chen [105], and others all indicate significant variations in CEE across different regions, industries, and time periods. Gao et al. found that the CEE of industries has gradually improved over time, attributed to technological progress and policy interventions [106]. Zhong et al. observed significant differences in the trends of CEE changes across different regions, influenced by regional characteristics, resource supply, and policy support [107].
In conclusion, Chinese scholars have made significant progress in the field of CEE, yet they still face several challenges. There is a relatively limited amount of research at the micro-level, and expanding studies to the micro-level could provide more detailed and specific insights. Additionally, improvements in CEE may have positive spatial spillover effects on neighboring regions. Further research is needed to understand the impacts of these spatial spillover effects. Finally, studies on CEE need to consider the complexity of time and space, as there are substantial differences across regions and periods. This complexity emphasizes the need for greater attention to the breadth and depth of research on CEE.
3.6. Review of Research Results on Carbon Emission Differences Analysis
3.6.1. Review of Research Results on Carbon Emission Difference Analysis Methods
Chinese scholars employ two primary methods for the analysis of CE differentials: the comparative analysis method and the coefficient of variation analysis method. The comparative analysis method involves scrutinizing disparities in carbon emission levels among distinct regions, industries, products, or periods [108]. The coefficient of variation analysis method utilizes statistical indicators such as the Gini coefficient [109], Theil index [110], spatial difference method [111], etc., to quantify and compare CE disparities across diverse entities. Comparative analysis stands out as an intuitive and versatile approach, swiftly revealing CE differences among research subjects but lacking in-depth interpretation. Conversely, the coefficient of variation analysis offers a more refined measurement sensitive to data variability. Hence, a comparative analysis proves suitable for preliminary screening, facilitating an understanding of differences. On the other hand, a coefficient of variation analysis is better suited for quantitatively measuring the degree of differences. However, caution is warranted concerning its sensitivity to outliers and uneven data distributions.
3.6.2. Review of Research Results on Carbon Emission Difference Analysis Applications
Based on the research dimensions, Chinese scholars’ research on CE disparities can be categorized into regional, industrial, and temporal.
Firstly, studies reveal significant variations in carbon emission levels among different types of regions. Some research suggests that resource-rich regions typically exhibit higher carbon emissions, while innovative and financial regions tend to have relatively lower carbon emissions [112]. Moreover, the impact of the same influencing factors on carbon emissions varies across different regions. For instance, Chinese scholars such as Niu [113], Zhou [114], and Zhang [115] separately investigated the influence of economic levels, population, and industrial structure on carbon emissions in different regions.
Secondly, research indicates significant disparities in CE levels among different industries. Carbon-intensive industries such as heavy industry, energy, and transportation typically exhibit high carbon emissions, while service industries like information technology, finance, and healthcare tend to emit fewer carbon emissions [116]. The influencing factors on carbon emissions vary across different industries. Carbon-intensive industries are significantly influenced by factors such as industrial structure, energy consumption intensity, and technological levels [117]. Service industries are more prone to reducing carbon emissions through digitization and efficient energy use [118]. Some studies also address the carbon reduction potential in different industries, highlighting the ongoing challenges in industrial carbon reduction [119] and noting potential increases in carbon emissions in the tourism industry due to increased tourist flows [120].
Lastly, research indicates significant disparities in CE levels across different periods. Early developmental stages are typically associated with high carbon emissions, while carbon emissions tend to decrease in later stages of societal development. This suggests a non-linear relationship, resembling an inverted U-shape, between development stages and CE levels [121]. The influencing factors for carbon emissions also vary across different time periods. In the early stages, energy-intensive industries and infrastructure development have a substantial impact on carbon emissions. In the middle stages, technological innovation and industrial upgrades come into play, increasing the potential for emission reduction. In the later stages, government policies and energy transitions play a crucial role in controlling carbon emissions [122]. Some studies emphasize the critical role of policies and governance. In the early developmental stages, government policies may lean towards economic growth, but in the middle and later stages, they tend to focus more on emission reduction measures. Adjustments and policy initiatives are instrumental in shaping the trends of carbon emissions across different time periods [123].
In conclusion, Chinese scholars have conducted extensive theoretical research and empirical analyses on the issue of CE differentials. However, they still face several challenges. Firstly, the existing research lacks a comprehensive tracking study of CE differentials, with an insufficient comparison of disparities and trends in carbon emissions across different regions and industries. Secondly, Chinese scholars’ analysis of regional CE differentials is primarily focused on the meso-scale, including provincial and city levels, with relatively fewer studies on differentials at the national level.
4. Conclusions and Prospects
4.1. Conclusions
This article provides a summary of the research themes and evolving trends in the field of carbon emissions studied by Chinese scholars. The research on carbon emissions by Chinese scholars has evolved through five major themes, starting with the calculation of carbon emissions, and research on the influencing factors of carbon emissions runs through the entire process. CEE, carbon footprints, CE prediction, and differential analysis have gradually become research topics. By reviewing the relevant literature on each CE theme, this article compiles the research achievements and shortcomings of Chinese scholars in the field of carbon emissions. Based on the challenges faced by Chinese scholars in each theme of carbon emission research, this article puts forth the following six recommendations.
In the calculation of carbon emissions, Chinese scholars should conduct more comparative studies to evaluate different methods for CE calculations. This aims to determine the most accurate and applicable methods, thus establishing more scientifically grounded standards for CE calculations. Additionally, research efforts should expand the scope of calculations, particularly focusing on post-production processes such as transportation, storage, and processing. This expansion ensures comprehensive and accurate calculations. Finally, it is recommended that clear boundaries for regional and industrial carbon emissions be established to avoid double counting and overlap. Achieving this requires interdisciplinary research and collaboration with governmental agencies.
Regarding CE predictions, Chinese scholars should tailor their choice of predictive models to the characteristics of their study objects and continuously optimize them to ensure the reliability of their prediction results. Furthermore, there is a need to enhance research at the micro-level, including CE analysis at the level of industrial parks and individual enterprises. This approach allows for a more detailed understanding of emission sources and mitigation opportunities, providing finer guidance. Lastly, attention should be given to the sustainability of supporting assumptions and the reliability of data, ensuring the scientific validity and verifiability of models and methods.
In the realm of CE-influencing factors, Chinese scholars need to pay more attention to micro-level factors such as lifestyle and the number of motor vehicles. This approach allows for a deeper understanding of the micro-mechanisms behind carbon emissions. Secondly, there is a necessity to broaden the research scope, with a specific focus on micro-level entities such as industrial parks, enterprises, and households. This expansion would facilitate a comprehensive understanding of the contributions of different levels to carbon emissions. Furthermore, in studying industry-specific CE factors, it is crucial to consider the unique factors associated with specific industries. Lastly, research efforts could explore the combined effects of multiple factors rather than relying solely on single-factor analysis.
In the context of carbon footprint research, Chinese scholars should emphasize the exploration of methods for calculating and managing cross-boundary carbon footprints. This approach contributes to a better understanding and reduction in carbon footprints within global supply chains. Secondly, there is a need for more comprehensive effects studies to understand the combined impact of multiple factors on carbon footprints. Finally, future research should highlight policy applications, establishing a bridge that connects scientific research with policy formulation and implementation.
In the realm of CEE, Chinese scholars should enhance their focus on the micro-level, including entities such as enterprises, industrial parks, and households. Additionally, researchers should delve deeper into exploring the positive spatial spillover effects that improvements in CEE might have on neighboring regions. This would provide more comprehensive support for transnational and international carbon reduction policies. Lastly, it is essential to emphasize both the breadth and depth of CEE research to gain a more comprehensive and accurate understanding of the evolution of CEE.
Regarding CE differential analysis, Chinese scholars should pay attention to the dynamic spatial and temporal changes in CE differentials in the future. Tracking trends in carbon emissions for different regions or industries is crucial. Secondly, there should be a focus on inter-country CE differential analysis, revealing the differences in carbon emissions among different countries and the impact of the international CE division of labor and trade. Lastly, interpreting CE differentials often involves multiple fields, and interdisciplinary research collaboration is encouraged to gain a more comprehensive understanding of these differences.
4.2. Limitations and Future Research Direction
This article exclusively summarizes research themes and evolutionary trends within the domain of carbon emission research as pursued by Chinese scholars. However, it lacks an analysis of carbon emission research themes and trends on a global scale, particularly in developed countries such as the United States, the United Kingdom, Japan, and others. Furthermore, a comparative analysis of the research outcomes in China is notably absent. In the subsequent phase, our team intends to broaden the perspective to encompass the United States and the entire world, meticulously organizing research achievements and trends in carbon emissions. This comparative analysis will serve as a valuable reference for shaping future research directions for carbon emissions in China.
Author Contributions
Conceptualization, H.W. and D.T.; methodology, Z.L.; software, Z.L.; validation, H.W., D.T. and Z.L.; formal analysis, H.W., D.T., L.S. and D.T.; investigation, Z.L.; resources, H.W.; data curation, Z.L.; writing—original draft preparation, H.W.; writing—review and editing, L.S., D.T. and Z.L.; visualization, L.S. and D.T.; supervision, D.T.; project administration, D.T. All authors have read and agreed to the published version of the manuscript.
Funding
This research received no external funding.
Institutional Review Board Statement
Not applicable.
Informed Consent Statement
Not applicable.
Data Availability Statement
Not applicable.
Conflicts of Interest
The authors declare no conflicts of interest.
References
- Liu, Y.; Dong, K.; Jiang, Q. Assessing energy vulnerability and its impact on carbon emissions: A global case. Energy Econ. 2023, 119, 106557. [Google Scholar] [CrossRef]
- Xuan, D.; Ma, X.; Shang, Y. Can China’s policy of carbon emission trading promote carbon emission reduction? J. Clean. Prod. 2020, 270, 122383. [Google Scholar] [CrossRef]
- Chen, C. CiteSpace II: Detecting and visualizing emerging trends and transient patterns in scientific literature. J. Am. Soc. Inf. Sci. Technol. 2006, 57, 359–377. [Google Scholar] [CrossRef]
- Fang, Y.; Yin, J.; Wu, B. Climate change and tourism: A scientometric analysis using CiteSpace. J. Sustain. Tour. 2018, 26, 108–126. [Google Scholar] [CrossRef]
- Xu, S.C.; He, Z.X.; Long, R.Y.; Chen, H.; Han, H.-M.; Zhang, W.-W. Comparative analysis of the regional contributions to carbon emissions in China. J. Clean. Prod. 2016, 127, 406–417. [Google Scholar] [CrossRef]
- Shao, L.; Guan, D.; Zhang, N.; Shan, Y.; Chen, G.Q. Carbon emissions from fossil fuel consumption of Beijing in 2012. Environ. Res. Lett. 2016, 11, 114028. [Google Scholar] [CrossRef]
- Han, M.; Ji, X. Alternative industrial carbon emissions benchmark based on input-output analysis. Front. Earth Sci. 2016, 10, 731–739. [Google Scholar] [CrossRef]
- Wang, G.; Liao, M.; Jiang, J. Research on agricultural carbon emissions and regional carbon emissions reduction strategies in China. Sustainability 2020, 12, 2627. [Google Scholar] [CrossRef]
- Fan, F.; Lei, Y. Decomposition analysis of energy-related carbon emissions from the transportation sector in Beijing. Transp. Res. Part D Transp. Environ. 2016, 42, 135–145. [Google Scholar] [CrossRef]
- Shi, X.; Li, X. Research on three-stage dynamic relationship between carbon emission and urbanization rate in different city groups. Ecol. Indic. 2018, 91, 195–202. [Google Scholar] [CrossRef]
- Ma, X.; Li, C.; Li, B. Carbon emissions of China’s cement packaging: Life cycle assessment. Sustainability 2019, 11, 5554. [Google Scholar] [CrossRef]
- Li, C.; Zhang, X. The Influencing Mechanisms on Global Industrial Value Chains Embedded in Trade Implied Carbon Emissions from a Higher-Order Networks Perspective. Sustainability 2022, 14, 15138. [Google Scholar] [CrossRef]
- Fang, D.; Zhang, X.; Yu, Q.; Jin, T.C.; Tian, L. A novel method for carbon dioxide emission forecasting based on improved Gaussian processes regression. J. Clean. Prod. 2018, 173, 143–150. [Google Scholar] [CrossRef]
- Ma, X.; Jiang, P.; Jiang, Q. Research and application of association rule algorithm and an optimized grey model in carbon emissions forecasting. Technol. Forecast. Soc. Chang. 2020, 158, 120159. [Google Scholar] [CrossRef]
- Sun, Z.; Liu, Y.; Yu, Y. China’s carbon emission peak pre-2030: Exploring multi-scenario optimal low-carbon behaviors for China’s regions. J. Clean. Prod. 2019, 231, 963–979. [Google Scholar] [CrossRef]
- Li, B.; Han, S.; Wang, Y.; Li, J.; Wang, Y. Feasibility assessment of the carbon emissions peak in China’s construction industry: Factor decomposition and peak forecast. Sci. Total Environ. 2020, 706, 135716. [Google Scholar] [CrossRef] [PubMed]
- Cheng, M.; Yao, W. Trend prediction of carbon peak in China’s animal husbandry based on the empirical analysis of 31 provinces in China. Environ. Dev. Sustain. 2024, 26, 2017–2034. [Google Scholar] [CrossRef]
- Ma, X.; Han, M.; Luo, J.; Song, Y.; Chen, R.; Sun, X. The empirical decomposition and peak path of China’s tourism carbon emissions. Environ. Sci. Pollut. Res. 2021, 28, 66448–66463. [Google Scholar] [CrossRef]
- Su, Y.; Wang, Y.; Zheng, B.; Ciais, P.; Wu, J.; Chen, X.; Wang, Y.; Wang, C.; Ye, Y.; Li, Q.; et al. Retrospect driving forces and forecasting reduction potentials of energy-related industrial carbon emissions from China’s manufacturing at city level. Environ. Res. Lett. 2020, 15, 074020. [Google Scholar] [CrossRef]
- Zhao, M.; Tan, L.; Zhang, W.; Ji, M.; Liu, Y.; Yu, L. Decomposing the influencing factors of industrial carbon emissions in Shanghai using the LMDI method. Energy 2010, 35, 2505–2510. [Google Scholar] [CrossRef]
- Wang, C.; Wang, F.; Zhang, X.; Yang, Y.; Su, Y.; Ye, Y.; Zhang, H. Examining the driving factors of energy related carbon emissions using the extended STIRPAT model based on IPAT identity in Xinjiang. Renew. Sustain. Energy Rev. 2016, 67, 51–61. [Google Scholar] [CrossRef]
- Wang, Y.; Zhang, C.; Lu, A.; Li, L.; He, Y.; ToJo, J.; Zhu, X. A disaggregated analysis of the environmental Kuznets curve for industrial CO2 emissions in China. Appl. Energy 2017, 190, 172–180. [Google Scholar] [CrossRef]
- Sun, Y.; Liu, S.; Li, L. Grey correlation analysis of transportation carbon emissions under the background of carbon peak and carbon neutrality. Energies 2022, 15, 3064. [Google Scholar] [CrossRef]
- Pan, C.; Wang, H.; Guo, H.; Pan, H. How do the population structure changes of China affect carbon emissions? An empirical study based on ridge regression analysis. Sustainability 2021, 13, 3319. [Google Scholar] [CrossRef]
- Dong, K.; Ren, X.; Zhao, J. How does low-carbon energy transition alleviate energy poverty in China? A nonparametric panel causality analysis. Energy Econ. 2021, 103, 105620. [Google Scholar] [CrossRef]
- Shi, Q.; Ren, H.; Cai, W.; Gao, J. How to set the proper level of carbon tax in the context of Chinese construction sector? A CGE analysis. J. Clean. Prod. 2019, 240, 117955. [Google Scholar] [CrossRef]
- Zhang, Y.J.; Liu, Z.; Zhang, H.; Tan, T.-D. The impact of economic growth, industrial structure and urbanization on carbon emission intensity in China. Nat. Hazards 2014, 73, 579–595. [Google Scholar] [CrossRef]
- Zhou, X.; Zhang, J.; Li, J. Industrial structural transformation and carbon dioxide emissions in China. Energy Policy 2013, 57, 43–51. [Google Scholar] [CrossRef]
- Raihan, A. Influences of foreign direct investment and carbon emission on economic growth in Vietnam. J. Environ. Sci. Econ. 2024, 3, 1–17. [Google Scholar] [CrossRef]
- Wang, Q.; Zhang, F.; Li, R. Free trade and carbon emissions revisited: The asymmetric impacts of trade diversification and trade openness. Sustain. Dev. 2023, 32, 876–901. [Google Scholar] [CrossRef]
- Jiang, S.; Wang, L.; Xiang, F. The Effect of Agriculture Insurance on Agricultural Carbon Emissions in China: The Mediation Role of Low-Carbon Technology Innovation. Sustainability 2023, 15, 4431. [Google Scholar] [CrossRef]
- Liu, X.; Zhang, X. Industrial agglomeration, technological innovation and carbon productivity: Evidence from China. Resour. Conserv. Recycl. 2021, 166, 105330. [Google Scholar] [CrossRef]
- Ma, Q.; Tariq, M.; Mahmood, H.; Khan, Z. The nexus between digital economy and carbon dioxide emissions in China: The moderating role of investments in research and development. Technol. Soc. 2022, 68, 101910. [Google Scholar] [CrossRef]
- Guo, W.; Sun, T.; Dai, H. Effect of Population Structure Change on Carbon Emission in China. Sustainability 2016, 8, 225. [Google Scholar] [CrossRef]
- Chen, H.; Tackie, E.A.; Ahakwa, I.; Musah, M.; Salakpi, A.; Alfred, M.; Atingabili, S. Does energy consumption, economic growth, urbanization, and population growth influence carbon emissions in the BRICS? Evidence from panel models robust to cross-sectional dependence and slope heterogeneity. Environ. Sci. Pollut. Res. 2022, 29, 37598–37616. [Google Scholar] [CrossRef]
- Wang, Z.; Wei, L.; Zhang, X.; Qi, G. Impact of demographic age structure on energy consumption structure: Evidence from population aging in mainland China. Energy 2023, 273, 127226. [Google Scholar] [CrossRef]
- Wu, L.; Jia, X.; Gao, L.; Zhou, Y. Effects of population flow on regional carbon emissions: Evidence from China. Environ. Sci. Pollut. Res. 2021, 28, 62628–62639. [Google Scholar] [CrossRef]
- Zhang, S.; Shi, B.; Ji, H. How to decouple income growth from household carbon emissions: A perspective based on urban-rural differences in China. Energy Econ. 2023, 125, 106816. [Google Scholar] [CrossRef]
- Jiang, T.; Li, S.; Yu, Y.; Peng, Y. Energy-related carbon emissions and structural emissions reduction of China’s construction industry: The perspective of input–output analysis. Environ. Sci. Pollut. Res. 2022, 29, 39515–39527. [Google Scholar] [CrossRef]
- Zhang, Y.J.; Da, Y.B. The decomposition of energy-related carbon emission and its decoupling with economic growth in China. Renew. Sustain. Energy Rev. 2015, 41, 1255–1266. [Google Scholar] [CrossRef]
- Ma, Q.; Murshed, M.; Khan, Z. The nexuses between energy investments, technological innovations, emission taxes, and carbon emissions in China. Energy Policy 2021, 155, 112345. [Google Scholar] [CrossRef]
- Huang, X.; Lu, X.; Sun, Y.; Yao, J.; Zhu, W. A Comprehensive Performance Evaluation of Chinese Energy Supply Chain under “Double-Carbon” Goals Based on AHP and Three-Stage DEA. Sustainability 2022, 14, 10149. [Google Scholar] [CrossRef]
- Su, S.; Ding, Y.; Li, G.; Li, X.; Li, H.; Skitmore, M.; Menadue, V. Temporal dynamic assessment of household energy consumption and carbon emissions in China: From the perspective of occupants. Sustain. Prod. Consum. 2023, 37, 142–155. [Google Scholar] [CrossRef]
- Ding, S.; Zhang, M.; Song, Y. Exploring China’s carbon emissions peak for different carbon tax scenarios. Energy Policy 2019, 129, 1245–1252. [Google Scholar] [CrossRef]
- Zhang, W.; Li, J.; Li, G.; Guo, S. Emission reduction effect and carbon market efficiency of carbon emissions trading policy in China. Energy 2020, 196, 117117. [Google Scholar] [CrossRef]
- Chen, J.; Wang, L.; Li, Y. Research on the Impact of Multi-dimensional Urbanization on China’s Carbon Emissions under the Background of COP21. J. Environ. Manag. 2020, 273, 111123. [Google Scholar] [CrossRef]
- Yang, W.; Zhao, R.; Chuai, X.; Xiao, L.; Cao, L.; Zhang, Z.; Yang, Q.; Yao, L. China’s pathway to a low carbon economy. Carbon Balance Manag. 2019, 14, 14. [Google Scholar] [CrossRef]
- Hu, H.; Dong, W.; Zhou, Q. A comparative study on the environmental and economic effects of a resource tax and carbon tax in China: Analysis based on the computable general equilibrium model. Energy Policy 2021, 156, 112460. [Google Scholar] [CrossRef]
- Li, M.; Wang, Q. Will technology advances alleviate climate change? Dual effects of technology change on aggregate carbon dioxide emissions. Energy Sustain. Dev. 2017, 41, 61–68. [Google Scholar] [CrossRef]
- Xu, Q.; Dong, Y.; Yang, R. Urbanization impact on carbon emissions in the Pearl River Delta region: Kuznets curve relationships. J. Clean. Prod. 2018, 180, 514–523. [Google Scholar] [CrossRef]
- Shao, W.; Li, F.; Ye, Z.; Tang, Z.; Xie, W.; Bai, Y.; Yang, S. Inter-regional spillover of carbon emissions and employment in China: Is it positive or negative? Sustainability 2019, 11, 3622. [Google Scholar] [CrossRef]
- Li, Y.; Li, T.; Lu, S. Forecast of urban traffic carbon emission and analysis of influencing factors. Energy Effic. 2021, 14, 84. [Google Scholar] [CrossRef]
- Pandey, D.; Agrawal, M.; Pandey, J.S. Carbon footprint: Current methods of estimation. Environ. Monit. Assess. 2011, 178, 135–160. [Google Scholar] [CrossRef]
- Shi, S.; Yin, J. Global research on carbon footprint: A scientometric review. Environ. Impact Assess. Rev. 2021, 89, 106571. [Google Scholar] [CrossRef]
- Yue, Q.; Xu, X.; Hillier, J.; Cheng, K.; Pan, G. Mitigating greenhouse gas emissions in agriculture: From farm production to food consumption. J. Clean. Prod. 2017, 149, 1011–1019. [Google Scholar] [CrossRef]
- Huang, M.; Chen, Y.; Zhang, Y. Assessing carbon footprint and inter-regional carbon transfer in China based on a multi-regional input-output model. Sustainability 2018, 10, 4626. [Google Scholar] [CrossRef]
- Wang, H.; Yang, Y.; Zhang, X.; Tian, G. Carbon footprint analysis for mechanization of maize production based on life cycle assessment: A case study in Jilin Province, China. Sustainability 2015, 7, 15772–15784. [Google Scholar] [CrossRef]
- Qi, Z.; Gao, C.; Na, H.; Ye, Z. Using forest area for carbon footprint analysis of typical steel enterprises in China. Resour. Conserv. Recycl. 2018, 132, 352–360. [Google Scholar] [CrossRef]
- Li, X.; Chen, L.; Ding, X. Allocation methodology of process-level carbon footprint calculation in textile and apparel products. Sustainability 2019, 11, 4471. [Google Scholar] [CrossRef]
- Zheng, H.; Fang, Q.; Wang, C.; Wang, H.; Ren, R. China’s carbon footprint based on input-output table series: 1992–2020. Sustainability 2017, 9, 387. [Google Scholar] [CrossRef]
- Liang, J.; Wang, S.; Liao, Y.; Feng, K. Carbon emissions embodied in investment: Assessing emissions reduction responsibility through multi-regional input-output analysis. Appl. Energy 2024, 358, 122558. [Google Scholar] [CrossRef]
- Fan, J.L.; Wang, J.D.; Kong, L.S.; Zhang, X. The carbon footprints of secondary industry in China: An input–output subsystem analysis. Nat. Hazards 2018, 91, 635–657. [Google Scholar] [CrossRef]
- Xu, Z.; Sun, D.W.; Zeng, X.A.; Liu, D.; Pu, H. Research developments in methods to reduce the carbon footprint of the food system: A review. Crit. Rev. Food Sci. Nutr. 2015, 55, 1270–1286. [Google Scholar] [CrossRef] [PubMed]
- Liu, J.; Yang, D.; Lu, B.; Zhang, J. Carbon footprint of laptops for export from China: Empirical results and policy implications. J. Clean. Prod. 2016, 113, 674–680. [Google Scholar] [CrossRef]
- He, B.; Pan, Q.; Deng, Z. Product carbon footprint for product life cycle under uncertainty. J. Clean. Prod. 2018, 187, 459–472. [Google Scholar] [CrossRef]
- Te, Q.; Lianghua, C. Carsharing: Mitigation strategy for transport-related carbon footprint. Mitig. Adapt. Strateg. Glob. Chang. 2020, 25, 791–818. [Google Scholar] [CrossRef]
- Xie, J.; Xu, Y.; Li, H. Environmental impact of express food delivery in China: The role of personal consumption choice. Environ. Dev. Sustain. 2021, 23, 8234–8251. [Google Scholar] [CrossRef] [PubMed]
- Li, Z.; Chen, Z.; Yang, N.; Wei, K.; Ling, Z.; Liu, Q.; Chen, G.; Ye, B.H. Trends in research on the carbon footprint of higher education: A bibliometric analysis (2010–2019). J. Clean. Prod. 2021, 289, 125642. [Google Scholar] [CrossRef]
- Mi, Z.; Zheng, J.; Meng, J.; Ou, J.; Hubacek, K.; Liu, Z.; Coffman, D.; Stern, N.; Liang, S.; Wei, Y.-M. Economic development and converging household carbon footprints in China. Nat. Sustain. 2020, 3, 529–537. [Google Scholar] [CrossRef]
- Xie, X.; Cai, W.; Jiang, Y.; Zeng, W. Carbon footprints and embodied carbon flows analysis for China’s eight regions: A new perspective for mitigation solutions. Sustainability 2015, 7, 10098–10114. [Google Scholar] [CrossRef]
- Shen, F.; Simayi, Z.; Yang, S.; Mamitimin, Y.; Zhang, X.; Zhang, Y. A Bibliometric Review of Household Carbon Footprint during 2000–2022. Sustainability 2023, 15, 6138. [Google Scholar] [CrossRef]
- Tian, X.; Geng, Y.; Dong, H.; Dong, L.; Fujita, T.; Wang, Y.; Zhao, H.; Wu, R.; Liu, Z.; Sun, L. Regional household carbon footprint in China: A case of Liaoning province. J. Clean. Prod. 2016, 114, 401–411. [Google Scholar] [CrossRef]
- Yan, Y.; Wang, R.; Chen, S.; Wang, F.; Zhao, Z. Mapping carbon footprint along global value chains: A study based on firm heterogeneity in China. Struct. Change Econ. Dyn. 2022, 61, 398–408. [Google Scholar] [CrossRef]
- Wang, H.; Wu, J.; Lin, W.; Luan, Z. Carbon Footprint Accounting and Influencing Factors Analysis for Forestry Enterprises in the Key State-Owned Forest Region of the Greater Khingan Range, Northeast China. Sustainability 2023, 15, 8898. [Google Scholar] [CrossRef]
- Zhou, Z.; Li, K.; Liu, Q.; Tao, Z.; Lin, L. Carbon footprint and eco-efficiency of China’s regional construction industry: A life cycle perspective. J. Oper. Res. Soc. 2021, 72, 2704–2719. [Google Scholar] [CrossRef]
- Zhao, K.; Xu, X.; Yang, G.; Wu, S.; Jiang, F. Impacts of highway construction and operation on carbon footprint in China: A case study of Jiangsu Province. Environ. Prog. Sustain. Energy 2016, 35, 1468–1475. [Google Scholar] [CrossRef]
- Wang, L.; Yan, Y. Environmental regulation intensity, carbon footprint and green total factor productivity of manufacturing industries. Int. J. Environ. Res. Public Health 2022, 19, 553. [Google Scholar] [CrossRef]
- Yuan, H.; Nie, K.; Xu, X. Relationship between tourism number and air quality by carbon footprint measurement: A case study of Jiuzhaigou Scenic Area. Environ. Sci. Pollut. Res. 2021, 28, 20894–20902. [Google Scholar] [CrossRef]
- Cao, R.; Mo, Y.; Ma, J. Carbon Footprint Analysis of Tourism Life Cycle: The Case of Guilin from 2011 to 2022. Sustainability 2023, 15, 7124. [Google Scholar] [CrossRef]
- Wu, R. The carbon footprint of the Chinese health-care system: An environmentally extended input–output and structural path analysis study. Lancet Planet. Health 2019, 3, e413–e419. [Google Scholar] [CrossRef]
- Long, Y.; Chen, G.; Wang, Y. Carbon footprint of residents’ online consumption in China. Environ. Impact Assess. Rev. 2023, 103, 107228. [Google Scholar] [CrossRef]
- Li, Y.; Wei, Y.; Zhang, X.; Tao, Y. Regional and provincial CO2 emission reduction task decomposition of China’s 2030 carbon emission peak based on the efficiency, equity and synthesizing principles. Struct. Change Econ. Dyn. 2020, 53, 237–256. [Google Scholar] [CrossRef]
- Sheng, X.; Yi, R.; Tang, D.; Lansana, D.D.; Obuobi, B. The severity of foreign direct investment components on China’s carbon productivity. J. Clean. Prod. 2023, 424, 138929. [Google Scholar] [CrossRef]
- Meng, F.; Su, B.; Thomson, E.; Zhou, D.; Zhou, P. Measuring China’s regional energy and carbon emission efficiency with DEA models: A survey. Appl. Energy 2016, 183, 1–21. [Google Scholar] [CrossRef]
- Li, Y.; Sun, X.; Bai, X. Differences of carbon emission efficiency in the belt and road initiative countries. Energies 2022, 15, 1576. [Google Scholar] [CrossRef]
- Lin, B.; Du, K. Modeling the dynamics of carbon emission performance in China: A parametric Malmquist index approach. Energy Econ. 2015, 49, 550–557. [Google Scholar] [CrossRef]
- Ge, G.; Tang, Y.; Zhang, Q.; Li, Z.; Cheng, X.; Tang, D.; Boamah, V. The Carbon Emissions Effect of China’s OFDI on Countries along the “Belt and Road”. Sustainability 2022, 14, 13609. [Google Scholar] [CrossRef]
- Guo, X.; Wang, X.; Wu, X.; Chen, X.; Li, Y. Carbon emission efficiency and low-carbon optimization in Shanxi Province under “Dual Carbon” background. Energies 2022, 15, 2369. [Google Scholar] [CrossRef]
- Zhang, F.; Jin, G.; Li, J.; Wang, C.; Xu, N. Study on dynamic total factor carbon emission efficiency in China’s urban agglomerations. Sustainability 2020, 12, 2675. [Google Scholar] [CrossRef]
- Jiang, H.; Yin, J.; Wei, D.; Luo, X.; Ding, Y.; Xia, R. Industrial carbon emission efficiency prediction and carbon emission reduction strategies based on multi-objective particle swarm optimization-backpropagation: A perspective from regional clustering. Sci. Total Environ. 2024, 906, 167692. [Google Scholar] [CrossRef]
- Liu, D. Convergence of energy carbon emission efficiency: Evidence from manufacturing sub-sectors in China. Environ. Sci. Pollut. Res. 2022, 29, 31133–31147. [Google Scholar] [CrossRef]
- Liu, X.; Hang, Y.; Wang, Q.; Zhou, D. Drivers of civil aviation carbon emission change: A two-stage efficiency-oriented decomposition approach. Transp. Res. Part D Transp. Environ. 2020, 89, 102612. [Google Scholar] [CrossRef]
- Yu, S.; Hu, X.; Zhang, X.; Li, Z. Convergence of per capita carbon emissions in the Yangtze River Economic Belt, China. Energy Environ. 2019, 30, 776–799. [Google Scholar] [CrossRef]
- Zhan, D. Allocation of carbon emission quotas among provinces in China: Efficiency, fairness and balanced allocation. Environ. Sci. Pollut. Res. 2022, 29, 21692–21704. [Google Scholar] [CrossRef]
- Zhou, D.; Zhang, X.; Wang, X. Research on coupling degree and coupling path between China’s carbon emission efficiency and industrial structure upgrading. Environ. Sci. Pollut. Res. 2020, 27, 25149–25162. [Google Scholar] [CrossRef]
- Dong, F.; Zhu, J.; Li, Y.; Chen, Y.; Gao, Y.; Hu, M.; Qin, C.; Sun, J. How green technology innovation affects carbon emission efficiency: Evidence from developed countries proposing carbon neutrality targets. Environ. Sci. Pollut. Res. 2022, 29, 35780–35799. [Google Scholar] [CrossRef]
- Li, L.; Cai, Y.; Liu, L. Research on the effect of urbanization on China’s carbon emission efficiency. Sustainability 2019, 12, 163. [Google Scholar] [CrossRef]
- Liu, L.; Li, M.; Gong, X.; Jiang, P.; Jin, R.; Zhang, Y. Influence mechanism of different environmental regulations on carbon emission efficiency. Int. J. Environ. Res. Public Health 2022, 19, 13385. [Google Scholar] [CrossRef] [PubMed]
- Dan, E.; Shen, J.; Zheng, X.; Liu, P.; Zhang, L.; Chen, F. Asset Structure, Asset Utilization Efficiency, and Carbon Emission Performance: Evidence from Panel Data of China’s Low-Carbon Industry. Sustainability 2023, 15, 6264. [Google Scholar] [CrossRef]
- Li, X.; Cheng, Z. Does high-speed rail improve urban carbon emission efficiency in China? Socio-Econ. Plan. Sci. 2022, 84, 101308. [Google Scholar] [CrossRef]
- Du, Q.; Deng, Y.; Zhou, J.; Wu, J.; Pang, Q. Spatial spillover effect of carbon emission efficiency in the construction industry of China. Environ. Sci. Pollut. Res. 2022, 29, 2466–2479. [Google Scholar] [CrossRef]
- Yi, J.; Zhang, Y.; Liao, K. Regional differential decomposition and formation mechanism of dynamic carbon emission efficiency of China’s logistics industry. Int. J. Environ. Res. Public Health 2021, 18, 13121. [Google Scholar] [CrossRef]
- Li, J.; Cheng, Z. Study on total-factor carbon emission efficiency of China’s manufacturing industry when considering technology heterogeneity. J. Clean. Prod. 2020, 260, 121021. [Google Scholar] [CrossRef]
- Ding, L.; Yang, Y.; Wang, W.; Calin, A.C. Regional carbon emission efficiency and its dynamic evolution in China: A novel cross efficiency-malmquist productivity index. J. Clean. Prod. 2019, 241, 118260. [Google Scholar] [CrossRef]
- Chen, Y.; Xu, W.; Zhou, Q.; Zhou, Z. Total factor energy efficiency, carbon emission efficiency, and technology gap: Evidence from sub-industries of Anhui province in China. Sustainability 2020, 12, 1402. [Google Scholar] [CrossRef]
- Gao, P.; Yue, S.; Chen, H. Carbon emission efficiency of China’s industry sectors: From the perspective of embodied carbon emissions. J. Clean. Prod. 2021, 283, 124655. [Google Scholar] [CrossRef]
- Zhong, J. Biased technical change, factor substitution, and carbon emissions efficiency in China. Sustainability 2019, 11, 955. [Google Scholar] [CrossRef]
- Chen, J.; Cheng, S.; Song, M.; Wang, J. Interregional differences of coal carbon dioxide emissions in China. Energy Policy 2016, 96, 1–13. [Google Scholar] [CrossRef]
- He, W.; Liu, D.; Wang, C. Are Chinese provincial carbon emissions allowances misallocated over 2000–2017? Evidence from an extended Gini-coefficient approach. Sustain. Prod. Consum. 2022, 29, 564–573. [Google Scholar] [CrossRef]
- Liu, X.; Yang, X.; Guo, R. Regional differences in fossil energy-related carbon emissions in China’s eight economic regions: Based on the Theil index and PLS-VIP method. Sustainability 2020, 12, 2576. [Google Scholar] [CrossRef]
- Dai, S.; Qian, Y.; He, W.; Wang, C.; Shi, T. The spatial spillover effect of China’s carbon emissions trading policy on industrial carbon intensity: Evidence from a spatial difference-in-difference method. Struct. Change Econ. Dyn. 2022, 63, 139–149. [Google Scholar] [CrossRef]
- Song, W.; Yin, S.; Zhang, Y.; Qi, L.; Yi, X. Spatial-temporal evolution characteristics and drivers of carbon emission intensity of resource-based cities in China. Front. Environ. Sci. 2022, 10, 972563. [Google Scholar] [CrossRef]
- Niu, X.; Ma, Z.; Ma, W.; Yang, J.; Mao, T. The spatial spillover effects and equity of carbon emissions of digital economy in China. J. Clean. Prod. 2024, 434, 139885. [Google Scholar] [CrossRef]
- Zhou, X.; Zhou, M.; Zhang, M. Contrastive analyses of the influence factors of interprovincial carbon emission induced by industry energy in China. Nat. Hazards 2016, 81, 1405–1433. [Google Scholar] [CrossRef]
- Zhang, X.; Shen, M.; Luan, Y.; Cui, W.; Lin, X. Spatial evolutionary characteristics and influencing factors of urban industrial carbon emission in China. Int. J. Environ. Res. Public Health 2022, 19, 11227. [Google Scholar] [CrossRef] [PubMed]
- Du, Q.; Xu, Y.; Wu, M.; Sun, Q.; Bai, L.; Yu, M. A network analysis of indirect carbon emission flows among different industries in China. Environ. Sci. Pollut. Res. 2018, 25, 24469–24487. [Google Scholar] [CrossRef] [PubMed]
- Wang, J.; Zhao, T.; Zhang, X. Changes in carbon intensity of China’s energy-intensive industries: A combined decomposition and attribution analysis. Nat. Hazards 2017, 88, 1655–1675. [Google Scholar] [CrossRef]
- Li, L.; Hong, X.; Peng, K. A spatial panel analysis of carbon emissions, economic growth and high-technology industry in China. Struct. Chang. Econ. Dyn. 2019, 49, 83–92. [Google Scholar] [CrossRef]
- Wei, L.; Wang, Z. Differentiation Analysis on Carbon Emission Efficiency and Its Factors at Different Industrialization Stages: Evidence from Mainland China. Int. J. Environ. Res. Public Health 2022, 19, 16650. [Google Scholar] [CrossRef] [PubMed]
- Sun, Y.Y.; Gossling, S.; Zhou, W. Does tourism increase or decrease carbon emissions? A systematic review. Ann. Tour. Res. 2022, 97, 103502. [Google Scholar] [CrossRef]
- Zheng, J.; Mi, Z.; Coffman, D.M.; Milcheva, S.; Shan, Y.; Guan, D.; Wang, S. Regional development and carbon emissions in China. Energy Econ. 2019, 81, 25–36. [Google Scholar] [CrossRef]
- Xiong, C.; Chen, S.; Gao, Q.; Xu, L. Analysis of the influencing factors of energy-related carbon emissions in Kazakhstan at different stages. Environ. Sci. Pollut. Res. 2020, 27, 36630–36638. [Google Scholar] [CrossRef]
- Zhao, L.; Yang, C.; Su, B.; Zeng, S. Research on a single policy or policy mix in carbon emissions reduction. J. Clean. Prod. 2020, 267, 122030. [Google Scholar] [CrossRef]
Disclaimer/Publisher’s Note: The statements, opinions and data contained in all publications are solely those of the individual author(s) and contributor(s) and not of MDPI and/or the editor(s). MDPI and/or the editor(s) disclaim responsibility for any injury to people or property resulting from any ideas, methods, instructions or products referred to in the content. |
© 2024 by the authors. Licensee MDPI, Basel, Switzerland. This article is an open access article distributed under the terms and conditions of the Creative Commons Attribution (CC BY) license (https://creativecommons.org/licenses/by/4.0/).