Article

Research on the Effect of Marketization Reform on the Price of Aviation Kerosene in China

1
School of Economics and Management, China University of Petroleum, Beijing 102249, China
2
W.P. Carey School of Business, Arizona State University, Tempe, AZ 85287, USA
3
Business School, University of Edinburgh, Edinburgh EH8 9JS, UK
4
China Institute of Marine Technology and Economy, Beijing 100081, China
5
Business School, Henan Normal University, Xinxiang 453007, China
6
School of Economics and Management, University of Science and Technology Beijing, Beijing 100083, China
*
Authors to whom correspondence should be addressed.
Sustainability 2024, 16(5), 2104; https://doi.org/10.3390/su16052104
Submission received: 24 January 2024 / Revised: 23 February 2024 / Accepted: 29 February 2024 / Published: 3 March 2024
(This article belongs to the Section Economic and Business Aspects of Sustainability)

Abstract

:
The development of the aviation industry relies heavily on stable kerosene prices, and price fluctuations have an impact on its economic sustainability. To explore the effect of China’ s implementation of market-oriented reform of aviation kerosene prices, our study aims to evaluate the dynamic correlation between China’s aviation kerosene prices and Singapore’s CIF price, supply and demand, domestic economic development level and other market-oriented factors. To this end, in this paper, monthly data from 2006 to 2019 were selected for the variables mentioned above and, based on multiple econometric techniques, the influence of market factors on the price of aviation kerosene in China was studied. The empirical results confirm that the current Chinese aviation kerosene price has a significant linking effect with the CIF price of Singapore’s imports and is affected by the level of domestic demand. China’s aviation kerosene price is more affected by international oil and gas market factors relative to fundamental factors in the domestic market. The long- and short-term Granger causality test results also show that the market-oriented reform of China’s aviation kerosene field is beginning to take effect. Finally, the article discusses and puts forward suggestions for promoting China’s market-oriented price reform for refined oil products and the sustainable development of the aviation industry.

1. Introduction

China is one of the largest aviation markets in the world. With the rapid development of China’s aviation industry and international air transportation, China’s huge demand for aviation kerosene is increasing [1]. At present, aviation kerosene, as the main type of aviation fuel, is mainly used in jet aircraft and turboprop aircraft used for public air transportation and as transport aircraft [2,3]. In 2019, the capacity structure of China’s aviation kerosene underwent great changes. With the rapid growth in production capacity, the supply capacity rose. On the demand side, with the expansion of the size of the market, market demand became strong; the CIF price of aviation kerosene and imported bonded aviation kerosene fluctuated upward, and the growth rate of the aviation kerosene consumption index showed regional differences [4]. Under the implementation of global environmental protection policies, market-oriented reforms may incentivize airlines to focus more on improving aircraft fuel efficiency and reducing energy consumption, and promote the development of sustainable fuel markets. This contributes to lowering the aviation industry’s carbon footprint, in alignment with sustainability goals [5,6]. China has intensified research efforts on aviation kerosene to enhance energy efficiency. Simultaneously, the country is implementing pricing mechanism reforms to achieve energy conservation goals in the transportation sector [7]. In addition, since 2006, the country began to promote the elimination of monopolies in the aviation kerosene sector [8], and marketization began to take shape. The “Notice of the National Development and Reform Commission on Promoting the Market-oriented Reform of Aviation Kerosene” was promulgated in 2011 (National Development and Reform Commission, http://www.ndrc.gov.cn (accessed on 21 December 2023). The ex-factory price of China’s aviation kerosene is linked to the CIF price in the Singaporean market [9]; taking into account market supply and demand, domestic macroeconomic conditions and other factors [10]. The continuous expansion of the aviation kerosene market and the trend of market reforms [11] have made the direction of the marketization of the price of aviation kerosene and price influencing factors at this stage urgent issues to be solved [12,13].
The literature closely related to this research is divided into two categories (see Table 1). The first is about the price correlation between refined oil products and other energy products. The second type of research focuses on the factors affecting the price of refined oil products.
Quantitative empirical research on correlations between refined oil prices is mostly conducted in a specific region over a certain period. Among these researchers, Borenstein et al. separately studied the correlation between the refined oil and crude oil prices in Northern Europe. The study showed that refined oil reacted quickly to increases in the crude oil price [14]. Asche et al. analyzed the relationship between international crude oil and the Nordic refined oil price and found the long-term relationship between refined oil and crude oil prices [15]. Bettendorf et al. found that the asymmetric reaction of gasoline to changes in the crude oil price is not universal but depends on the data selected [16]. Based on an error correction model, using the international oil price and gasoline price data in the United States, Kaufmann et al. concluded that the price asymmetry was anormal phenomenon of effective market operation [17]. Bumpass et al. examined the long-term relationship between the spot price of crude oil and the retail and wholesale prices of refined oil. The results showed that the gasoline retail price and the refined oil wholesale price could both respond symmetrically to the impact of homeowners [18]. Kpodar et al. estimated and tested the shock effect of the international crude oil price on the retail price of refined oil products and believed that this effect existed. At the same time, they proposed that region and income would have a moderating effect on this process and believed that the upward and downward adjustment of the international crude oil price would have an asymmetric effect on the retail price of refined oil products, and that the effect of the decrease is relatively insignificant [19]. Esteban et al. derived the spillover effect of international crude oil prices on refined oil product prices by using the VAR-BECK-GARCH model, and then tried to predict wholesale prices by using the PCA-BP neural network model [20]. He et al. found that China’s oil oligarchs had a near-monopoly on the market, leading to asymmetric pricing in the refined oil market [21].
Some scholars have adopted multiple methods to evaluate the effect of the implementation of price reform on the refined oil market and the factors influencing it. Asche et al. used the multivariate Johansen test method to analyze the correlation between crude oil, natural gas, kerosene and naphtha prices [15]. Michael et al. quantified the impact of oil industry consolidation on the refined oil price, while controlling other factors that may affect prices [22]. Hussein et al. qualitatively analyzed the impact of policy factors such as demand for refined oil, levels of subsidy, policy costs and other policy factors on the refined oil price. They empirically explained the reasons for lower domestic energy prices and then discussed how to proceed to cancel subsidies reasonably [23]. Luo et al. analyzed the development trends of the domestic aviation oil market, and analyzed the influence of consumption and distribution, output and distribution, import and export and other factors on domestic aviation fuel [24]. Chen et al. explored the asymmetry of responses to refined oil prices in China using daily panel data to introduce trade and price regulation [25]. Zhang et al. explored how, in the long run, controls on refined oil prices should be gradually released, and the market price of refined oil should gradually be formed to reflect the relationship between supply and demand [26].
Existing studies have focused on the relationship between refined oil products and crude oil prices in specific countries, regions and worldwide. However, empirical research on the factors affecting the price of refined oil products and the implementation effect of market-oriented reforms in the area of aviation kerosene is scarce. In the above context, this study discusses the impact of marketization factors mentioned in the reform policy on the price of aviation kerosene and its mechanisms, taking China as an example to evaluate the implementation effects of marketization policies on aviation kerosene prices.
The main contributions are as follows: First, most existing research has focused on common oil products, such as gasoline and diesel. As aviation kerosene plays a more important role in the Chinese refined oil market, this article mainly concentrates on the China’s aviation kerosene, thus expanding relevant research on the price reform of the refined oil market. Second, to explore the effect of implementing China’s aviation oil market reform policy, this paper quantitatively studies the effects of market fundamentals and international oil prices on China’s aviation kerosene price. Third, multiple econometrics models, such as the VECM and ARDL models were applied to explore the short- and long-term relationships between the variables.
Regarding the estimation methods, we used two methods, the vector error correction model (VECM) and the autoregressive distributed lag model (ARDL), to estimate model parameters. Firstly, we conducted unit root tests to determine the integration order of the time series and ensure the stability of our data. Next, we performed cointegration tests to determine if there exists a long-term equilibrium relationship between the variables. Subsequently, we conducted regression analysis using different estimation methods (such as OLS, FMOLS, DOLS and IMOLS) to assess the impact of market factors on the price of aviation kerosene in China. We also conducted robustness analysis, verifying the stability of estimated parameters through CUSUM tests. Finally, we employed the VECM and ARDL methods to test the long-term and short-term Granger causality between variables. Through these steps, we were able to comprehensively analyze the impact of market factors on the price of aviation kerosene in China and provide reasonable policy recommendations.
The rest of the research structure is organized as follows. Section 2 sums up the development status of China’s aviation kerosene market. Section 3 describes the methods and data used. Section 4 presents the empirical results. Section 5 summarizes the results and puts forward important policy recommendations.

2. The Status of China’s Aviation Kerosene Market and Analysis of Price Influencing Factors

2.1. Analysis of the Status of the Supply and Demand of China’s Aviation Kerosene

In recent years, China’s aviation kerosene output has continued to grow. According to the data (Figure 1) released by the China Petroleum Planning and Engineering Institute, China National Petroleum Corporation, China’s aviation kerosene output increased from 6.3 million tons to 11.03 million tons from 2000 to 2008, and the proportion of kerosene production rose from 73.9% in 2000 to 95.2% in 2008. In 2015, China’s aviation coal production was 36.4 million tons [25]. In 2019, China’s aviation kerosene production was 52.52 million tons, an increase of 10.5% year-on-year, and aviation kerosene production accounted for approximately 99.6% of kerosene production. In general, China’s aviation kerosene production has gradually increased, but the growth rate has shown a trend of volatility and decline.
At the consumption level, the apparent consumption of aviation kerosene in China from 2006 to 2019 showed a continuous growth trend. In 2019, the apparent consumption of aviation kerosene in China was 38.49 million tons and the growth of the consumer market has slowed significantly [27]. There are two main reasons for the slowdown in the growth rate of the market for aviation kerosene. Firstly, the civil aviation transportation industry in the downstream market has slowed down in recent years. In 2019, the civil aviation transportation industry completed a total transportation turnover of 129.27 billion ton kilometers, with an increase of 7.1%, and the growth decreased by 4.3 percentage points from 2018. Secondly, China’s civil aviation transportation industry has made greater progress in energy conservation and emission reduction targets. There is a positive effect on improving fuel quality and promoting energy saving and emission reduction. Based on the “Statistical Bulletin of Civil Aviation Industry Development”, annually issued by the Civil Aviation Administration, China’s civil aviation fuel consumption per ton-kilometer in 2018 was 0.287 kg (28,700 tons/billion ton-kilometer), 15.6% lower than the 2005 energy saving and emission reduction target [28] (Civil Aviation Administration of China, http://www.caac.gov.cn (accessed on 21 December 2023). In general, China’s kerosene production and consumption from 2006 to 2019 showed an overall growth trend, and the consumption growth was higher than the production growth rate for most of that time.

2.2. Analysis of the Current Situation of China’s Aviation Kerosene Import and Export Markets

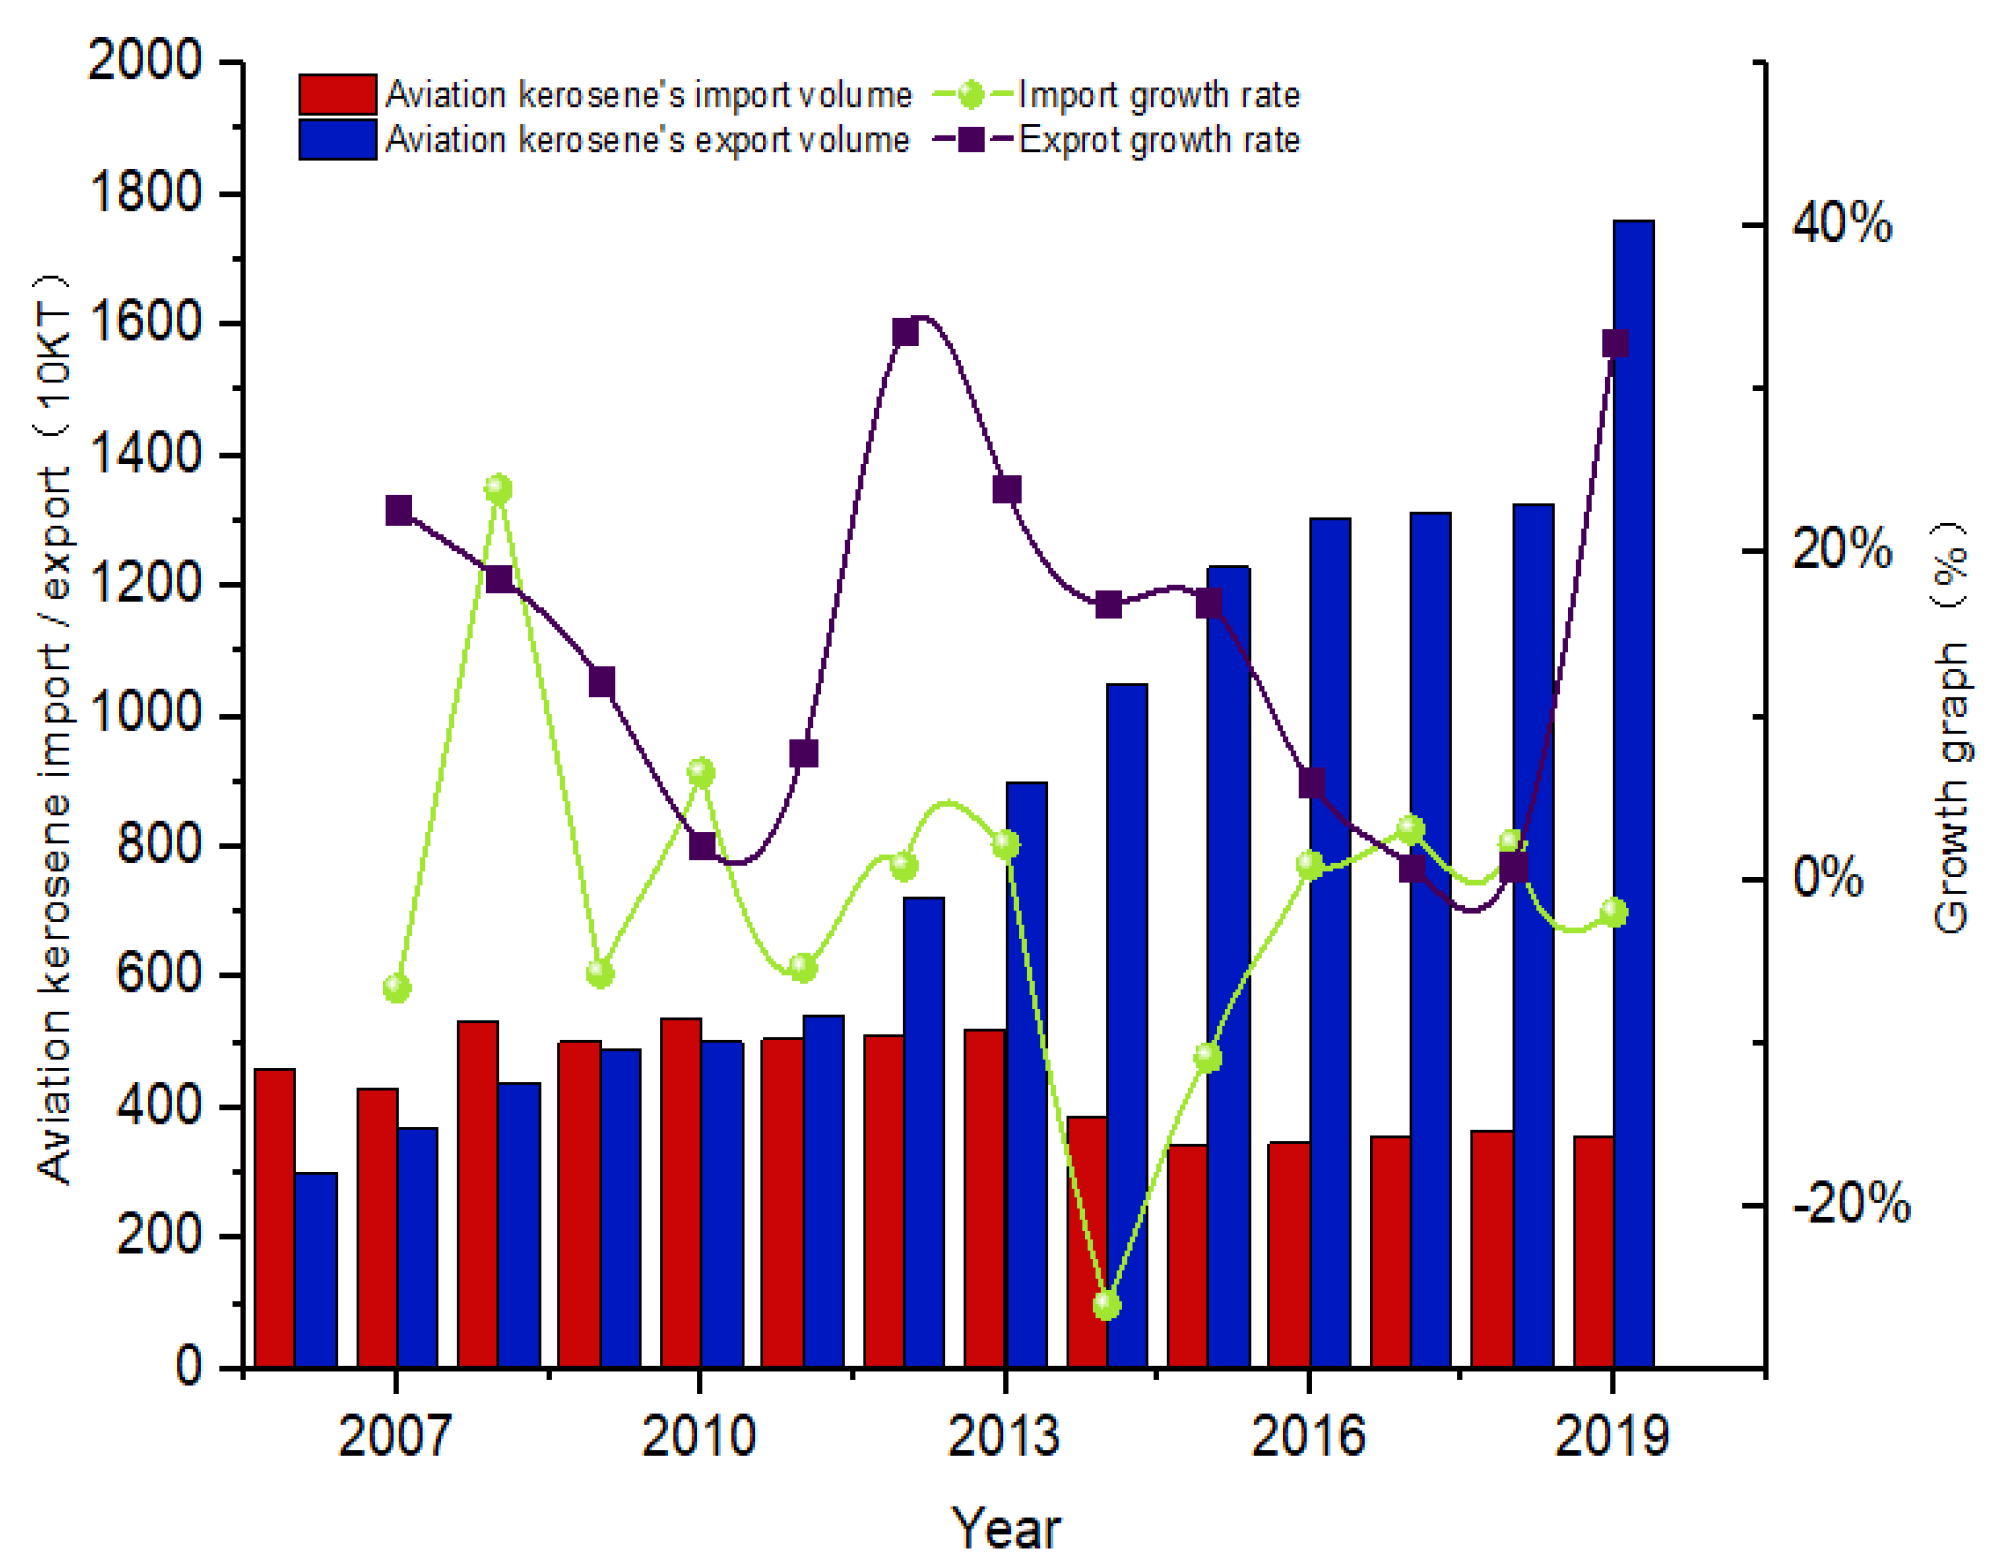
The domestic aviation kerosene market has shifted from short supply to oversupply, and local market imbalances have gradually eased. Before 2010, domestic aviation kerosene was in short supply, and net imports of aviation kerosene were needed every year to make up for the domestic resource gap. With the increase in domestic refining capacity and the stability of aviation kerosene prices, domestic aviation kerosene supply gradually began to show a surplus after 2010. By 2019, the net export volume of aviation kerosene had reached 17.6121 million tons, as shown in Figure 2. Affected by the uneven distribution of aviation kerosene resources and consumption, there remains an imbalance in the supply and demand of aviation kerosene in various regions in China, as shown in Figure 3. Northeast China, East China, South China, Central China, and Northwest China have excess resources: North China has a large demand due to the increase in bonded oil on foreign airlines, and there is a large gap in supply and demand. With many petroleum refineries coming into operation in Southwest China, the gap in local aviation kerosene resources has been bridged, greatly alleviating the shortage of local aviation kerosene resources, and optimizing the configuration of the aviation fuel supply network.

2.3. Analysis of the Current Situation of China’s Aviation Kerosene Prices

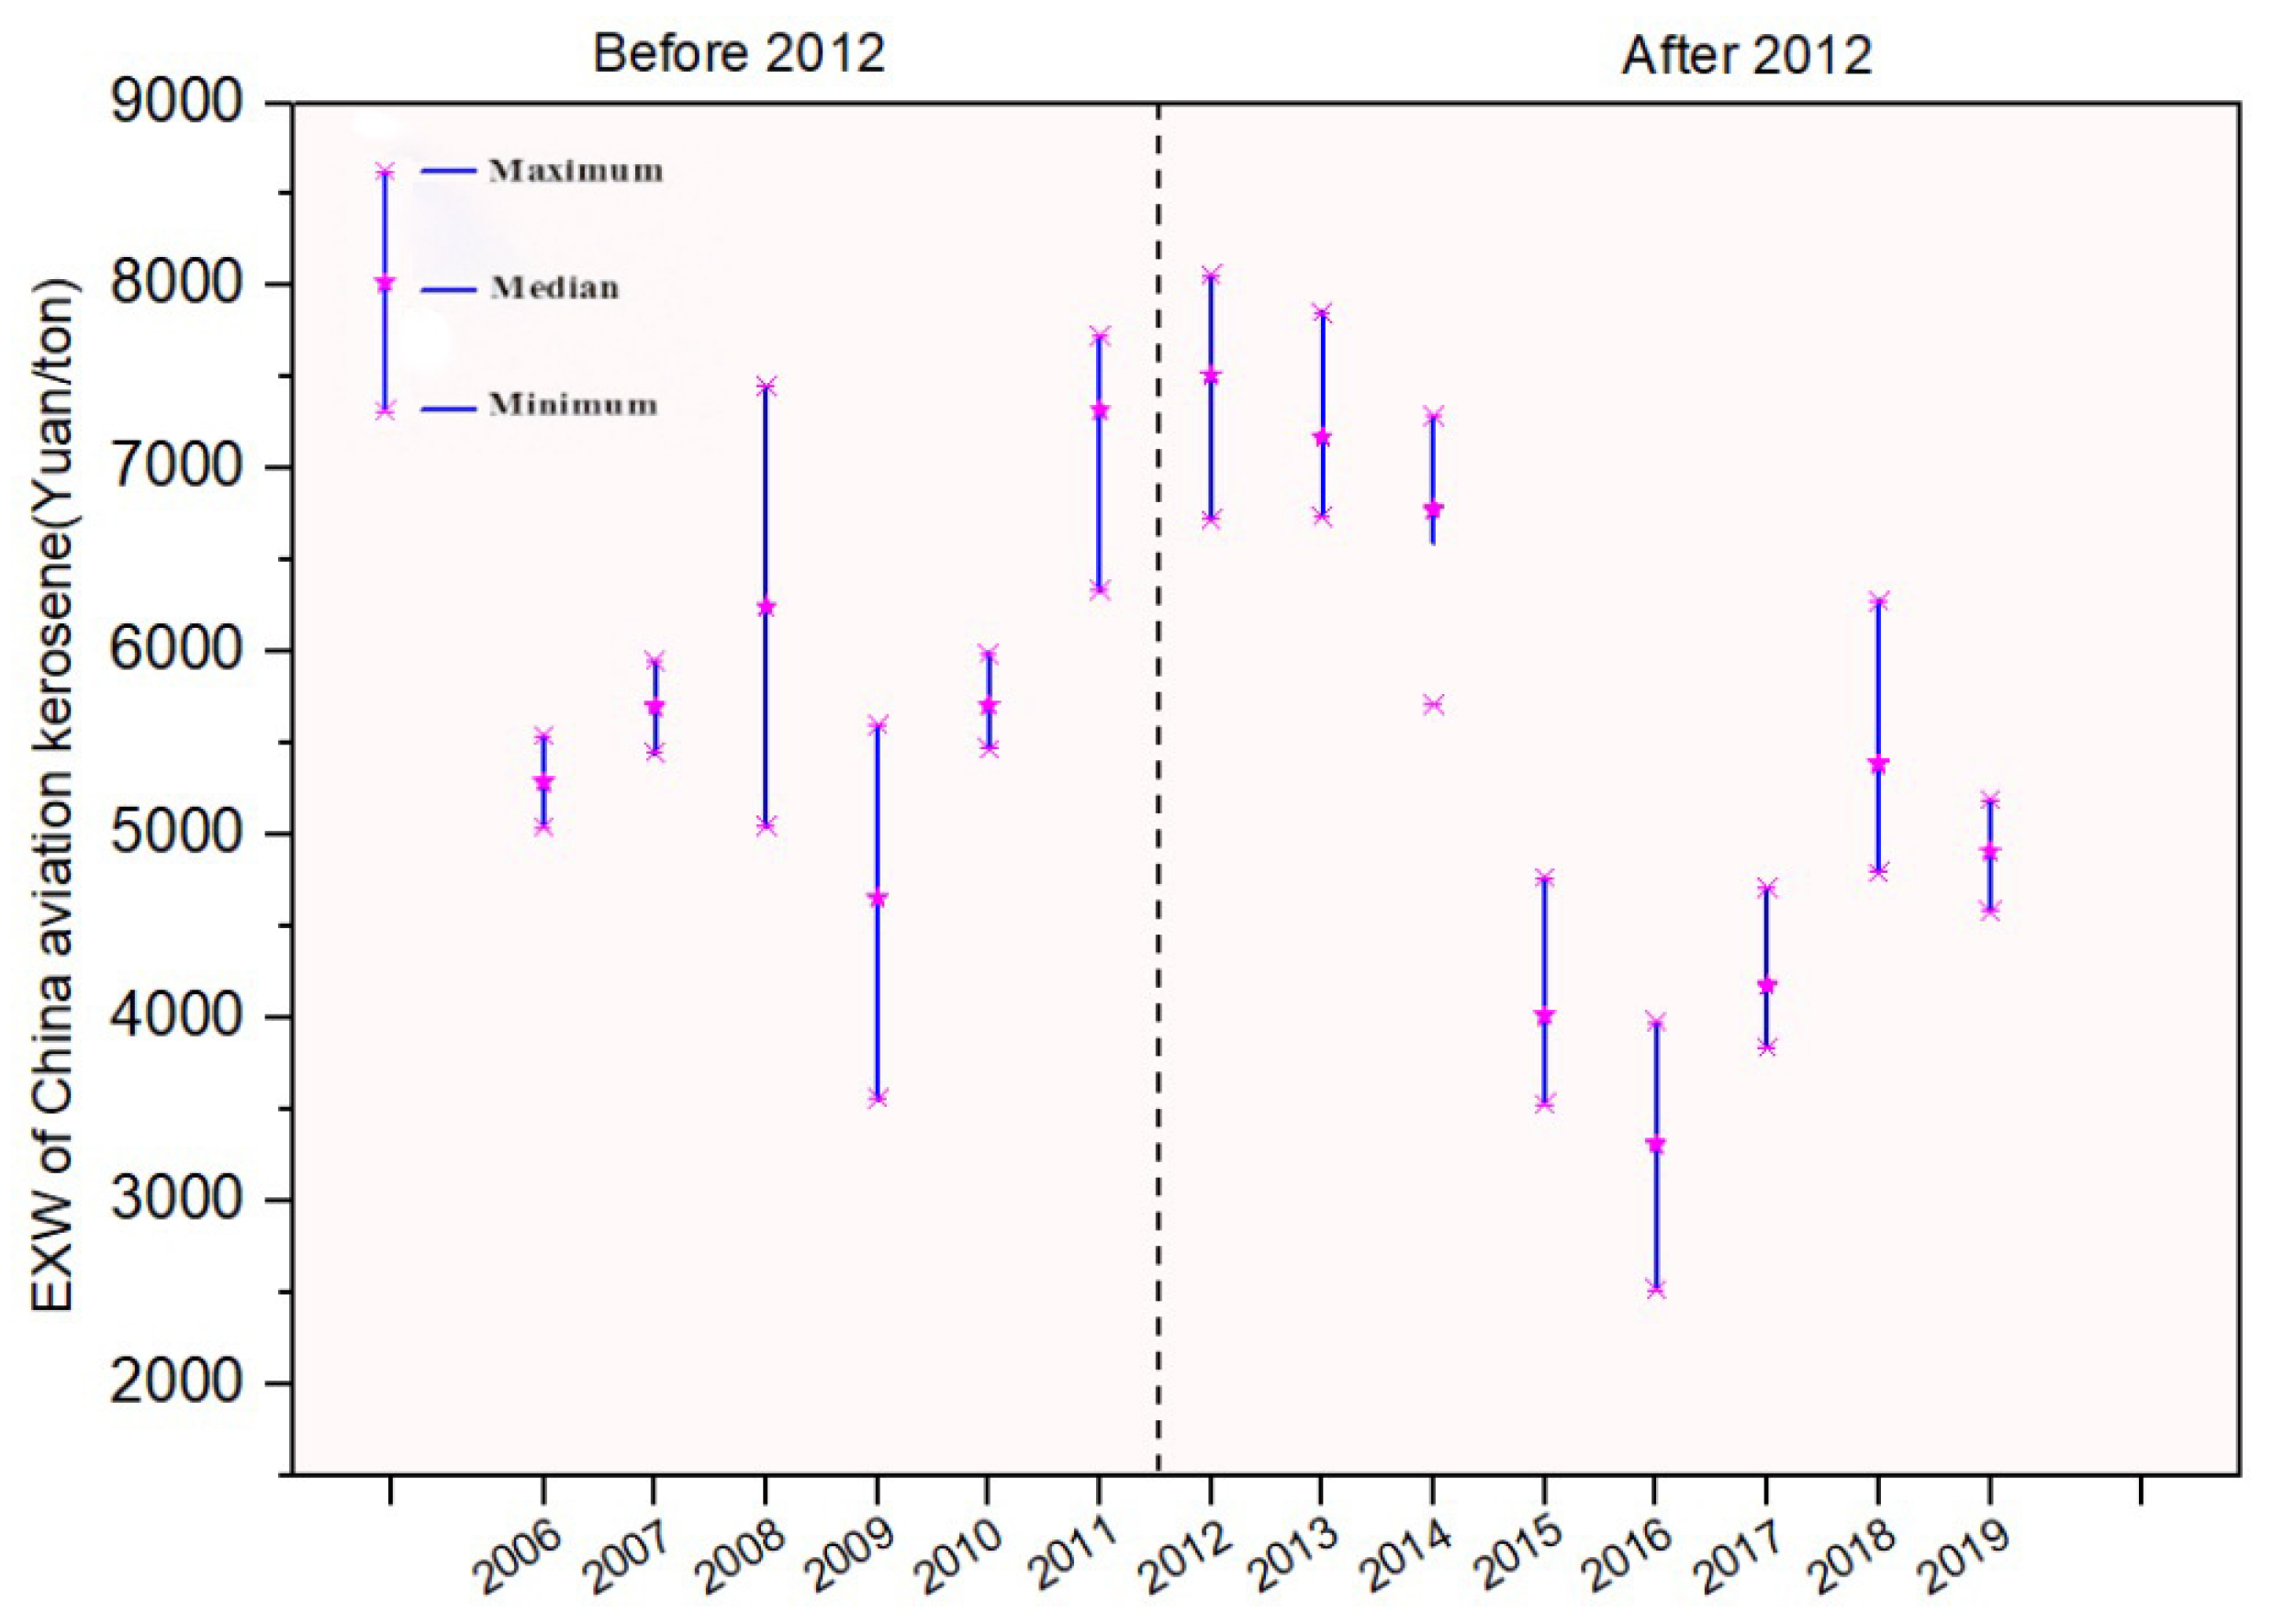
We analyze the changing trend of China’s ex-factory aviation kerosene prices from 2006 to 2019. It can be seen from Figure 4 that the price of aviation kerosene showed an overall upward trend before the policy was promulgated in 2011.
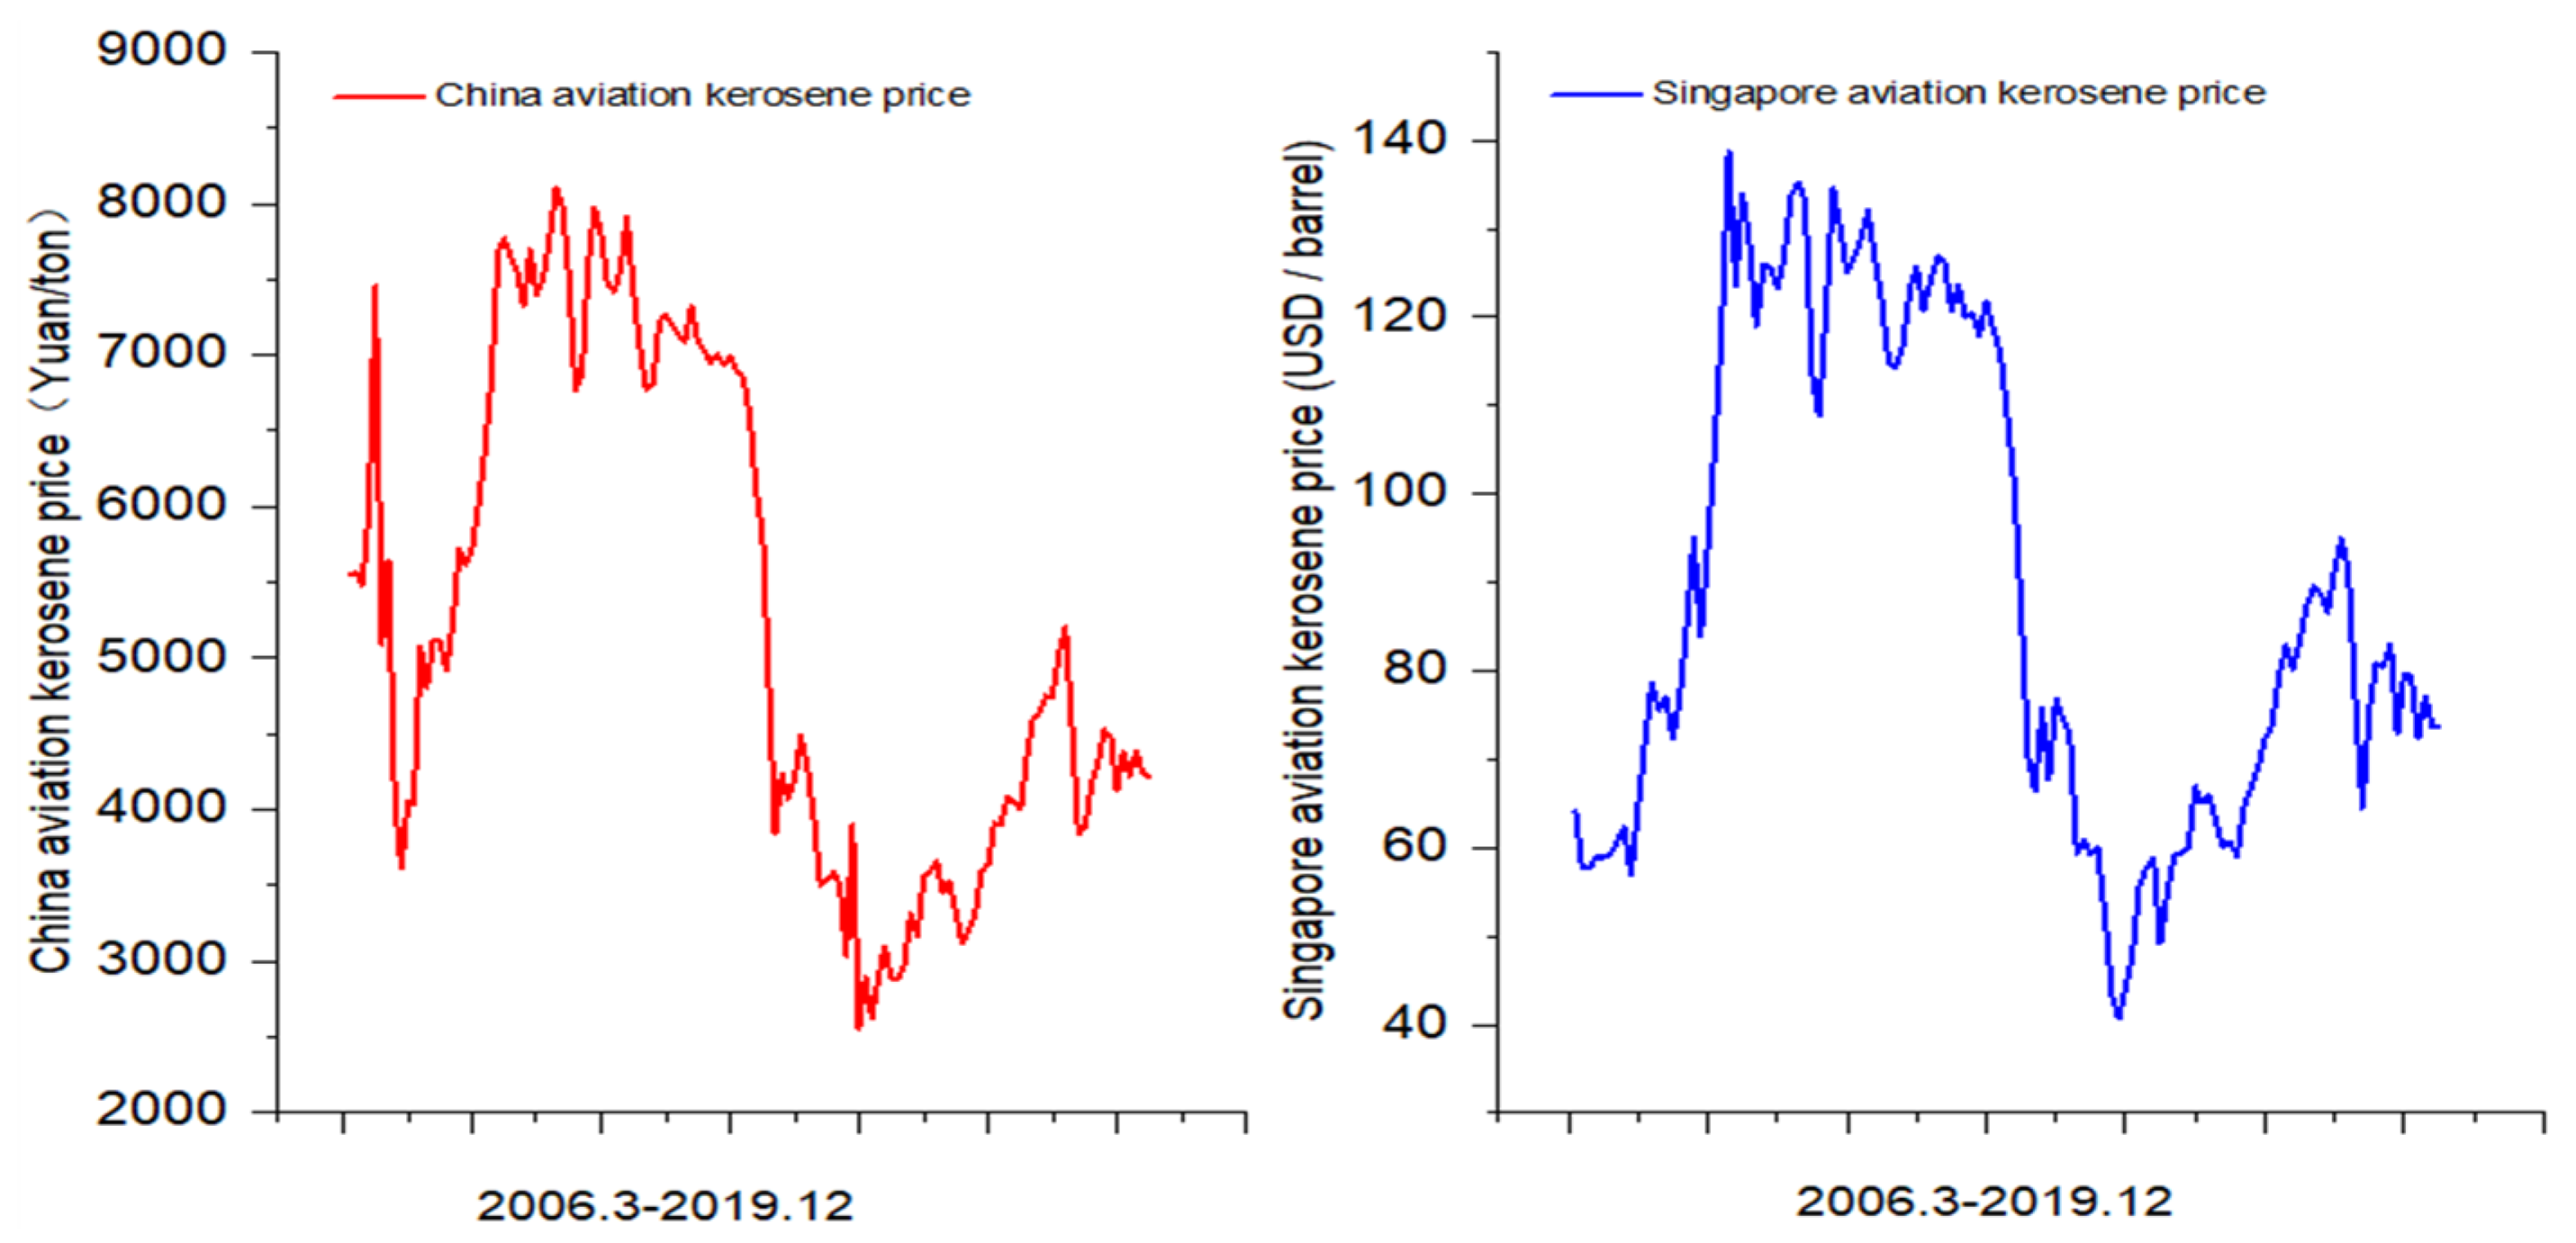
The “Notice on Promoting the Market-oriented Reform of Aviation Kerosene Price” posted by the China National Development and Reform Commission in 2011 pointed out that China’s aviation kerosene prices are adjusted for premiums based on the CIF price of aviation kerosene on the Singaporean market (National Development and Reform Commission, http://www.ndrc.gov.cn (accessed on 21 December 2023)). With further deepening of the market-oriented reform of China’s refined oil prices, China’s aviation kerosene prices and international crude oil prices exhibit strong correlations, and both have gradually attained a price linkage relationship [29], which can be seen from the fluctuation trend in Figure 5. However, with a one-month adjustment cycle set, China’s aviation kerosene price lags behind the international crude oil price [30].

3. Materials and Methods

3.1. Equation Specification

To study the respective effects of market factors on the retail price of aviation kerosene in China, this study first carried out a baseline regression model and the relationship between variables can be estimated as follows:
ln ( A V K c ) t = β 0 + β 1 ln ( G D P s ) t + β 2 ln ( V s ) t + β 3 ln S t + β 4 ln D t + μ t
where A V K c is China’s aviation kerosene retail price, V s is the CIF price of aviation kerosene on the Singaporean market; S is the supply, D is the demand; G D P is the gross domestic product, which is used to measure domestic macroeconomic development.
According to the research of Dong et al., using the domestic macroeconomic situation represented by G D P as a variable in this study, there will be nonlinear effects [31]. To effectively test the impact of various market-oriented factors on the price of China’s aviation fuel, we added the square of G D P as the new variable. The extended model used is as follows:
ln ( A V K c ) t = β 0 + β 1 ln ( G D P s ) t + β 2 [ ln ( G D P s ) t ] 2 + β 3 ln ( V s ) t + β 4 ln S t + β 5 ln D t + μ t

3.2. Estimation Methods

The estimation method includes five key steps technically. First, determine the integration level of variables so that we can analysis the long-term equilibrium relationship among variables, then further conduct co-integration analysis; therefore, considering the structural mutations in the sequence, Zivot and Andrews’ structural break unit roots model is used in this paper to test the stationarity of variables. Next, given the relationship between China’s aviation kerosene price ( A V K c ), Singapore’s aviation kerosene CIF ( V s ), supply ( S ), demand ( D ), and macroeconomic development ( G D P ), the study uses the classic Johanson co-integration test to study whether there is a co-integration relationship between the variables. Third, after confirming the co-integration relationship between all selected variables, the regression test is used. Next, we perform robustness analysis to ensure the stability of the estimated parameters obtained by the ARDL boundary test method and further provide important policy recommendations. Finally, the VECM–Granger causality method is used to study the causal relationship between China’s aviation kerosene price, macroeconomic development, and supply and demand.

3.2.1. Structural Break Unit Roots Test

Firstly, the difference order of variables is to be determined. Mrabet et al. [32] and Rafindadi et al. [33] proposed that if there are structural fractures in the data, traditional unit root tests (such as the ADF Fisher test proposed by Maddala and Wu [34]) are unreliable. To solve this problem, the unit root test by Zivot and Andrews [35] was used, because it considers the endogenous structural mutation in the sequence.

3.2.2. Johansen Co-Integration Test

Since Engel and Granger introduced the residual-based co-integration test, the test method of the long-term co-integration relationship in the series has gradually been developed [36]. However, the Engle and Granger co-integration test has a key econometric weakness. It requires that all sequences have a unified order of integration, and it is impossible to test the co-integration relationship between more than two variables. Therefore, there may be certain deviations and limitations of the result of this co-integration test. Therefore, Johansen, based on previous experience, proposed a method of multivariate co-integration test regression coefficient based on vector autoregressive model, usually called the Johansen test, or J-J test [37]. As far as the test method of the co-integration relationship is concerned, the Johansen co-integration test method can effectively avoid the limitations of the E-G two-step method. Therefore, in the empirical research of this article, the Johansen co-integration method was used to test whether there is a long-term and stable equilibrium relationship between the Chinese aviation kerosene price ( A V K c ) and the CIF price of aviation kerosene on the Singaporean market ( V s ), supply ( S ), demand ( D ), and macroeconomic development ( G D P ) [38].
According to the basic principle that the rank of a matrix is equal to the number of its non-zero characteristic roots, the Johansen co-integration test tests the co-integration relationship and the rank of the co-integration vector by testing the number of non-zero characteristic roots. Suppose the characteristic root of the matrix δ 1 > δ 2 > … > δ k , the null hypothesis of the co-integration model can be written as: H r 0 : δ r > 0 , δ r + 1 = 0 , the alternative hypothesis is H r 1 : δ r + 1 > 0 r = 0, 1, …, k − 1. The corresponding statistics are:
η r = n i = r + 1 k ln ( 1 δ r )     ( r   =   0 ,   1 ,   k     1 )
Among them are the trace statistics. If the estimated value of F statistics is greater than the critical value in the Johansen co-integration test, we will reject the null hypothesis that there is no co-integration relationship in the Johansen co-integration test.

3.2.3. Regression Analysis

Since the least squares method (OLS) was proposed, research on the method of regression analysis has flourished. To overcome the spurious regression and endogeneity, Phillips A T and Rosen J B proposed the fully modified least squares method (FMOLS) [39], which was later improved by Pedroni [40]. Kao and Chiang proposed the dynamic least squares estimation method (DOLS), and then some scholars proposed the IMOLS method [41]. Since these four regression analysis methods have their own advantages and disadvantages, this article uses the above four methods to analyze the Chinese aviation kerosene price ( A V K c ), the Singaporean market aviation kerosene CIF price ( V s ), and the supply under the linear model and quadratic model. A regression analysis was carried out of the quantity ( S ), demand ( D ), and macroeconomic development ( G D P ).

3.2.4. Robustness Analysis

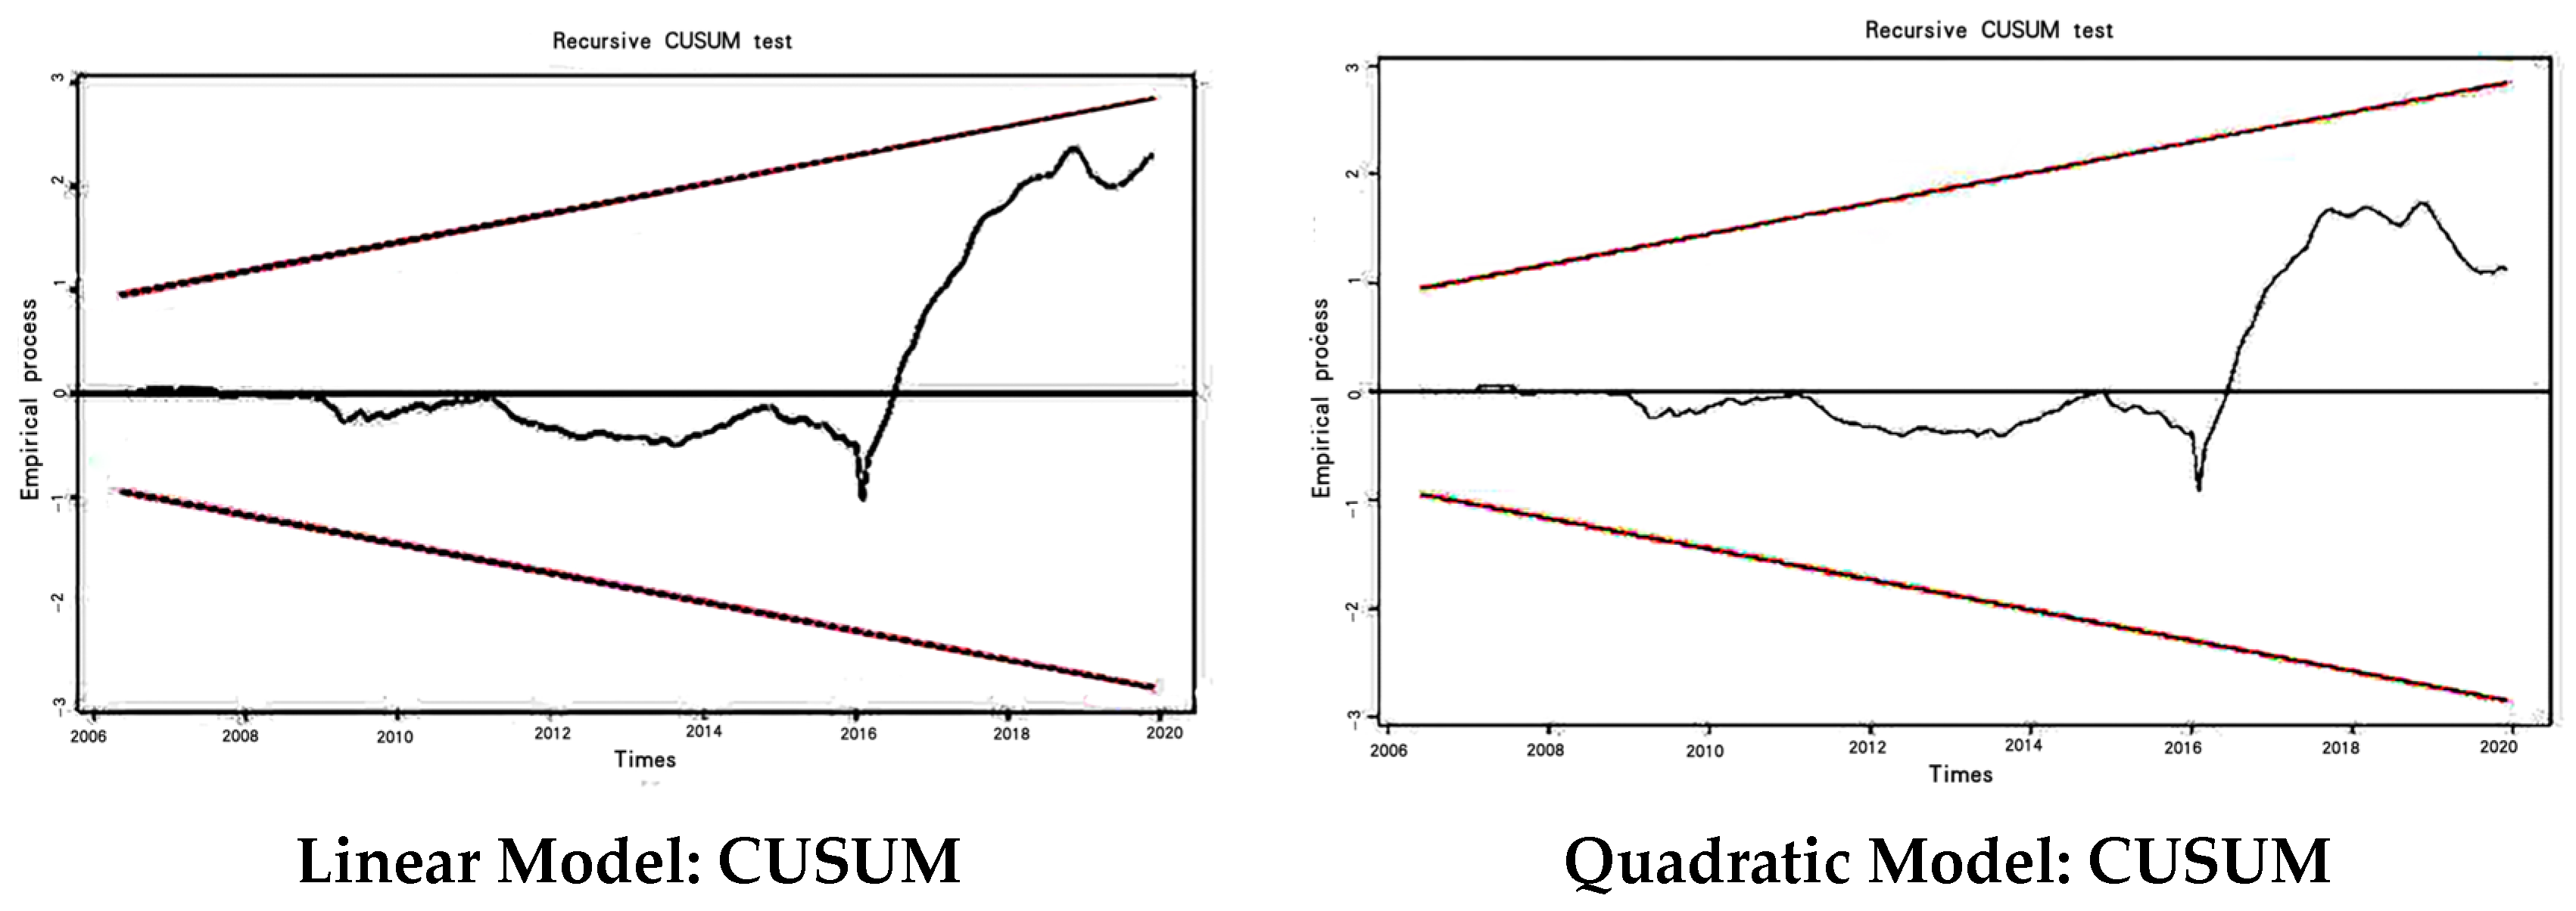
In addition, this study uses the cumulative sum model (CUSUM) to test endogeneity, model structure stability, and the stability of long-term and short-term estimates. If the CUSUM statistics remain within the 5% level of significance, then all parameters and regression relationships are stable.

3.2.5. Vector Granger Causality Test

In order to deeply understand the effects of the market-oriented reform of China’s aviation kerosene price, this paper adopts the vector Granger causality method to point out the direction of the causal relationship between the Chinese aviation kerosene price ( A V K c ), the CIF price of aviation kerosene on the Singaporean market ( V s ), supply ( S ), demand ( D ), and macroeconomic development variables ( G D P ). VECM can use the following algorithms:
Δ ln ( A V K ) t Δ ln G D P t Δ ln G D P t 2 Δ ln ( V s ) t Δ ln S t Δ ln D t = b 1 b 2 b 3 b 4 b 5 b 6 + B 11 , 1 B 12 , 1 B 13 , 1 B 14 , 1 B 15 , 1 B 16 , 1 B 21 , 1 B 22 , 1 B 23 , 1 B 24 , 1 B 25 , 1 B 26 , 1 B 31 , 1 B 32 , 1 B 33 , 1 B 34 , 1 B 35 , 1 B 36 , 1 B 41 , 1 B 42 , 1 B 43 , 1 B 44 , 1 B 45 , 1 B 46 , 1 B 51 , 1 B 52 , 1 B 53 , 1 B 54 , 1 B 55 , 1 B 56 , 1 B 61 , 1 B 62 , 1 B 63 , 1 B 64 , 1 B 65 , 1 B 66 , 1 × Δ ln ( A V K ) t - 1 Δ ln G D P t - 1 Δ ln G D P t - 1 2 Δ ln ( V s ) t - 1 Δ ln S t - 1 Δ ln D t - 1 + + B 11 , m B 12 , m B 13 , m B 14 , m B 15 , m B 16 , m B 21 , m B 22 , m B 23 , m B 24 , m B 25 , m B 26 , m B 31 , m B 32 , m B 33 , m B 34 , m B 35 , m B 36 , m B 41 , m B 42 , m B 43 , m B 44 , m B 45 , m B 46 , m B 51 , m B 52 , m B 53 , m B 54 , m B 55 , m B 56 , m B 61 , m B 62 , m B 63 , m B 64 , m B 65 , m B 66 , m × Δ ln ( A V K ) t - 1 Δ ln G D P t - 1 Δ ln G D P t - 1 2 Δ ln ( V s ) t - 1 Δ ln S t - 1 Δ ln D t - 1
In this study, the ARDL method is used to check whether there is a long-term relationship between the above variables. First, Equation (5) is estimated by using the ordinary least squares (OLS) and F-test as follows:
Δ ( ln ( A V K c ) t ) = α + i = 1 n β 1 Δ ( ln ( A V K c ) t i ) + i = 1 n β 2 Δ ( ln ( G D P ) t i ) + i = 1 n β 3 Δ ( ln ( G D P ) t i ) 2 + i = 1 n β 4 Δ ( ln ( V ) t i ) + i = 1 n β 5 Δ ( ln ( D ) t i ) + i = 1 n β 6 Δ ( ln ( S ) t i ) + λ 1 ln ( A V K c ) t i + λ 2 ( ln ( G D P ) t i ) + λ 3 ( ln ( G D P ) t i ) 2 + λ 4 ln ( V ) t i + λ 5 ( ln ( D ) t i ) + λ 6 ( ln ( S ) t i ) + μ t
Δ represents the first different operator (variation), α represents the drift component, μ t represents the white noise error term, n is the maximum lag order, β 1 β 6 describes the error correction dynamics, and λ 1 λ 6 represents the long-term relationship between the variables. The null hypothesis is H0: λ 1 = λ 2 = λ 3 = λ 4 = λ 4 = λ 5 = λ 6 . Pedroni et al. studied the upper and lower critical values of the F test [40]. Therefore, regardless of whether the variable is I (0) or I (1), if the calculated F statistic is greater than the upper limit of the critical value, the null hypothesis that there is no co-integration relationship will be rejected. The next step is to estimate long-term parameters by using ARDL models based on R2, F statistics, DW statistics and AIC information criteria [42,43].

3.3. Data

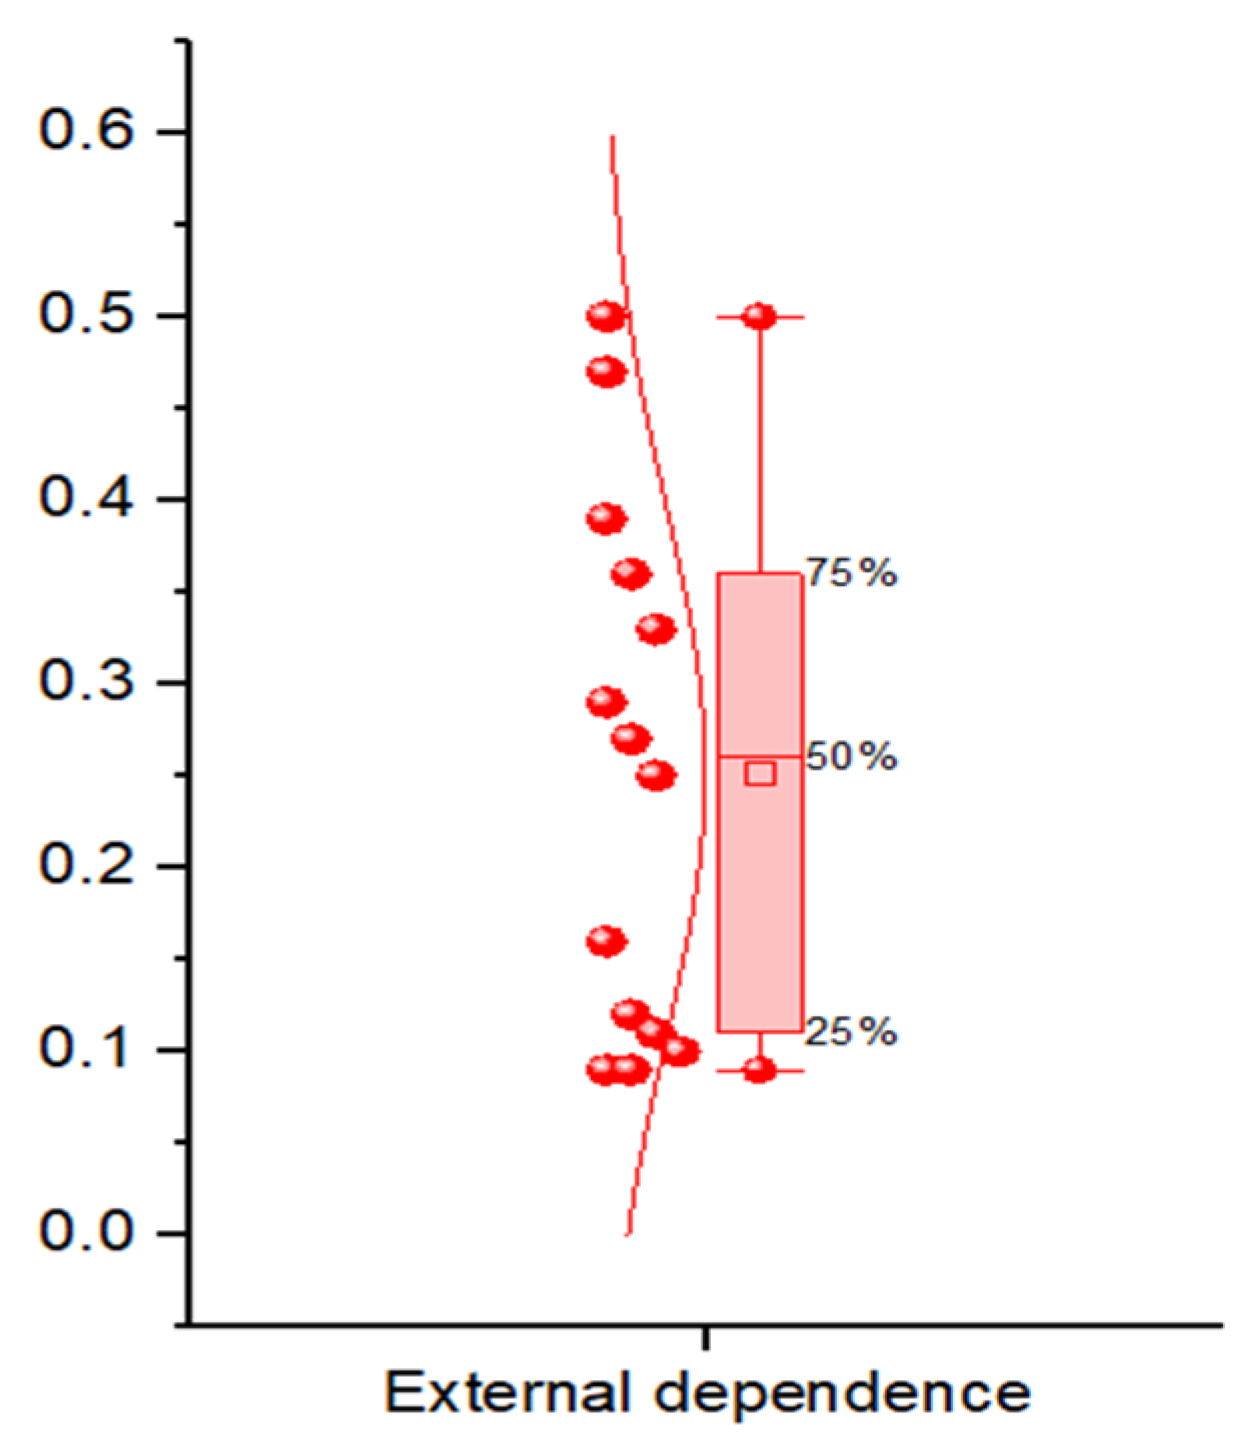
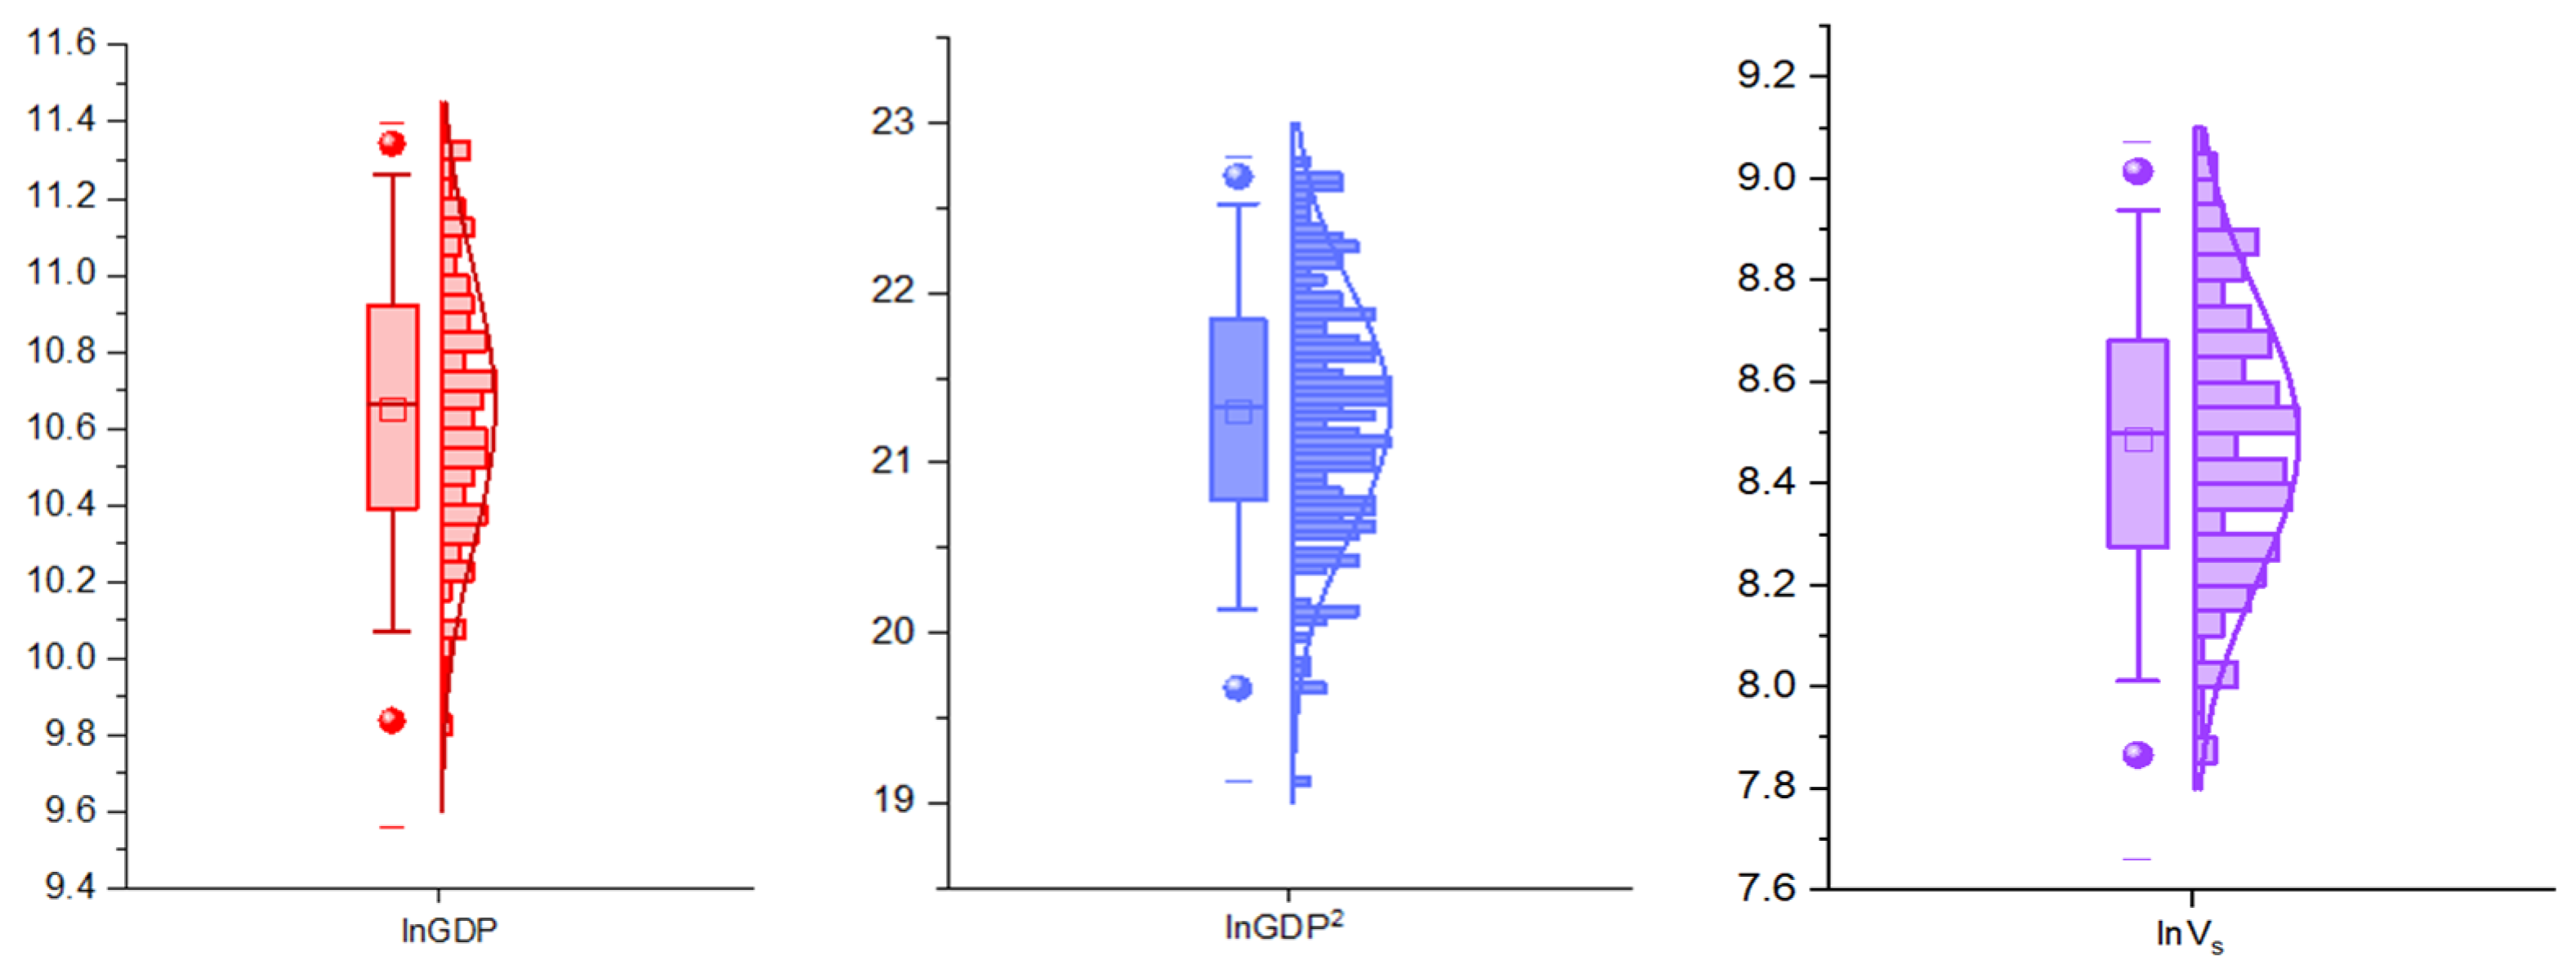
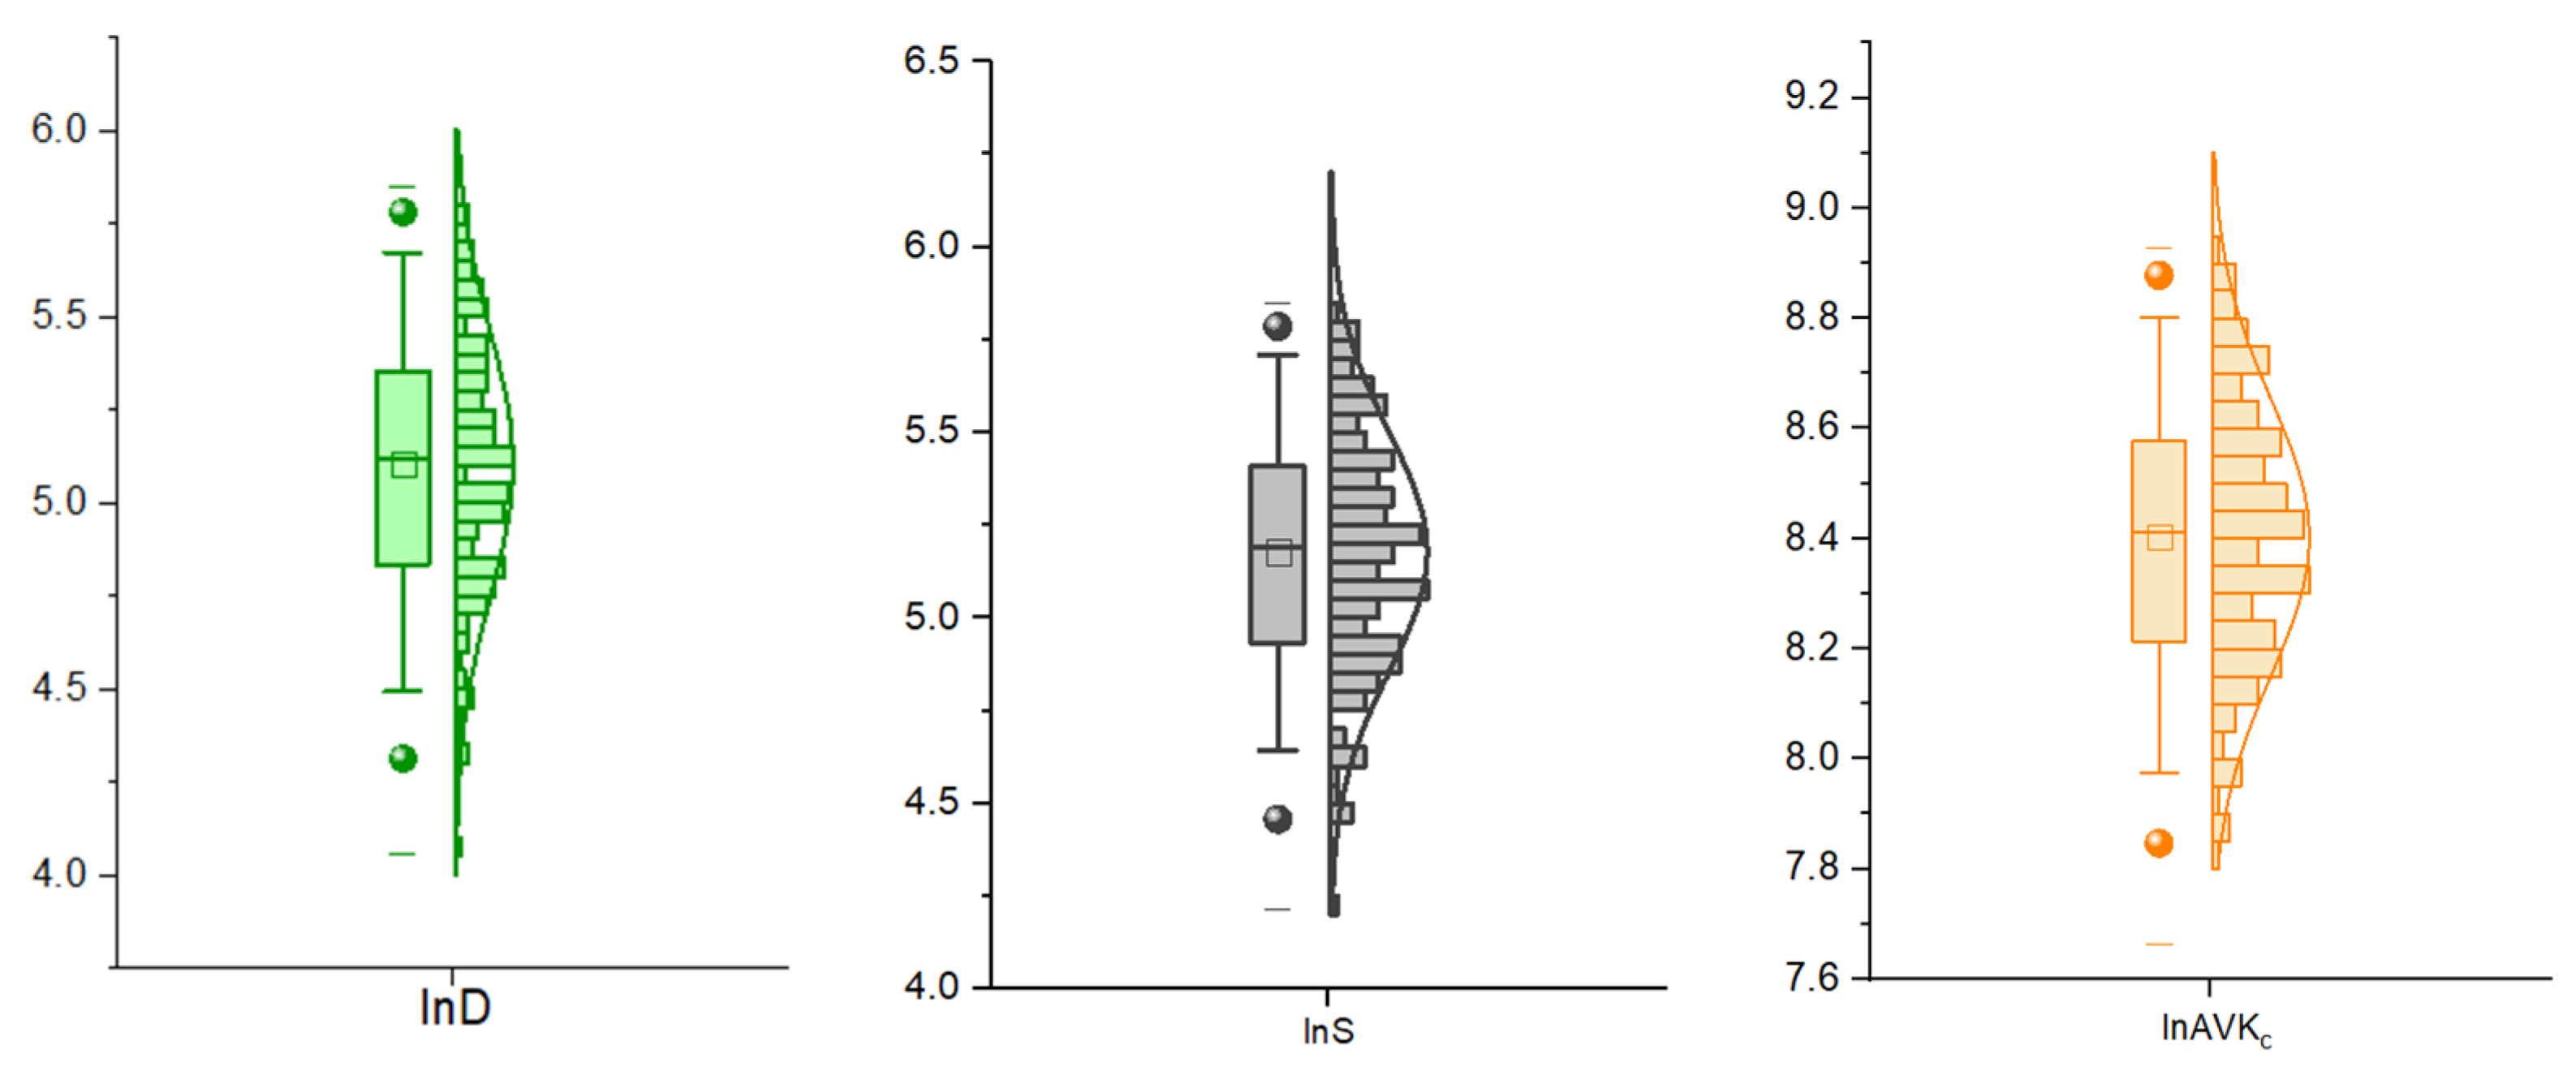
This study selects monthly data from 2006 to 2019 as the basis, in which production and consumption are in 10,000 tons, and GDP is in 100 million yuan; the units of China’s aviation kerosene price and the Singaporean market’s aviation kerosene price are both in yuan/ton. It should be noted that, in 2020, the global aviation industry was hit hard by the outbreak of the COVID-19 pandemic, and that the demand for and price of aviation fuel also fluctuated significantly. To exclude the impact of the COVID-19 pandemic, the data used in this paper are up to 2019. Additionally, to eliminate the impact of exchange rate fluctuations, the Singaporean market aviation kerosene price data use RMB as the currency unit. The above data come from the China National Development and Reform Commission, the National Bureau of Statistics, the China General Administration of Customs, and the “China Statistical Yearbook” (National Bureau of Statistics, http://www.stats.gov.cn (accessed on 21 December 2023)). Figure 6 shows the natural logarithm distribution diagrams and box plots of the relevant data.
Before unit root detection, we first performed descriptive statistical analysis of the data. Table 2 shows the descriptive statistics of all of the selected variables. All variables show a certain degree of deviation.

4. Results

4.1. Unit Root Test Result

The unit root test results of the structural mutation under the Zivot and Andrews model are as follows (see Table 3). Not every series is horizontally stationary. After the first difference I (1), all variables are stationary series. It is noteworthy that the structural fracture of the two variables of CIF and macroeconomic conditions on the Singaporean market occurred during the international financial crisis in 2008, and many economies such as China and Singapore suffered unprecedented financial shocks. Structural breakpoints of the supply and demand situation and the price of China’s aviation kerosene appeared in 2010 and 2012, respectively. This result can be interpreted in relation to the following special events. In 2006, China began to propose to “Break the monopoly of China’s aviation kerosene” and, in 2011, China was in the process of gradually reforming its oil market and sought to reduce direct government control over oil prices and move towards a more market-driven pricing mechanism. From this perspective, it can be seen that China’s market-oriented aviation kerosene price policy has achieved significant results.

4.2. J-J Co-Integration

The Johansen co-integration results are shown in Table 4. The results show that Johansen’s F statistic is 93.20 when taking ln A V K c as the dependent variable, which exceeds the upper threshold of the 1% rejection level. So, the test results reject the null hypothesis that there is no co-integration relationship; that is, there is a co-integration relationship between various variables. Therefore, we can further evaluate the factors influencing China’s aviation kerosene price.

4.3. Regression Analysis

From the regression analysis results, as shown in Table 5, it can be seen that, no matter which model is applied, there is a significant positive correlation between the Singaporean aviation kerosene price and the Chinese aviation kerosene price, and that the regression coefficient of this variable is the largest. That means China’s aviation kerosene price is most affected by the Singaporean aviation kerosene price factor. For every 1% change in the Singaporean aviation kerosene price, the Chinese aviation kerosene price will change by about 0.9%. It means that the current Chinese aviation kerosene price has a significant linking effect with the CIF price of Singapore’s imports, and the two have achieved a linkage relationship. Regarding the signs of the coefficients: demand, supply and China’s aviation kerosene price are positively correlated and negatively correlated, respectively, but the significance level is different under different econometric regression analysis methods. This conclusion is also in line with the commodity price supply and demand theory in economics, that is, as the supply of aviation kerosene increases, the price of aviation kerosene in China decreases; when demand increases, the price of aviation kerosene in China rises. From the regression results, it can be concluded that the reform of China’s aviation kerosene price market-based pricing mechanism has achieved significant progress, which is significantly affected by domestic aviation kerosene supply and demand factors while China’s aviation kerosene price links to the CIF import price of Singaporean aviation kerosene.

4.4. Robustness Test

The results of the CUSUM test are shown in Figure 7, which shows that the CUSUM test is located between the critical 5% significance level and indicates that all estimated parameter models are stable during the study period.

4.5. Granger Causality Test

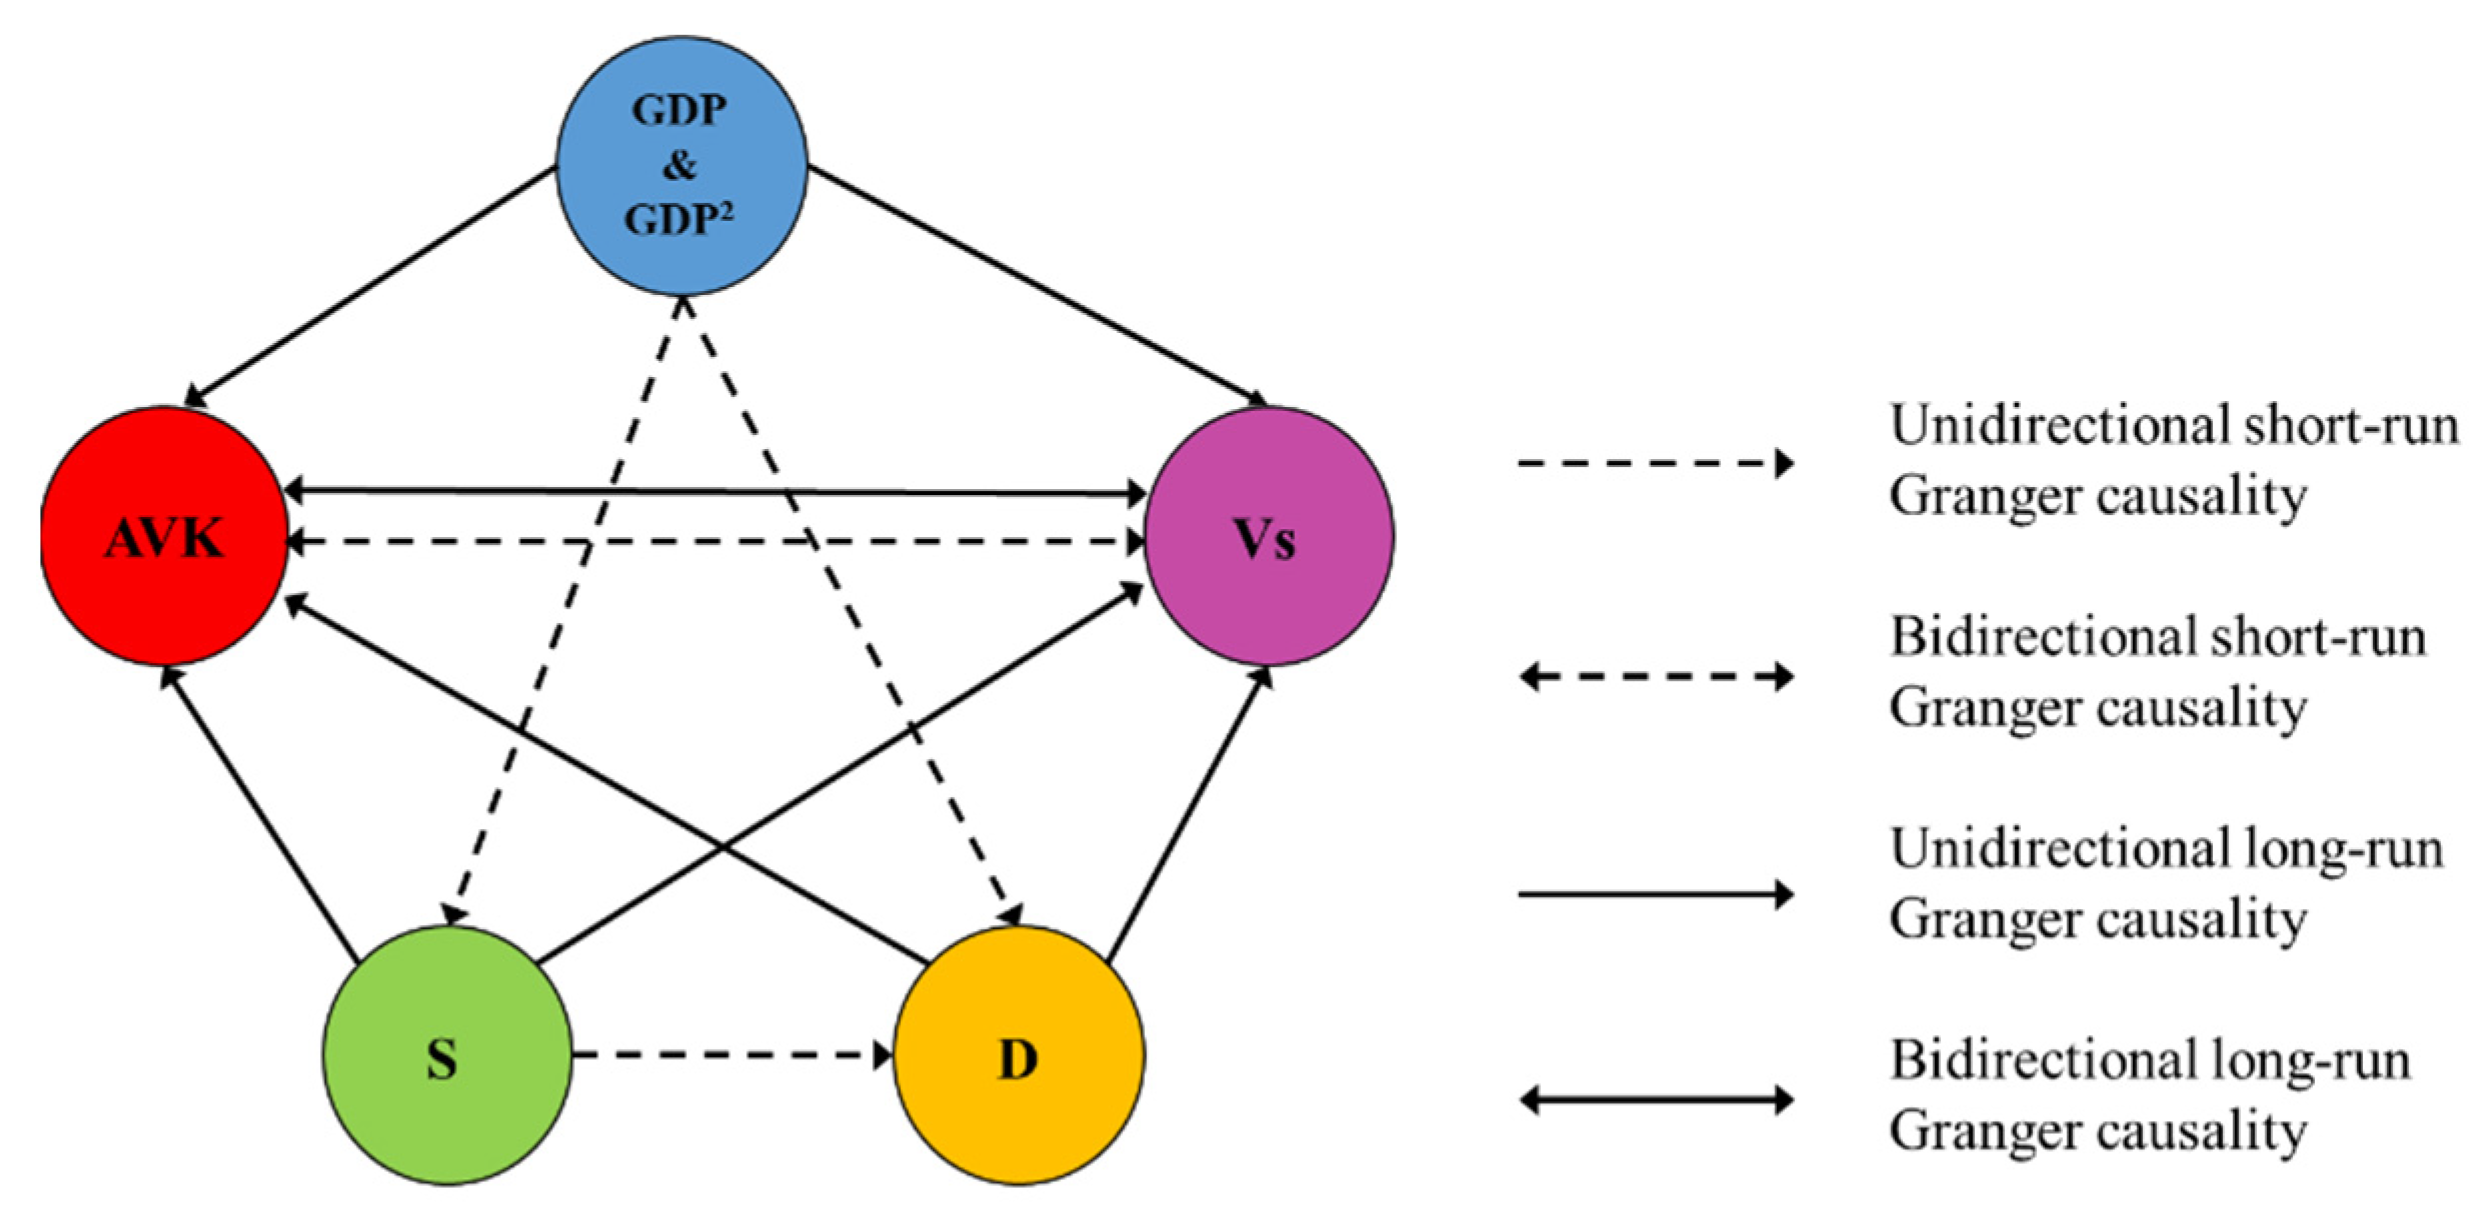
Table 6 summarizes the long-term and short-term causality results of the quadratic model. Granger causality characterizes the relationship between China’s aviation kerosene price and the CIF price of aviation kerosene in Singapore, supply, demand, and macroeconomic development. It is worth noting that in both long and short term, there is a two-way causal relationship between the price of China aviation kerosene and the CIF price of aviation kerosene in the Singapore market. This view confirms the effectiveness of the implementation of China’s aviation kerosene market reform policy.
From a long-term perspective, it is worth noting that there is a one-way relationship from China’s economic growth to aviation kerosene price, from supply to China’s aviation kerosene price, and from demand to China’s aviation kerosene price. This shows that the long-term macroeconomic development, supply and demand have an impact on China’s aviation kerosene pricing. These results meet our hypothesis. In the short term, there is a one-way causal relationship from economic growth to China’s aviation kerosene supply, from economic growth to China’s aviation kerosene demand, and from China’s aviation kerosene supply to China’s aviation kerosene demand, which supports the research of Hussein et al. [23]. Results of Granger causality is shown in Figure 8.

5. Conclusions and Discussion

This paper aims to evaluate the effect of market-oriented reform and other fundamental factors on China’s aviation kerosene price. First, using monthly data from 2006 to 2019, we carry out the structural mutation unit root test, the co-integration relationship among the variables is tested based on the Johansen co-integration method. Next, four different estimation methods (i.e., OLS, FMOLS, DOLS, IMOLS) are used to measure the effect of marketization factors on China’s aviation kerosene price; and the robustness of the regression results is verified based on the CUSUM test. Finally, the article uses the VECM and ARDL methods to test the direction of the long- and short-term Granger causality of each variable. The main findings of this research are as follows:
First, the structural breakpoints in the unit root test results shows that China’s aviation kerosene supply and demand situation and price have structural breakpoints in 2010 and 2012, respectively. This result meets general background of China’s 2006 proposal to “Break the monopoly of China’s aviation kerosene “and the detailed measures to deepen China’s aviation coal price and oil market reform in 2011.
Secondly, the results of the regression analysis of the article show that for every 1% change in the price of Singapore aviation kerosene, the price of Chinese aviation kerosene will change by about 0.9%. The current Chinese aviation kerosene price is significantly linked to the CIF price of Singapore’s imports. Compared to international oil and gas market factors, the price of aviation kerosene in China is less affected by fundamental factors in the domestic market.
Thirdly, the short-term results of the Granger causality test show that there are one-way causal relationships between economic growth and China’s aviation kerosene supply and demand, and between China’s aviation kerosene supply and China’s aviation kerosene demand. Short-term economic trends will affect the supply and demand of China’s aviation kerosene, and short-term changes to domestic aviation kerosene supply will also bring about changes in demand. Comprehensive analysis of the long-term and short-term results of the Granger causality test shows that, in the long-term and the short-term, there is a two-way causal relationship between the price of aviation kerosene in China and the CIF price of aviation kerosene on the Singaporean market; in the long-term, there is a one-way relationship between economic growth, the quantity of supply and demand and China’s aviation kerosene price. This also confirms the effectiveness of China’s market-based price design and its implementation in the field of aviation kerosene.
Based on the above research results, the article puts forward several important policy recommendations. The government should continue to play the role of a market factor in determining China’s aviation kerosene price. The government’s function should be transformed from the price setter to supervision of market operations and provider of early warnings and responses to uncertainty. Furthermore, it is recommended to strengthen market-oriented reforms by gradually reducing direct interventions in oil pricing and ensuring a more market-driven price formation mechanism. Additionally, the government should establish comprehensive information disclosure platforms to enhance market transparency and improve information accessibility for market participants. Moreover, it is essential to enhance the legal and regulatory framework by refining relevant laws and regulations, thereby enhancing the stability and predictability of legal petitions and fostering a fair and regulated market environment.
Finally, according to China’s basic socialist economic system and China’s special national conditions, the government should retain the right to intervene in emergencies and during risk shocks to ensure the stability and safety of the aviation kerosene market and other refined oil markets. Additionally, with the gradual expansion of the scope of general aviation operations, it is recommended that an aviation gasoline distribution system based on the concentration of production operations and transportation networks be established and that it be responsible for building the supporting aviation gasoline storage and transportation infrastructure. This will better promote China’s refined oil price market reforms and, ultimately, achieve sustainable and high-quality development of the air transport industry.

Author Contributions

Conceptualization, X.C., M.Y. and W.L.; methodology, X.C. and M.Y.; validation, X.C., X.Z. and S.M.; formal analysis, X.C., M.Y., X.Z. and W.L.; data curation, W.L. and S.M.; writing—original draft preparation, X.C.; writing—review and editing, X.C., M.Y., S.M., X.Z. and W.L.; funding acquisition, X.C. and M.Y. All authors have read and agreed to the published version of the manuscript.

Funding

This research was funded by the National Social Science Foundation of China (Grant No. 19BJY018).

Institutional Review Board Statement

Not applicable.

Informed Consent Statement

Not applicable.

Data Availability Statement

The data for this study were obtained from the China Statistical Yearbook.

Conflicts of Interest

The authors declare no conflicts of interest.

References

  1. Wang, T.; Wu, F.; Zhang, D.; Ji, Q. Energy market reforms in China and the time-varying connectedness of domestic and international markets. Energy Econ. 2023, 117, 106495. [Google Scholar] [CrossRef]
  2. Phillip, J.A. Review of sustainable energy carriers for aviation: Benefits, challenges, and future viability. Prog. Aerosp. Sci. 2023, 141, 100919. [Google Scholar] [CrossRef]
  3. Leonardo, C.; Valentina, S.; Claudia, B.; Giorgio, V. E-fuels, technical and economic analysis of the production of synthetic kerosene precursor as sustainable aviation fuel. Energy Convers. Manag. 2023, 288, 117165. [Google Scholar] [CrossRef]
  4. Pradeep, S. Impact of diesel price reforms on asymmetricity of oil price pass-through to inflation: Indian perspective. J. Econ. Asymmetries 2022, 26, e00249. [Google Scholar] [CrossRef]
  5. Kristiana, S.; Laurence, D. Soaring sustainably: Promoting the uptake of sustainable aviation fuels during and post-pandemic. Energy Res. Soc. Sci. 2021, 77, 102074. [Google Scholar] [CrossRef]
  6. Lea, R.; Eleonore, P.; Karen, S. Environmental impacts in the civil aviation sector: Current state and guidance. Transp. Res. Part D Transp. Environ. 2023, 119, 103717. [Google Scholar] [CrossRef]
  7. Lin, B.; Liu, X. Reform of refined oil product pricing mechanism and energy rebound effect for passenger transportation in China. Energu Policy 2013, 57, 329–337. [Google Scholar] [CrossRef]
  8. Seo, J. Diversification of Crude Oil Import Sources as Determinant Factors in the Pricing of Petroleum Products. Energy Sources 2013, 8, 320–327. [Google Scholar] [CrossRef]
  9. Lin, B.; Ooyang, X.A. Revisit of fossil-fuel subsidies in China: Challenges and opportunities for energy price reform. Energy Convers. Manag. 2014, 82, 124–134. [Google Scholar] [CrossRef]
  10. Evan, M. Global Kerosene Subsidies: An Obstacle to Energy Efficiency and Development. World Dev. 2017, 99, 463–480. [Google Scholar] [CrossRef]
  11. Liu, X.; Ye, H.; Wang, Q.; Zhou, D. Flying into the future: A scenario-based analysis of carbon emissions from China’s civil aviation. J. Air Transp. Manag. 2020, 85, 101793. [Google Scholar] [CrossRef]
  12. Sha, R.; Ge, T.; Li, J. How Energy Price Distortions Affect China’s Economic Growth and Carbon Emissions. Sustainability 2022, 14, 7312. [Google Scholar] [CrossRef]
  13. Wang, T.; Qu, W.Y.; Zhang, D.; Ji, Q.; Wu, F. Time-varying determinants of China’s liquefied natural gas import price: A dynamic model averaging approach. Energy 2022, 259, 125013. [Google Scholar] [CrossRef]
  14. Borenstein, S.; Cameron, A.C.; Gilbert, R. Do Gasoline Prices Respond Asymmetrically to Crude Oil Price Changes? Q. J. Econ. 1997, 112, 305–339. [Google Scholar] [CrossRef]
  15. Asche, F.; Gjølberg, O.; Völker, T. Price relationships in the petroleum market: An analysis of crude oil and refined product prices. Energy Econ. 2003, 25, 289–301. [Google Scholar] [CrossRef]
  16. Bettendorf, L.; Stéphanie, A.G.; Marco, V. Price asymmetry in the Dutch retail gasoline market. J. Energy Econ. 2003, 25, 669–689. [Google Scholar] [CrossRef]
  17. Kaufmann, R.K.; Laskowski, C. Causes for an asymmetric relation between the price of crude oil and refined petroleum products. J. Energy Policy 2004, 33, 1587–1596. [Google Scholar] [CrossRef]
  18. Bumpass, D.; Douglas, C.; Ginn, V. Testing for short and long-run asymmetric responses and structural breaks in the retail gasoline supply chain. J. Energy Econ. 2019, 83, 311–318. [Google Scholar] [CrossRef]
  19. Kpodar, K.; Abdallah, C. Dynamic fuel price pass-through: Evidence from a new global retail fuel price database. Energy Econ. 2015, 66, 303–312. [Google Scholar] [CrossRef]
  20. Esteban, M.; Ma, X.; Wang, L.; Lu, Y.; Dai, J.; Li, X. Spillover of international crude oil prices on China’s refined oil wholesale prices and price forecasting: Daily-frequency data of private enterprises and local refineries. J. Pet. Sci. 2022, 19, 1433–1442. [Google Scholar] [CrossRef]
  21. He, Y.; Lin, B. Is market power the cause of asymmetric pricing in China’s refined oil market? Energy Econ. 2023, 124, 106778. [Google Scholar] [CrossRef]
  22. Michael, K.; Walls, W.D. Oil industry consolidation and refined product prices: Evidence from US wholesale gasoline terminals. Energy Policy 2010, 38, 3498–3507. [Google Scholar] [CrossRef]
  23. Hussein, M.; Franz, W. Determinants of oil price subsidies in oil and gas exporting countries. Energy Policy 2018, 122, 409–420. [Google Scholar] [CrossRef]
  24. Luo, Y.; Ding, S.H. The status quo and development trend forecast of domestic aviation oil market. China Pet. Chem. Ind. Econ. Anal. 2018, 9, 47–50. (In Chinese) [Google Scholar]
  25. Chen, H.; Sun, Z. International crude oil price, regulation and asymmetric response of China’s gasoline price. Energy Econ. 2021, 94, 105049. [Google Scholar] [CrossRef]
  26. Zhang, Q.; Hu, Y.; Jiao, J.; Wang, S. Is refined oil price regulation a “shock absorber” for crude oil price shocks? Energy Policy 2023, 173, 113369. [Google Scholar] [CrossRef]
  27. Tian, X.; Chen, B.; Geng, Y. Energy footprint pathways of China. Energy 2019, 180, 330–340. [Google Scholar] [CrossRef]
  28. Wang, R.; Chen, Z.; Zhang, W.; Zhu, Q. Proceedings of the 11th International Conference on Modelling, Identification and Control (ICMIC2019); Springer: Singapore, 2020. [Google Scholar]
  29. Yuan, C.; Yang, Y.; Liu, S.; Fang, Z. Relation between China’s gasoline prices and international crude oil prices. Energy Sources Part B Econ. Plan. Policy 2016, 11, 953–959. [Google Scholar] [CrossRef]
  30. Gong, C.Z.; Wu, D.S.; Gong, H.J.; Qi, R. Multi-agent mixed complementary simulation of natural gas upstream market liberalization in China. Energy 2020, 200, 117535. [Google Scholar] [CrossRef]
  31. Dong, K.Y.; Sun, R.J.; Jiang, H.D.; Zeng, X.G. CO2 emissions, economic growth, and the environmental Kuznets curve in China: What roles can nuclear energy and renewable energy play? J. Clean. Prod. 2018, 196, 51–63. [Google Scholar] [CrossRef]
  32. Mrabet, Z.; Alsamara, M. Testing the Kuznets Curve hypothesis for Qatar: A comparison between carbon dioxide and ecological footprint. Renew. Sustain. Energy Rev. 2016, 70, 1366–1375. [Google Scholar] [CrossRef]
  33. Rafindadi, A.A.; Ozturk, I. Effects of financial development, economic growth and trade on electricity consumption: Evidence from post-Fukushima Japan. Renew. Sustain. Energy Rev. 2016, 54, 1073–1084. [Google Scholar] [CrossRef]
  34. Maddala, G.S.; Wu, S.W. A Comparative Study of Unit Root Tests with Panel Data and a New Simple Test. Oxf. Bull. Econ. Stat. 1999, 61, 631–652. [Google Scholar] [CrossRef]
  35. Zivot, E.; Andrews, D.W. Further Evidence on the Great Crash, the Oil-Price Shock, and the Unit-Root Hypothesis. J. Bus. Econ. Stat. 2002, 20, 25–44. [Google Scholar] [CrossRef]
  36. Robert, F.; Engle, C.W.J. Granger. Co-Integration and Error Correction: Representation, Estimation, and Testing. Econometrics 1987, 55, 251–276. [Google Scholar] [CrossRef]
  37. Johansen, S. Statistical analysis of cointegration vectors. J. Econ. Dyn. Control 1988, 12, 231–254. [Google Scholar] [CrossRef]
  38. Nicoleta, M.F.; Roxana, M.B.; Silvia, P. Linking Public Finances’ Performance to Renewable-Energy Consumption in Emerging Economies of the European Union. Sustainability 2021, 13, 6344. [Google Scholar] [CrossRef]
  39. Phillips, C.B.; Hansen, B.E. Statistical Inference in Instrumental Variables Regression with I (1) Processes. Rev. Econ. Stud. 1990, 57, 99–125. [Google Scholar] [CrossRef]
  40. Pedroni, P. Fully Modified OLS for Heterogeneous Cointegrated Panels; Emerald Group Publishing Limited: Bradford, UK, 2001; pp. 93–130. [Google Scholar] [CrossRef]
  41. Chen, B.; Suzanne, K.; Chinwe, K. Estimation and Inference of a Cointegrated Regression in Panel Data: A Monte Carlo Study. Am. J. Math. Manag. Sci. 1999, 19, 75–114. [Google Scholar] [CrossRef]
  42. Cha, K.; Lee, C. Rocket and Feathers in the Gasoline Market: Evidence from South Korea. Sustainability 2023, 15, 3815. [Google Scholar] [CrossRef]
  43. Liu, Y. Exploring the relationship between urbanization and energy consumption in China using ARDL (autoregressive distributed leg) and FDM (factor decomposition model). Energy 2009, 34, 1846–1864. [Google Scholar] [CrossRef]
Figure 1. Production and consumption of aviation kerosene in China.
Sustainability 16 02104 g001
Figure 2. China’s aviation kerosene imports and export volume.
Sustainability 16 02104 g002
Figure 3. Distribution of China’s dependence on foreign aviation kerosene sources.
Sustainability 16 02104 g003
Figure 4. Changes in China’s aviation kerosene price.
Sustainability 16 02104 g004
Figure 5. Comparison of aviation kerosene price trends between China and Singapore.
Sustainability 16 02104 g005
Figure 6. Box plots of logarithmic variables. Note: Dots denote minimum or maximum values, squares denote mean values, and the horizontal bars in the boxes denote median values.
Sustainability 16 02104 g006aSustainability 16 02104 g006b
Figure 7. Plots of CUSUM results.
Sustainability 16 02104 g007
Figure 8. Long-term and short-term causality diagrams of various factors.
Sustainability 16 02104 g008
Table 1. Literature comparison.
Part A: Research on the Price Correlation between Aviation Kerosene and Other Refined Oil and Oil Products
AuthorResearch RegionData (Year)VariableResearch Method
Borenstein, 1997 [14]United States1986–1990Gasoline price and crude oil spot priceCumulative adjustment functions
Asche et al., 2003 [15]Europe1992–2000Crude oil, natural gas, kerosene and naphtha priceMultivariate Johansen tests
Bettendorf et al., 2003 [16]Netherlands1996–2011Weekly change data on gasoline and refined oil pricesAsymmetric error correction model
Kaufmann et al., 2005 [17]United States1986–2002Gasoline utilization rate, gasoline inventory, original price, gasoline priceError correction model
Bumpass et al., 2015 [18]United States1991–2006International crude oil price and retail price of refined oilECM model based on structural fracture inspection
Kpodar et al., 2017 [19]162 countries2000–2014Monthly data on gasoline and crude oil pricesLocal projection approach of Jordà
Esteban et al., 2022 [20]China2003–2020Daily frequency data on private enterprises and local refineriesVAR-BEKK-GARCH; PCA-BP neural network
He et al., 2022 [21]China2000–2021Refined oil prices and the crude oil priceEGARCH model; two-stage regression process
Part B: Research on Factors Influencing Aviation Kerosene Prices
AuthorResearch RegionResearch AreasInfluencing FactorsResearch Method
Asche et al., 2003 [15]EuropeFactors affecting refined oil priceTrends in crude oil, natural gas and international oil priceQualitative analysis and quantitative methods
Michael et al., 2010 [22]United StatesFactors affecting refined oil priceOil industry integrationQuantitative research: time series regression
Hussein et al., 2018 [23]Mainly developing countriesThe price of refined oil and the factors influencing its subsidyPolicy factors such as demand for refined oil, subsidy amount, policy cost, etc.Qualitative research
Luo et al., 2018 [24]ChinaFactors affecting the price of aviation fuelConsumption and distribution, output and distribution, import and export, etc.Qualitative research
Chen et al., 2021 [25]ChinaThe dynamics of gasoline price response to international oil market price fluctuations and domestic price regulationImport quota policy and price controlQualitative research
Table 2. Descriptive statistics of variables.
ln (AVKc)ln (GDP)(lnGDP)2ln (Vs)ln (S)Ln (D)
Mean8.402210.6529113.61418.48745.10315.1777
Maximum8.928411.3974129.90139.07295.85195.8485
Minimum7.66439.5602913.97937.66154.05314.2128
Std.Dev0.25030.3608766.96410.27900.35620.3221
Skewness−0.1556−0.1423−0.0057−0.1543−0.1557−0.1491
Kurtosis2.61282.70742.63122.62462.61282.6650
Jarque–Bera1.7279
(0.3215)
1.1659
(0.5582)
1.3648
(0.5382)
3.6532
(0.4375)
1.4083
(0.4945)
2.7279
(0.3214)
Sum1411.56981789.69041908.71611425.8883857.3262869.8549
Sum Sq.Dev10.461521.7344982.350613.002821.186217.3268
Table 3. Results of unit root test.
VariableResultResult of 1st DifferenceDifference Order
T-StatisticBreak YearT-StatisticBreak Year
ln (Vs)−1.6564 (27)2008.3−9.0866(0) ***2012.4I(1)
ln (AVKc)−2.0652 (75)2012.4−9.5451(74) ***2012.3I(1)
ln(S)−0.5797 (60)2010.12−7.7494 (0) ***2006.1I(1)
ln(D)−1.9193 (60) *2010.12−5.8296 (0) ***2006.1I(1)
ln (GDP)−0.5378 (28)2008.4−6.9851(28) ***2008.4I(1)
(lnGDP)2−0.109 (28)2008.4−6.9861(28) ***2008.4I(1)
Notes: *** and *, respectively, indicate significance at the statistical levels of 1%, 5% and 10%. Critical values −3.46, −2.88 and −2.57 indicate statistical significance at 1%, 5%, 10%. The lag order is provided in parentheses.
Table 4. Results of co-integration test.
Estimated Models Johansen Result
ln ( A V K c ) t = f ( ln ( G D P s ) t , ln ( G D P s ) t 2 , ln ( V s ) t , ln S t , ln D t ) 93.20 ***Cointegration
Notes: *** means a 1% level. The critical value at the 1% level is 78.87.
Table 5. Results of regression test.
VariableDependent Variable: lnAVK
Result of Linear ModelResult of Quadratic Model
OLSFMOLSDOLSIMOLSOLSFMOLSDOLSIMOLS
ln (Vs)0.8963
***
(<0.0001)
0.9128
***
(<0.0001)
0.9307
***
(<0.0001)
0.8967
***
(<0.0001)
0.9166
***
(<0.0001)
0.9174
***
(<0.0001)
0.9391
***
(<0.0001)
0.9155
***
(<0.0001)
ln(D)0.2229 *
(0.058)
0.2107
(0.1735)
0.1985
(0.3439)
0.8042
**
(0.0306)
0.2892
**
(0.0134)
0.1692
(0.2384)
0.1204
(0.5908)
0.0887
(0.6133)
ln(S)−0.2482
(0.237)
−0.1335
(0.3250)
−0.0784
(0.6760)
−0.6490 *
(0.0553)
−0.2524
(0.2165)
−0.4650 *
(0.0635)
−0.4215
(0.1774)
−0.5547
(0.2836)
ln (GDP)0.1057
(0.596)
0.0225
(0.6729)
−0.0127
(0.8403)
−0.0070
(0.9126)
−1.9394
(0.3249)
0.0120
(0.8183)
−0.0179
(0.7816)
−0.0212
(0.7229)
(ln(GDP))2----0.0940
(0.1020)
0.01748
(0.1242)
0.0193
(0.1908)
0.0249
(0.2295)
Note: ***, **, and *, respectively, present the 1%, 5%, and 10% level of significance.
Table 6. The Granger causality analysis.
Dependent VariableShort RunLong Run
(ARDL)
lnAVKt−1lnGDPi−1(lnGDPi−1)2ln (Vs)t−1lnSt−1lnDt−1ECTt−1 1
F-Stat
[p Value]
T-Stat
[p Value]
ΔlnAVKt-0.3118 (0.7325)0.3177
(0.7283)
2.81 *
(0.0632)
0.1745
(0.84)
0.0381
(0.9626)
−4.750 **
(0.0120)
ΔlnGPDi0.0144
(0.9857)
-1.4511
(0.2374)
1.5345
(0.2187)
0.2765
(0.7588)
0.0506
(0.9507)
−2.2382
(0.6791)
(ΔlnGDPi)20.0138
(0.9863)
1.1112
(0.3317)
-1.6118
(0.2028)
0.3498
(0.7054)
0.0212
(0.979)
−0.7073
(0.9741)
Δln (Vs)t14.245 ***
(<0.0001)
0.2405
(0.7865)
0.2585
(0.7725)
-0.0285
(0.9719)
0.4432
(0.6428)
−6.1583 ***
(0.0002)
ΔlnSt0.363
(0.6962)
6.8377 ***
(0.0014)
6.527 ***
(0.0019)
0.1132
(0.893)
-0.0365
(0.9642)
−2.982
(0.3741)
ΔlnDt0.2952
(0.7448)
2.9452 *
(0.0555)
3.141 *
(0.059)
0.3592
(0.6988)
2.3976 *
(0.0942)
-−0.6407
(0.9776)
Note: ***, ** and *, respectively, present the 1%, 5%, and 10% level of significance.
Disclaimer/Publisher’s Note: The statements, opinions and data contained in all publications are solely those of the individual author(s) and contributor(s) and not of MDPI and/or the editor(s). MDPI and/or the editor(s) disclaim responsibility for any injury to people or property resulting from any ideas, methods, instructions or products referred to in the content.