Article

Exploring Passengers’ Emotions and Satisfaction: A Comparative Analysis of Airport and Railway Station through Online Reviews

1
School of Logistics and Transportation, Central South University of Forestry and Technology, Changsha 410004, China
2
School of Landscape Architecture, Central South University of Forestry and Technology, Changsha 410004, China
*
Author to whom correspondence should be addressed.
Sustainability 2024, 16(5), 2108; https://doi.org/10.3390/su16052108
Submission received: 10 January 2024 / Revised: 5 February 2024 / Accepted: 1 March 2024 / Published: 3 March 2024
(This article belongs to the Special Issue Advances in Sustainability in Air Transport and Multimodality)

Abstract

:
To enhance the service quality and sustainable development of urban transport hubs, a comprehensive understanding of passengers’ emotional inclinations and satisfaction levels is paramount. This study analyzes online reviews from passengers at three different types of transport hub in Changsha, China. We aim to understand passengers’ experiences by analyzing word frequency, semantic networks, and sentiment. Our analysis shows that passengers’ words can be grouped into four categories. Core words are more important in shaping passenger evaluations than edge words. The sentiment and satisfaction analysis reveals passengers are generally satisfied with the convenient transit options and the cleanliness of the transport hubs. The study also shows that passenger satisfaction levels have steadily increased over the years across different transport hubs. During holidays, passengers at airports and high-speed train stations express more positive sentiments. Passengers with shorter comments tend to be more satisfied than those with longer comments.

1. Introduction

The Chinese government has formulated a strategic initiative to cultivate a “powerful transport nation”, emphasizing the sustainable development of urban transport hubs. These hubs play a pivotal role as central nodes within the urban passenger transport network, representing the city’s “golden standard” and serving as a “crucial external representation” [1]. Within urban transport systems, transport hubs are of paramount importance, serving as crucial junctures that interconnect different modes of transport and as departure and arrival points for passengers with diverse travel needs. As China’s cities grow in size and population, the frequency of intercity exchanges has risen. Urban transport centers are faced with the imperative of meeting a growing number of basic transport needs while simultaneously responding to the sustainable demand for high-quality and personalized travel experiences. Despite the concerted efforts of Chinese traffic management departments to increase the transport capacity of urban hubs and meet the diverse needs of the population, challenges remain in meeting passengers’ emotional needs while travelling [2]. By studying what passengers want and how they feel, the service quality of urban transport hubs can be sustainably improved, thereby fulfilling passengers’ aspirations for enhanced travel experiences.
Customer emotion is a reflection of the customer’s psychological activities during the consumption process. It is a feeling of whether the product or service meets their psychological needs. Customer satisfaction refers to the resulting state of satisfaction when consuming a product or service. It reflects the customer’s psychological relationship with the product. In the competitive market, customer satisfaction is crucial for evaluating the success of an enterprise. To win more customers and achieve rapid growth, enterprises must improve their customers’ emotional level and satisfaction with their products or services. In the field of commodity retailing, scholars have identified several factors that affect customer satisfaction, including commodity price, quality, brand image, and after-sale service [3,4]. Similarly, in the hospitality industry, important attributes for hotel guests included cleanliness, price, location, security, and personal service [5,6,7]. The methods for measuring and evaluating customer sentiment and satisfaction mainly include two categories: constructing structural equations or regression statistical models based on questionnaires or other data [4,8,9], and network-based text analysis based on user review data [10,11], which has emerged in recent years.
In the field of transport management, many scholars analyzed passengers’ experiences and satisfaction levels with services at various transport hubs, including bus stations [12], airports [13,14], railway stations [15], urban rail stations [16], and other transport centers [17]. Firstly, identifying the factors that affect passengers’ experience and service satisfaction is crucial in enhancing service quality at transport centers. Li et al. [18] discerned how variables such as distance traveled, fares, service quality, and accessibility to transport hubs contribute to explaining travelers’ trip choices. Shang et al. [19], focusing on a bus station, advocated for optimizing bus frequency and headway, while incorporating passenger satisfaction considerations. A survey probing into the satisfaction of bus passengers indicated that residents of Ho Chi Minh City were content with the service and price factors, but expressed dissatisfaction with the contact-related aspects [20]. In addition, certain studies have focused on establishing an integrated service evaluation system to assess passengers’ overall satisfaction in urban transport hubs. Existing research methods primarily relied on questionnaire survey data to construct various statistical analysis models, including structural equation model [21,22,23], ordered probit model [18,24,25], hierarchical analysis [26,27], fuzzy comprehensive evaluation [28,29], and mixed methods [30,31].
Due to the fast progress of information technology, the number of online comments made by web users is increasing steeply. The substantial value lies in the comprehensive collection and analysis of this vast dataset to discern the emotional inclinations and satisfaction levels of passengers. Unfortunately, previous research on passenger transport hubs has not placed sufficient emphasis on this aspect. Web-based text analysis, a pivotal facet of text mining and information retrieval, involved the identification and enumeration of keywords for the extraction of information from textual content [32]. Methods for online text analysis found widespread application in various domains of engineering and management research. Notably, text analytics was widely employed in the fields of education [33,34], tourism [35,36], social sciences [37,38], economics [39], and urban planning [40]. Some scholars considered using mobile app-based e-questionnaires for data collection on passenger satisfaction [41], but these methods were still rooted in statistical models. Gao et al. [42], for instance, employed online user data to generate descriptive statistics regarding public transport satisfaction. This approach effectively preprocessed textual data related to customer satisfaction with transit.
Based on the above literature, there are still other important issues to be further investigated. (1) High-speed rail has become increasingly competitive with civil aviation as a means of long-distance travel. In contrast to most existing literature that tended to concentrate on airports [11] and rail stations [27] independently, this study conducts a combined comparison and analysis of high-speed railway stations and airports to explore passengers’ emotional disposition and satisfaction with different hubs. (2) Compared with the retail merchandise and hotel services research areas, there is still limited research on analyzing online reviews of passengers at transport hubs using big data and web text methods, exploring the factors that reflect passengers’ emotional experience, validating the relationship between the extracted factors and customer satisfaction levels, and then giving traffic management departments more advice on service decisions.
In the subsequent sections of this study, we first describe the data and method in Section 2. Following that, in Section 3, we analyze the results of the model in detail. In Section 4, we discuss the results from three different perspectives, namely the correlation of specific years, the difference between working days and holidays, and the length of online comments as it relates to passengers’ emotions and satisfaction. Finally, we summarize our work and provide suggestions for future research in Section 5.

2. Data and Methods

2.1. Research Design

The research framework of this study, as shown in Figure 1, is as follows. First, we collect the passenger review texts and satisfaction score data of three types of urban transport hubs in Changsha city, namely the airport, high-speed railway station, and railway station, spanning the years from 2019 to 2022, from Dianping.com. Subsequently, we filter and screen the initial samples, mainly removing some reviews not relevant to the focus of the study. Next, all the collected comment texts undergo lexical segmentation and word frequency counting through text analysis, which also eliminates words that have no practical meaning (e.g., “we”, “above”, “below”, etc.), retaining only those words that are highly relevant to the content of the study. Then, the network model is used for semantic network analysis. This step is mainly to generate the semantic network graph. The structural characteristics of the network nodes (node degree, betweenness centrality, closeness centrality, etc.) are further extracted and analyzed. Finally, this study analyzes the affective tendencies within passenger comments, categorizing them into positive, neutral, and negative emotions. Horizontal and vertical comparisons are made utilizing passenger satisfaction scoring data. Finally, the results are discussed from different perspectives.

2.2. Data Collection

The data utilized in our study come from online passenger reviews accessible on Dianping.com, a leading local life information and commerce platform in China, which provides users with information services including the exploration of merchants and consumer reviews. The number of active users on Dianping.com exceeds 200 million individuals and extends its coverage to 2500 cities across China. We mainly select the passenger review texts and satisfaction scoring data from three types of passenger transport hub in Changsha city, namely the airport, high-speed railway station, and railway station. The satisfaction scoring adopts a 5-level scoring system ranging from 1 (very dissatisfied) to 5 (very satisfied). Passenger reviews are collected from this popular review website and some invalid data are eliminated. Finally, the remaining valid samples total 1099 for the airport, 1108 for the high-speed railway station, and 701 for the railway station. The data span from the most recent year, 2022, to 2019. The data statistics by year are shown in Table 1.

2.3. Research Methods

Our research methods include two categories: text analysis and network analysis. Within the realm of text analysis, we employ two primary techniques: word frequency analysis and text sentiment analysis. Word frequency analysis stands as a contemporary and effective approach for mining internet data. Utilizing specialized software, we dissect the words employed in passenger webpage comments, quantifying their frequency. This facilitates the identification of passengers’ principal concerns and the evolution of these concerns over time. Text sentiment analysis, also known as tendency analysis, involves analyzing, processing, summarizing, and concluding the passenger comment text based on their emotional responses. Analyzing passengers’ views and emotions towards different transport hubs is achieved by identifying the emotions and tendencies inherent in their comments.
In this study, we use the ROST content mining system for the implementation of text analysis. Developed and coded by Wuhan University in China, the ROST system serves as a dedicated computing platform designed to facilitate research in the domains of humanities and social sciences. The system can achieve a series of text analysis functions such as microblog analysis, chat analysis, website analysis, word segmentation, word frequency statistics, flow analysis, and clustering analysis.
The network analysis method employed in this study focuses on several key metrics, including node degree, betweenness centrality, proximity centrality, feature vector centrality, and PageRank value for each word node within the semantic network. The node degree is crucial in the semantic network, as it shows the number of links between a given node and other word nodes. The greater the node degree, the more dominant the word’s position in the network, making it a significant influence on the overall semantic structure.
d i = j V a i j
where d i denotes the node degree of word i, and a i j = 1 if words i and j are connected by an edge; otherwise, a i j = 0 .
Betweenness centrality serves as an indicator reflecting the control and constraints exerted by a word node on other non-adjacent word nodes, i.e., when a word is situated on multiple shortest paths of other words, it attains higher betweenness centrality, signifying its pivotal role as a core member within the network.
C B ( i ) = j < k σ j k ( i ) σ j k / n 1 n 2 2
where C B ( i ) denotes the betweenness centrality of word i. Two nodes j and k are different from node i and mutually distinct in the network. σ j k ( i ) is the number of paths containing point i in all shortest paths between j and k. Finally, n is the number of nodes in the network.
Closeness centrality, akin to betweenness centrality, reflects the position of a word within the network. If the shortest distance from a given word node to any other word node in the network is minimal, it attains higher closeness centrality.
C C ( i ) = 1 / d i , j
where C C ( i ) and d i , j denote the closeness centrality of word i and the shortest path between nodes i and j, respectively.
Eigenvector centrality indicates a word’s centrality within a network, taking into account the centrality of its neighboring words. In other words, the importance of a word is determined by the significance of the words to which it is connected; the more crucial its associations, the more pivotal the word itself becomes.
C E ( i ) = λ j = 1 n A i , j C E j
where C E ( i ) and C E ( j ) denote the eigenvector centrality of words i and j, respectively. λ is the ratio constant and A is the neighborhood matrix of the network.
PageRank serves as a metric quantifying the importance of a node in a semantic network. A higher PageRank value for a word indicates a greater degree of popularity.
P R ( i ) = j M ( i ) P R j N ( j )
where P R ( i ) is the PageRank value of word i, j M ( i ) indicates that node j points to node i by an edge, and N ( j ) denotes the number of these edges.
In this study, the Gephi software (version number: 0.9.3) is employed to facilitate semantic network analysis. Gephi is a sophisticated tool designed for network analysis and visualization, offering support for a wide range of network analysis methods and visualization techniques. These include network layout, node clustering, network comparison, etc. Gephi is distinguished by its user-friendly interface, intuitive design, and efficient computational engine.

3. Results

3.1. Word Frequency Analysis

In this study, the top 50 words with the highest frequency are selected by word distillation of online review texts from passengers at different transport hubs, as shown in Table 2. The results reveal both commonalities and distinctions in passengers’ perceptions of the overall image associated with different transport hubs. These similarities lie in the fact that the high-frequency words of passengers’ perceptions of transport hubs can be broadly categorized into four groups, including hub services [42], facilities [12], environment and layout design, and passengers’ destinations. However, the specific focus of passengers’ attention within each category varies across the three distinct transport hubs.
As shown in Table 3, the high-frequency words with hub services include “security”, “queuing”, “luggage”, “serve”, etc. Passenger feedback highlights the convenience of station security checks and the benefits of business-class services, which entail fewer people and a segregated checking process, thereby minimizing wait times. WeChat boarding is praised for saving time and allowing direct access to the waiting hall after security checks. The self-service check-in area and efficient ground staff also receive positive reviews. Overall, passengers prioritize efficient and convenient service experiences at transport hubs. Specifically, airport passengers rank security checks as their top priority, followed by airport personnel service and baggage check-in. Notably, perceptions of security checks exhibit polarity, with positive feedback emphasizing the efficiency and proximity of checkpoints to boarding gates. Conversely, negative perceptions arise from the prolonged security check durations, leading to congestion and queuing, as well as perceived laxity in security measures. Regarding airport personnel, passengers generally perceive them as sincere, friendly, and polite, though negative experiences include poor attitudes and non-compliance with epidemic-related mask-wearing policies. Generally, passengers have favorable impressions of the baggage check-in service, particularly highlighting satisfaction with the self-service option.
High-frequency words associated with hub facilities include “facility”, “subway”, “charging”, “tea”, and so on, as shown in Table 3. Passengers express a generally favorable sentiment regarding the ancillary facilities at the airport and high-speed rail station, underscored by well-maintained and promptly updated amenities. The diverse array of recreational and catering establishments is particularly appealing to passengers. Moreover, these transport hubs are equipped with charging sockets beneath seats, offering passengers convenient access to timely mobile phone charging. In terms of internal facilities at railway stations, passengers express satisfaction with the relatively comprehensive offerings, encompassing shops, convenience stores, waiting rooms, and pantries. However, dissatisfaction arises with the prolonged interchange times within station corridors.
High-frequency words associated with hub environment and layout design include “clean”, “tranquil”, and “spacious”, as shown in Table 3. Overall, passengers’ perceptions of airport environments are predominantly positive, such as the airport’s expansive area, tranquil ambiance, cleanliness, and simplicity and compactness of the terminal building. Similarly, passengers express contentment with the environment and layout design of the high-speed railway station, including the overall neatness and orderliness, cleanliness and comfort, well-distributed layout, spacious and well-lit environment, and a chic and innovative exterior. It is noteworthy that the station underwent upgrades and renovations in 2022, leading to a shift in passenger evaluations. Before 2022, passengers mostly held negative evaluations, such as the scale of the environment being average, the overall environment being shabby, the facilities being very old, and the signage not being clear; after 2022, passengers’ evaluations progressively demonstrate a positive trend.
The high-frequency words related to passenger travel destinations include “Shanghai”, “Beijing”, and “Yueyang”, as shown in Table 3. The travel destinations of passengers at airports and high-speed railway stations are mainly Beijing and Shanghai, which are considerably far from Changsha. In contrast, the travel destinations of passengers at the railway station are mostly short- and medium-distance trips within the province, such as Yueyang. It is noteworthy that passengers originating from outside the province tend to engage in horizontal comparisons, evaluating Changsha’s transport hubs in juxtaposition to those in other cities. Conversely, many passengers from within the province exhibit a proclivity for longitudinal evaluations, assessing the performance of transport hubs over varying periods.
To conduct a more in-depth analysis of word frequency distribution, the occurrence of words in passenger comments at the airport, high-speed railway station, and railway station is subjected to a curve-fitting test. The results reveal that all samples conform to a power function distribution with a high goodness-of-fit (0.8598 for airport, 0.9049 for high-speed railway station, and 0.9038 for railway station), as depicted in Figure 2. The words within passenger comments exhibit distribution characteristics akin to a “core-edge” structure. In this context, core words represent the most frequently used terms describing the common characteristics of transport hubs, whereas edge words denote terms describing personalized characteristics with a relatively lower frequency of occurrence.

3.2. Semantic Network Analysis

The semantic networks of passenger comments are obtained by segmenting the passenger comments associated with different transport hubs and then importing them into the network analysis tool, as shown in Figure 3. These distinct semantic networks uniformly exhibit structural characteristics of a “core-margin” framework. The core layer includes common words such as “Security” and “subway”, while the edge layer encompasses specific terms such as “square”, “building”, and “first time”.
Analyzing the core words within the network can reveal the shared characteristics of passenger journeys across different transport hubs. Specifically, the core word “subway” appears in all three transport hubs, indicating that passengers are extremely concerned about the interchange functionality of these hubs. Marginal words offer a glimpse into the individualized traits perceived by passengers at various transport hubs. For instance, the low-frequency marginal word “first time” appears at both the airport and high-speed railway station, but not at the railway station. This discrepancy suggests that the airport and high-speed railway station predominantly cater to first-time travelers from outside the province, while the railway station is more frequented by passengers hailing from within the province.
Table 4 shows the results of the network features for the passenger comment words related to urban transport hubs, revealing that core words generally exhibit higher node degrees, while edge words demonstrate lower values. Node degree serves as a widely utilized metric for gauging the potency of the radiating influence of word nodes within a semantic network and the degree to which they occupy a central position. Specifically, in the semantic network of passenger comments at airports, core words such as “subway” and “security” exhibit node degree values exceeding 8, indicating their prominent central positions and robust network radiation capabilities. Conversely, marginal words display node degree values below 6, signifying their peripheral placement within the semantic network. The semantic networks at both the high-speed railway station and the railway station have identical node degree distributions.
Betweenness centrality stands as a pivotal metric indicating the accessibility of the semantic network, where a higher value signifies enhanced accessibility for the word nodes. Accessibility reflects a spatial interaction during the evolution and development of semantic networks. Betweenness centrality serves to portray how easy it is for words to connect to other words in the network. As evident from the presented table, the core words within the semantic network exhibit a large betweenness centrality, while the betweenness centrality values for the edge words are mostly zero. Closeness centrality, akin to betweenness centrality, reflects the position of a word within the network. The closeness centrality values of core and edge words in the semantic network are relatively close to each other, predominantly hovering around 0.6. Feature vector centrality emphasizes the relative significance of word nodes within a semantic network, serving as a gauge of a node’s importance based on its neighboring word nodes. The higher the feature vector centrality, the higher the value of the word node in the semantic network. From Table 3, it is discernible that the eigenvector centrality values for core words, with an average value surpassing 0.4, significantly surpass those of edge words, which exhibit an average value below 0.2. This discrepancy underscores the notably greater centrality and importance attributed to core words within the semantic network compared to their edge counterparts.

3.3. Sentiment and Satisfaction Analysis

Sentiment analysis serves as a valuable tool for elucidating passengers’ emotional tendencies towards various transport hub services, enabling the discernment and extraction of latent values embedded within comments. Using the sentiment analysis function of the ROST software (version number: CM6), we can classify and aggregate positive, negative, and neutral comments, allowing us to obtain the number and percentage of positive, neutral, and negative sentiments in the overall text data. Meanwhile, we can use the user satisfaction data collected to carry out a statistical analysis of satisfaction levels in the various transport hubs.
The findings indicate a general approval of the services offered by diverse transport hubs, predominantly reflecting positive sentiments, with a relatively smaller proportion of neutral and negative sentiments. Specifically, as shown in Table 5, passengers at the high-speed railway station exhibit a higher proportion of positive emotions and a lower proportion of negative emotions. While railway station passengers also register a higher proportion of positive sentiments, their negative sentiments constitute the highest percentage among all transport hubs, nearing 18%. In terms of the distributional characteristics of negative sentiments, the count of negative comments from passengers at the high-speed railway station is comparatively lower at 64, with the majority expressing low levels of negativity. Conversely, the count of negative comments at the airport and railway station is higher, amounting to 151 and 126, respectively. Notably, the negativity level in the comments of airport passengers is relatively low, whereas railway station passengers exhibit a higher degree of negativity in their comments in comparison.
Passenger satisfaction research serves not only as a metric for gauging the quality of services delivered by transport hubs but, more significantly, as a tool to dissect the causes of dissatisfaction, as perceived by passengers. For transport hubs, measuring passenger satisfaction primarily aims to furnish insights that empower urban transport management in making informed decisions to enhance the competitiveness of these hubs. Table 5 also shows that the mean satisfaction scores assigned by passengers to the services of different transport hubs are notably high, surpassing 4.0. This indicates that passengers are generally satisfied with the services provided by the transport hubs. For instance, both the airport and the high-speed rail station boast mean satisfaction scores exceeding 4.2, while the train station, although not quite on par with the first two hubs, still garners a commendable mean score of 4.03. These findings underscore the general satisfaction of passengers with the services provided by the respective transport hubs.
Using the cluster analysis function of ROST software, we can count the word frequencies of passenger comments with different satisfaction levels. Table 6 shows the high-frequency words corresponding to passenger satisfaction scores of 1 (very dissatisfied) and 5 (very satisfied) for each transport hub. From the distribution of passengers’ high-frequency words, the dissatisfaction of passengers in each transport hub is both common and individual. Specifically, dissatisfaction with hub services emerges as a prevalent concern among passengers for all three transport hubs, and the related high-frequency words include “service”, “personnel”, and “attitude”. Airport passengers express discontent with the catering and baggage services, as indicated by high-frequency words like “catering”, “baggage check-in”, and “price”. Passengers at high-speed railway stations are dissatisfied with the facilities at the stations, with high-frequency words including “passage”, “toilet”, and “queuing”. Passengers at railway stations are most dissatisfied with the interior design of the station, as evidenced by high-frequency words such as “design”, “entrance”, and “escalator”. Despite these individual dissatisfactions, passengers uniformly express collective satisfaction with the convenient transit options and clean environment provided by the transport hubs, with high-frequency words such as “convenient”, “subway”, “maglev”, “environment”, “clean”, and so on.

4. Discussion

4.1. Analyzing Passenger Emotions and Satisfaction from Different Years

In this section, we discuss in detail the evolution of sentiment and satisfaction scores among passengers at different transport hubs over the years. Overall, the proportions of positive sentiments among passengers at the airport, high-speed train station, and railway station exhibit a consistent upward trajectory annually, as shown in Table 7. Specifically, the positive sentiment of passengers at the airport, high-speed station, and railway station increased from 74.83%, 80%, and 72.05% in 2019 to 83.67%, 84.34%, and 75.64% in 2022, respectively. The share of positive sentiment among passengers at the high-speed train station in 2022 has experienced a decrease compared to previous years, primarily attributed to a notable surge in the share of neutral sentiment. The low percentage of positive sentiment at the airport in 2020 can be predominantly ascribed to the airport’s strict hygiene measures implemented in response to the COVID-19 pandemic. Many passengers found it challenging to adapt to these new measures, thereby influencing the overall positive sentiment during that period.
The means of passenger satisfaction scores for different years at the three transport hubs are tested using ANOVA (Analysis of Variance) sequentially. The obtained p-values (<0.01) indicate a statistically significant difference between these groups of satisfaction means. The average satisfaction score at the airport has demonstrated a consistent yearly increase, ascending from 3.87 in 2019 to 4.33 in 2022. Analyzing the passengers’ comments shows this surge in satisfaction is attributed to the airport’s continual enhancement of both hardware facilities and soft services. The high-speed railway station has maintained elevated satisfaction scores in recent years. Particularly in 2020, amid the emergence of COVID-19, the high-speed railway station implemented preventive and control measures, including double-code checking and free nucleic acid testing. Satisfaction scores at train stations exhibit a dichotomous trend, with relatively lower scores preceding 2020 and a marked increase thereafter. This can be largely attributed to the comprehensive upgrade and renovation of station facilities in 2020.

4.2. Analyzing Passenger Emotions and Satisfaction between Working Days and Holidays

This section delves into the impact of weekdays and holidays on passenger emotions and satisfaction scores at various transport hubs. According to Table 8, the percentage of passengers with positive feelings is notably higher on holidays than on working days at the airport and high-speed railway station. An in-depth analysis of passenger comments reveals that many individuals opt to utilize their holidays for either short or extended trips, seeking relaxation and an escape from work-related pressures. Traveling on holidays is perceived as a beneficial way for individuals to unwind and make the most of their leisure time [31,43]. Conversely, at railway stations, the trend is reversed. The proportion of positive emotions and satisfaction scores among passengers is higher on workdays than on holidays. Analyzing the passengers’ comments, the main reason is the overcrowded nature of railway stations during holidays. The efficiency of ticket checking is compromised, leading to slow processing, and individuals find themselves queuing for extended periods.

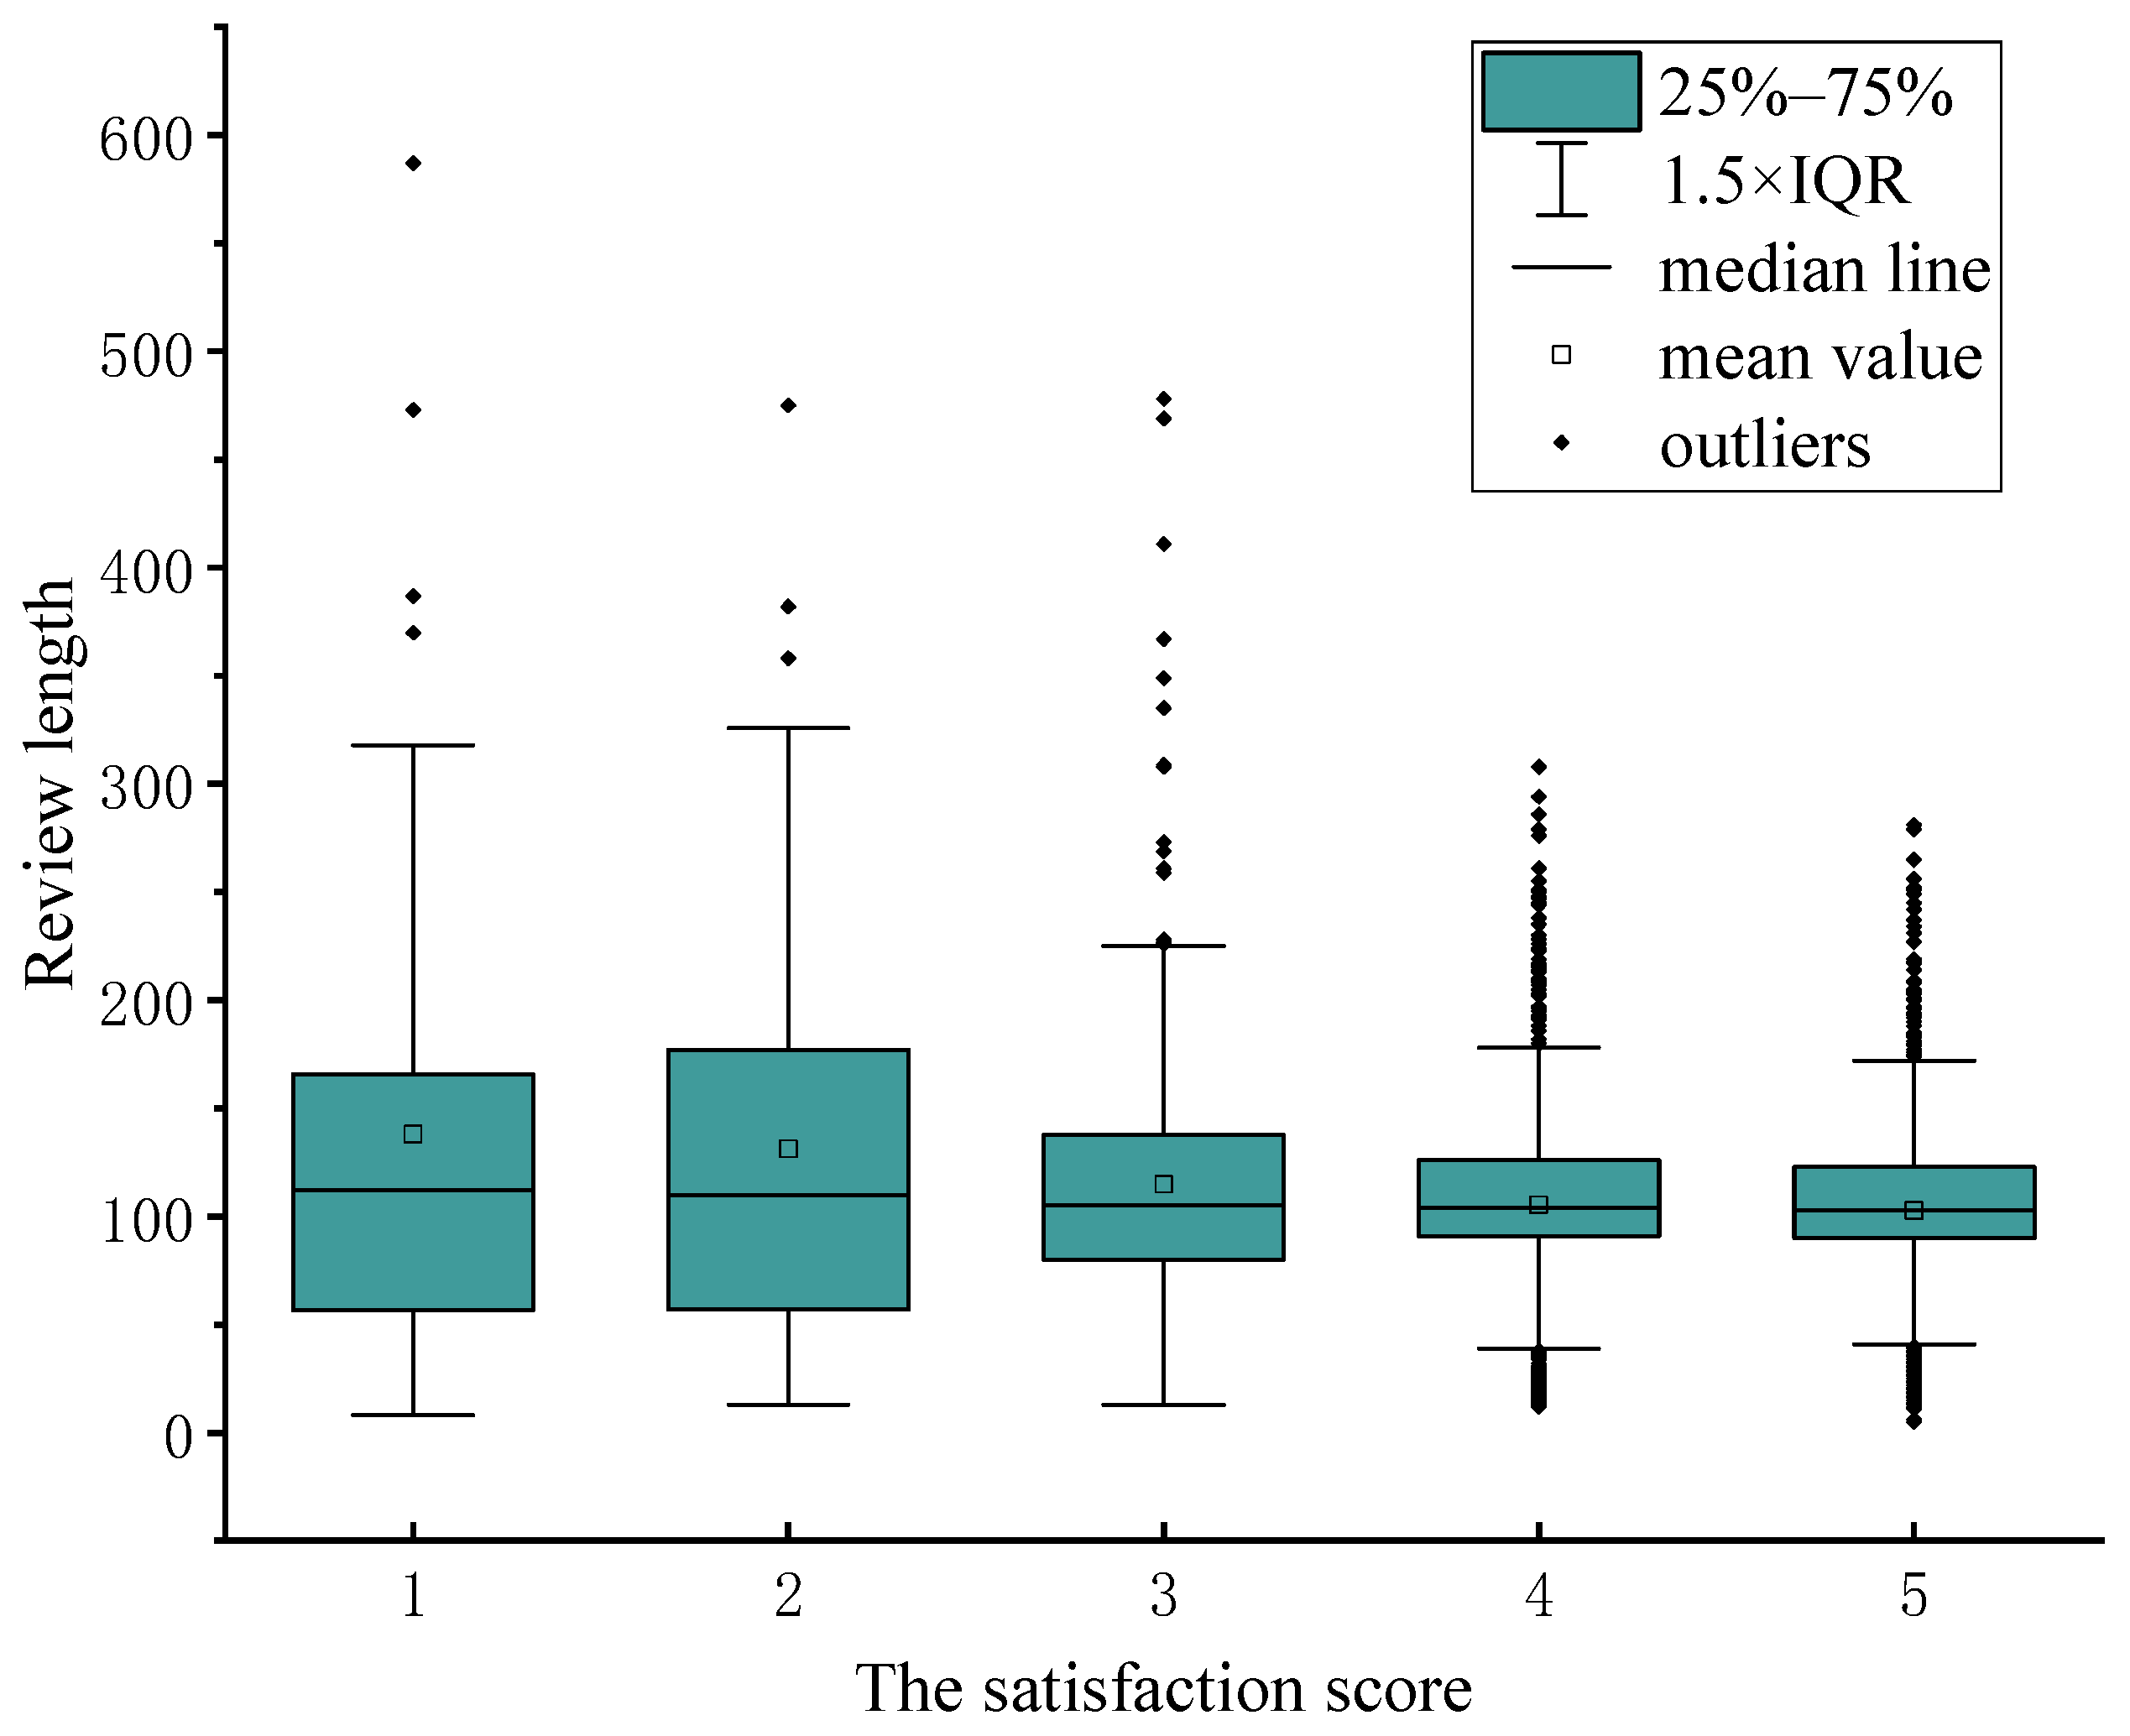
4.3. Analyzing Passenger Emotions and Satisfaction with Different Online Comment Length

In this section, we discuss in detail the correlation between the length of online comments and passengers’ sentiment and satisfaction. Figure 4 shows the trend of the length of passenger comments across different transport hubs. Notably, the average length of passenger comments for all transport hubs hovers around 100. Consequently, we categorize passenger comments into two groups: short comments and long comments. The former denotes comments with a length less than 100, while the latter includes comments surpassing the 100-word threshold. In addition, the number of long comments at the airport is notably higher, with the length of the lengthiest comment even exceeding 600, while the comment lengths of passengers at the high-speed rail station and railway station are relatively concise, with the lengthiest comment reaching around 400 words.
Figure 5 shows the correlation between online review length and passenger satisfaction. It can be inferred that the lower the satisfaction scores (e.g., 1), the longer the length of the passenger reviews, whereas the higher the satisfaction scores (e.g., 5), the relatively shorter the length of the passenger reviews. One plausible explanation is that dissatisfied passengers tend to provide a more detailed account of their travel experience [44]. This detailed feedback offers valuable insights into the pivotal factors influencing passenger ratings, gleaned from the content of their comments.
From the statistical results in Table 9, it can be seen that whether at the airport, high-speed station, or railway station, the proportion of positive emotions among passengers who submit short comments is significantly higher, reaching 83.29%, 84.45%, and 78.2%, respectively. Conversely, passengers providing long comments exhibit a higher proportion of negative emotions, reaching 11.85%, 13%, and 21.83%, respectively. When comparing the mean satisfaction scores across each hub, passengers with concise comments express higher satisfaction compared to those with more extensive comments [44]. The ANOVA tests are conducted to evaluate the impact of comment length on passenger satisfaction scores at the three transport hubs sequentially. The p-values obtained (<0.01) show a statistically significant difference between the satisfaction means of these two groups.

5. Conclusions

This study explores passengers’ emotions and satisfaction at three urban transport hubs based on online reviews from Dianping.com. First, our word frequency analysis of passengers’ comments reveals both similarities and differences in how passengers perceive the overall image of these transport hubs. Passengers’ impressions of hubs are shaped by high-frequency words related to hub services, facilities, environment and design, and travel destinations. Although these categories are common, the specific focus varies from hub to hub. We also observe a power function distribution in passenger comments through curve fitting, indicating a robust ‘core-margin’ pattern. The semantic network analysis also indicates that core words have higher node degrees, emphasizing their centrality, while edge words have lower values. The sentiment and satisfaction analysis reveals the hub service is the most common source of dissatisfaction among passengers. Finally, we explore the relation of different years, weekdays and holidays, and comment length to the passenger sentiment and satisfaction at different urban transport hubs. The following conclusions are drawn from our discussion. (1) There is a consistent and upward trend in the proportion of positive sentiments expressed by passengers at various transport hubs over the years. (2) During holidays, the percentage of passengers expressing positive sentiments is notably higher than on working days, especially at the airport and high-speed train station. (3) Passengers providing concise comments tend to have higher satisfaction levels than those with longer comments.
In order to improve the service quality of urban transport hubs and enhance passenger satisfaction, the following suggestions are given based on the research results. (1) Improve core services of transport hubs to allow passengers to travel with a sense of well-being. According to high-frequency word statistics, passengers place importance on the fundamental aspects of transport hubs, such as “security”, “queuing”, “waiting”, and “service”. Managers should listen to the different opinions of passengers, improve the efficiency of security checking, shorten the waiting time of passengers in queues, optimize the internal waiting environment, enhance the service attitude and service ability of staff, and adopt various measures to improve the overall travel environment of passengers. (2) Improve the supporting facilities of transport hubs to make travelling more convenient for passengers. The results of sentiment analysis show that passengers are basically satisfied with the supporting facilities of transport hubs, but there are also problems that need to be solved. Managers need to further improve and upgrade the existing equipment and facilities, add intelligent real-time information service platforms, and appropriately adjust the prices charged for services and commodities. (3) The focus of the hubs should be on shaping their own core images and meeting the specific travelling needs of different customers. The high-frequency words of passengers’ travel destinations indicate that most passengers at the airport and high-speed railway station are long-distance travelers from outside the province. Therefore, providing more services and products with regional features can help travelers experience the strong cultural characteristics of the local place. Railway station passengers are typically short-distance travelers within the province. To improve their travel experience, it is necessary to optimize route guidance signs at station entrances and exits, and provide clear transfer information for surrounding subway and bus services.
However, there are still some limitations in our research. Firstly, due to technical reasons for obtaining the data, the data in this study only come from one source and include three specific transport hubs, which consequently leads to the question of the generalizability of the contribution to the knowledge of consumer behavior in other cities. In addition, the data are limited to those with technology access, awareness, interest, and ability to use such apps or websites. There may be travelers who lack technology awareness or choose not to use such apps, as well as those who have devices to access websites but are unable to express their opinions. In the future, we need to combine other methods such as questionnaires to obtain multi-source data for a comprehensive study of passenger sentiment and satisfaction.

Author Contributions

Methodology, R.S.; Formal analysis, R.S.; Investigation, H.J. and W.S.; Resources, W.Q. and W.S.; Data curation, X.X.; Writing—original draft, R.S.; Supervision, R.S. All authors have read and agreed to the published version of the manuscript.

Funding

This work was supported by the ministry of education of humanities and social science project (20YJCZH133); the natural sciences funding project of Hunan province (2022JJ40881 and 2022JJ31017); excellent youth project of Hunan provincial department of education (21B0257).

Institutional Review Board Statement

Not applicable.

Informed Consent Statement

Not applicable.

Data Availability Statement

The original datasets used in the study are included in the article. Further inquiries can be directed to the corresponding author.

Conflicts of Interest

The authors declare no conflicts of interest.

References

  1. Zhang, C.; Juan, Z.; Lu, W.; Xiao, G. Do the organizational forms affect passenger satisfaction? Evidence from Chinese public transport service. Transp. Res. Part A Policy Pract. 2016, 94, 129–148. [Google Scholar] [CrossRef]
  2. Lai, X.; Teng, J.; Ling, L. Evaluating public transportation service in a transit hub based on passengers energy cost. In Proceedings of the IEEE 23rd International Conference on Intelligent Transportation Systems (ITSC), Rhodes, Greece, 20–23 September 2020; pp. 1–7. [Google Scholar]
  3. Nilashi, M.; Abumalloh, R.A.; Samad, S.; Alrizq, M.; Alyami, S.; Alghamdi, A. Analysis of customers’ satisfaction with baby products: The moderating role of brand image. J. Retail. Consum. Serv. 2023, 73, 103334. [Google Scholar] [CrossRef]
  4. Banik, S.; Gao, Y. Exploring the hedonic factors affecting customer experiences in phygital retailing. J. Retail. Consum. Serv. 2023, 70, 103147. [Google Scholar] [CrossRef]
  5. Veloso, M.; Gomez-Suarez, M. Customer experience in the hotel industry: A systematic literature review and research agenda. Int. J. Contemp. Hosp. Manag. 2023, 35, 3006–3028. [Google Scholar] [CrossRef]
  6. Kim, Y.J.; Kim, H.S. The impact of hotel customer experience on customer satisfaction through online reviews. Sustainability 2022, 14, 848. [Google Scholar] [CrossRef]
  7. Glaveli, N.; Manolitzas, P.; Palamas, S.; Grigoroudis, E.; Zopounidis, C. Developing effective strategic decision-making in the areas of hotel quality management and customer satisfaction from online ratings. Curr. Issues Tour. 2023, 26, 1003–1021. [Google Scholar] [CrossRef]
  8. Wei, M.; Zhang, S.; Liu, T.; Sun, B. The adjusted passenger transportation efficiency of nine airports in China with consideration of the impact of high-speed rail network development: A two-step DEA-OLS method. J. Air Transp. Manag. 2023, 109, 102395. [Google Scholar] [CrossRef]
  9. Bakir, M.; Akan, S.; Ozdemir, E.; Nguyen, P.-H.; Tsai, J.-F.; Pham, H.-A. How to achieve passenger satisfaction in the airport? Findings from regression analysis and necessary condition analysis approaches through online airport reviews. Sustainability 2022, 14, 2151. [Google Scholar] [CrossRef]
  10. PJ, S.; Singh, K.; Kokkranikal, J.; Bharadwaj, R.; Rai, S.; Antony, J. Service quality and customer satisfaction in hospitality, leisure, sport and tourism: An assessment of research in Web of Science. J. Qual. Assur. Hosp. Tour. 2023, 24, 24–50. [Google Scholar]
  11. Ban, H.J.; Kim, H.S. Understanding customer experience and satisfaction through airline passengers’ online review. Sustainability 2019, 11, 4066. [Google Scholar] [CrossRef]
  12. Cheng, X.; Cao, Y.; Huang, K.; Wang, Y. Modeling the satisfaction of bus traffic transfer service quality at a high-speed railway station. J. Adv. Transp. 2018, 2018, 7051789. [Google Scholar] [CrossRef]
  13. Nugroho, A. Study of Airport Service Quality and Profitability in Indonesia. Econ. Bus. Q. Rev. 2021, 4, 172–188. [Google Scholar] [CrossRef]
  14. Monmousseau, P.; Marzuoli, A.; Feron, E.; Delahaye, D. Impact of Covid-19 on passengers and airlines from passenger measurements: Managing customer satisfaction while putting the US Air Transportation System to sleep. Transp. Res. Interdiscip. Perspect. 2020, 7, 100179. [Google Scholar] [CrossRef]
  15. Zhu, J.; Zhao, Z.; Qin, Y.; Wang, Z. Research on Evaluation of Transfer Efficiency of Rail Transportation Hub. In Proceedings of the 2012 International Conference on System Science and Engineering (ICSSE), Dalian, China, 30 June–2 July 2012; IEEE: New York, NY, USA, 2012; pp. 399–403. [Google Scholar]
  16. Grise, E.; El-Geneidy, A. Where is the happy transit rider? Evaluating satisfaction with regional rail service using a spatial segmentation approach. Transp. Res. Part A Policy Pract. 2018, 114, 84–96. [Google Scholar] [CrossRef]
  17. Yatskiv, I.; Budilovich, E. A comprehensive analysis of the planned multimodal public transportation HUB. Transp. Res. Procedia 2017, 24, 50–57. [Google Scholar] [CrossRef]
  18. Li, X.; Tang, J.; Hu, X.; Wang, W. Assessing intercity multimodal choice behavior in a touristy city: A factor analysis. J. Transp. Geogr. 2020, 86, 102776. [Google Scholar] [CrossRef]
  19. Shang, H.-Y.; Huang, H.-J.; Wu, W.-X. Bus timetabling considering passenger satisfaction: An empirical study in Beijing. Comput. Ind. Eng. 2019, 135, 1155–1166. [Google Scholar] [CrossRef]
  20. Nguyen, X.P. The bus transportation issue and people satisfaction with public transport in Ho Chi Minh city. J. Mech. Eng. Res. Dev 2019, 42, 10–16. [Google Scholar] [CrossRef]
  21. Dimitriades, Z.S. Customer satisfaction, loyalty and commitment in service organizations: Some evidence from Greece. Manag. Res. News 2006, 29, 782–800. [Google Scholar] [CrossRef]
  22. Chauhan, V.; Gupta, A.; Parida, M. Demystifying service quality of Multimodal Transportation Hub (MMTH) through measuring users’ satisfaction of public transport. Transp. Policy 2021, 102, 47–60. [Google Scholar] [CrossRef]
  23. Zhang, C.; Liu, Y.; Lu, W.; Xiao, G. Evaluating passenger satisfaction index based on PLS-SEM model: Evidence from Chinese public transport service. Transp. Res. Part A Policy Pract. 2019, 120, 149–164. [Google Scholar] [CrossRef]
  24. Li, X.; Fan, J.; Wu, Y.; Chen, J.; Deng, X. Exploring influencing factors of passenger satisfaction toward bus transit in small-medium city in China. Discret. Dyn. Nat. Soc. 2020, 2020, 8872115. [Google Scholar] [CrossRef]
  25. Sankaranarayanan, H.B.; Vishwanath, B.; Rathod, V. An exploratory analysis for predicting passenger satisfaction at global hub airports using logistic model trees. In Proceedings of the 2016 Second International Conference on Research in Computational Intelligence and Communication Networks (ICRCICN), Kolkata, India, 23–25 September 2016; IEEE: New York, NY, USA, 2016; pp. 285–290. [Google Scholar]
  26. Shengyang, L.; Yanrong, W.; Kang, T.; Fangzheng, H. Construction and analysis of urban motor vehicle drivers’ traffic literacy evaluation model based on Zhengzhou City’s survey data. J. Math. 2022, 2022, 366458. [Google Scholar] [CrossRef]
  27. Celik, E.; Aydin, N.; Gumus, A.T. A multiattribute customer satisfaction evaluation approach for rail transit network: A real case study for Istanbul, Turkey. Transp. Policy 2014, 36, 283–293. [Google Scholar] [CrossRef]
  28. Aydin, N.; Celik, E.; Gumus, A.T. A hierarchical customer satisfaction framework for evaluating rail transit systems of Istanbul. Transp. Res. Part A Policy Pract. 2015, 77, 61–81. [Google Scholar] [CrossRef]
  29. Lee, S. Infrastructure service assessment model based on a service quality gap model-focused on South Korea. Sustainability 2022, 14, 577. [Google Scholar] [CrossRef]
  30. Haghighi, M.; Bakhtari, F.; Sadeghi-Bazargani, H.; Nadrian, H. Strategies to promote pedestrian safety from the viewpoints of traffic and transport stakeholders in a developing country: A mixed-method study. J. Transp. Health 2021, 22, 101125. [Google Scholar] [CrossRef]
  31. Wong, I.A.; Dioko, L.D.A. Understanding the mediated moderating role of customer expectations in the customer satisfaction model: The case of casinos. Tour. Manag. 2013, 36, 188–199. [Google Scholar] [CrossRef]
  32. Salem, I.E.; Elkhwesky, Z.; Ramkissoon, H. A content analysis for government’s and hotels’ response to COVID-19 pandemic in Egypt. Tour. Hosp. Res. 2022, 22, 42–59. [Google Scholar] [CrossRef]
  33. Zou, W.; Hu, X.; Pan, Z.; Li, C.; Cai, Y.; Liu, M. Exploring the relationship between social presence and learners’ prestige in MOOC discussion forums using automated content analysis and social network analysis. Comput. Hum. Behav. 2021, 115, 106582. [Google Scholar] [CrossRef]
  34. Vogler, D.; Schafer, M.S. Growing influence of university PR on science news coverage? A longitudinal automated content analysis of university media releases and newspaper coverage in Switzerland, 2003–2017. Int. J. Commun. 2020, 14, 22. [Google Scholar]
  35. Chen, H.; Huang, X.; Li, Z. A content analysis of Chinese news coverage on COVID-19 and tourism. Curr. Issues Tour. 2022, 25, 198–205. [Google Scholar] [CrossRef]
  36. Zielinski, S.; Kim, S.-i.; Botero, C.; Yanes, A. Factors that facilitate and inhibit community-based tourism initiatives in developing countries. Curr. Issues Tour. 2020, 23, 723–739. [Google Scholar] [CrossRef]
  37. Oviedo-Trespalacios, O.; Phillips, J.G. Sexual activity while driving: A content analysis of media reports. Transp. Res. Part F Traffic Psychol. Behav. 2021, 80, 141–149. [Google Scholar] [CrossRef]
  38. Li, J.; Xu, Q.; Cuomo, R.; Purushothaman, V.; Mackey, T. Data mining and content analysis of the Chinese social media platform Weibo during the early COVID-19 outbreak: Retrospective observational infoveillance study. JMIR Public Health Surveill. 2020, 6, e18700. [Google Scholar] [CrossRef]
  39. Gandasari, D.; Dwidienawati, D. Content analysis of social and economic issues in Indonesia during the COVID-19 pandemic. Heliyon 2020, 6, e05599. [Google Scholar] [CrossRef]
  40. Tiwari, P.; Ilavarasan, P.V.; Punia, S. Content analysis of literature on big data in smart cities. Benchmarking Int. J. 2021, 28, 1837–1857. [Google Scholar] [CrossRef]
  41. Abdullah, M.; Ali, N.; Shah, S.A.H.; Javid, M.A.; Campisi, T. Service quality assessment of app-based demand-responsive public transit services in Lahore, Pakistan. Appl. Sci. 2021, 11, 1911. [Google Scholar] [CrossRef]
  42. Gao, L.; Yu, Y. Public Transit Customer Satisfaction Dimensions Discovery from Online Reviews. Urban Rail Transit 2016, 2, 146–152. [Google Scholar] [CrossRef]
  43. Chonsalasin, D.; Jomnonkwao, S.; Ratanavaraha, V. Measurement model of passengers’ expectations of airport service quality. Int. J. Transp. Sci. Technol. 2021, 10, 342–352. [Google Scholar] [CrossRef]
  44. Wang, F.; Liu, J.; Wang, H. Sequential Text-Term Selection in Vector Space Models. J. Bus. Econ. Stat. 2021, 39, 82–97. [Google Scholar] [CrossRef]
Figure 1. Research framework of the study.
Sustainability 16 02108 g001
Figure 2. Word frequency distribution and fitted curves of passenger comments at different transport hubs. (a) Airport, (b) high-speed railway station, (c) railway station.
Sustainability 16 02108 g002aSustainability 16 02108 g002b
Figure 3. Semantic network diagram of passenger comments from different transport hubs. (a) Airport, (b) high-speed railway station, (c) railway station.
Sustainability 16 02108 g003aSustainability 16 02108 g003b
Figure 4. The boxplot of comment length at different transport hubs.
Sustainability 16 02108 g004
Figure 5. The boxplot of comment length under different satisfaction scores.
Sustainability 16 02108 g005
Table 1. Passenger comment statistics by year.
YearAirportHigh-Speed Railway StationRailway Station
2022294198156
2021390243230
2020272552154
2019143115161
Sum10991108701
Table 2. Ranking of passengers’ perception regarding the overall image of various transport hubs using word frequency.
RankingAirportCategoryHigh-Speed Railway StationCategoryRailway StationCategory
1security1subway2subway2
2plane2convenient3convenient3
3Huanghua4stop2train2
4convenient3waiting1waiting1
5terminal2security1square3
6time1traffic1place2
7serve1time1time1
8personnel1tea2high-speed2
9flight1pleasant2traffic1
10luggage1place2environment3
11tea2facility2personnel1
12pleasant3bus2intercity1
13design3queuing1facility2
14facility2serve1taxi2
15magnetic square3tea2
16levitation2personnel1pleasant1
17boarding gate2environment3serve1
18aviation1clean3first1
19epidemic3aerodrome2clean3
20boarding1traveler1center3
21subway2devise3building3
22rest2Inside3lift2
23environment3platform2bus2
24traffic1overall3Zhangjiajie4
25queuing1fist time1charge2
26clean3luggage1transit1
27Self-help2characteristic3outside3
28distance2Guangzhou4provincial4
29charge2Magnetic levitation2spacious3
30traveler1China4security1
31counter1specialty1self-help1
32attitude1passage2perimeter3
33delay1identity card1queuing1
34Shanghai4catering2seat2
35spacious3seat2passage2
36takeoff1center3health2
37passage2departure1identity card1
38catering2charge2tourism1
39examine1health2Beijing4
40ticket1McDonald’s2platform2
41free1Shanghai4devise3
42speed2humanized2luggage1
43weather3business1crowded1
44transit1trip1Guangzhou4
45seat2spacious3ancient3
46management1area3reconstruction3
47strict1snack1exit2
48specialty1massage2style3
49devise2distance3Yueyang4
50business1Beijing4Hengyang4
Note: In the category, 1, 2, 3, and 4 denote hub services, facilities, environment and layout design, and passengers’ destinations, respectively.
Table 3. The high-frequency words and corresponding passenger sentiments.
WordsCategorySentimentComments
security1positive“convenience of station security”,
”WeChat security save times”
negative“Security checks are very time intensive”
queuing1positive“minimizing queuing times”
negative“The queuing is very congested”
luggage1positive“great luggage check-in”
negative“Luggage storage is a little expensive”
serve1positive“benefits of business-class service”, “efficient ground service”, “friendly and very polite service”
negative“poor service attitude”, “service not comply with immunization measures”
facility2positive“The facility is very new and well maintained”, “plenty of entertainment and dining facilities”
subway2positive“The airport is very convenient as you can transfer directly to the subway”
negative“subway transfer are too long”
charging2positive“There is a charging device under the chair and it charges quickly”
tea2positive“The milk tea is delicious”
clean3positive“The airport floors are clean”, “The high speed train station is very clean”
tranquil3positive“The airport environment is very tranquil”
spacious3positive“It is spacious inside the airport”, “The high speed train station looks very spacious”
Shanghai4positive“The high-speed train station here is just like Shanghai”
Beijing4positive“Airports in the South are not the same as in Beijing”
Yueyang4positive“The railway station has changed a lot since I went to Yueyang five years ago”
Note: In the category, 1, 2, 3, and 4 denote hub services, facilities, environment and layout design, and passengers’ destinations, respectively.
Table 4. Network characteristics of passenger comment words at transport hubs.
IDCore Words/
Marginal Words
Node DegreeBetweenness CentralityCloseness CentralityPageRank ValueFeature Vector
Centrality
Airport
1security/serve14/313.67/0.150.61/0.520.06/0.030.63/0.23
2plane/luggage7/30.4/00.55/0.540.03/0.030.43/0.4
3front desk/area14/213.67/00.61/0.510.06/0.010.63/0.19
4convenient/outlet 8/11.83/00.56/0.510.03/0.010.46/0.1
5subway/charge8/10.38/00.61/0.50.72/0.010.45/0.1
High-speed railway station
1subway/facility17/644.75/00.69/0.550.08/0.030.87/0.47
2convenient/humanized16/611.91/00.67/0.550.07/0.030.87/0.45
3platform/health22/254.71/00.71/0.510.78/0.010.71/0.17
4bus/center10/20.71/00.6/0.510.04/0.010.67/0.17
5security/square10/20.81/00.63/0.510.04/0.010.67/0.17
Railway station
1subway/intercity14/213.5/00.63/0.510.06/0.010.57/0.19
2convenient/facility11/25.83/00.59/0.510.05/0.010.56/0.19
3security/Zhangjiajie11/24.08/0.010.59/0.520.05/0.010.57/0.1
4passage/provincial11/23.83/00.59/0.510.05/0.010.56/0.19
5bus/building9/20.83/00.57/0.510.04/0.010.52/0.19
Table 5. Statistics of passengers’ emotions and satisfaction values from different transport hubs.
AirportHigh-Speed Railway StationRailway Station
NumberPercentage (%)NumberPercentage (%)NumberPercentage (%)
Positive68262.0679171.3952574.89
Neutral26624.2025322.83507.13
Negative15113.74645.7812617.98
Segmentation results of positive sentiment
Low26223.8438434.6517024.25
Medium20518.65686.1415722.4
High21519.5633930.619828.24
Segmentation results of negative sentiment
Low1039.37595.718512.13
Medium343.0920273.85
High141.2830142
Satisfaction scores
Mean4.2-4.33-4.03-
Standard
deviation
0.93-0.91-1.01-
Median4.5-4.5-4-
Maximum5-5-5-
Minimum0.5-0.5-0.5-
Table 6. High-frequency words and their frequencies under different satisfaction scores.
Satisfaction ScoresAirportHigh-Speed Railway StationRailway Station
1service (53)
security check (51)
catering (49)
attitude (48)
management (42)
baggage check-in (38)
price (35)
personnel (65)
services (64)
passage (59)
attitude (57)
time (55)
toilet (50)
waiting room (44)
queuing (42)
personnel (54)
services (51)
design (47)
attitude (46)
window (46)
entrance (45)
air-conditioning (35)
security check (34)
refund (34)
transfer (33)
escalator (33)
waiting room (32)
5safety check (86)
convenience (84)
terminal building (70)
time (66)
maglev (41)
environment (36)
facilities (35)
clean (33)
subway (32)
design (31)
convenient (122)
subway (112)
traffic (101)
security (95)
facility (65)
environment (61)
square (60)
clean (59)
lobby (42)
feature (42)
convenience (74)
subway (64)
waiting room (57)
clean (51)
environment (41)
intercity (40)
traffic (40)
clock tower (33)
history (32)
facility (31)
architecture (29)
Table 7. Comparison of passengers’ emotions and satisfaction scores in different years.
2022202120202019
Number%Number%Number%Number%
Airport
Sum294100390100272100143100
Positive24683.6731480.5117263.2410774.83
Neutral82.72123.085620.59128.39
Negative4013.616416.414416.172416.78
Satisfaction scores
Mean4.33-4.23-4.19-3.87-
Standard deviation0.86-0.91-0.97-0.97-
Median4.5-4.5-4.00-4.00-
Maximum5-5-5.00-5.00-
Minimum0.5-0.5-1.00-1.00-
High-speed railway station
Sum198100243100552100115100
Positive16784.3420785.1947085.159280
Neutral2110.6193.7213.886.96
Negative105.052711.116111.051513.04
Satisfaction scores
Mean4.23-4.34-4.36-4.00-
Standard deviation1.07-0.89-0.86-0.93-
Median4.50-4.50-5.00-4.00-
Maximum5.00-5.00-5.00-5.00-
Minimum0.50-0.50-1.00-2.00-
Railway station
Sum156100230100154100161100
Positive11875.6418178.711071.4311672.05
Neutral117.05135.65106.49169.94
Negative2717.313615.653422.082918.01
Satisfaction scores
Mean4.29-4.39-3.89-3.78-
Standard deviation0.94-0.72-0.93-1.07-
Median4.50-4.50-4.00-4.00-
Maximum5.00-5.00-5.00-5.00-
Minimum0.50-0.50-1.00-1.00-
Table 8. Comparison of passengers’ emotions and satisfaction scores on workdays and holidays.
Working DaysHolidays
Number%Number%
Airport
Sum785100314100
Positive55971.2124878.98
Neutral10012.745015.92
Negative12616.05165.1
Satisfaction scores
Mean4.2-4.33-
Standard deviation0.94-0.92-
Median3-4-
Maximum5-5-
Minimum0.5-1-
High-speed railway station
Sum 782100326100
Positive58374.5426480.98
Neutral364.6288.59
Negative16320.863410.43
Satisfaction scores
Mean4.31-4.42-
Standard deviation0.92-0.87-
Median4-4-
Maximum5-5-
Minimum0.5-1-
Railway station
Sum471100230100
Positive3587615065.22
Neutral347.23125.22
Negative7916.776829.56
Satisfaction scores
Mean4.09-3.85-
Standard deviation0.98-0.96-
Median4-3.5-
Maximum5-5-
Minimum0.5-1-
Table 9. Comparison of passengers’ emotions and satisfaction scores with different lengths of comments.
Short CommentsLong Comments
Number%Number%
Airport
Sum407100692100
Positive33983.2951173.84
Neutral307.379914.31
Negative389.348211.85
Satisfaction scores
Mean4.23-4.15-
Standard deviation0.89-0.98-
Median4.5-4-
Maximum5-5-
Minimum0.5-0.5-
High-speed railway station
Sum508100600100
Positive42984.4545776.17
Neutral326.36510.83
Negative479.257813
Satisfaction scores
Mean4.33-4.29-
Standard deviation0.87-0.94-
Median4.5-4.5-
Maximum5-5-
Minimum0.5-0.5-
Railway station
Sum266100435100
Positive20878.230369.66
Neutral103.76378.51
Negative4818.049521.83
Satisfaction scores
Mean4.03-3.94-
Standard deviation1.01-1.02-
Median4-4-
Maximum5-5-
Minimum0.5-0.5-
Disclaimer/Publisher’s Note: The statements, opinions and data contained in all publications are solely those of the individual author(s) and contributor(s) and not of MDPI and/or the editor(s). MDPI and/or the editor(s) disclaim responsibility for any injury to people or property resulting from any ideas, methods, instructions or products referred to in the content.

