How Does Diversification of Producer Services Agglomeration Help Reduce Carbon Emissions Intensity? Evidence from 252 Chinese Cities, 2005–2018


Abstract
:1. Introduction
2. Theoretical Analyses
3. Empirical Framework
3.1. Econometric Models
3.2. Variables and Data
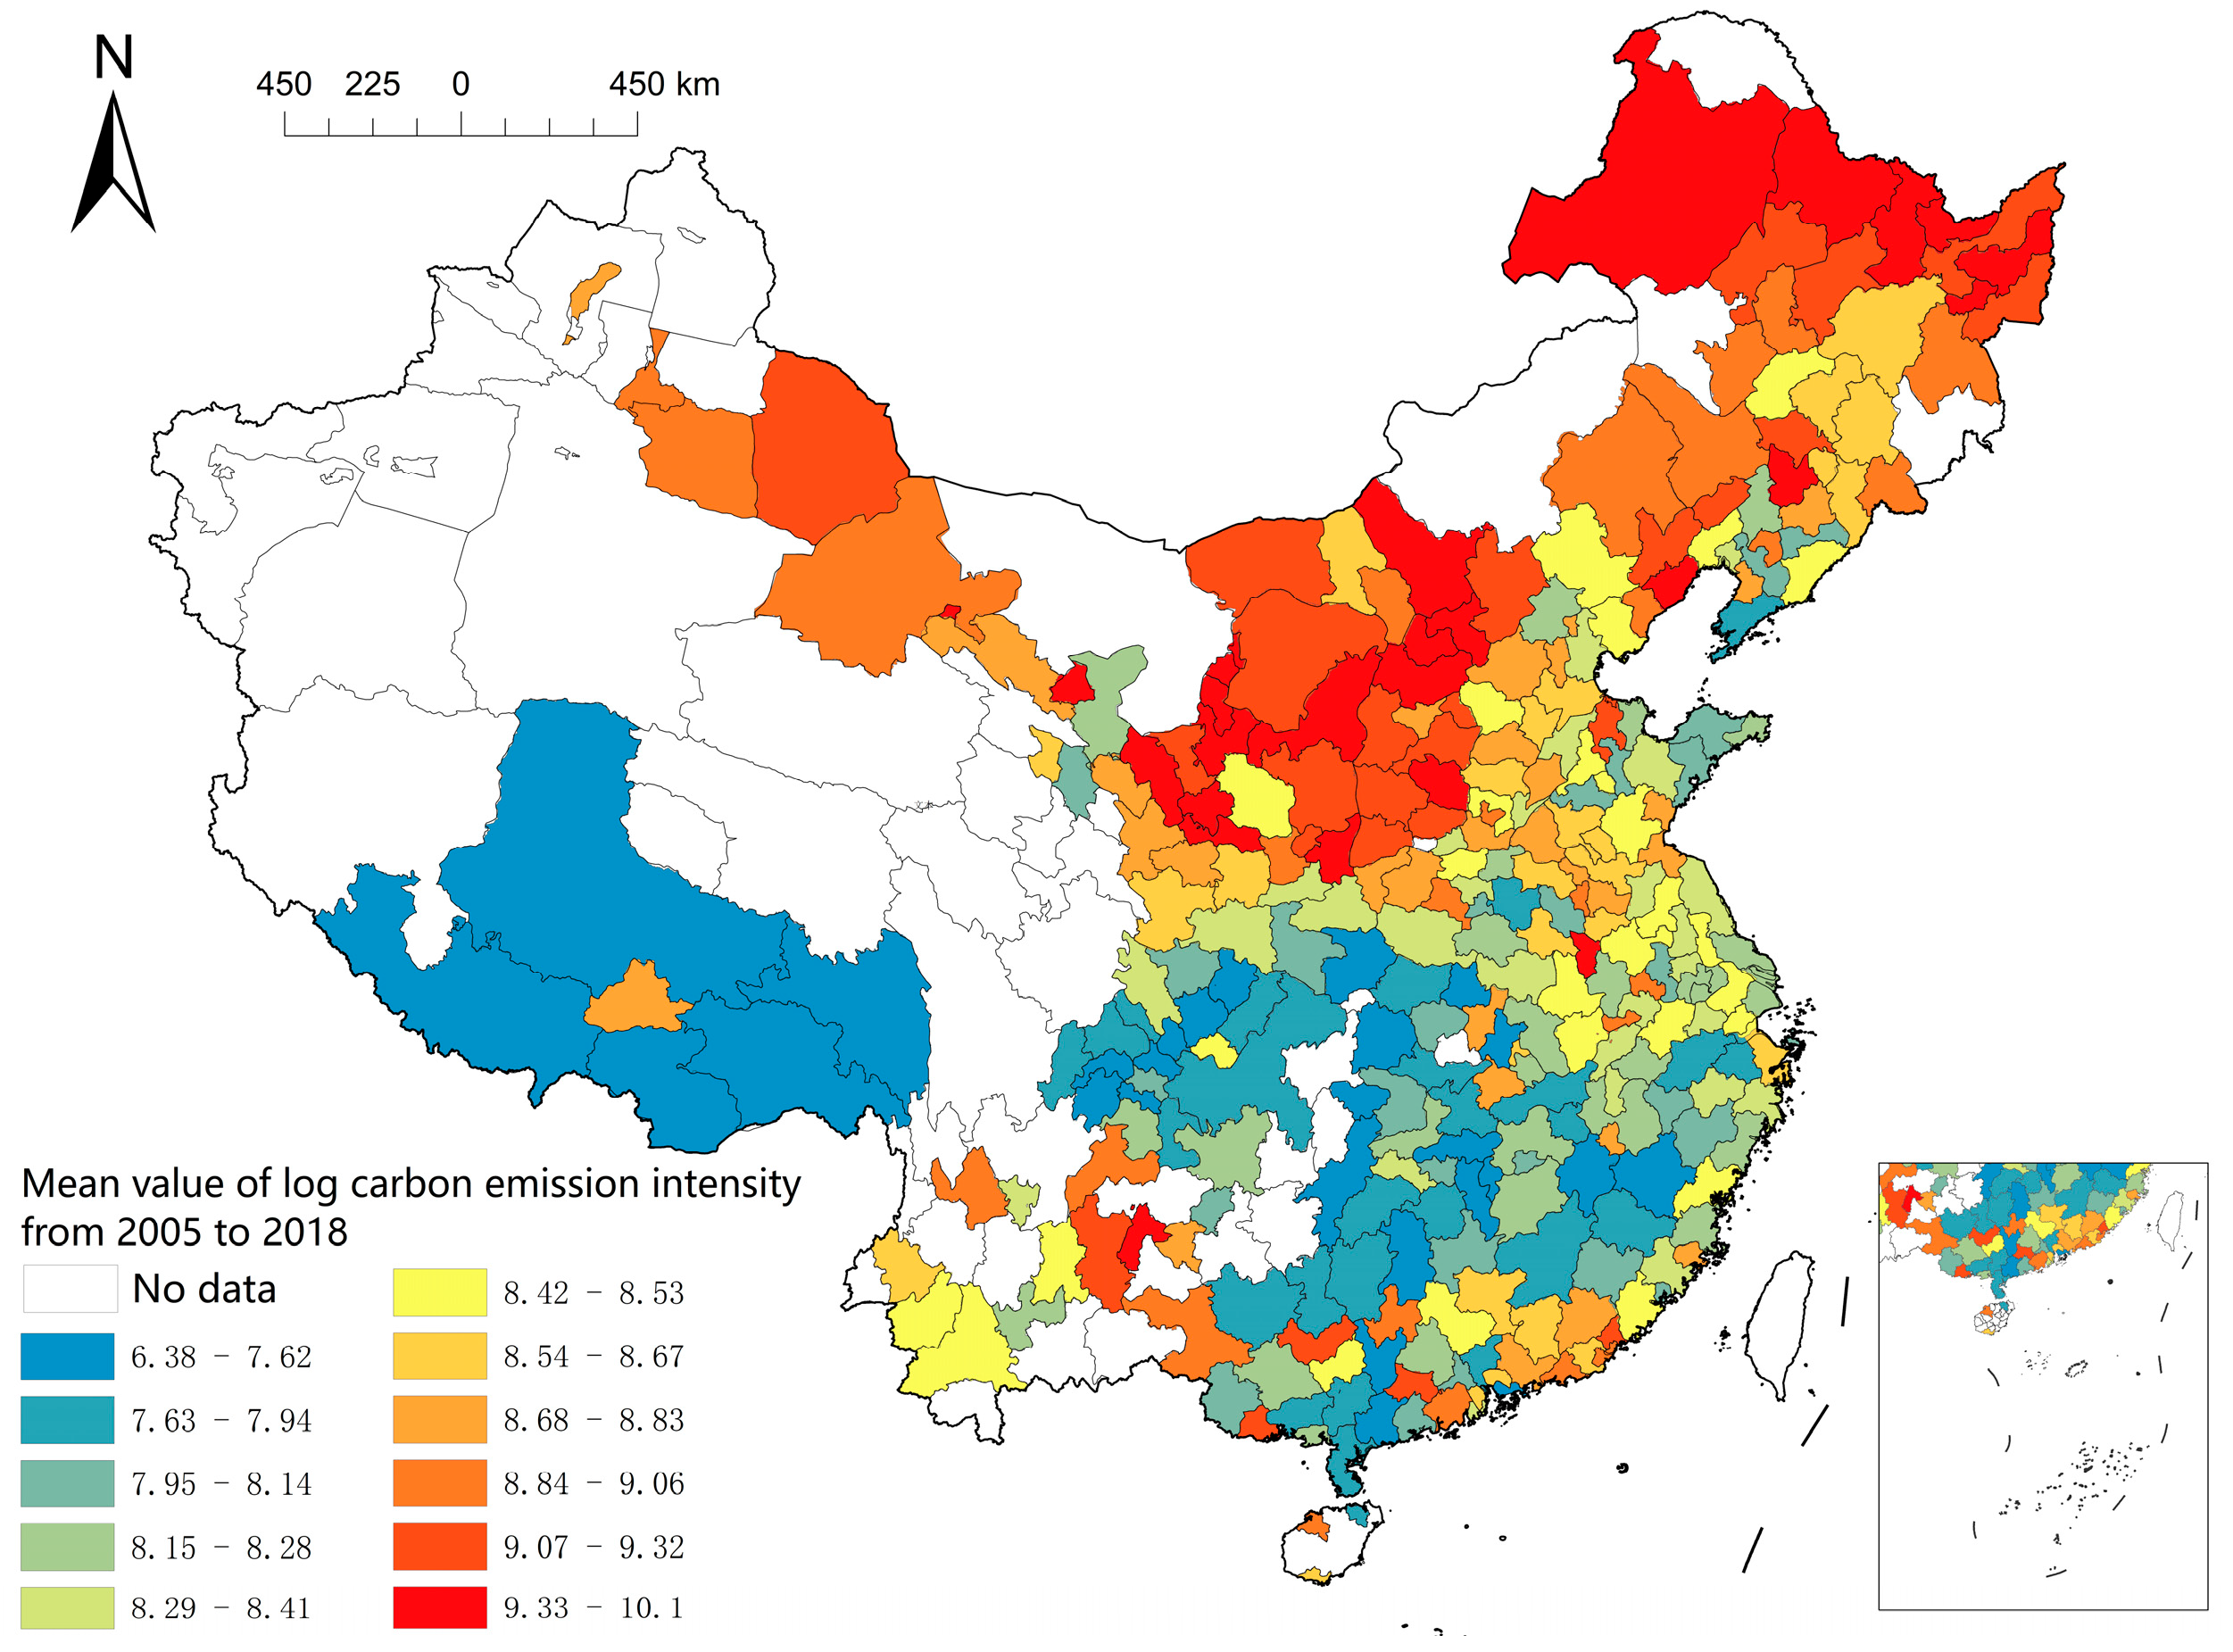
3.2.1. Measuring Carbon Emissions Intensity
3.2.2. Measuring Producer Services Agglomeration Diversification
3.2.3. Mechanism Variables
3.2.4. Controls
4. Baseline Results and Robustness Analyses
4.1. Baseline Results
4.2. Robustness
5. Mechanism Analyses
6. Heterogeneity
7. Discussion and Policy Implications
8. Conclusions
Author Contributions
Funding
Institutional Review Board Statement
Informed Consent Statement
Data Availability Statement
Conflicts of Interest
References
- Zhou, X.; Zhang, J.; Li, J. Industrial structural transformation and carbon dioxide emissions in China. Energy Policy 2013, 57, 43–51. [Google Scholar] [CrossRef]
- Liu, X.; Bae, J. Urbanization and industrialization impact of CO2 emissions in China. J. Clean. Prod. 2018, 172, 178–186. [Google Scholar] [CrossRef]
- Moran, D.; Kanemoto, K.; Jiborn, M.; Wood, R.; Többen, J.; Seto, K.C. Carbon footprints of 13,000 cities. Environ. Res. Lett. 2018, 13, 064041. [Google Scholar] [CrossRef]
- Song, Z.; Storesletten, K.; Zilibotti, F. Growing like china. Am. Econ. Rev. 2011, 101, 196–233. [Google Scholar] [CrossRef]
- Zhao, X.; Ma, X.; Chen, B.; Shang, Y.; Song, M. Challenges toward carbon neutrality in China: Strategies and countermeasures. Resour. Conserv. Recycl. 2022, 176, 105959. [Google Scholar] [CrossRef]
- Khan, U.; Wang, H.; Ali, I. A sustainable community of shared future for mankind: Origin, evolution and Philosophical foundation. Sustainability 2021, 13, 9352. [Google Scholar] [CrossRef]
- Hansen, N. The strategic role of producer services in regional development. Int. Reg. Sci. Rev. 1993, 16, 187–195. [Google Scholar] [CrossRef]
- Yang, F.F.; Yeh, A.G.; Wang, J. Regional effects of producer services on manufacturing productivity in China. Appl. Geogr. 2018, 97, 263–274. [Google Scholar] [CrossRef]
- Wood, P. Knowledge-intensive services and urban innovativeness. Urban Stud. 2002, 39, 993–1002. [Google Scholar] [CrossRef]
- Zeng, W.; Li, L.; Huang, Y. Industrial collaborative agglomeration, marketization, and green innovation: Evidence from China’s provincial panel data. J. Clean. Prod. 2021, 279, 123598. [Google Scholar] [CrossRef]
- Yeh, A.G.; Yang, F.F.; Wang, J. Producer service linkages and city connectivity in the mega-city region of China: A case study of the Pearl River Delta. Urban Stud. 2015, 52, 2458–2482. [Google Scholar] [CrossRef]
- Yu, J.; Shi, X.; Guo, D.; Yang, L. Economic policy uncertainty (EPU) and firm carbon emissions: Evidence using a China provincial EPU index. Energy Econ. 2021, 94, 105071. [Google Scholar] [CrossRef]
- Yang, J.; Cheng, J.; Huang, S. CO2 emissions performance and reduction potential in China’s manufacturing industry: A multi-hierarchy meta-frontier approach. J. Clean. Prod. 2020, 255, 120226. [Google Scholar] [CrossRef]
- Dong, F.; Yu, B.; Hadachin, T.; Dai, Y.; Wang, Y.; Zhang, S.; Long, R. Drivers of carbon emission intensity change in China. Resour. Conserv. Recycl. 2018, 129, 187–201. [Google Scholar] [CrossRef]
- Cheng, Z.; Li, L.; Liu, J. Industrial structure, technical progress and carbon intensity in China’s provinces. Renew. Sustain. Energy Rev. 2018, 81, 2935–2946. [Google Scholar] [CrossRef]
- Li, L.; Lei, Y.; Wu, S.; He, C.; Chen, J.; Yan, D. Impacts of city size change and industrial structure change on CO2 emissions in Chinese cities. J. Clean. Prod. 2018, 195, 831–838. [Google Scholar] [CrossRef]
- Zhang, F.; Deng, X.; Phillips, F.; Fang, C.; Wang, C. Impacts of industrial structure and technical progress on carbon emission intensity: Evidence from 281 cities in China. Technol. Forecast. Soc. Chang. 2020, 154, 119949. [Google Scholar] [CrossRef]
- Zheng, J.; Mi, Z.; Coffman, D.M.; Milcheva, S.; Shan, Y.; Guan, D.; Wang, S. Regional development and carbon emissions in China. Energy Econ. 2019, 81, 25–36. [Google Scholar] [CrossRef]
- Chang, N. Changing industrial structure to reduce carbon dioxide emissions: A Chinese application. J. Clean. Prod. 2015, 103, 40–48. [Google Scholar] [CrossRef]
- Zhang, P.; Yuan, H.; Bai, F.; Tian, X.; Shi, F. How do carbon dioxide emissions respond to industrial structural transitions? Empirical results from the northeastern provinces of China. Struct. Chang. Econ. Dyn. 2018, 47, 145–154. [Google Scholar] [CrossRef]
- Chen, D.; Chen, S.; Jin, H. Industrial agglomeration and CO2 emissions: Evidence from 187 Chinese prefecture-level cities over 2005–2013. J. Clean. Prod. 2018, 172, 993–1003. [Google Scholar] [CrossRef]
- Wu, J.; Xu, H.; Tang, K. Industrial agglomeration, CO2 emissions and regional development programs: A decomposition analysis based on 286 Chinese cities. Energy 2021, 225, 120239. [Google Scholar] [CrossRef]
- Jin, Z.; Li, Z.; Yang, M. Producer services development and manufacturing carbon intensity: Evidence from an international perspective. Energy Policy 2022, 170, 113253. [Google Scholar] [CrossRef]
- Zhao, J.; Dong, X.; Dong, K. How does producer services’ agglomeration promote carbon reduction?: The case of China. Econ. Model. 2021, 104, 105624. [Google Scholar] [CrossRef]
- Xu, H.; Liu, W.; Zhang, D. Exploring the role of co-agglomeration of manufacturing and producer services on carbon productivity: An empirical study of 282 cities in China. J. Clean. Prod. 2023, 399, 136674. [Google Scholar] [CrossRef]
- Combes, P.-P. Economic structure and local growth: France, 1984–1993. J. Urban Econ. 2000, 47, 329–355. [Google Scholar] [CrossRef]
- Ottaviano, G.; Thisse, J.-F. Agglomeration and economic geography. In Handbook of Regional and Urban Economics; Elsevier: Amsterdam, The Netherlands, 2004; Volume 4, pp. 2563–2608. [Google Scholar]
- Beaudry, C.; Schiffauerova, A. Who’s right, Marshall or Jacobs? The localization versus urbanization debate. Res. Policy 2009, 38, 318–337. [Google Scholar] [CrossRef]
- Hao, Y.; Guo, Y.; Guo, Y.; Wu, H.; Ren, S. Does outward foreign direct investment (OFDI) affect the home country’s environmental quality? The case of China. Struct. Chang. Econ. Dyn. 2020, 52, 109–119. [Google Scholar] [CrossRef]
- Elliott, R.J.; Shanshan, W. Industrial activity and the environment in China: An industry-level analysis. China Econ. Rev. 2008, 19, 393–408. [Google Scholar]
- Coe, N.M.; Townsend, A.R. Debunking the myth of localized agglomerations: The development of a regionalized service economy in South-East England. Trans. Inst. Br. Geogr. 1998, 23, 1–20. [Google Scholar] [CrossRef]
- Fan, L.-W.; You, J.; Zhou, P. How does technological progress promote carbon productivity? Evidence from Chinese manufacturing industries. J. Environ. Manag. 2021, 277, 111325. [Google Scholar] [CrossRef]
- Alonso-Villar, O.; Chamorro-Rivas, J.-M. How do producer services affect the location of manufacturing firms? The role of information accessibility. Environ. Plan. A 2001, 33, 1621–1642. [Google Scholar] [CrossRef]
- Tartaruga, I.G.P.; Sperotto, F.Q. Rethinking clusters in the sense of innovation, inclusion, and green growth. In Rethinking Clusters: Place-Based Value Creation in Sustainability Transitions; Springer: Berlin/Heidelberg, Germany, 2021; pp. 101–110. [Google Scholar]
- Marra, A.; Antonelli, P.; Pozzi, C. Emerging green-tech specializations and clusters–A network analysis on technological innovation at the metropolitan level. Renew. Sustain. Energy Rev. 2017, 67, 1037–1046. [Google Scholar] [CrossRef]
- Díez-Vial, I.; Belso-Martínez, J.A.; Gregorio, M.-d.-C. Extending Green Innovations Across Clusters: HOW can Firms Benefit Most? Int. Reg. Sci. Rev. 2023, 46, 149–178. [Google Scholar] [CrossRef]
- An, Y.; Zhou, D.; Yu, J.; Shi, X.; Wang, Q. Carbon emission reduction characteristics for China’s manufacturing firms: Implications for formulating carbon policies. J. Environ. Manag. 2021, 284, 112055. [Google Scholar] [CrossRef] [PubMed]
- Rokhmawati, A.; Gunardi, A. Is going green good for profit? Empirical evidence from listed manufacturing firms in Indonesia. Int. J. Energy Econ. Policy 2017, 7, 181. [Google Scholar]
- Ye, C.; Ye, Q.; Shi, X.; Sun, Y. Technology gap, global value chain and carbon intensity: Evidence from global manufacturing industries. Energy Policy 2020, 137, 111094. [Google Scholar] [CrossRef]
- Dong, F.; Zhu, J.; Li, Y.; Chen, Y.; Gao, Y.; Hu, M.; Qin, C.; Sun, J. How green technology innovation affects carbon emission efficiency: Evidence from developed countries proposing carbon neutrality targets. Environ. Sci. Pollut. Res. 2022, 29, 35780–35799. [Google Scholar] [CrossRef]
- Liu, J.; Duan, Y.; Zhong, S. Does green innovation suppress carbon emission intensity? New evidence from China. Environ. Sci. Pollut. Res. 2022, 29, 86722–86743. [Google Scholar] [CrossRef] [PubMed]
- Töbelmann, D.; Wendler, T. The impact of environmental innovation on carbon dioxide emissions. J. Clean. Prod. 2020, 244, 118787. [Google Scholar] [CrossRef]
- Xu, L.; Fan, M.; Yang, L.; Shao, S. Heterogeneous green innovations and carbon emission performance: Evidence at China’s city level. Energy Econ. 2021, 99, 105269. [Google Scholar] [CrossRef]
- Cao, J.; Karplus, V.J. Firm-level determinants of energy and carbon intensity in China. Energy Policy 2014, 75, 167–178. [Google Scholar] [CrossRef]
- Khanna, N.; Fridley, D.; Hong, L. China’s pilot low-carbon city initiative: A comparative assessment of national goals and local plans. Sustain. Cities Soc. 2014, 12, 110–121. [Google Scholar] [CrossRef]
- Liu, T.; Wang, Y.; Song, Q.; Qi, Y. Low-carbon governance in China–Case study of low carbon industry park pilot. J. Clean. Prod. 2018, 174, 837–846. [Google Scholar] [CrossRef]
- Hong, S.; Hui, E.C.-M.; Lin, Y. Relationship between urban spatial structure and carbon emissions: A literature review. Ecol. Indic. 2022, 144, 109456. [Google Scholar] [CrossRef]
- Xia, C.; Zhang, J.; Zhao, J.; Xue, F.; Li, Q.; Fang, K.; Shao, Z.; Li, S.; Zhou, J. Exploring potential of urban land-use management on carbon emissions—A case of Hangzhou, China. Ecol. Indic. 2023, 146, 109902. [Google Scholar] [CrossRef]


| Variables | Definitions | Observations | Mean | Std. Dev. |
|---|---|---|---|---|
| Log carbon emissions intensity per nominal GDP | 3772 | 8.520 | 0.697 | |
| Log producer services agglomeration diversification | 3772 | 0.202 | 0.091 | |
| Log producer services employment | 3772 | 6.554 | 0.858 | |
| Log manufacturing employment | 3772 | 10.724 | 1.117 | |
| Log real GDP | 3772 | 15.677 | 0.963 | |
| Ratio of the tertiary industry output to secondary industry output | 3772 | 0.844 | 0.404 | |
| Log average wages | 3772 | 10.263 | 0.575 | |
| Log total green patent applications | 3772 | 17.896 | 5.480 |
| (1) | (2) | (3) | (4) | |
|---|---|---|---|---|
| −1.695 *** | −0.302 *** | −0.181 *** | −0.145 *** | |
| (0.257) | (0.048) | (0.055) | (0.037) | |
| −0.043 ** | −0.023 * | |||
| (0.017) | (0.012) | |||
| −0.081 *** | −0.057 *** | |||
| (0.011) | (0.009) | |||
| −0.621 *** | ||||
| (0.036) | ||||
| 0.050 *** | ||||
| (0.013) | ||||
| −0.107 *** | ||||
| (0.026) | ||||
| −0.006 *** | ||||
| (0.001) | ||||
| City fixed effects | Yes | Yes | Yes | Yes |
| Year fixed effects | No | Yes | Yes | Yes |
| Constant | 8.861 *** | 8.580 *** | 9.707 *** | 20.201 *** |
| (0.052) | (0.010) | (0.118) | (0.538) | |
| Observations | 3780 | 3780 | 3780 | 3772 |
| Adj. R-squared | 0.743 | 0.961 | 0.963 | 0.977 |
| (1) | (2) | (3) | (4) | (5) | |
|---|---|---|---|---|---|
| −0.126 *** | −0.203 *** | −0.078 *** | −0.053 * | −0.143 *** | |
| (0.039) | (0.054) | (0.029) | (0.028) | (0.047) | |
| 0.009 | −0.026 * | −0.003 | −0.008 | −0.016 | |
| (0.014) | (0.015) | (0.010) | (0.009) | (0.015) | |
| −0.054 *** | −0.074 *** | −0.047 *** | −0.054 *** | −0.075 *** | |
| (0.010) | (0.011) | (0.008) | (0.007) | (0.011) | |
| −0.715 *** | −0.679 *** | −0.642 *** | −0.828 *** | −0.385 *** | |
| (0.042) | (0.041) | (0.036) | (0.018) | (0.031) | |
| 0.112 *** | 0.458 *** | 0.007 | 0.029 ** | 0.061 *** | |
| (0.017) | (0.021) | (0.012) | (0.012) | (0.014) | |
| −0.268 *** | −0.213 *** | −0.049 ** | −0.073 *** | −0.111 *** | |
| (0.032) | (0.033) | (0.023) | (0.020) | (0.029) | |
| −0.010 *** | −0.008 *** | 0.000 | −0.003 *** | −0.009 *** | |
| (0.002) | (0.002) | (0.001) | (0.001) | (0.001) | |
| City fixed effects | Yes | Yes | Yes | Yes | Yes |
| Year fixed effects | Yes | Yes | Yes | Yes | Yes |
| Constant | 24.473 *** | 22.869 *** | 19.942 *** | 23.011 *** | 16.677 *** |
| (0.635) | (0.634) | (0.518) | (0.336) | (0.520) | |
| Observations | 3772 | 3772 | 3772 | 4024 | 3522 |
| Adj. R-squared | 0.974 | 0.967 | 0.979 | 0.983 | 0.972 |
| (1) | (2) | (3) | (4) | (5) | |
|---|---|---|---|---|---|
| −0.470 ** | −0.545 *** | 4.991 *** | −0.377 ** | 0.414 ** | |
| (0.196) | (0.208) | (1.710) | (0.158) | (0.202) | |
| −0.353 *** | −0.222 *** | −0.570 | 0.014 | 0.253 *** | |
| (0.043) | (0.041) | (0.378) | (0.043) | (0.046) | |
| −0.128 *** | −0.389 *** | 2.973 *** | 0.067 ** | 0.011 | |
| (0.024) | (0.026) | (0.219) | (0.034) | (0.031) | |
| −0.213 *** | −0.248 *** | 1.794 *** | 0.161 ** | 0.217 *** | |
| (0.044) | (0.046) | (0.455) | (0.072) | (0.077) | |
| −0.053 * | 0.030 | −0.097 | 0.004 | −0.054 | |
| (0.029) | (0.032) | (0.248) | (0.059) | (0.050) | |
| 0.636 *** | 0.529 *** | 1.147 | 0.157 * | −0.033 | |
| (0.066) | (0.068) | (0.698) | (0.089) | (0.093) | |
| 0.001 | −0.005 | −0.002 | 0.003 | 0.135 *** | |
| (0.003) | (0.004) | (0.034) | (0.005) | (0.005) | |
| City fixed effects | Yes | Yes | Yes | Yes | Yes |
| Year fixed effects | Yes | Yes | Yes | Yes | Yes |
| Constant | 4.702 *** | 9.228 *** | −60.297 *** | −4.925 *** | −3.159 ** |
| (0.814) | (0.881) | (8.922) | (1.406) | (1.447) | |
| Observations | 3772 | 3772 | 3772 | 3772 | 3721 |
| Adj. R-squared | 0.807 | 0.832 | 0.750 | 0.907 | 0.949 |
| (1) | (2) | |
|---|---|---|
| −0.006 | ||
| (0.035) | ||
| −0.239 *** | ||
| (0.066) | ||
| −0.136 *** | ||
| (0.038) | ||
| −0.165 *** | ||
| (0.043) | ||
| All controls | Yes | Yes |
| City fixed effects | Yes | Yes |
| Province–year fixed effects | Yes | Yes |
| Constant | 20.097 *** | 20.192 *** |
| (0.538) | (0.539) | |
| Observations | 3772 | 3772 |
| Adj. R-squared | 0.977 | 0.977 |
Disclaimer/Publisher’s Note: The statements, opinions and data contained in all publications are solely those of the individual author(s) and contributor(s) and not of MDPI and/or the editor(s). MDPI and/or the editor(s) disclaim responsibility for any injury to people or property resulting from any ideas, methods, instructions or products referred to in the content. |
© 2024 by the authors. Licensee MDPI, Basel, Switzerland. This article is an open access article distributed under the terms and conditions of the Creative Commons Attribution (CC BY) license (https://creativecommons.org/licenses/by/4.0/).
Share and Cite
Luo, L.; Bi, T.; Yu, H. How Does Diversification of Producer Services Agglomeration Help Reduce Carbon Emissions Intensity? Evidence from 252 Chinese Cities, 2005–2018. Sustainability 2024, 16, 2125. https://doi.org/10.3390/su16052125
Luo L, Bi T, Yu H. How Does Diversification of Producer Services Agglomeration Help Reduce Carbon Emissions Intensity? Evidence from 252 Chinese Cities, 2005–2018. Sustainability. 2024; 16(5):2125. https://doi.org/10.3390/su16052125
Chicago/Turabian StyleLuo, Langsha, Tianyu Bi, and Haochen Yu. 2024. "How Does Diversification of Producer Services Agglomeration Help Reduce Carbon Emissions Intensity? Evidence from 252 Chinese Cities, 2005–2018" Sustainability 16, no. 5: 2125. https://doi.org/10.3390/su16052125