Abstract
As greenhouse gas emissions from dairy farms are on the rise, effective monitoring of these emissions has emerged as a crucial tool for assessing their environmental impacts and promoting sustainable development. Most of the existing studies on GHGs from dairy farms involve stationary detections with long response times and high costs. In this study, a greenhouse gas detection system was constructed based on NDIR technology using a single broadband light source and a four-channel thermopile detector for the detection of CH4, N2O, and CO2; the detection range of CH4 was 0~100 ppm; that of N2O was 0~500 ppm; and that of CO2 was 0~20%. After the concentration calibration, the cross-interference between the gas measurement channels was studied, and the least-squares method was used to correct the interference between the three gases. The experimental results showed that the full-range deviation of the detection device was lower than 0.81%, the repeatability was lower than 0.39%, the stability was lower than 0.61%, and the response time was lower than 10 s. This study also carried out on-site testing in Luoyang Shengsheng Ranch (Luoyang, China), and the results show that the error between this device and the PTM600 portable gas analyzer is within 9.78%, and the dynamic response time of this device is within 16 s, at which point the content of greenhouse gases in dairy farms can be measured quickly and accurately. The objective of this study is to enhance the precision and effectiveness of greenhouse gas (GHG) emissions monitoring from dairy farms, thereby contributing to environmental protection and sustainable development goals. By achieving this, we aim to facilitate societal progress towards a greener and low-carbon future.
1. Introduction
With the rapid development of the economy, greenhouse gas emissions have triggered a serious climate crisis, threatening the productivity and lives of human beings. To unite the world’s forces to respond to the climate crisis, many countries worldwide have discussed the issue of greenhouse gas emissions, and a consensus has been reached [1,2,3]. By 2021, more than 50 countries achieved “peak carbon”, and more than 130 countries and territories have made carbon-neutral commitments [4]. While the dairy farming industry provides food and economic benefits for human beings, it also emits greenhouse gases such as carbon dioxide (CO2), methane (CH4), and nitrous oxide (N2O), which will exacerbate the global greenhouse effect, leading to climate change, sea level rise, and other problems [5,6,7,8]. Therefore, it is necessary to monitor the greenhouse gases emitted from dairy farms, and some scholars [7,9,10,11] have already performed research on monitoring this, but most of them use the existing gas analyzers to perform stationary monitoring, however, these are only capable of detecting the concentration of the gases in fixed locations on the dairy farms, and are unable to comprehensively detect the distribution of the concentration throughout the entire livestock and poultry farm. The traditional fixed methods for quantitative detection of multiple analytes by gas chromatographs, semiconductor gas sensors, and electrochemical sensors have limitations in real-time monitoring, response time, selectivity, and resistance to cross-talk [12,13]. The NDIR technology [14,15,16,17] has obvious advantages in the field of multi-component gas detection due to its high sensitivity, high selectivity, fast response, and long life span [18].
Several scholars have studied multi-gas detection systems based on NDIR. Sun [16] established a multi-gas non-dispersive infrared spectroscopy (NDIR) detection system consisting of two broadband light sources and multiple detectors, and proposed an interference-free mixed-gas measurement method based on differential cancellation of NDIR spectra for the detection of CH4 (0–3000 ppm) and CO2 (0–5000 ppm), which is smaller in size, cheaper in cost, and more stable compared with the traditional multi-channel detection system. De [19] developed a novel infrared non-dispersive multi-gas sensor for the measurement of carbon dioxide (CO2) and methane (CH4) in river sediments, in which the infrared filter was developed taking into account the bandwidth (BW) and the center wavelength (CWL) of the gas infrared spectrum, and the sensor volume was only 2.23 mL. Xie [20] introduced a weak signal processing circuit designed to measure CO, CO2, and C3H8 in automobile exhaust gases by employing near-infrared detectors. The feasibility of this design was confirmed through simulation analysis. Tan [21] introduced a three-gas detection system utilizing non-dispersive infrared (NDIR) technology, incorporating an environmental parameter compensation method. This system can detect CH4 concentrations ranging from 0 to 5%, CO concentrations from 0 to 4.45%, and CO2 concentrations from 0 to 4.8%. To enhance the optical range, the chamber walls of the gas chamber were designed as paraboloidal surfaces. Additionally, the author proposed a compensation method to mitigate the effects of ambient temperature, humidity, and pressure variations, thereby enhancing the accuracy of gas detection. Wang [22] proposed a non-dispersive infrared (NIR) instrument using galvanometer modulation with a common optical path for multi-component gas detection to detect CO and CO2 gas concentrations in the range of 0 to 10%, which is simpler to configure and offers better detection efficiency and stability than conventional NIR instruments using chopper modulation. Dong [23] introduced a multi-gas sensor system utilizing time-division multiplexing (TDM) technology for the detection of CO, CO2, and CH4 concentrations ranging from 0 to 0.25%. For static detection of these gases, the Allan deviations were 2.96, 4.54, and 2.84 ppmv, respectively, within a 1 s averaging time. For dynamic detection, the Allan deviations were similarly 2.96, 4.54, and 2.84 ppmv within a 10 s averaging time. The reported system finds diverse applications, including gas detection in coal mines. Xu [24] developed a non-dispersive infrared (NDIR) multi-gas detection system, which consists of a broadband light source, a gas chamber, and a four-channel thermopile detector, and can be used for detecting gases with a C3H8 concentration of 0~5000 ppm, a CO concentration of 0~14%, and a CO2 concentration of 0~20%. The system has a full-scale error of less than 3.5%, a detection repeatability of less than 4.5%, and a detection stability of less than 2.7%, making it an economical and energy-saving method for analyzing automobile exhaust emissions.
Most existing studies on greenhouse gases (GHGs) in dairy farms rely on stationary detection methods, which often exhibit long response times and incur significant costs. In contrast, this study presents a novel approach based on non-dispersive infrared (NDIR) technology. We have developed a set of GHG detection devices tailored to the range of emissions from dairy farms, as outlined in previous studies [25,26,27]. These devices are capable of rapidly detecting three key gases: methane (CH4), carbon dioxide (CO2), and nitrous oxide (N2O). To facilitate efficient detection, we have integrated a roving robot into the system. Our goal is to provide dairy farmers with a cost-effective and timely solution for GHG monitoring, thereby supporting their sustainable development and contributing to the global effort of achieving the “peak carbon” target.
2. Materials and Methods
In this study, a greenhouse gas detection device was constructed based on NDIR technology using a single broadband light source and a four-channel thermopile detector. To improve the accuracy and reliability of the greenhouse gas detection device, calibration experiments were carried out on the device, linear cross-interference corrections were applied to the measured values using the least-squares method, and the relative error, repeatability, stability, response time, and other parameters of the greenhouse gas detection device were subsequently measured. Finally, the actual measurements were carried out on a dairy farm by using this research device and a PTM600 portable gas analyzer produced by Eranntex (Shenzhen, China) to compare the measurement errors between the two devices, and the greenhouse gases in the dairy farm were detected and analyzed by using this device.
2.1. Non-Dispersive Infrared Spectroscopy
The Beer–Lambert law is a fundamental theory used in gas infrared spectroscopy detection methods [28]. In 1760, Lambert described the relationship between the degree of absorption of infrared light and the thickness of a substance when a beam of infrared light passed through the substance, and, in 1852, Beer suggested that there is also a relationship between the degree of absorption of infrared light and the concentration of the substance. The combination of the two can be evolved to obtain the Lambert–Beer law. When subjected to a certain frequency range of infrared light, the gas to be measured will be absorbed at the characteristic frequency of light waves so that the emitted infrared light at the characteristic frequency of the light intensity decreases; this expression is shown in Equation (1).
where is the incident light intensity absorbed by the gas molecules; is the incident light intensity not absorbed by the gas molecules; is the absorption coefficient of the gas molecules at the wavelength; C is the concentration of the gas to be measured; and l is the absorption range.
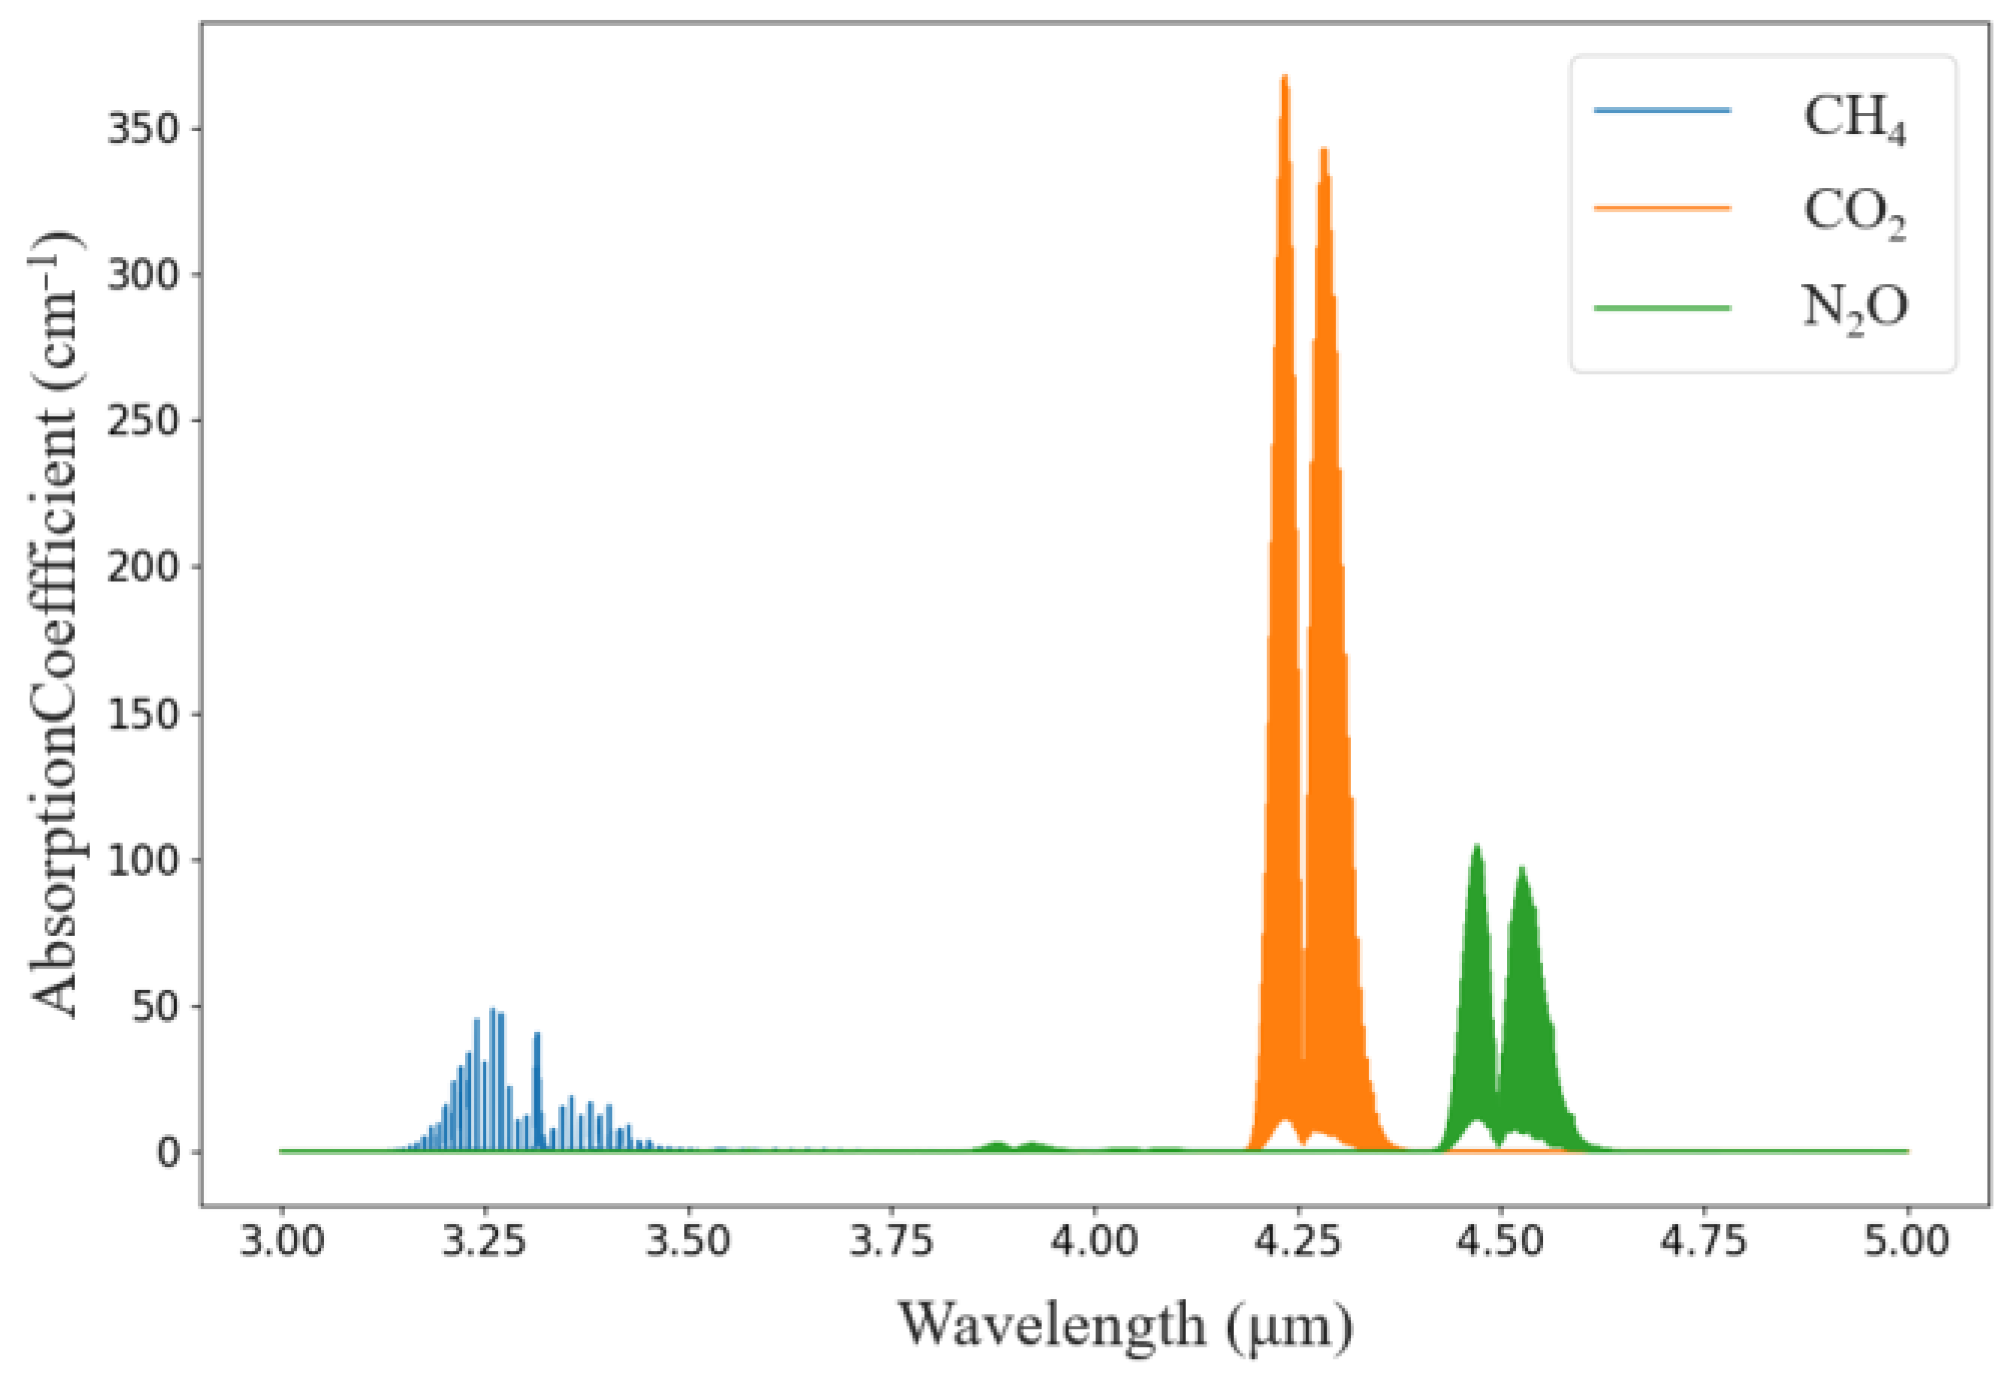
According to the HITRAN database, the absorption peaks of CH4, CO2, and N2O molecules in the 3~5 μm band were plotted, and the absorption peaks of the three gases did not overlap; therefore, they can be used as the absorption bands of the three gases, as shown in Figure 1.
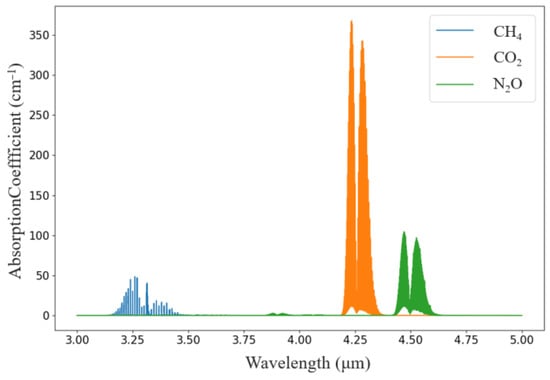
Figure 1.
Infrared absorption spectra of CH4, CO2, and N2O.
Figure 1 shows that CH4 gas has the largest infrared absorbance at a wavelength of approximately 3.3 μm, CO2 gas has absorption peaks at approximately 4.24 and 4.26 μm, and the infrared absorbance is greatest at 4.26 μm compared with that at 4.26 μm. N2O gas has absorption peaks at 4.45 μm and 4.53 μm, the absorption peaks are larger at 4.26 μm than at 4.45 μm and 4.53 μm, and the absorption peaks are larger at 4.26 μm than at 4.26 μm. N2O gas has absorption peaks at 4.26 μm, 4.53 μm, and 4.26 μm.
Filters are mainly used to avoid cross-interference caused by overlapping fringe absorption peaks. A suitable filter generally passes through only one wavelength that can be absorbed by a gas. The characteristic parameters of the four-channel optical filter are shown in Table 1.

Table 1.
The characteristic parameters of the four-channel filter.
2.2. Algorithmic Principles
In practice, the gas concentrations detected by and are not accurate enough, and the detection accuracy is affected by fluctuations in the radiation of the infrared light source, the error and drift generated by the circuit device, the poor refractive index of the light source due to contamination of the inner wall of the gas chamber, and the ambient light. In practice, the detection accuracy is affected by fluctuations in the radiation applied to the infrared light source, temperature drifts in the electronic components, mechanical vibrations in the gas chamber, and interference from the optical path [29,30]. To minimize the impact of the above factors on the infrared gas detection device, this study takes the ratio of the signals of the two windows of the measurement channel and the reference channel, in a differential form, to eliminate the possible interference and the impact of the detector system parameters and to improve the reliability of the infrared gas detection device [31].
Let the output voltage of the gas channel be measured and the output voltage of the reference channel be , as shown in Equation (2).
where denotes the initial incident light intensity. and denote the transmittance of the filter and the responsivity of the detector of the gas channel to be measured and the reference channel, respectively. Since the light intensity is affected by the environment, it is not easy to measure directly; therefore, the ratio between the output voltage of the gas channel to be measured and the output voltage of the reference channel is calculated as shown in Equation (3).
Let
Then,
Morphing the formula gives
If the external system environment is fixed, the absorption coefficients of the gases and the effective optical range of the gas chamber are fixed, and the system parameters and of the filters reflecting the gas channel to be measured and the reference channel are fixed; then, the ratio of and is also fixed. Equation (6) shows that the concentration of the gas to be measured, , has a certain functional relationship with the ratio of the voltages of the two channels, d, i.e., . Therefore, it is only necessary to measure the ratio of the voltages of the outputs of the individual channels, , to determine the concentration of the gas, C.
2.3. Device Development
2.3.1. Integral Devices
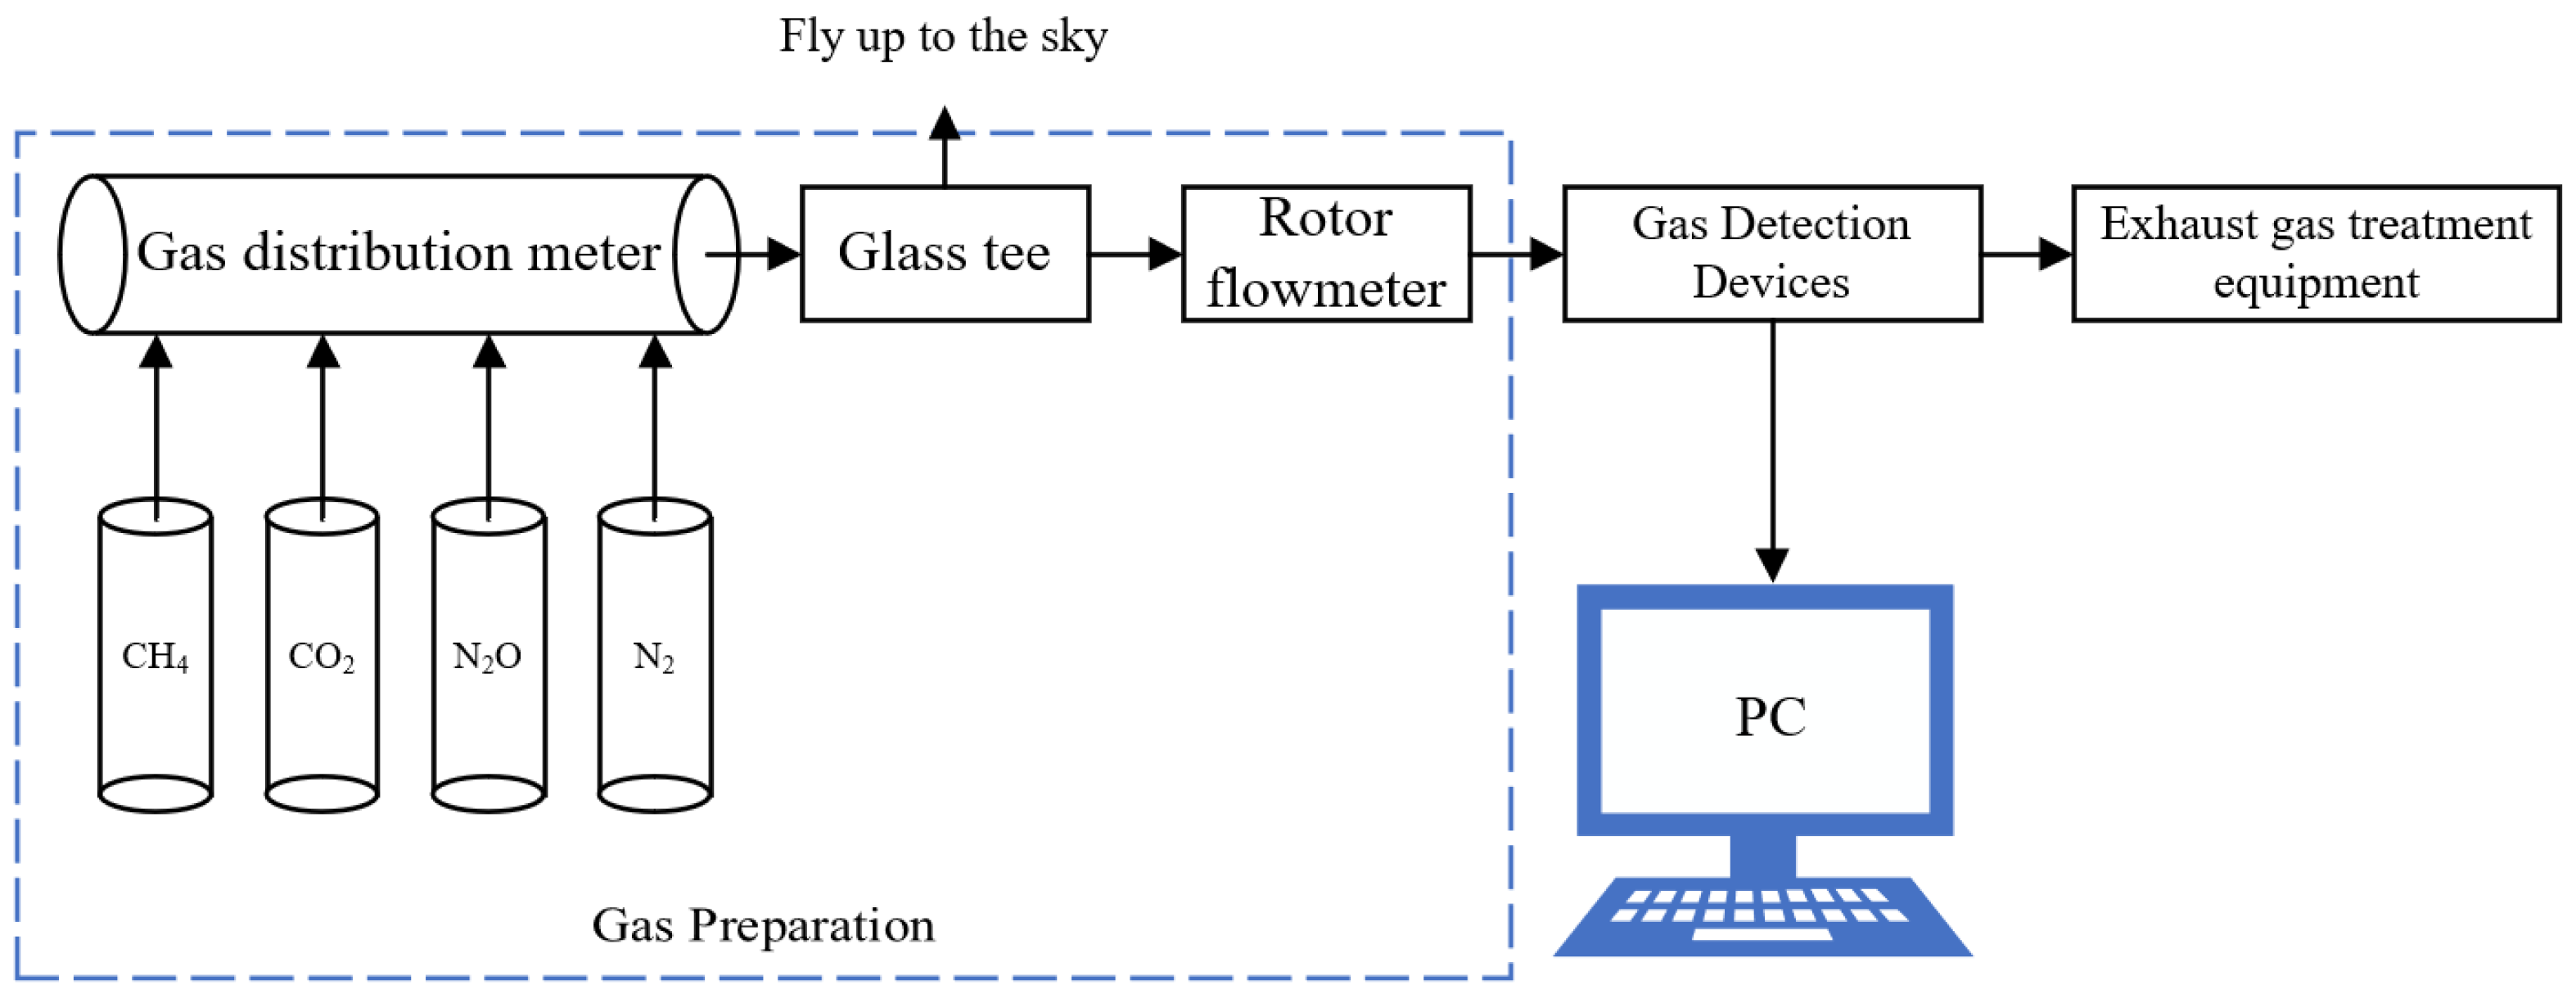
In this study, the experimental setup of the greenhouse gas detection system was built by combining the infrared absorption principle, as shown in Figure 2; this system includes the standard gas to be tested, standard nitrogen, a gas distribution meter, a glass tee, a rotor flowmeter, a gas detection device, an exhaust gas treatment device, and an upper computer. Among them, glass tees are used for evacuation and as gas flow pipes, and a rotor flow meter is used to monitor the flow rate of the gas path. During the experiment, the standard gas to be tested was mixed with standard nitrogen gas through the gas dispenser, the gas concentration to be configured was set on the gas dispenser, and the configured gas was evacuated all the way through the tee and entered all the way into the gas detection device through the rotor flow meter. Through the PC and gas detection device, communication module communication can be obtained under the current calibration concentration of the gas detector terminal return signal value and concentration value.

Figure 2.
Experimental setup based on the NDIR greenhouse gas detection system.
2.3.2. Greenhouse Gas Detection Devices
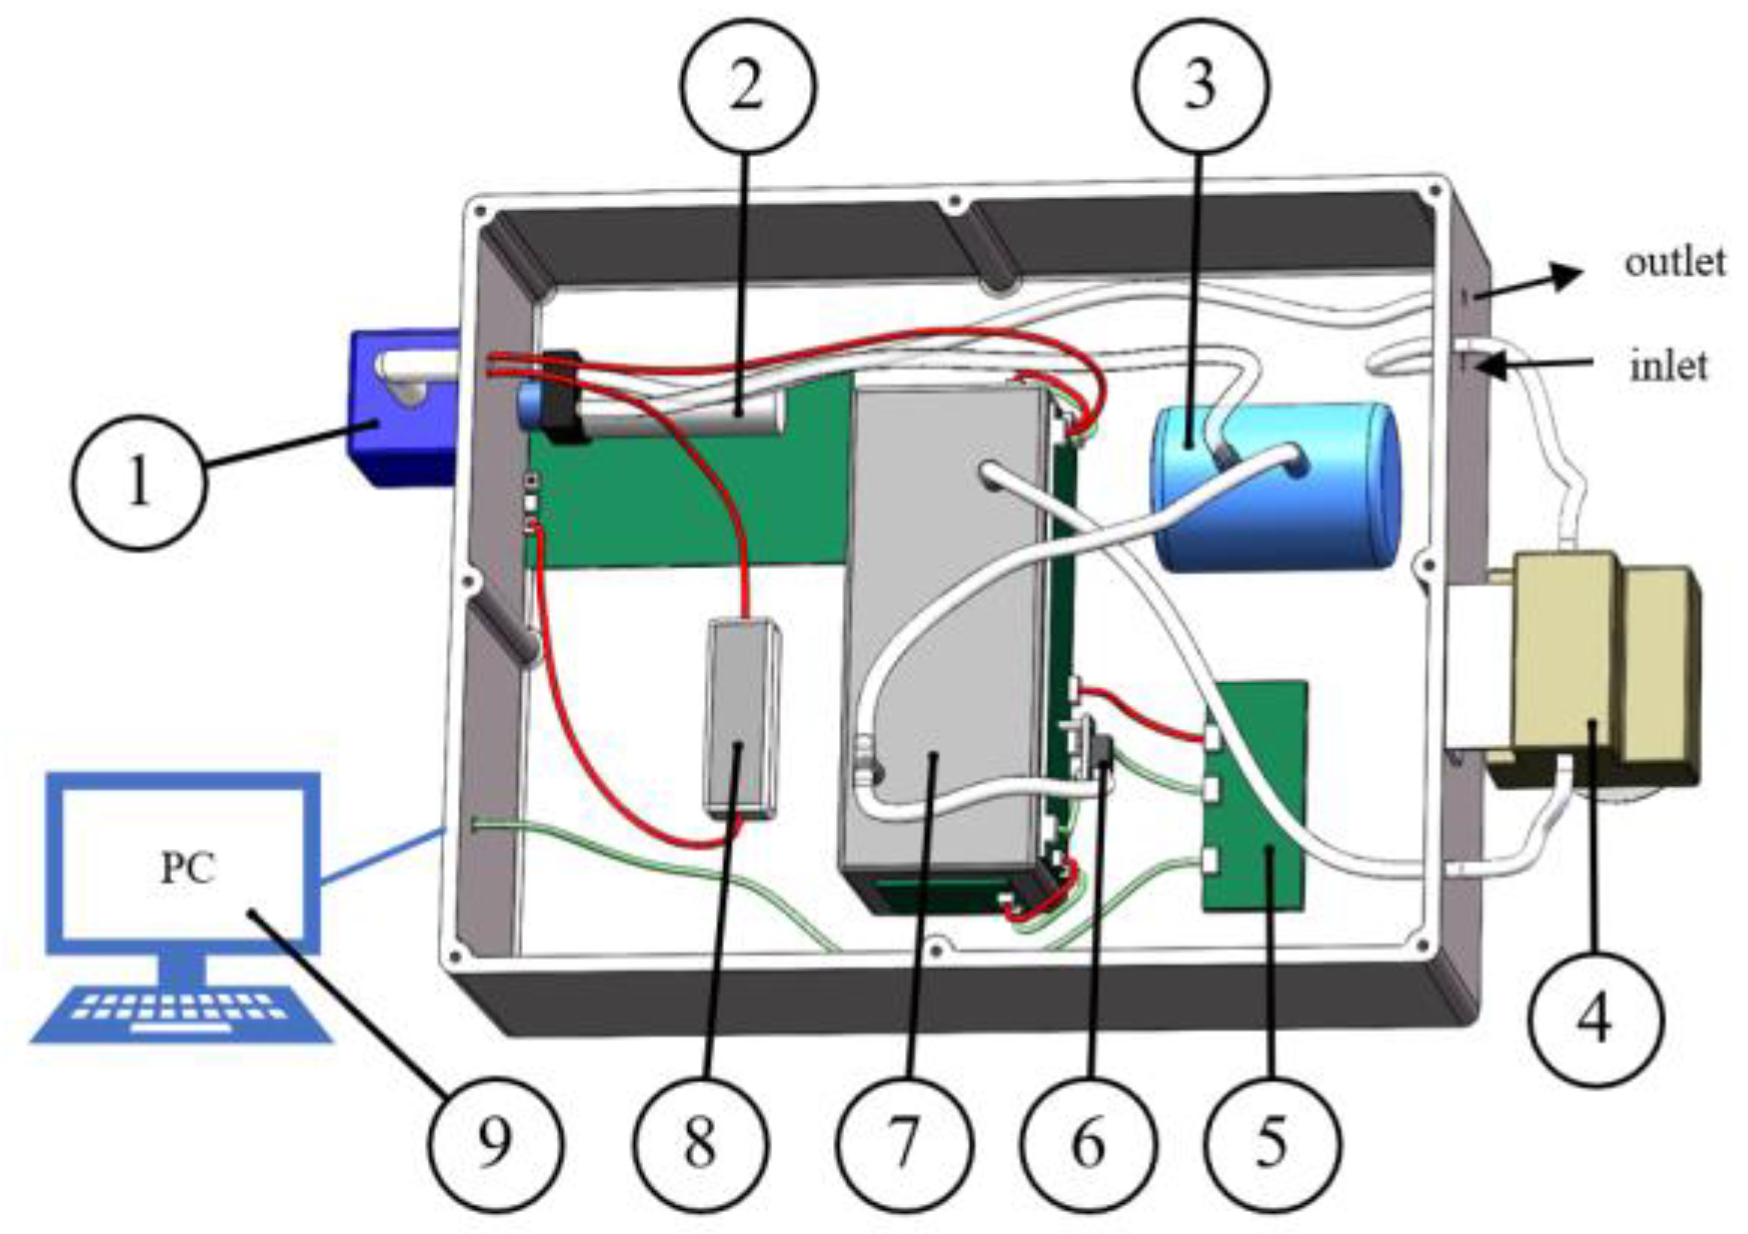
The greenhouse gas detection devices built in this study included a power supply, a gas pump, a gas detection module, a pressure sensor, a gas capacity device, a gas filtration module, a pressure stabilization module, a communication module, etc. The three-dimensional layout is shown in Figure 3. The gas filtration module is used to remove water and dust and protect the module; the pressure sensor is used to measure the pressure of the gas path; the gas capacity device is used to make the gas flow smoother; and the communication module is used to communicate with the host computer. The white color in the figure indicates the gas path, the red line indicates the power supply route, and the green line indicates the signal transmission route.
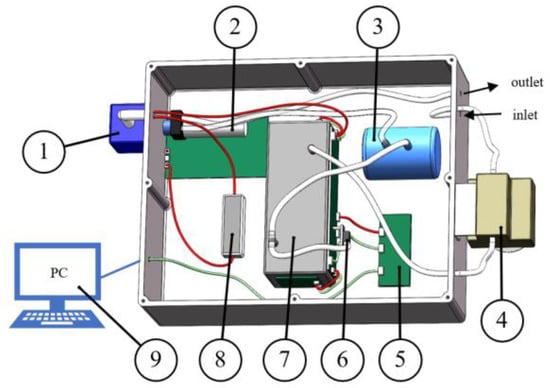
Figure 3.
Three-dimensional view of a greenhouse gas detection device. 1. Power supply; 2. gas pump; 3. gas capacity device; 4. gas filtration module; 5. communication module; 6. pressure sensor; 7. gas detection module; 8. pressure stabilization module; and 9. PC.
During the experiment, the configured gas first enters the gas detection module inlet through the gas filtration module, and the gas exiting the gas detection module outlet is connected to the pressure sensor all the way to measure the pressure of the gas flow all the way into the gas capacity device. The gas exiting the gas capacity device is discharged by the gas pump, and the data measured by the gas detection module and the pressure sensor are transmitted to the communication module, which communicates with the upper computer and reads the signal value and the concentration value, completing the whole detection process.
2.3.3. Gas Detection Module
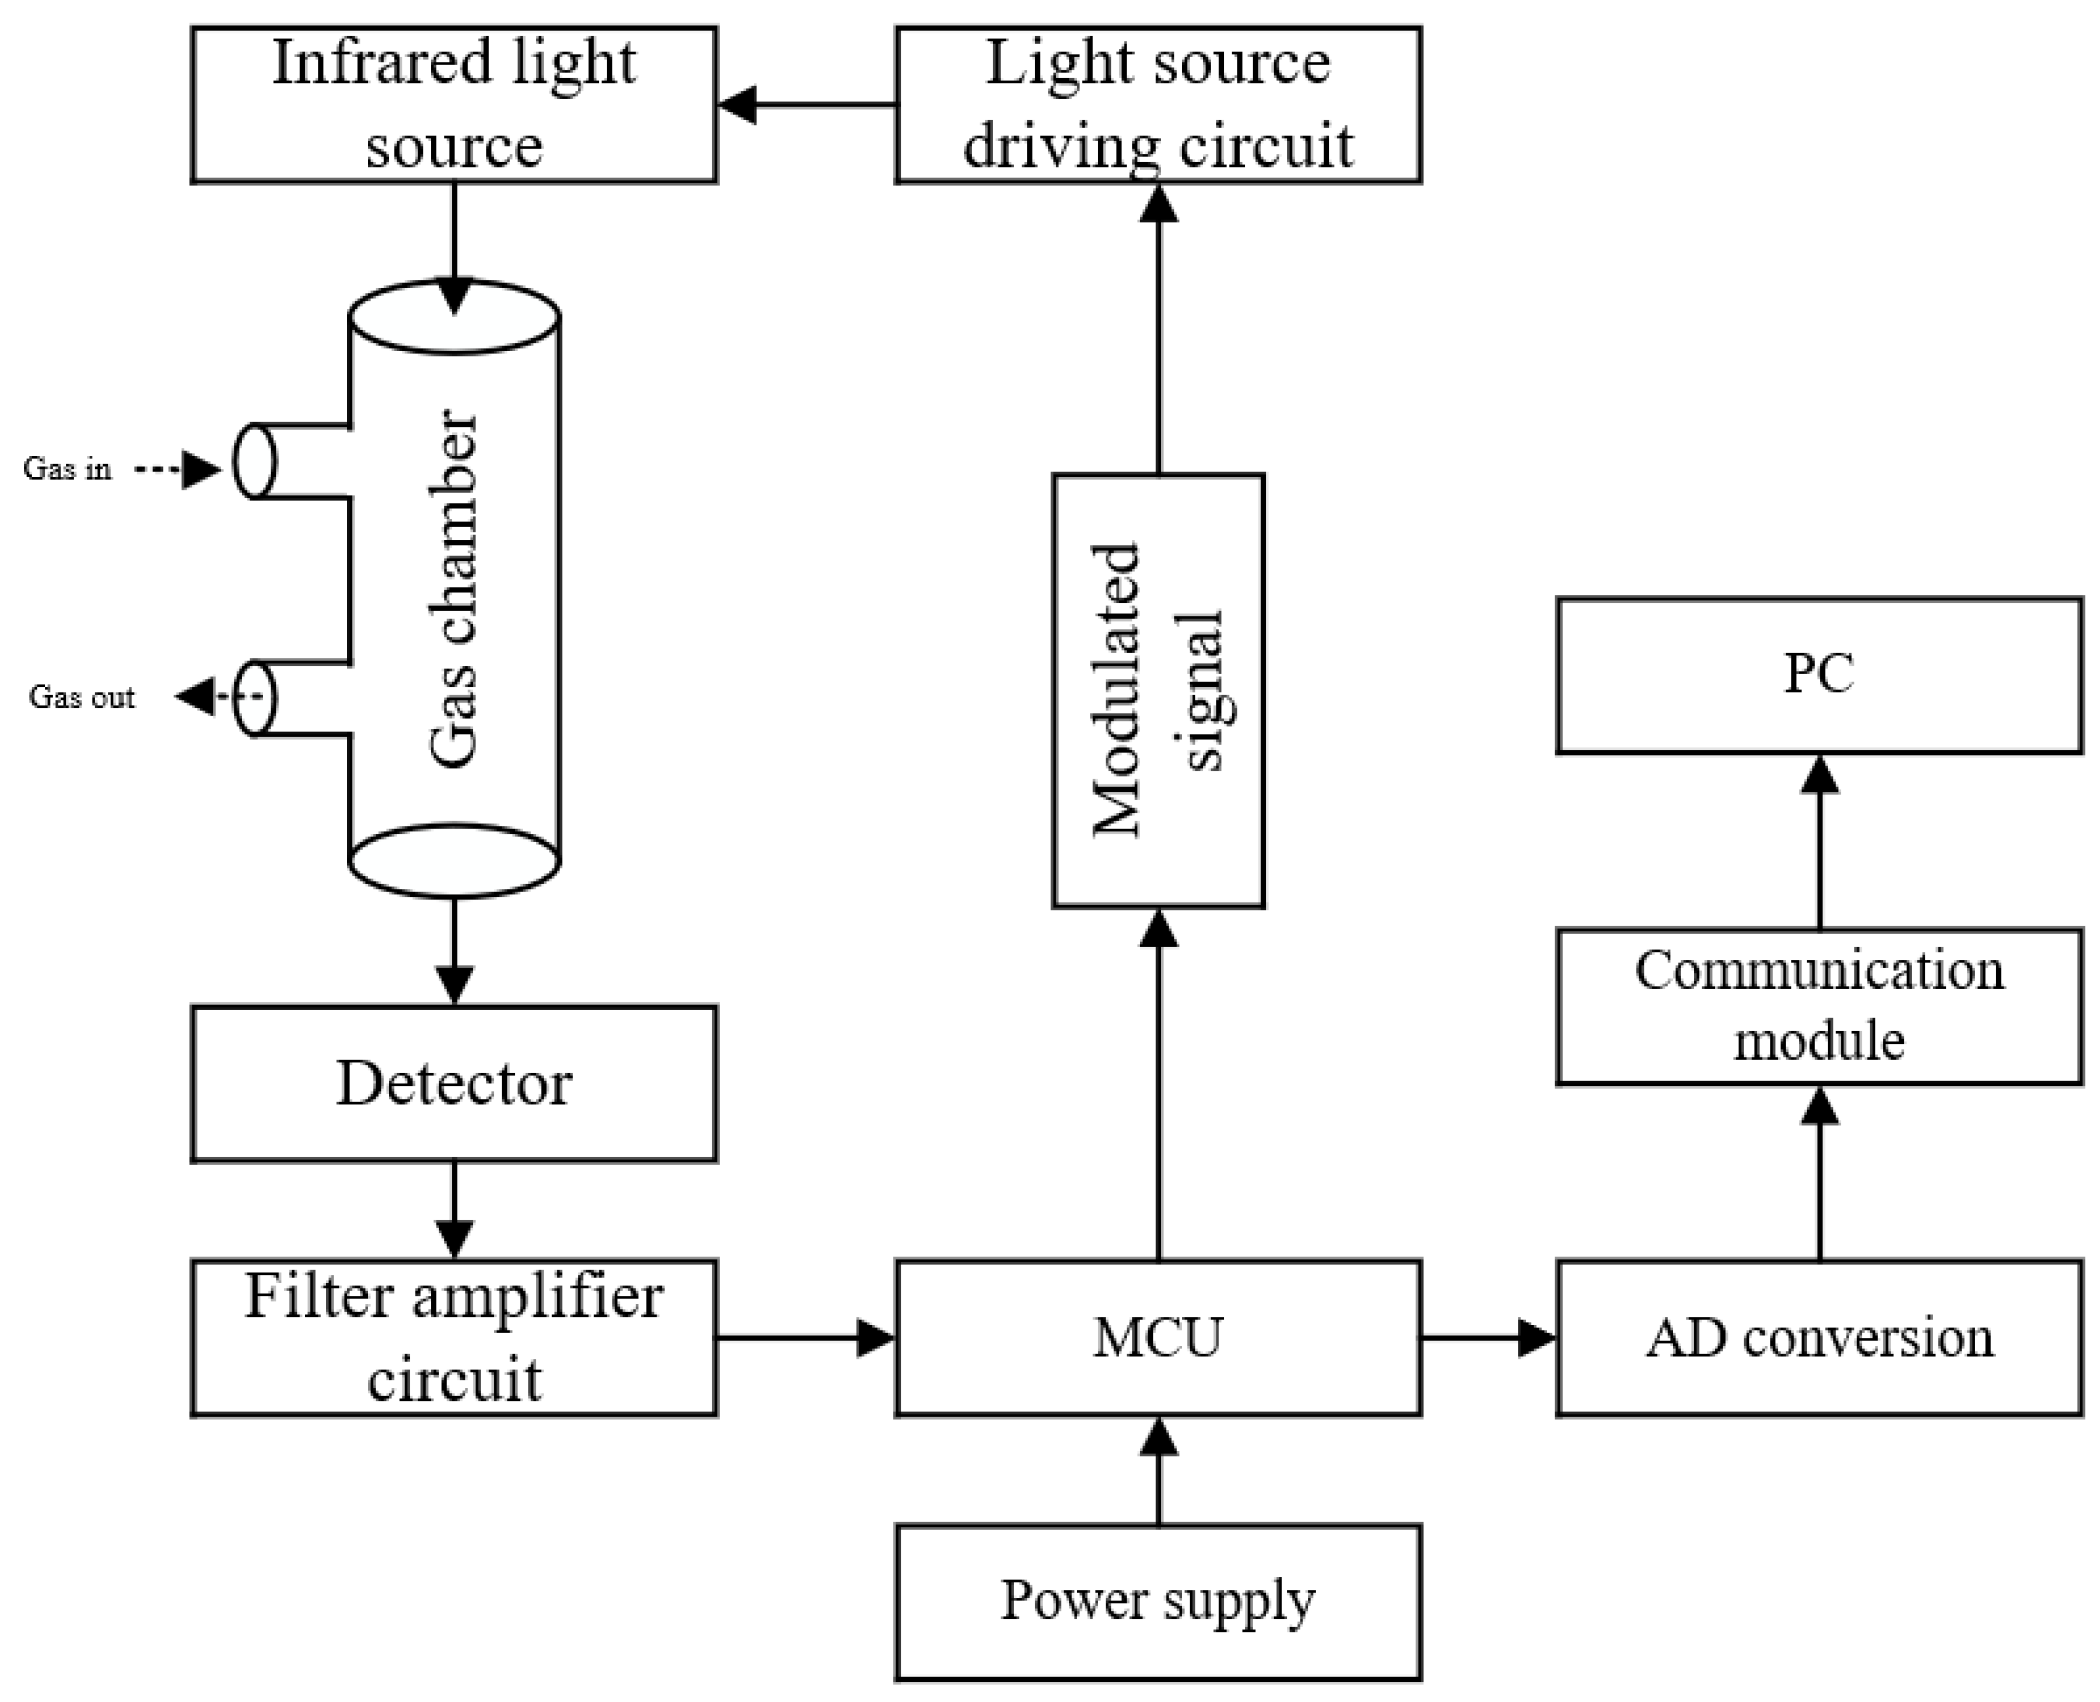
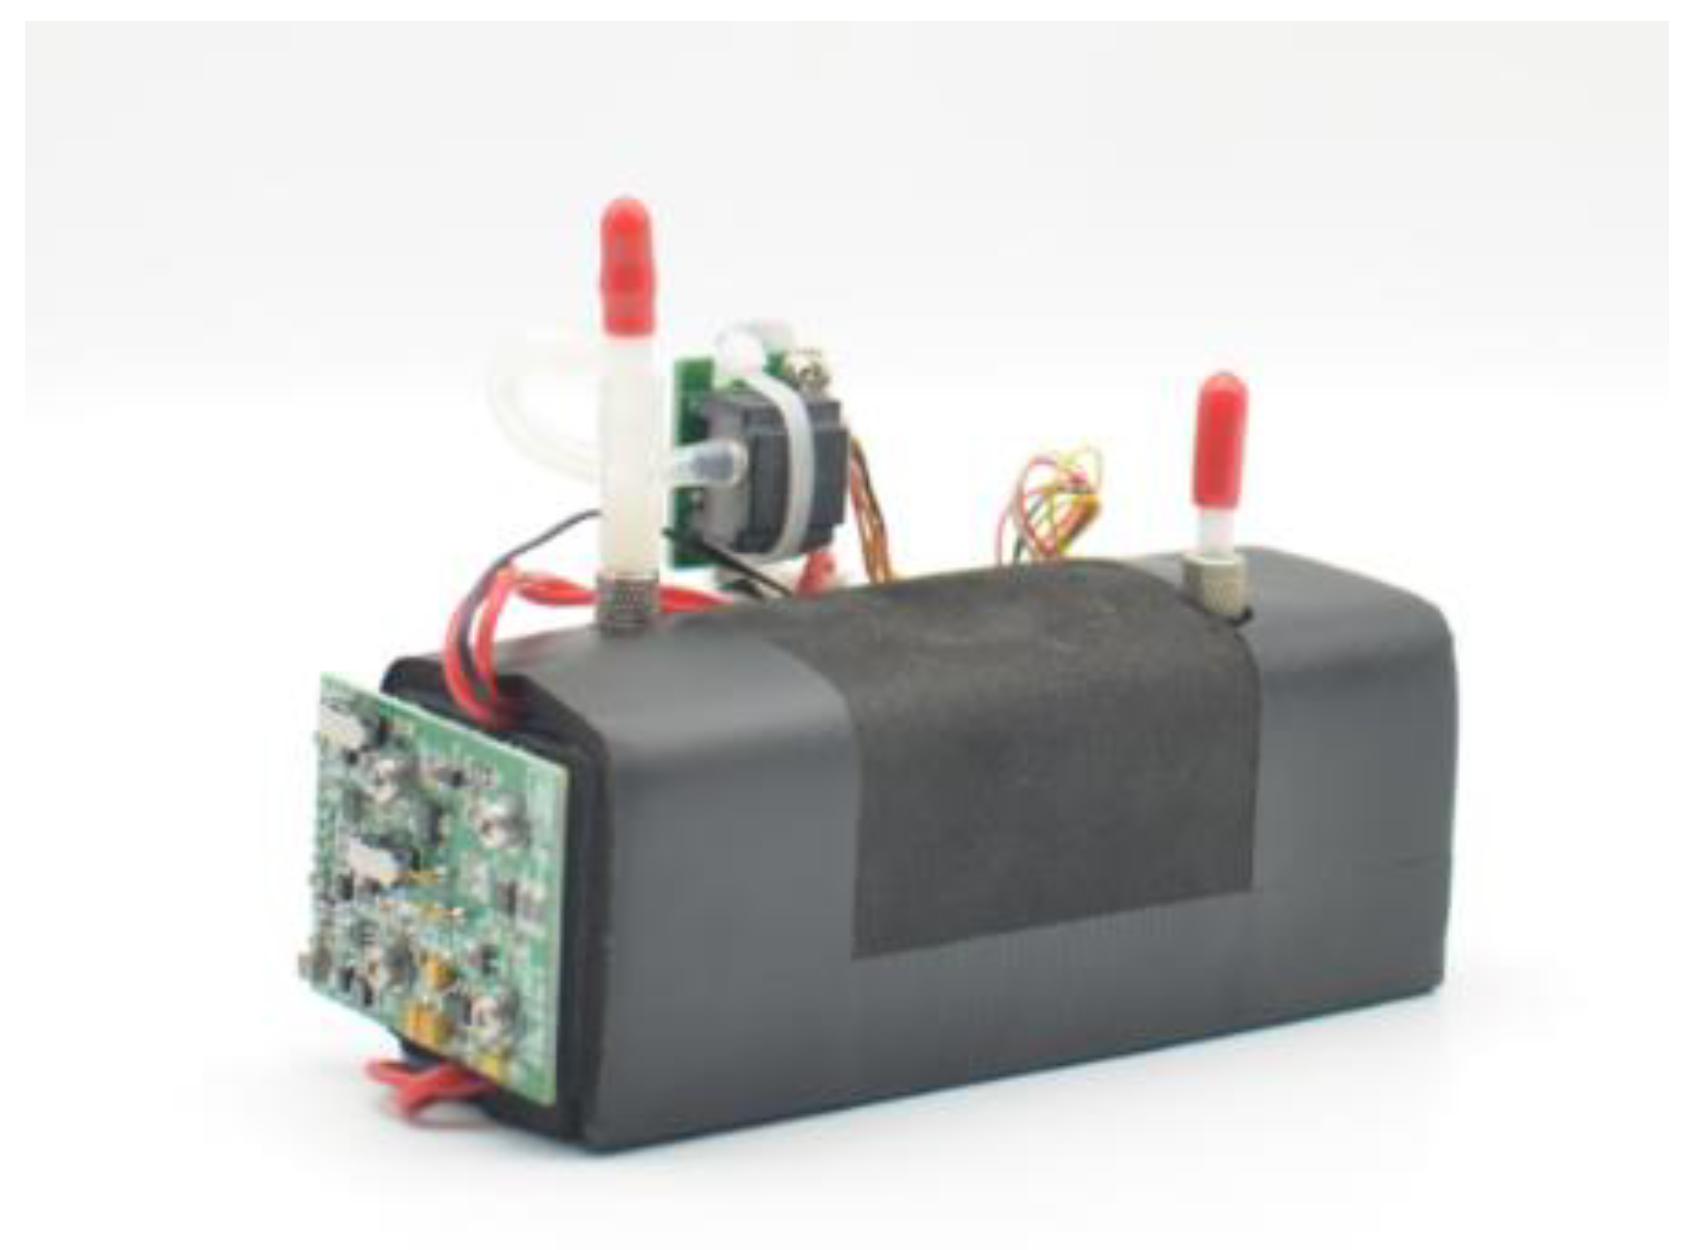
The gas detection module developed in this study mainly includes a light source driving circuit, an infrared light source, a gas chamber, a four-channel detector, a filter amplifier circuit, and an MCU. A working schematic diagram is shown in Figure 4, and the physical object is shown in Figure 5.

Figure 4.
Schematic of the gas detection module.

Figure 5.
Physical drawing of the gas detection module.
The working process of the gas detection module is as follows: the MCU generates a 10 Hz pulse modulation signal to drive the light source driving circuit, and the infrared light emitted by the light source passes through the gas chamber to reach the surface of the detector. During detection, the configured gas enters the gas chamber through the inlet hole and absorbs the infrared light energy at the corresponding wavelength, which changes the infrared energy reaching the surface of the detector, after which the gas is discharged from the outlet. The infrared light radiation energy is input into a weak electrical signal, filtered, and amplified by the signal conditioning circuit into the microcontroller, and then, through A/D converter and algorithmic processing, the signal is converted to the corresponding concentration value, and, through the communication module and the host computer, the whole detection function is completed by communicating with the upper computer through the communication module.
2.4. Device Integration and Calibration Experiments
2.4.1. Device Integration
A photograph of the greenhouse gas detection device developed in this study is shown in Figure 6, and its overall dimensions are 390 mm × 240 mm × 112 mm.
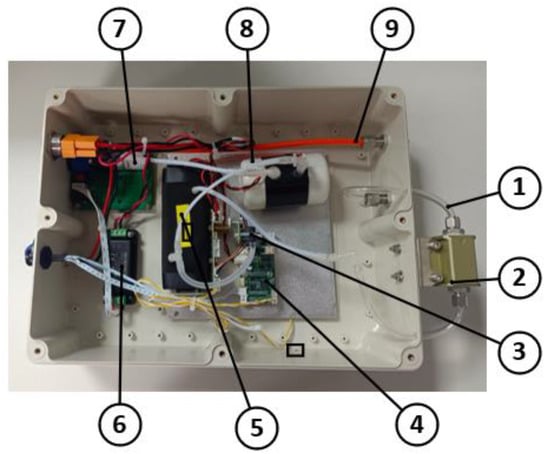
Figure 6.
Physical drawing of the greenhouse gas detection device. 1. Inlet pipe; 2. gas filter module; 3. pressure sensor; 4. communication module; 5. gas detection module; 6. pressure stabilization module; 7. gas pump; 8. gas capacity device; and 9. outlet pipe.
2.4.2. Experimental Platform Construction
To enhance the accuracy and reliability of the greenhouse gas detection device, we conducted calibration experiments under room temperature and pressure conditions. These experiments aimed to determine the error between the measured value and the standard value, and subsequently correct it. To facilitate these experiments, we established the experimental platform depicted in Figure 7.
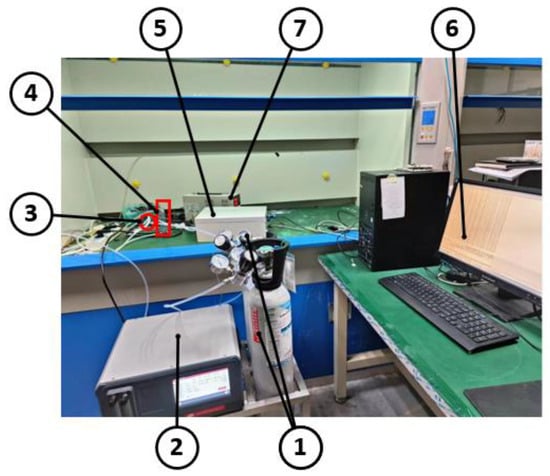
Figure 7.
Diagram of the experimental procedure. 1. standard gas cylinder; 2. gas dispenser; 3. glass tee; 4. rotor flow meter; 5. greenhouse gas detection device; 6. PC; and 7. power supply.
Before commencing the experiment, we first opened the pressure reducing valves of both the gas cylinder under test and the nitrogen cylinder. We then carefully observed whether the pressure output was normal and checked for any potential leakages or disconnections in the instrument connections to ensure the success and safety of the test. Once we confirmed the normal pressure output and proper instrument connections, we proceeded to open the knob switches of both the gas cylinder under test and the pure nitrogen cylinder. This allowed the gas to flow into the gas distribution instrument, where we set the desired gas concentration by adjusting the ratio of the test gas to nitrogen. It is important to note that the decompression valve and knob switch remained open throughout the duration of the test. The configured gas mixture then passed through the rotameter and into the gas detection device, where the communication module facilitated communication with the host computer. When all the data lines are connected, the gas detection device can start to work and communicate with the host computer, and when the host computer readings are stabilized, data collection is complete. To collect data for different concentrations of the gas under measurement, follow these steps:
- (1)
- Suspend data reading from the upper computer.
- (2)
- Save the data on the host computer, then clear the read data.
- (3)
- Turn on the upper computer to resume data reading while setting the gas distribution meter to pure nitrogen mode to purge the chamber.
- (4)
- Adjust the ratio of the gas under measurement and nitrogen concentration on the gas meter based on the desired concentration for the second measurement.
- (5)
- Repeat steps 1 and 2 once the upper computer readings have stabilized.
By following these steps, data on the concentration of various gases can be effectively collected without interruption.
2.4.3. Zero Calibration
Before zero calibration, pure nitrogen was injected into the gas chamber at a flow rate of 0.8 L/min for more than 10 min. When the gas detector terminals are stabilized, the readings are taken as the current zero calibration data.
From Equation (5), when the concentration C is 0:
2.4.4. Methane Calibration
For methane calibration, a mixture of high-concentration methane and pure nitrogen was selected. By controlling the ratio of methane to pure nitrogen, a methane mixture of 0~100 ppm was mixed, and the calibration was performed once every 2 ppm.
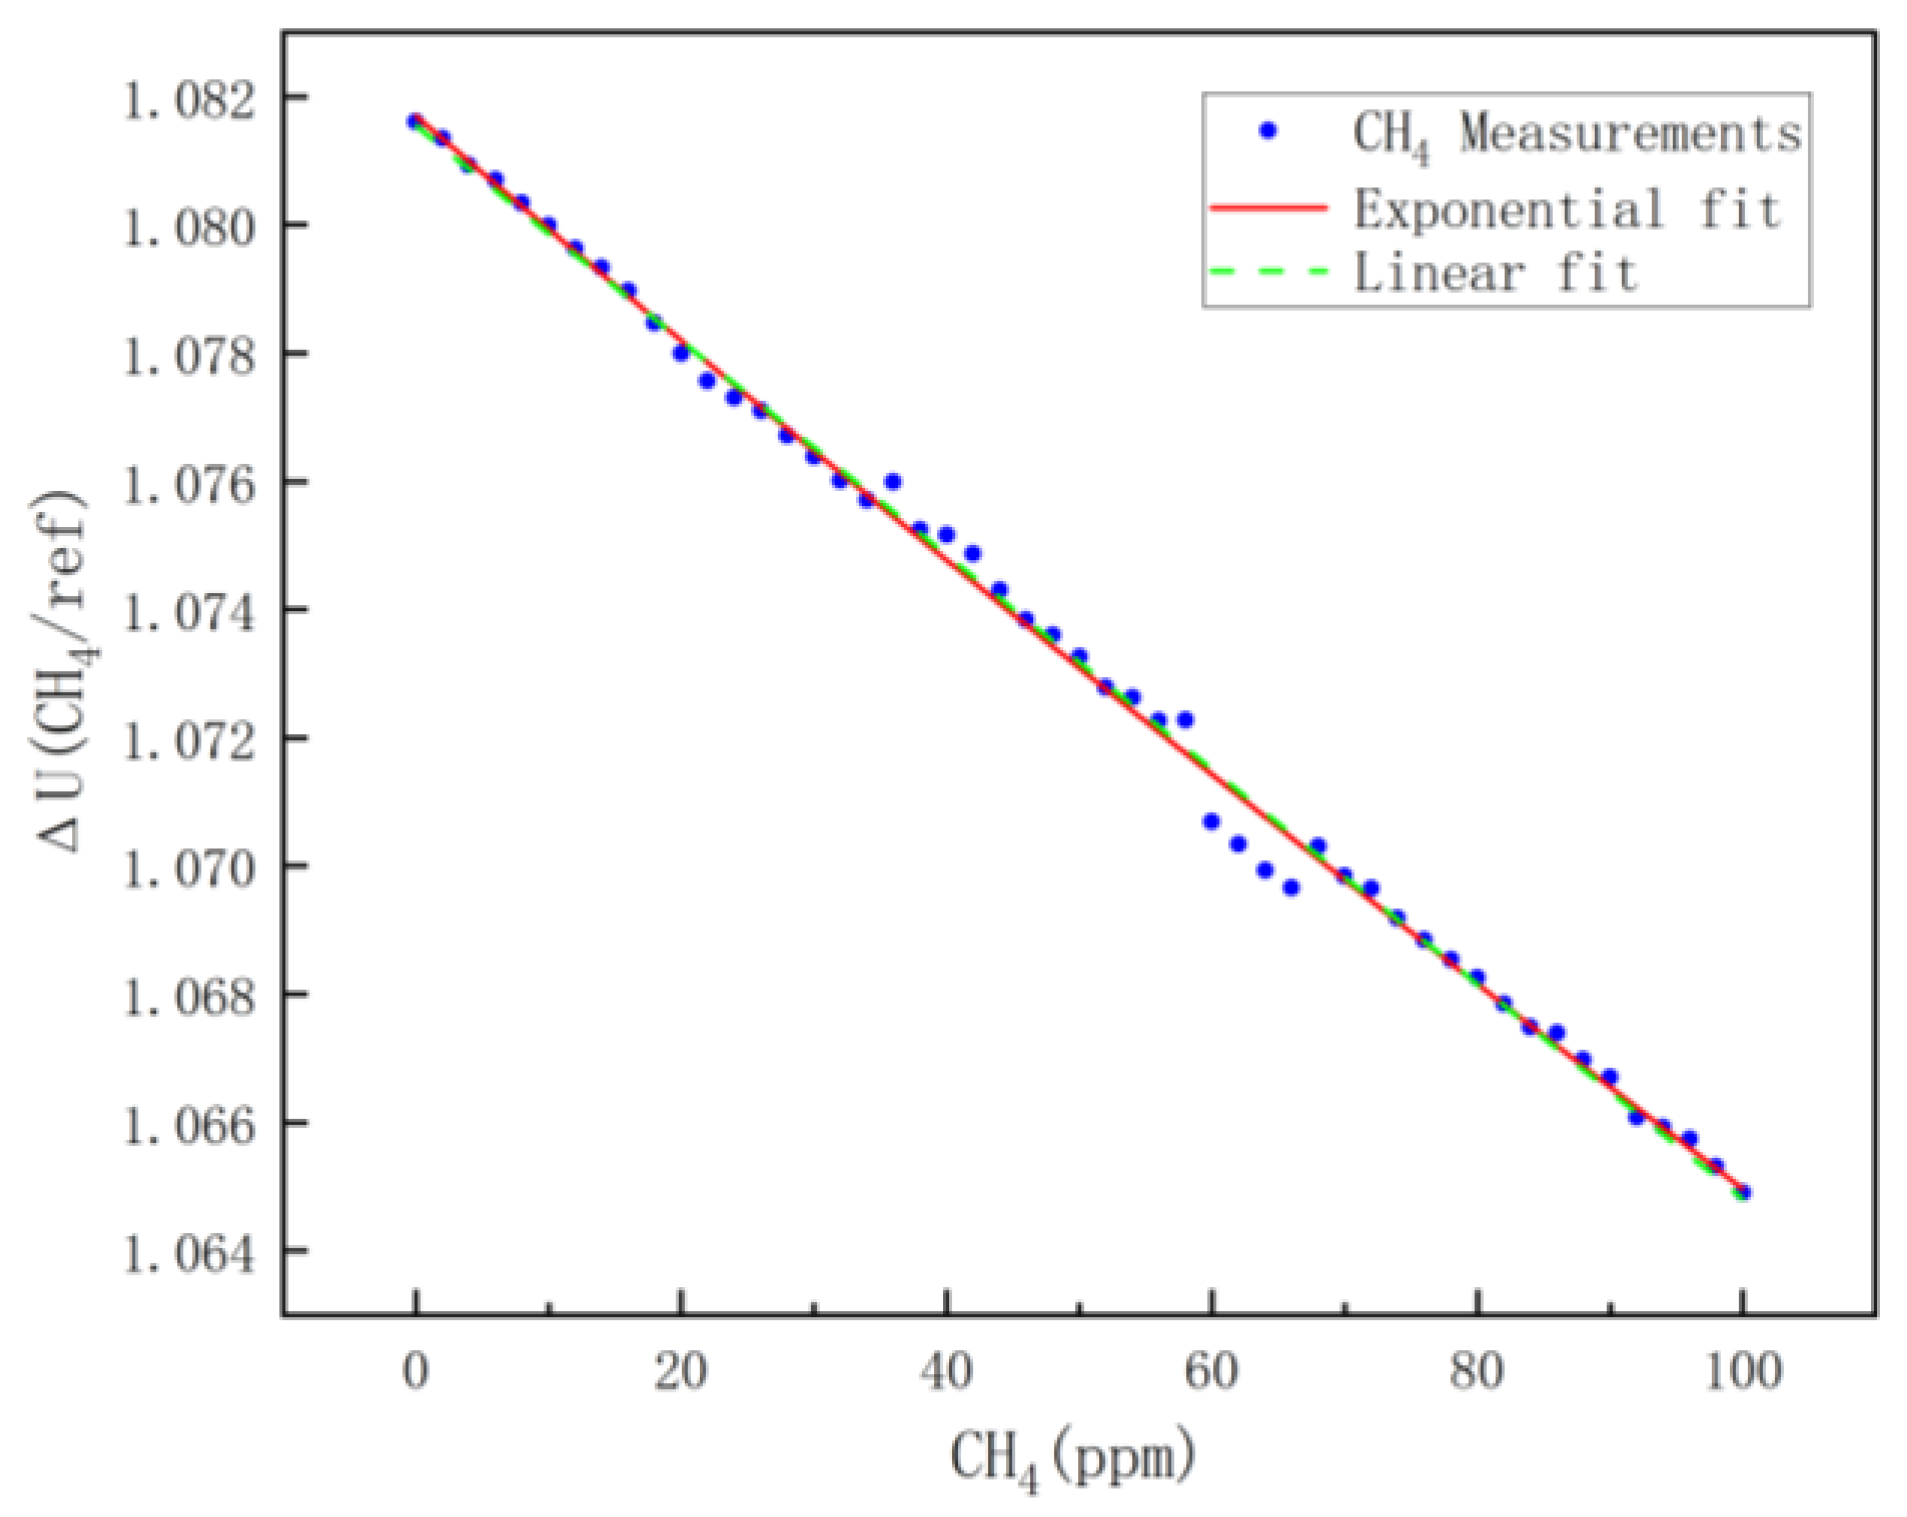
According to the previous analysis, theoretically, there is an exponential relationship between the voltage ratio of the measurement channel to the reference channel and the measured concentration; the results of the least-squares fitting are shown in the red diagram in Figure 8, and the fitting equation is shown in Equation (8). The observation reveals that the ratio of the voltage ΔU (CH4/REF) of the methane channel to that of the reference signal channel decreases with increasing methane concentration. This indicates that as the methane concentration increases, methane absorbs more infrared light radiation, which is consistent with the analysis in Section 2. This approximately linear relationship is due to the small detection range of methane, the results of the linear fit are shown as the green dashed line in Figure 8, and the fitting equation is shown in Equation (9). The R2 of the fitted model indicates that the exponential model is more accurate than the linear fit; therefore, Equation (8) is used as the concentration model for methane.
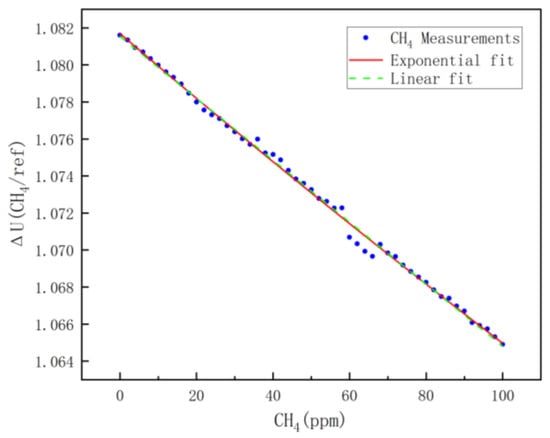
Figure 8.
CH4 fitting results.
2.4.5. Nitrous Oxide Calibration
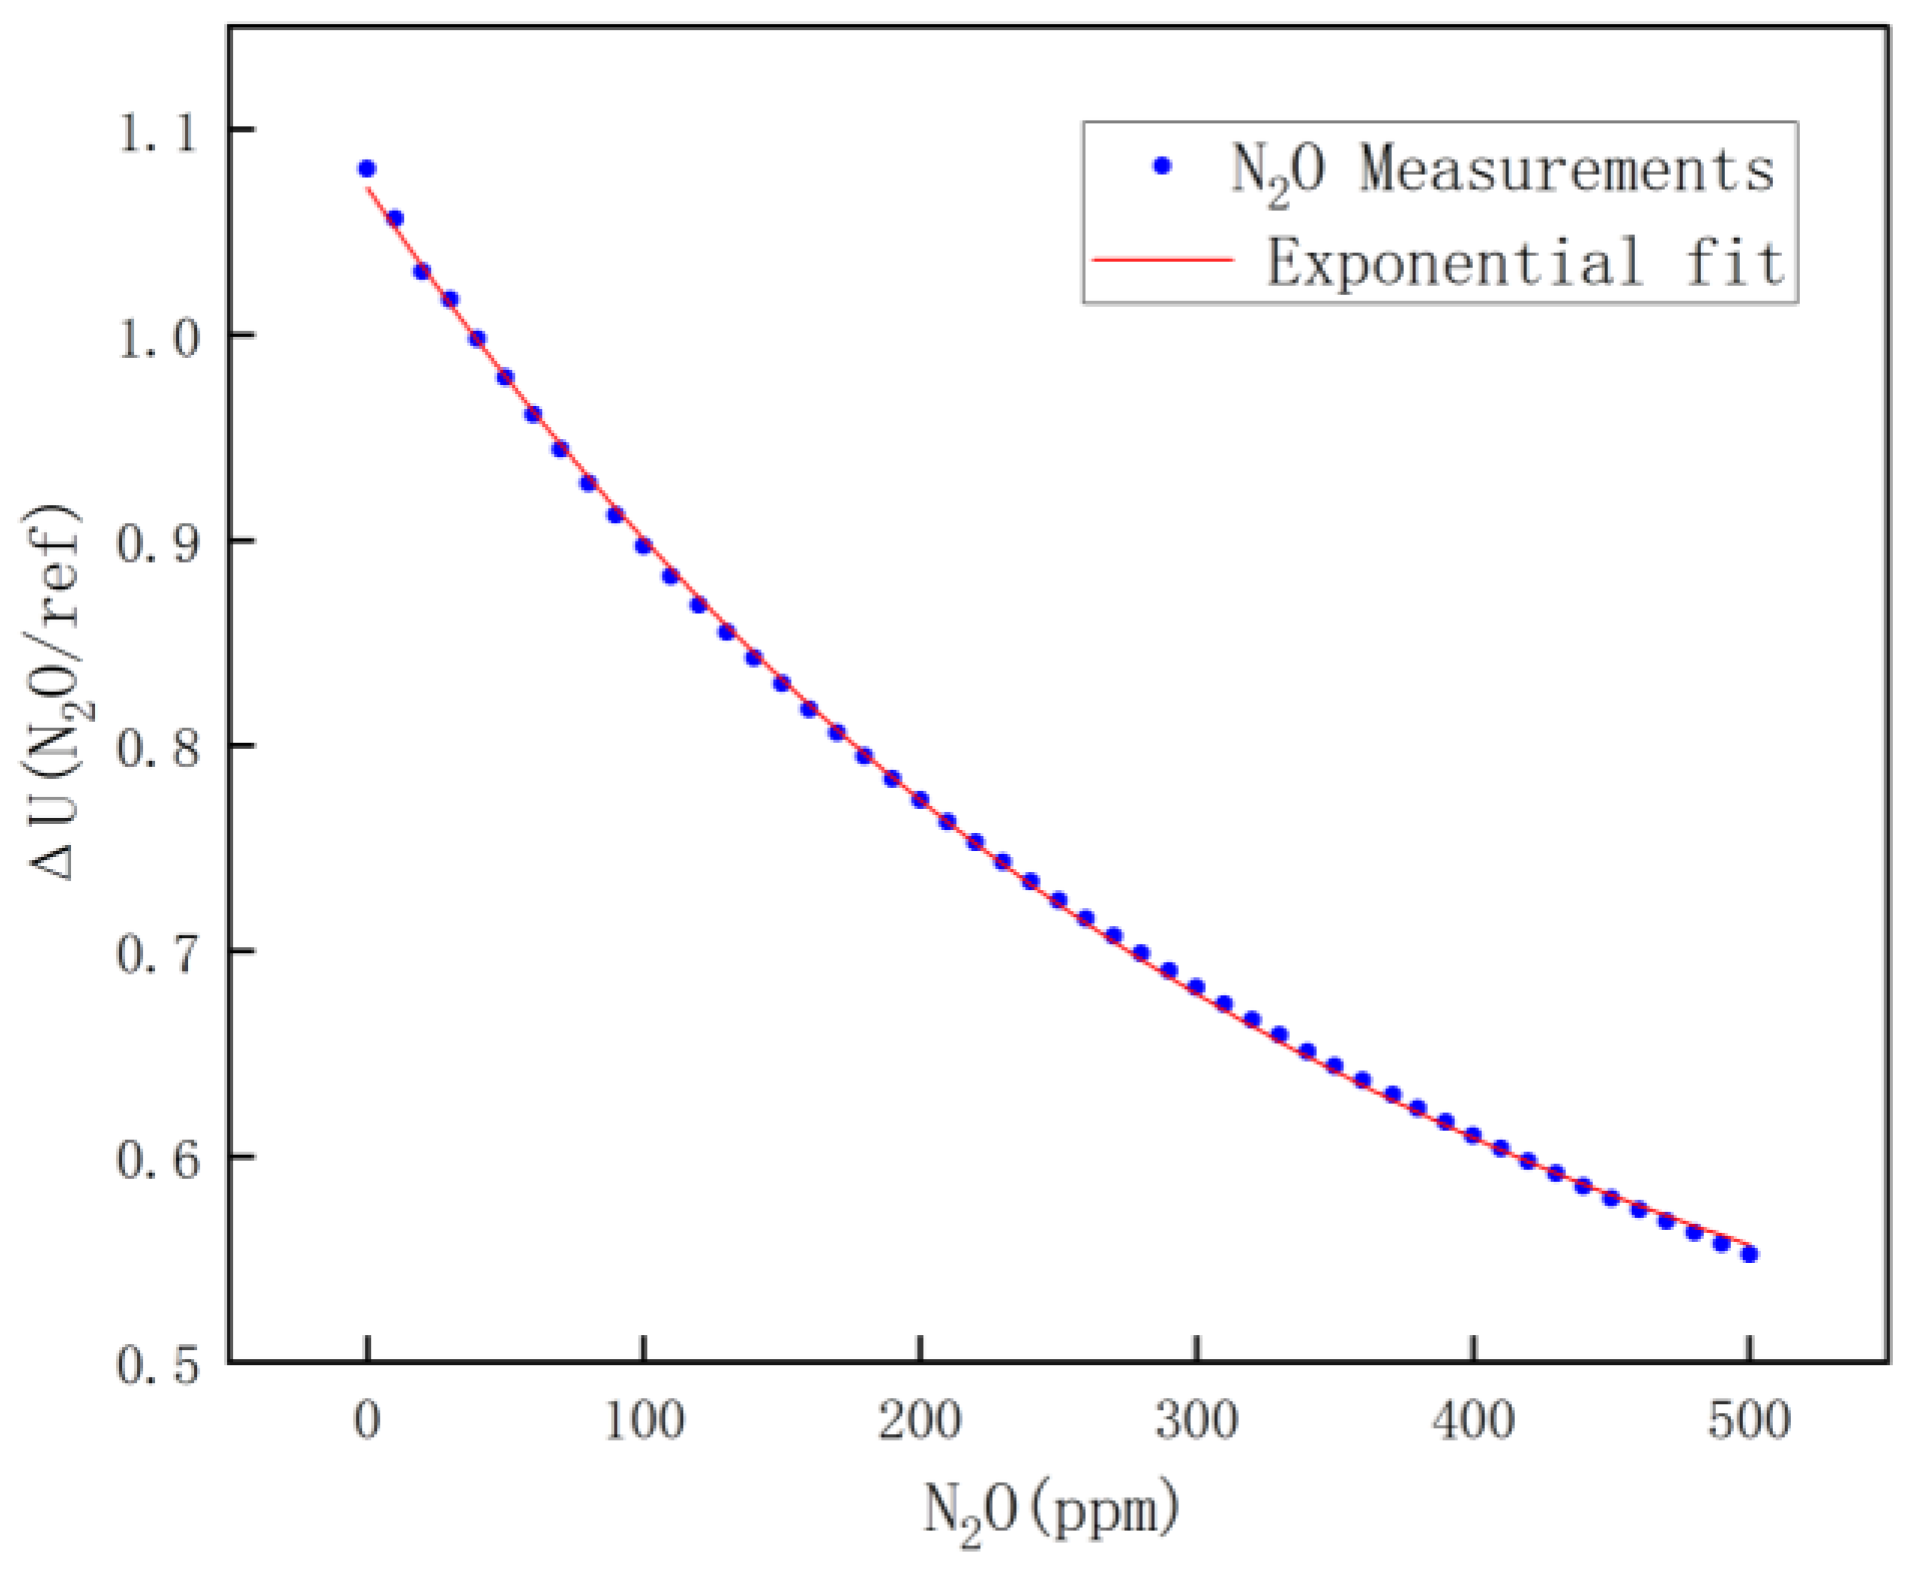
For nitrous oxide calibration, high-concentration nitrous oxide was chosen for mixing with pure nitrogen, and by controlling the ratio of nitrous oxide to pure nitrogen, a nitrous oxide mixture of 0~500 ppm was mixed. Calibration was performed once every 25 ppm, and the calibrated data are shown in Figure 9. The fitting equation is shown in Equation (10).
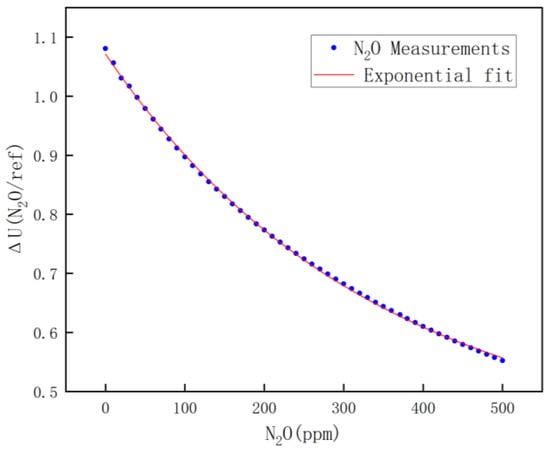
Figure 9.
N2O fitting results.
2.4.6. Carbon Dioxide Calibration
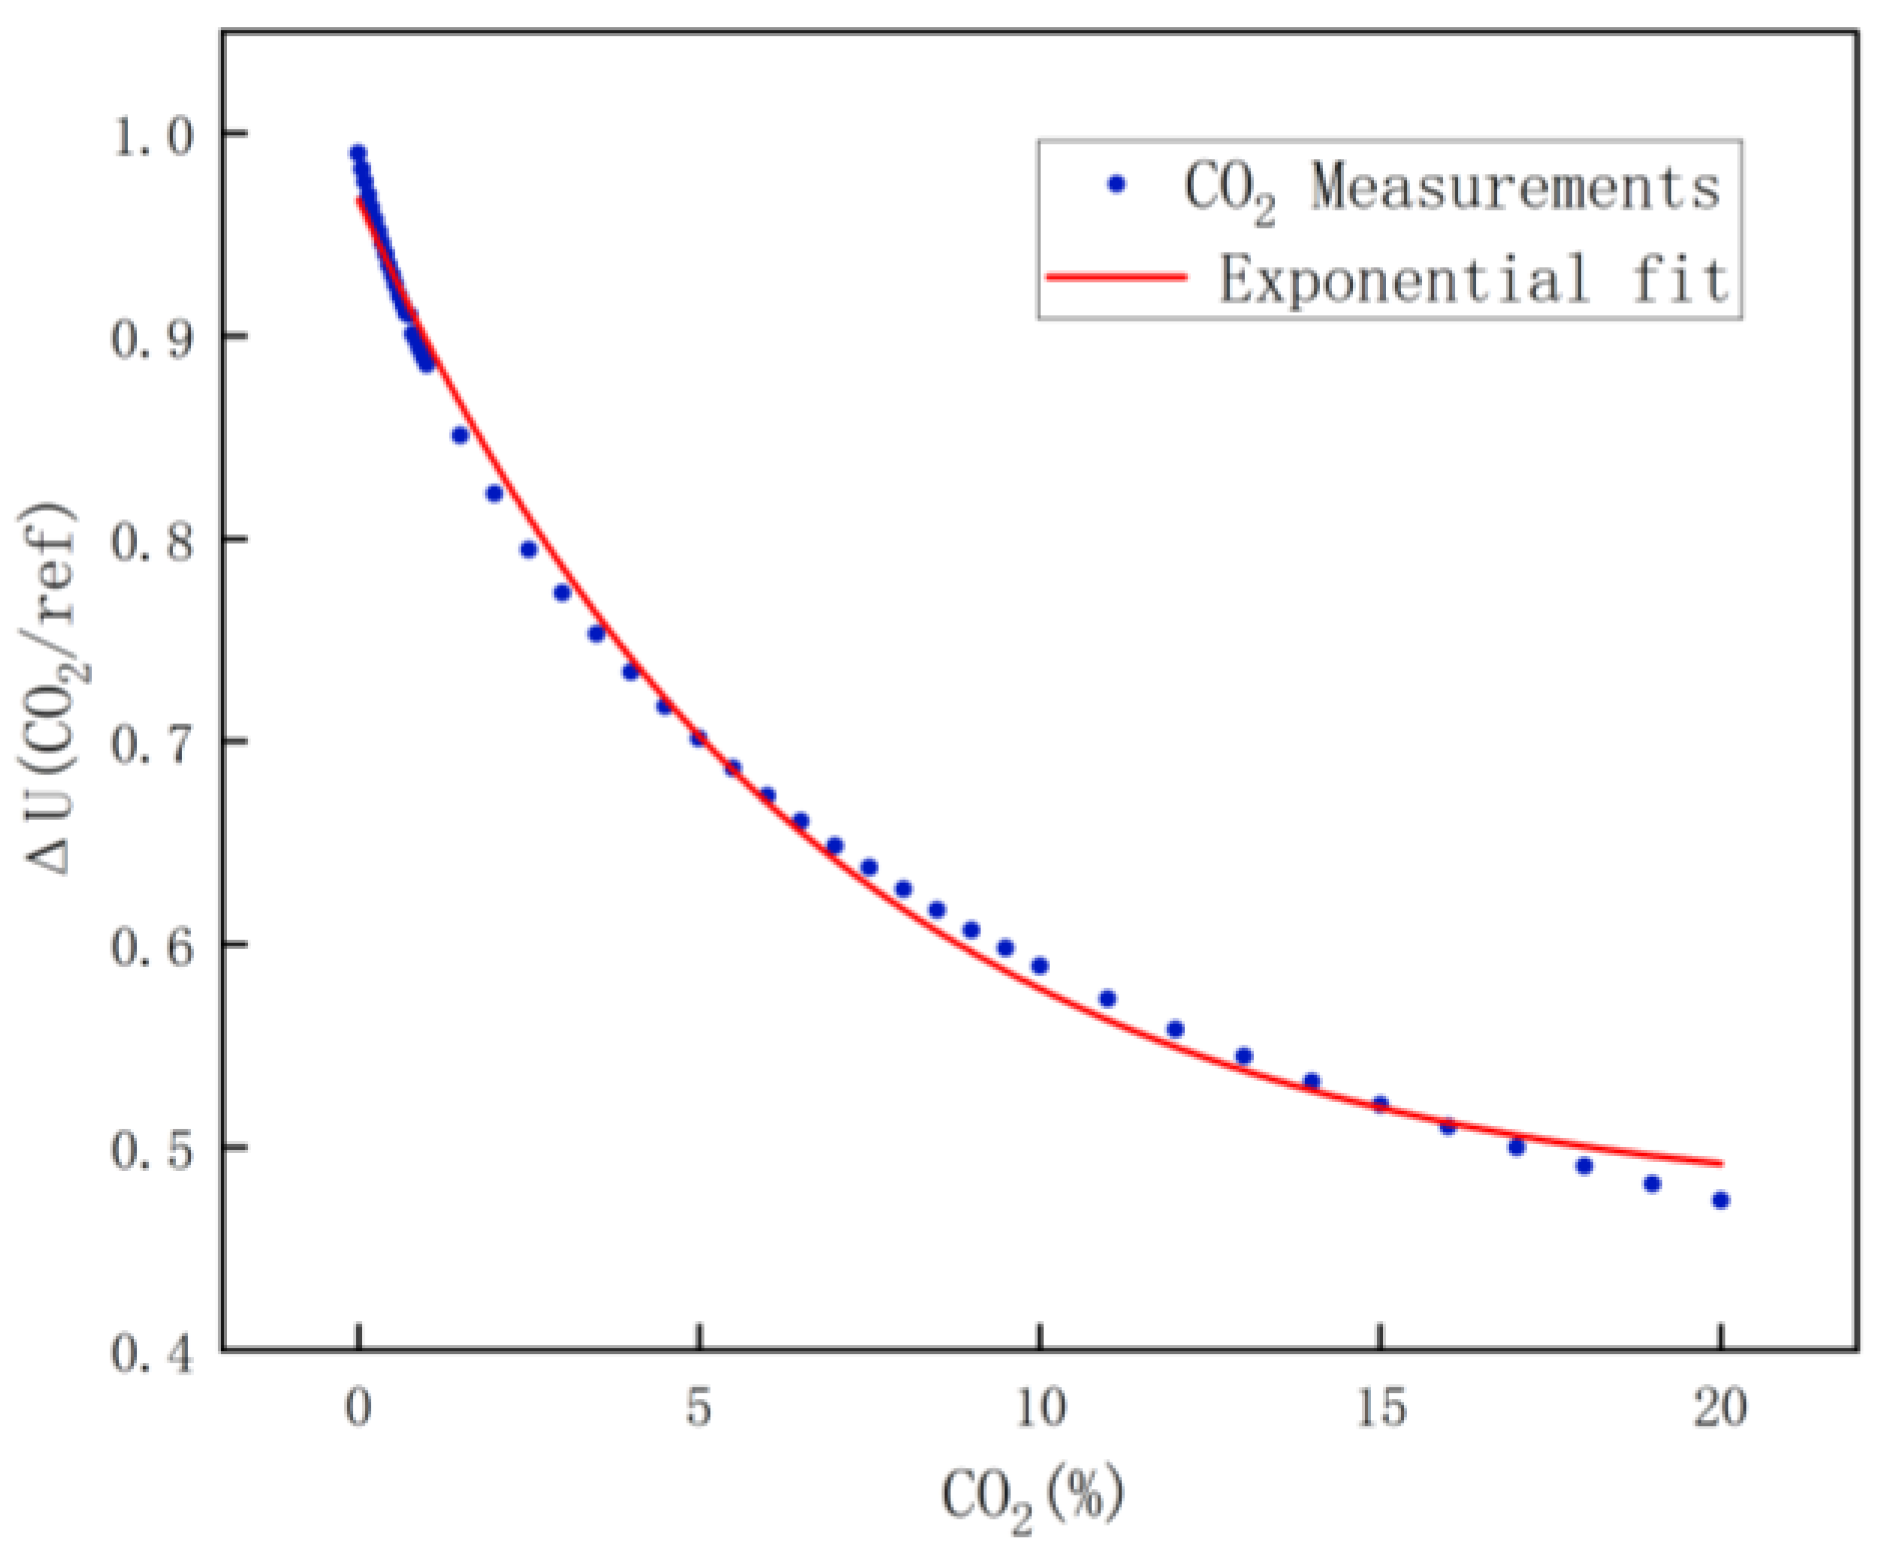
For carbon dioxide calibration, due to the large range, every 500 ppm calibration was performed in the range of 0 to 1% concentration, every 5000 ppm calibration was performed in the range of 1 to 10% concentration, and every 10,000 ppm calibration was performed in the range of 10 to 20% concentration. Similarly, the carbon dioxide calibration data are shown in Figure 10, and the fitting equation is shown in Equation (11).
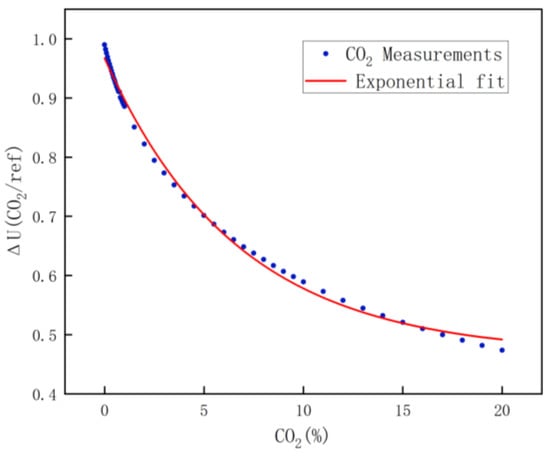
Figure 10.
CO2 fitting results.
3. Results
3.1. Zero Calibration Results
Since three distinct gases are being measured, each gas measurement channel aligns with a unique system parameter denoted as K0. Furthermore, the system functions of these three channels are represented by K0(CH4), K0(CO2), and K0(N2O), respectively. By calculating the average of the three calibrations, we obtain the system parameters for each gas measurement channel, which are presented in Table 2.
Table 2.
Parameters for zero calibration of each channel.
3.2. Results of Cross-Interference Correction
- (1)
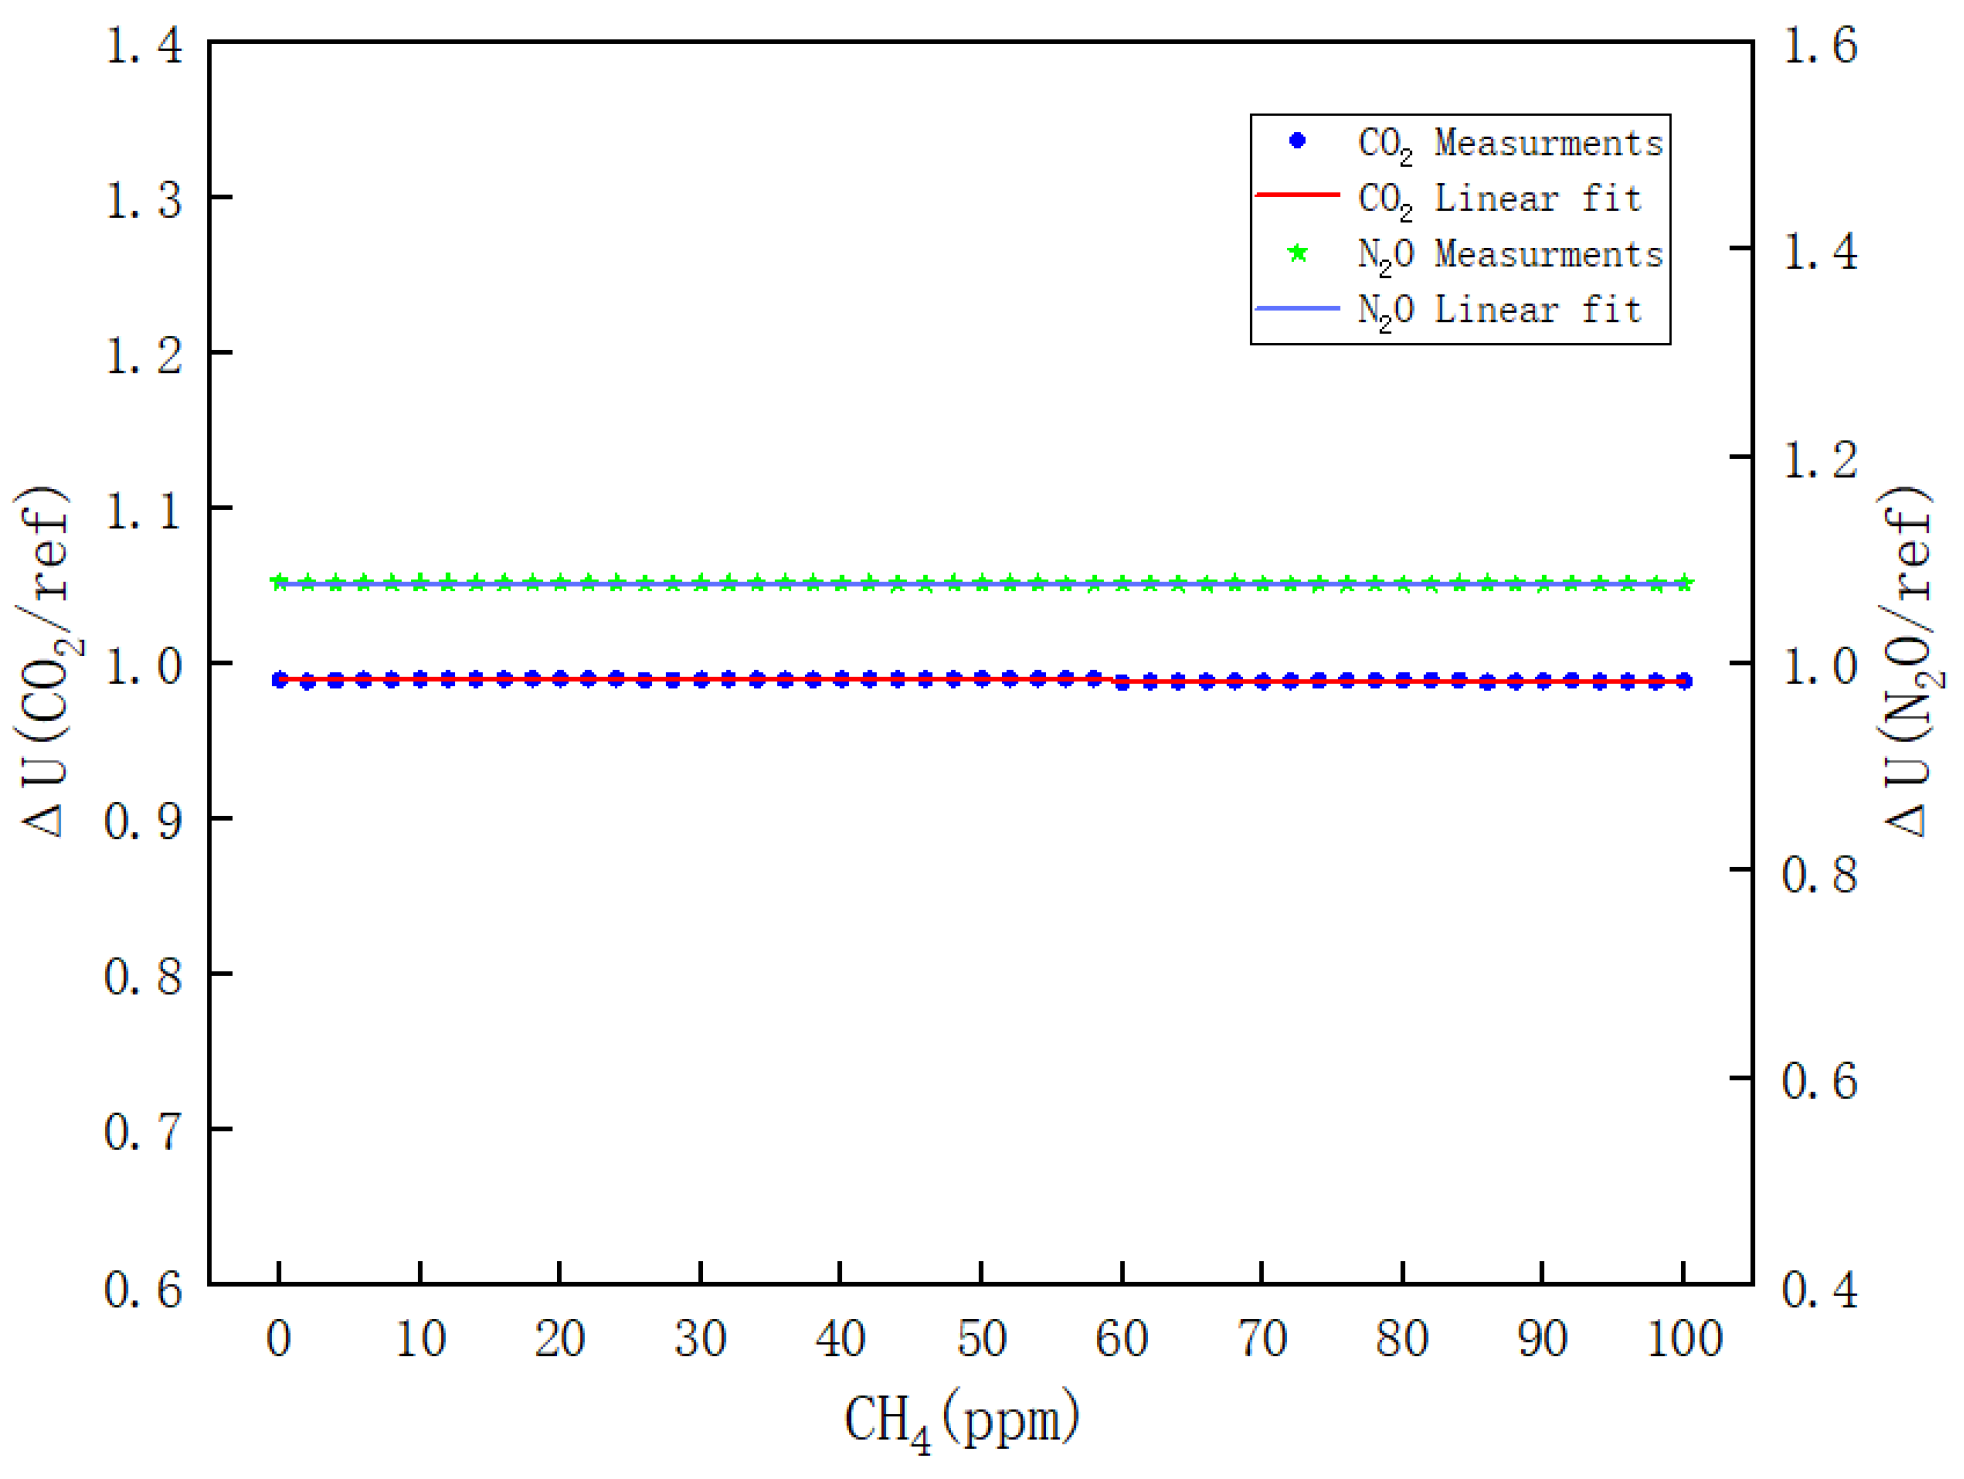
- Figure 11 illustrates the variations of ΔU(CO2/REF) and ΔU(N2O/REF) with respect to the CH4 concentration during the calibration process of CH4. The respective linear fitting equations are presented in Equations (12) and (13).
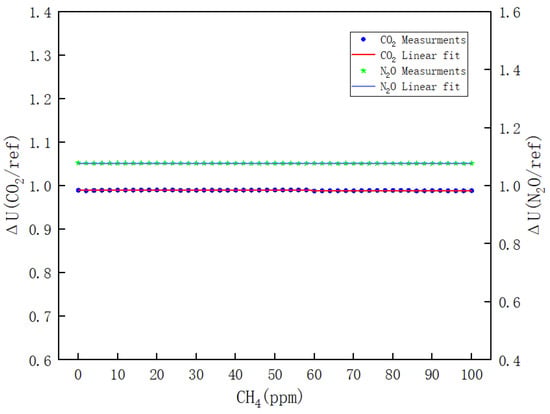 Figure 11. Results of the effect of CH4 on CO2 and N2O channels.
- (2)
- Figure 12 clearly illustrates the variations in ΔU(CH4/REF) and ΔU(CO2/REF) with respect to the N2O concentration during the calibration of N2O. The respective linear fitting equations are provided in Equations (14) and (15).
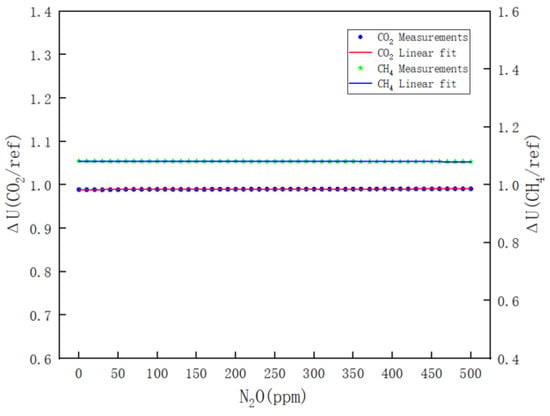 Figure 12. Results of the effect of N2O on CO2 and CH4 channels.
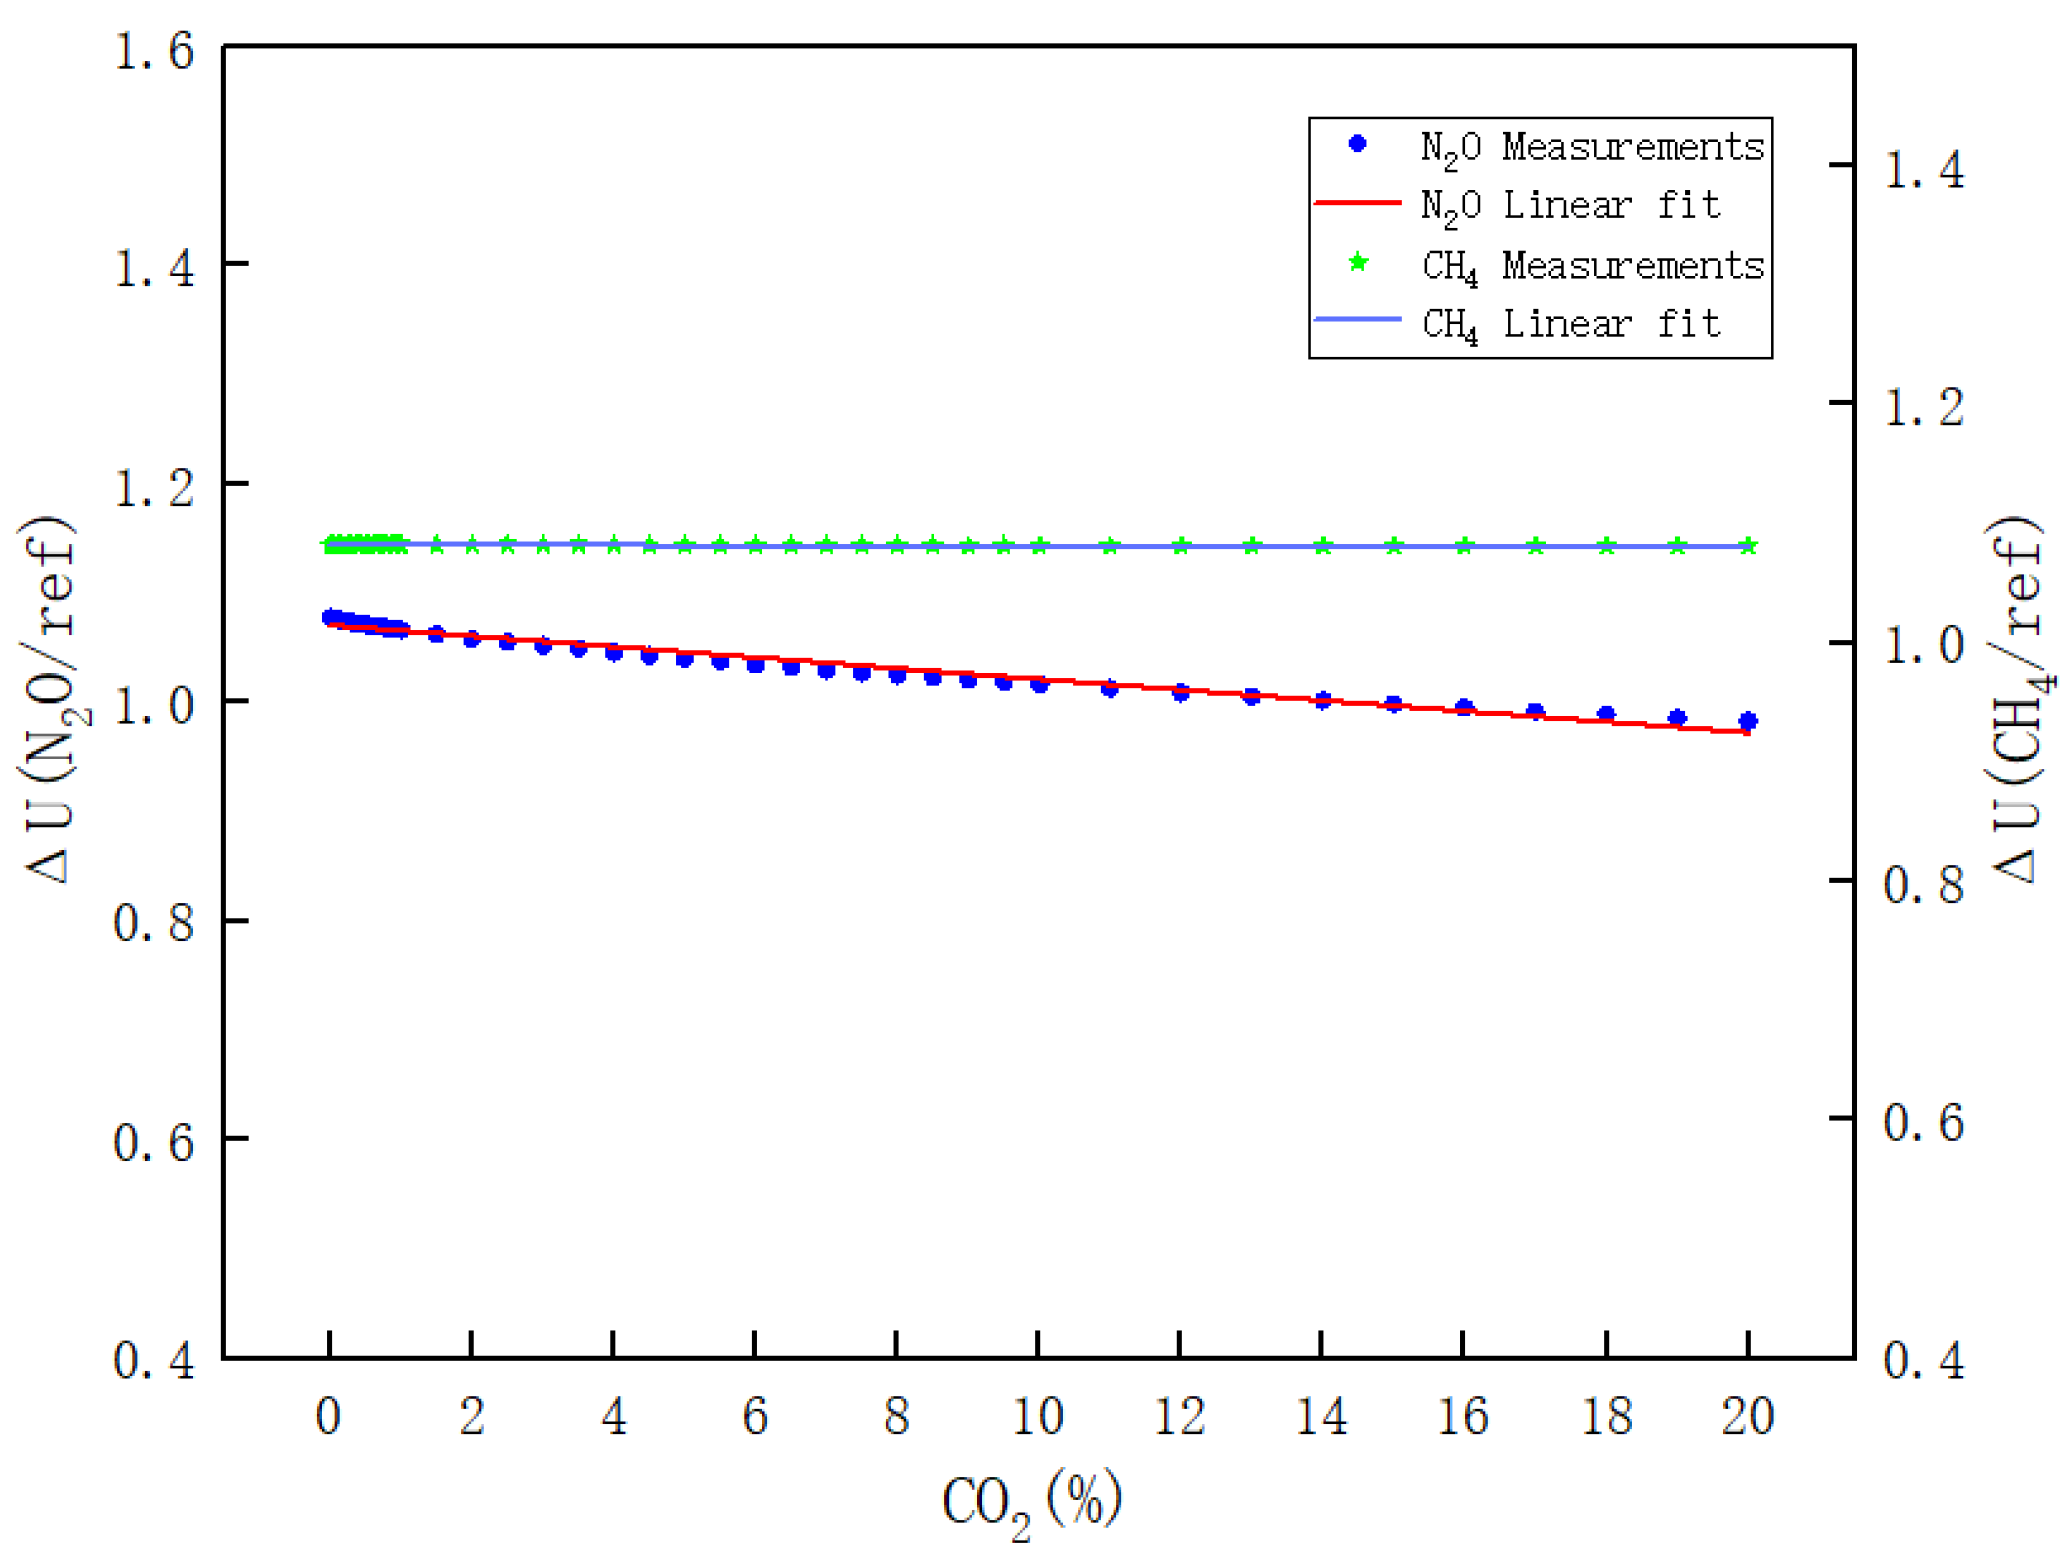
- (3)
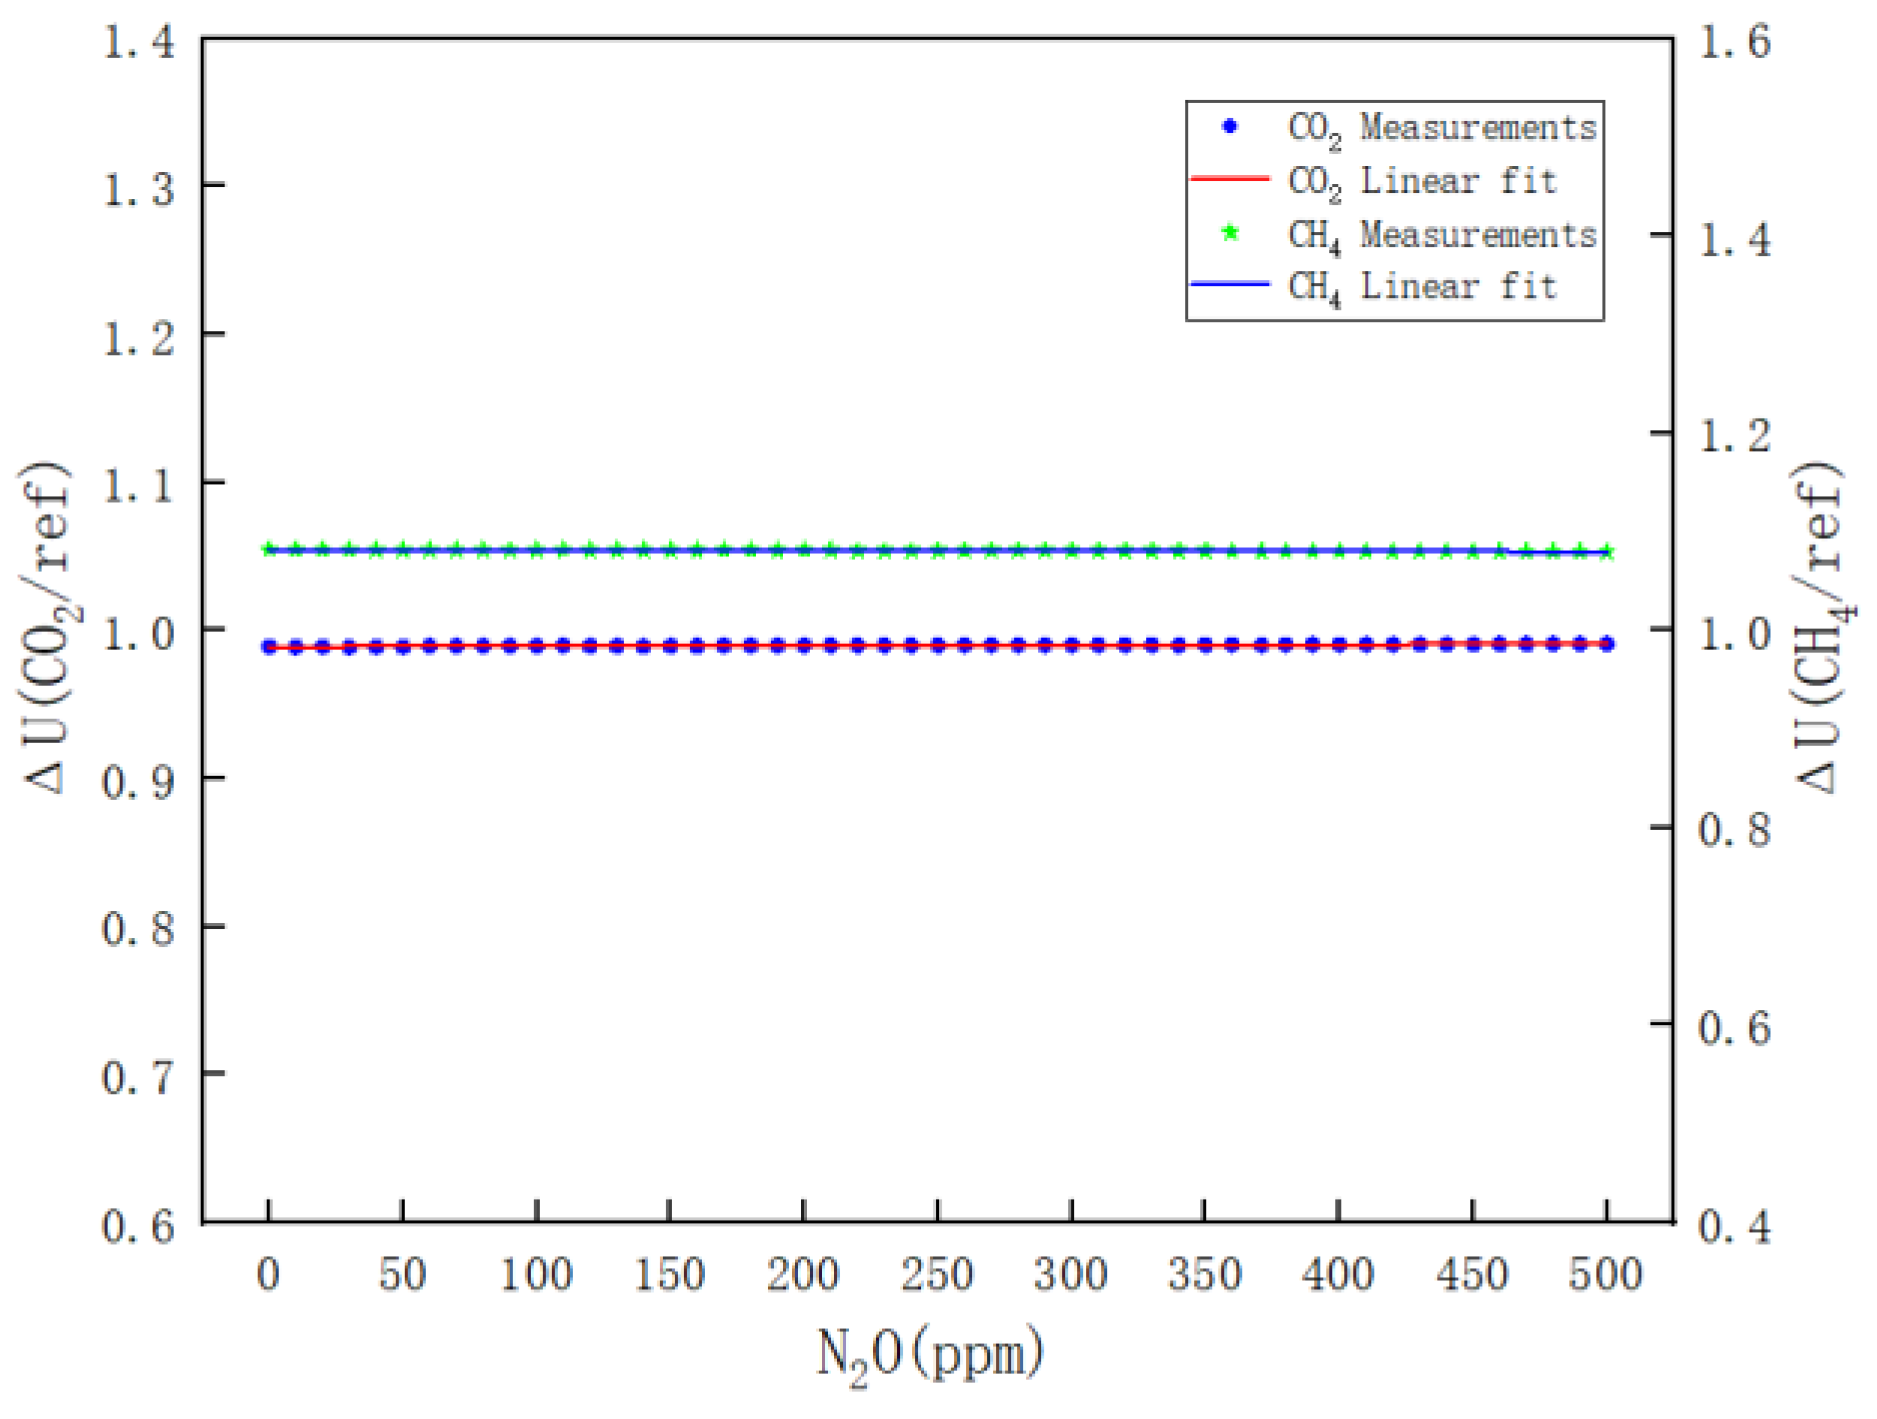
- Figure 13 clearly illustrates the variations in ΔU(CH4/REF) and ΔU(N2O/REF) with respect to the CO2 concentration during the calibration of CO2. The respective linear fitting equations are provided in Equations (16) and (17).
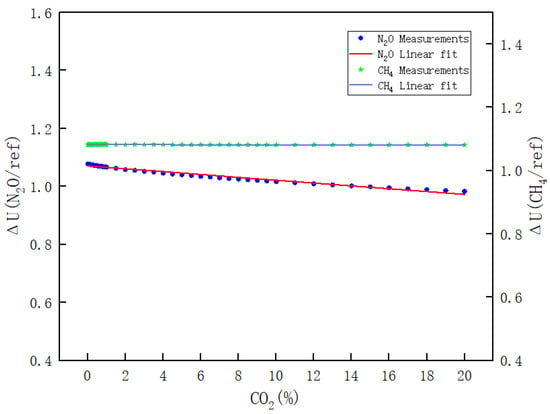 Figure 13. Results of the effect of CO2 on N2O and CH4 channels.
In a multi-gas analysis system, cross-sensitivity resistance plays a crucial role. Consequently, determining the cross-interference coefficient for each channel is imperative. Although the device simultaneously detects three gases with a narrow filter bandwidth, cross-interference among the gas channels is inevitable. To address this, the least-squares method [32] was utilized to develop an interference model between the three gases. Subsequently, the concentration models for the CH4, CO2, and N2O channels were computed using Equation (18), Equation (19), and Equation (20), respectively.
where C(gas) is the measured concentration, Cgas is the real concentration, and Kgas1, gas2 is the coefficient of influence of gas2 on the gas1 channel.
According to the previous analysis, the influence coefficients of each channel on each other can be obtained as shown in Equation (21).
As shown in Figure 11, Figure 12 and Figure 13, the values of the other two channels change as the calibration gas concentration changes, indicating that the gas channels do interfere with each other, and the interference coefficients are shown in Equation (21), where is 2 to 4 orders of magnitude lower relative to the interference in the other channels and it can be considered that .
Thus, when the concentration of methane ranges from 0 to 100 ppm, the concentration of nitrous oxide ranges from 0 to 500 ppm, and the concentration of carbon dioxide ranges from 0 to 20%. The interference models between the three gases can be derived from Equation (22), Equation (23), and Equation (24), respectively.
3.3. Measurement Results of Greenhouse Gas Detection Device Parameters
3.3.1. Relative Error Measurement Results
To further verify the accuracy of the model calibration, CH4 concentrations of 20 ppm, 40 ppm, and 60 ppm; CO2 concentrations of 5000 ppm, 1000 ppm, and 20,000 ppm; and N2O concentrations of 80 ppm, 200 ppm, and 300 ppm were detected. The measured data are shown in Table 3 and the range bias of the measured data was calculated by Equation (25).
where is the measured concentration of the designed detection system, is the actual concentration of the measured gas, and is the range of the detected gas.
Table 3.
Relative error test results.
From Table 3, it can be seen that the deviation of CH4 is between −0.34% and 0.77% when the concentration of CH4 is between 20 and 60 ppm, the deviation of CO2 is between −0.4% and 0.26% when the concentration of CO2 is between 5000 and 20,000, and the deviation of N2O is between −0.81% and −0.32% when the concentration of N2O is between 80 and 300 ppm. The full-scale deviation of the device for CH4, CO2, and N2O detection is lower than 0.77%, 0.4%, and 0.81%, respectively.
3.3.2. Repeatability Measurement Results
To further verify the repeatability of the detection device, three groups of experiments were conducted to measure the three gases CH4, CO2, and N2O. The first group of concentrations was set at 20 ppm, 10,000 ppm, and 160 ppm; the second group of concentrations was set at 50 ppm, 20,000 ppm, and 100 ppm; and the third group of concentrations was set at 70 ppm, 5000 ppm, and 60 ppm, where each group was measured 10 times continuously. The experimental results are shown in Table 4, Table 5 and Table 6. The standard deviation σ and relative standard deviation Cv were calculated by Equation (26) and Equation (27), respectively.
where is the measured concentration and is the average of the measured concentrations.
Table 4.
Results of repeatability test 1 for greenhouse gas detection device.
Table 5.
Results of repeatability test 2 for greenhouse gas detection device.
Table 6.
Results of repeatability test 3 for greenhouse gas detection device.
Table 4, Table 5 and Table 6 show that the mutual interference varies with the gas concentration, and the relative standard deviation of CH4 is in the range of 0.01%~0.39%; the relative standard deviation of CO2 is in the range of 0.01%~0.03%; and the relative standard deviation of N2O is in the range of 0.01%~0.03%. The repeatability of this device for CH4, CO2, and N2O detection was lower than 0.39%, 0.03%, and 0.03%, respectively.
3.3.3. Stability Measurements
To further test the stability of the device, a long-term stability test was carried out. First, the gas chamber was cleaned with pure nitrogen for 10 min, after which the concentrations of CH4, CO2, and N2O were set to 50, 20,000, and 100 ppm, respectively. The data were collected every 2 h, 10 sample points were collected consecutively, the sampling results are shown in Table 7, and the stability δs of the detecting device was calculated by Equation (28).
where Cmax denotes the maximum drift value, Cr denotes the actual concentration measured, and R denotes the measurement range. Table 7 shows that the stability of the system is between −0.61% and 0.26%. This shows that the device has good stability.
Table 7.
Stability test.
3.3.4. Response Time Measurement Results
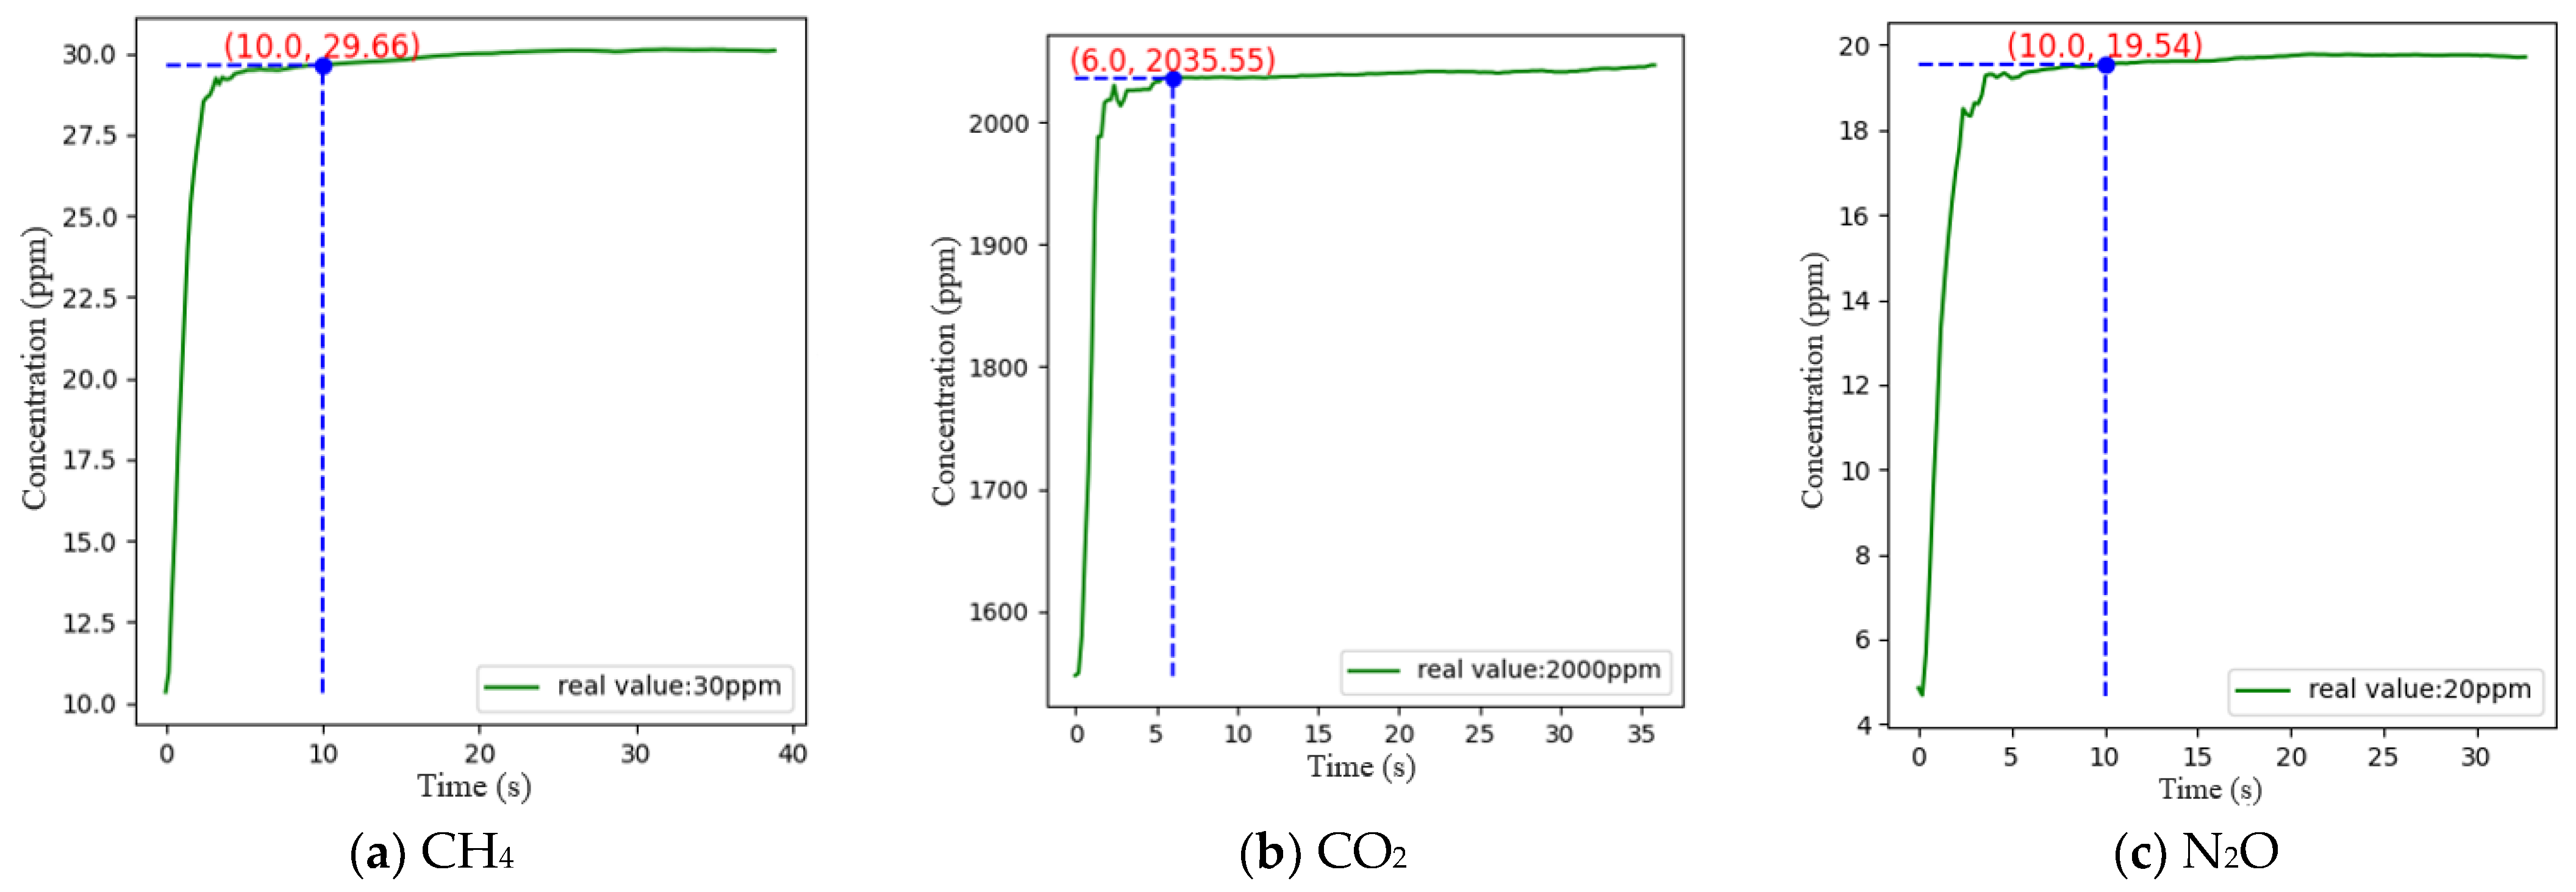
The response time of a sensor is generally defined as the time it takes for the gas to reach 90% of its true value from the time it enters the sensor, i.e., T90. In this experiment, the concentrations of CO2, CH4, and N2O were chosen to be 2000 ppm, 30 ppm, and 20 ppm, respectively, for the test. During the experiment, nitrogen was introduced to clear the air chamber for 10 min. When the detector readings stabilized, the gas to be measured was introduced, and when the detector readings stabilized again, the response time was recorded for comparison. The measurements were repeated three times and the results of the one with the largest response time are shown in Figure 14, which revealed that CH4, CO2, and N2O basically reached stable states at approximately 10, 6, and 10 s, respectively, and the relative errors of CH4, CO2, and N2O at these times were −1.13%, 1.78%, and −2.3%, respectively.
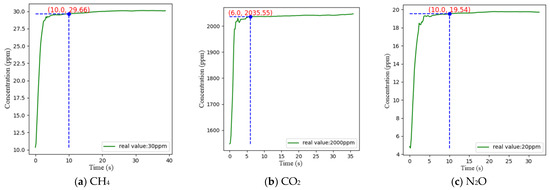
Figure 14.
Response time test results.
3.4. Results of Greenhouse Gas Testing at Dairy Farm
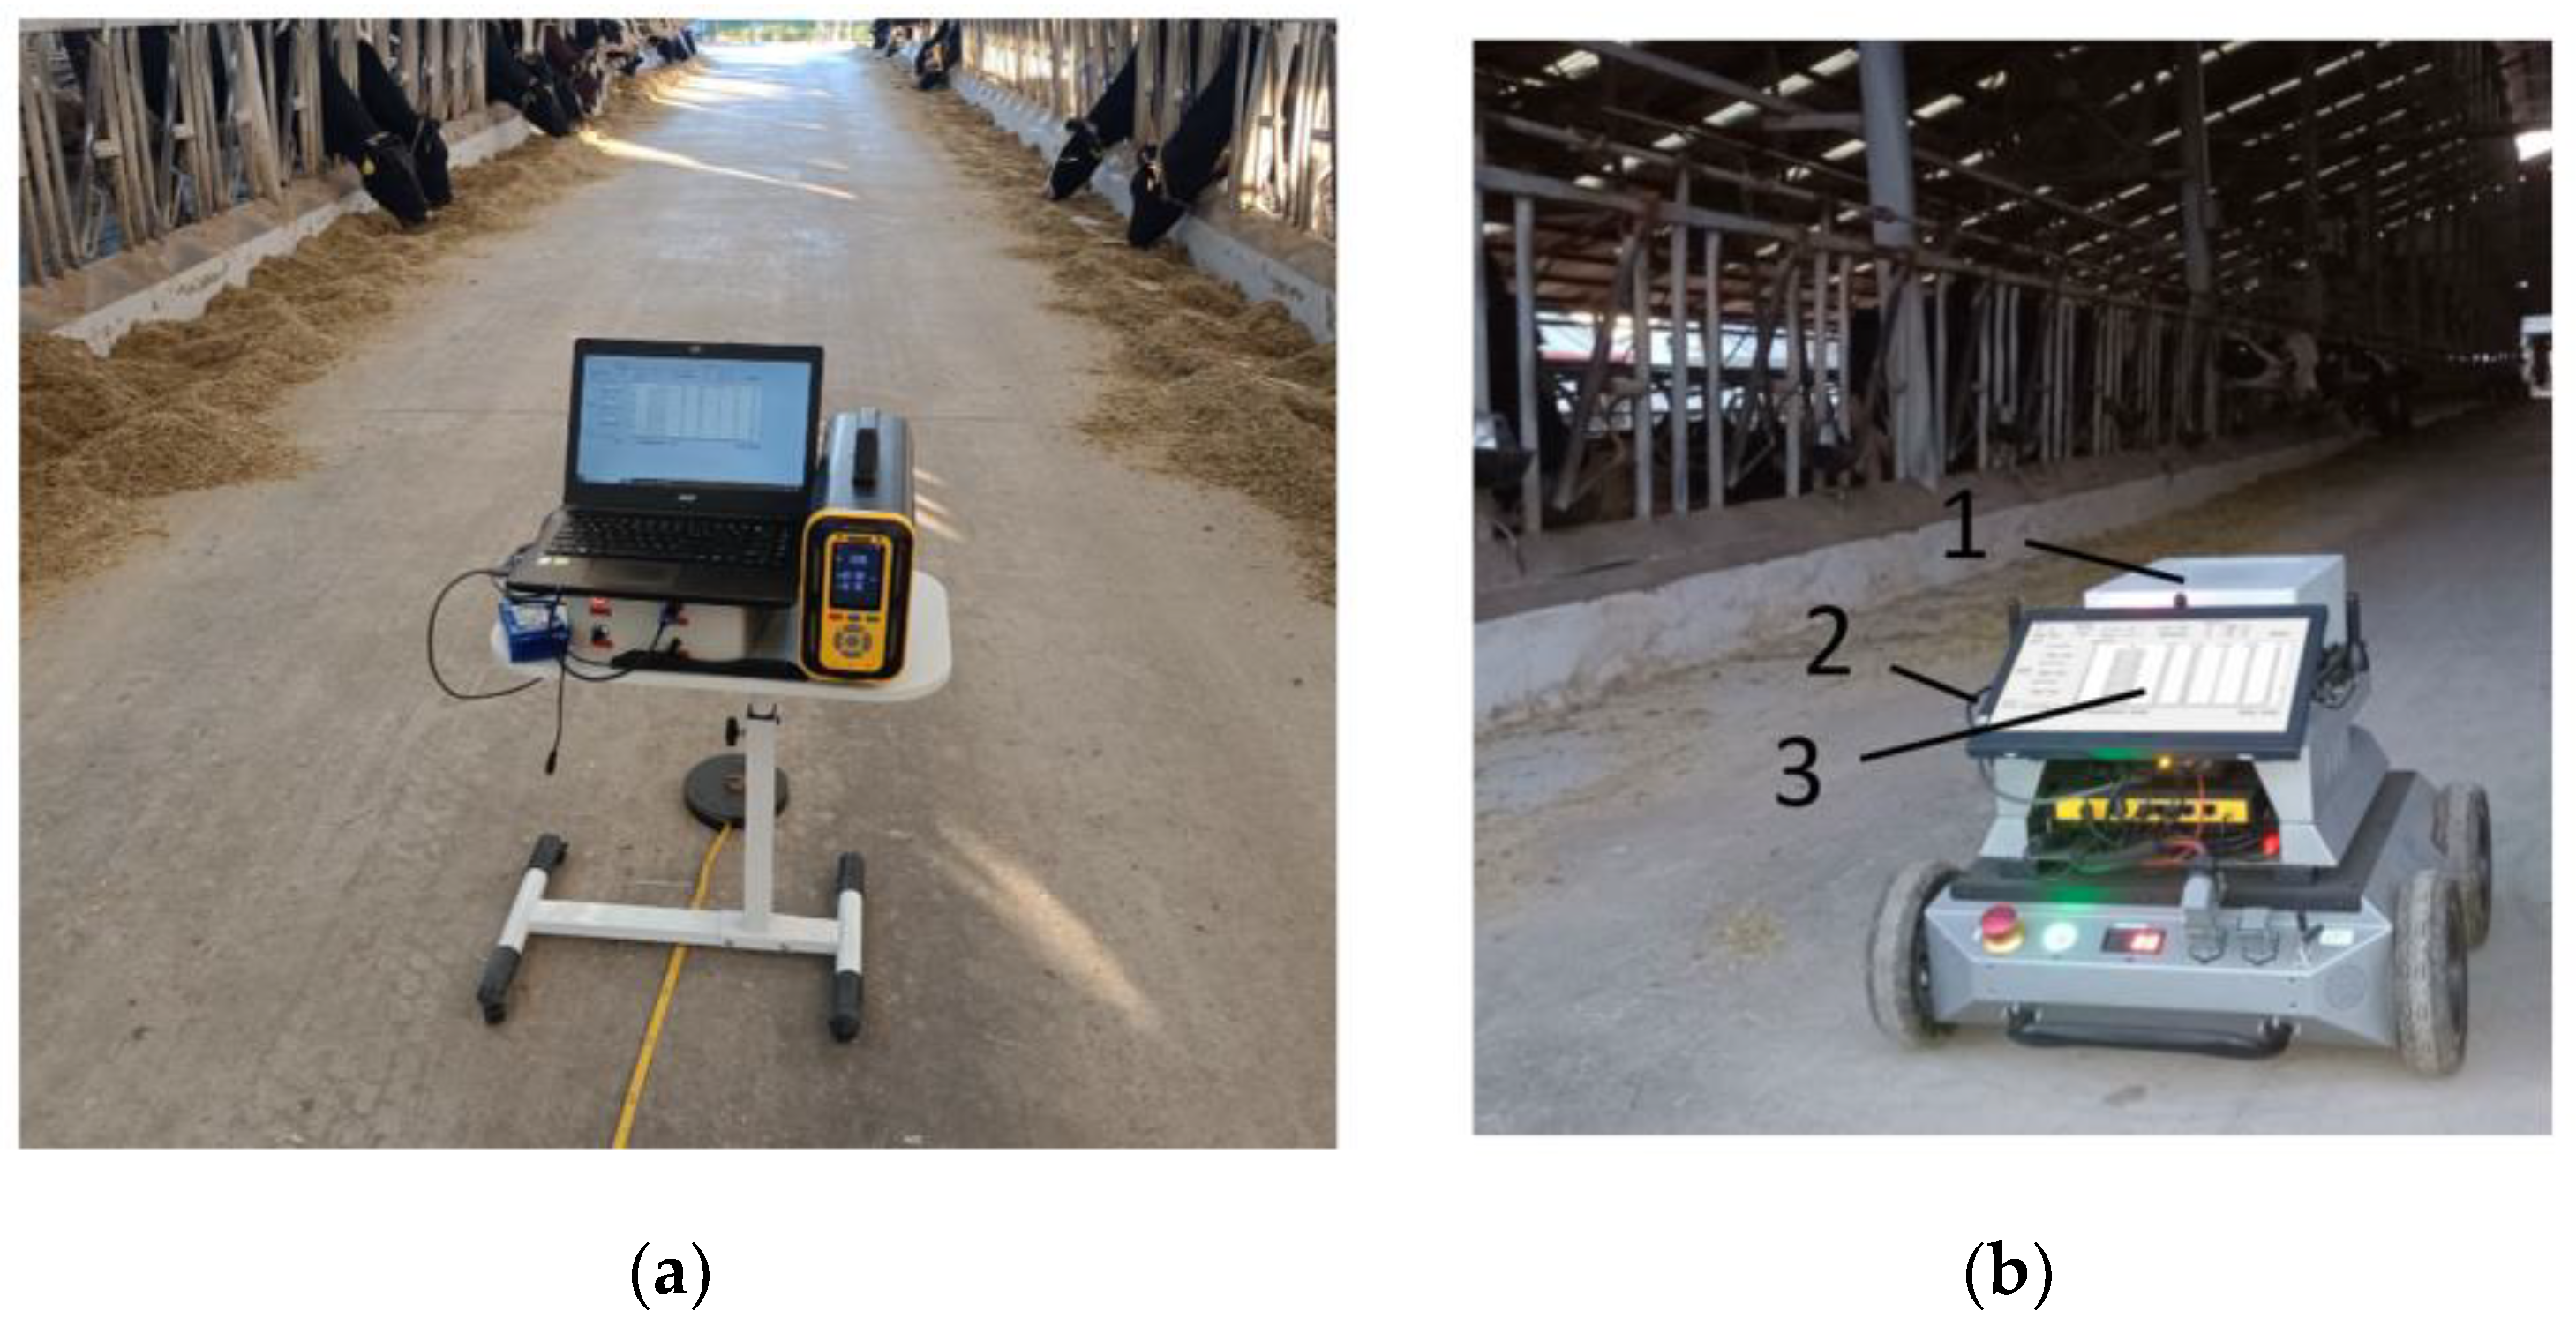
To further verify the reliability and accuracy of the GHG device used in the dairy farm, a high-precision, high-stability PTM600 portable gas analyzer produced by Eranntex (Shenzhen, China) was obtained and used in this study to conduct 10 fixed-point inspections of the corridor inside the cowshed in Luoyang Shengsheng Farm, as shown in Figure 15a. The PTM600 is a high-precision gas analyzer, designed based on the TDLAS principle, with an accuracy allowance of less than 1%, an uncertainty of less than 2%, and an allowable error of 2%. It has a built-in high humidity filter, which is able to operate at a relative humidity of less than 95% RH, the standard gases utilized correspond to 20%, 50%, and 80% of the total range of the gas being measured, and it works within an ambient temperature range of −40 °C~+70 °C. When each position was 5 m apart, the interval distance was measured with a tape measure; the external ambient temperature was 22 °C, the pressure was 98.4 MPa, and the wind speed inside the barn was approximately equal to 0; the detecting equipment was approximately 1.5 m from the edge of the cow enclosure; the cattle shed is of the bedded type; number of cows in the barn is 200; the flow rate of the air inlet of both devices was 0.8 L/min; and the collection frequency of both devices is 1 Hz. During the measurement, we first recorded the start time of the measurement, observed the data until they stabilized, then saved the data, and recorded the end time. After the end of the measurement period, the data measured at each position were post-processed based on the start and end times of the detection at each position.
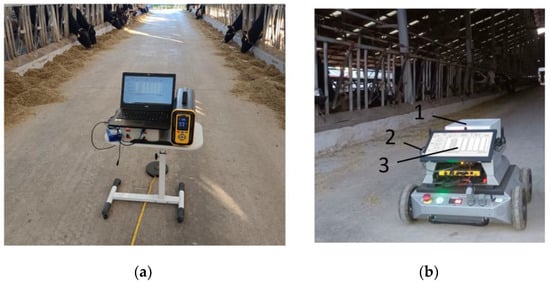
Figure 15.
Greenhouse gas detection in dairy farms. 1. Greenhouse gas detection device; 2. line of communication; and 3. upper computer. (a) Fixed-point detection of greenhouse gases in dairy farms; (b) Dynamic detection of greenhouse gases in dairy farms.
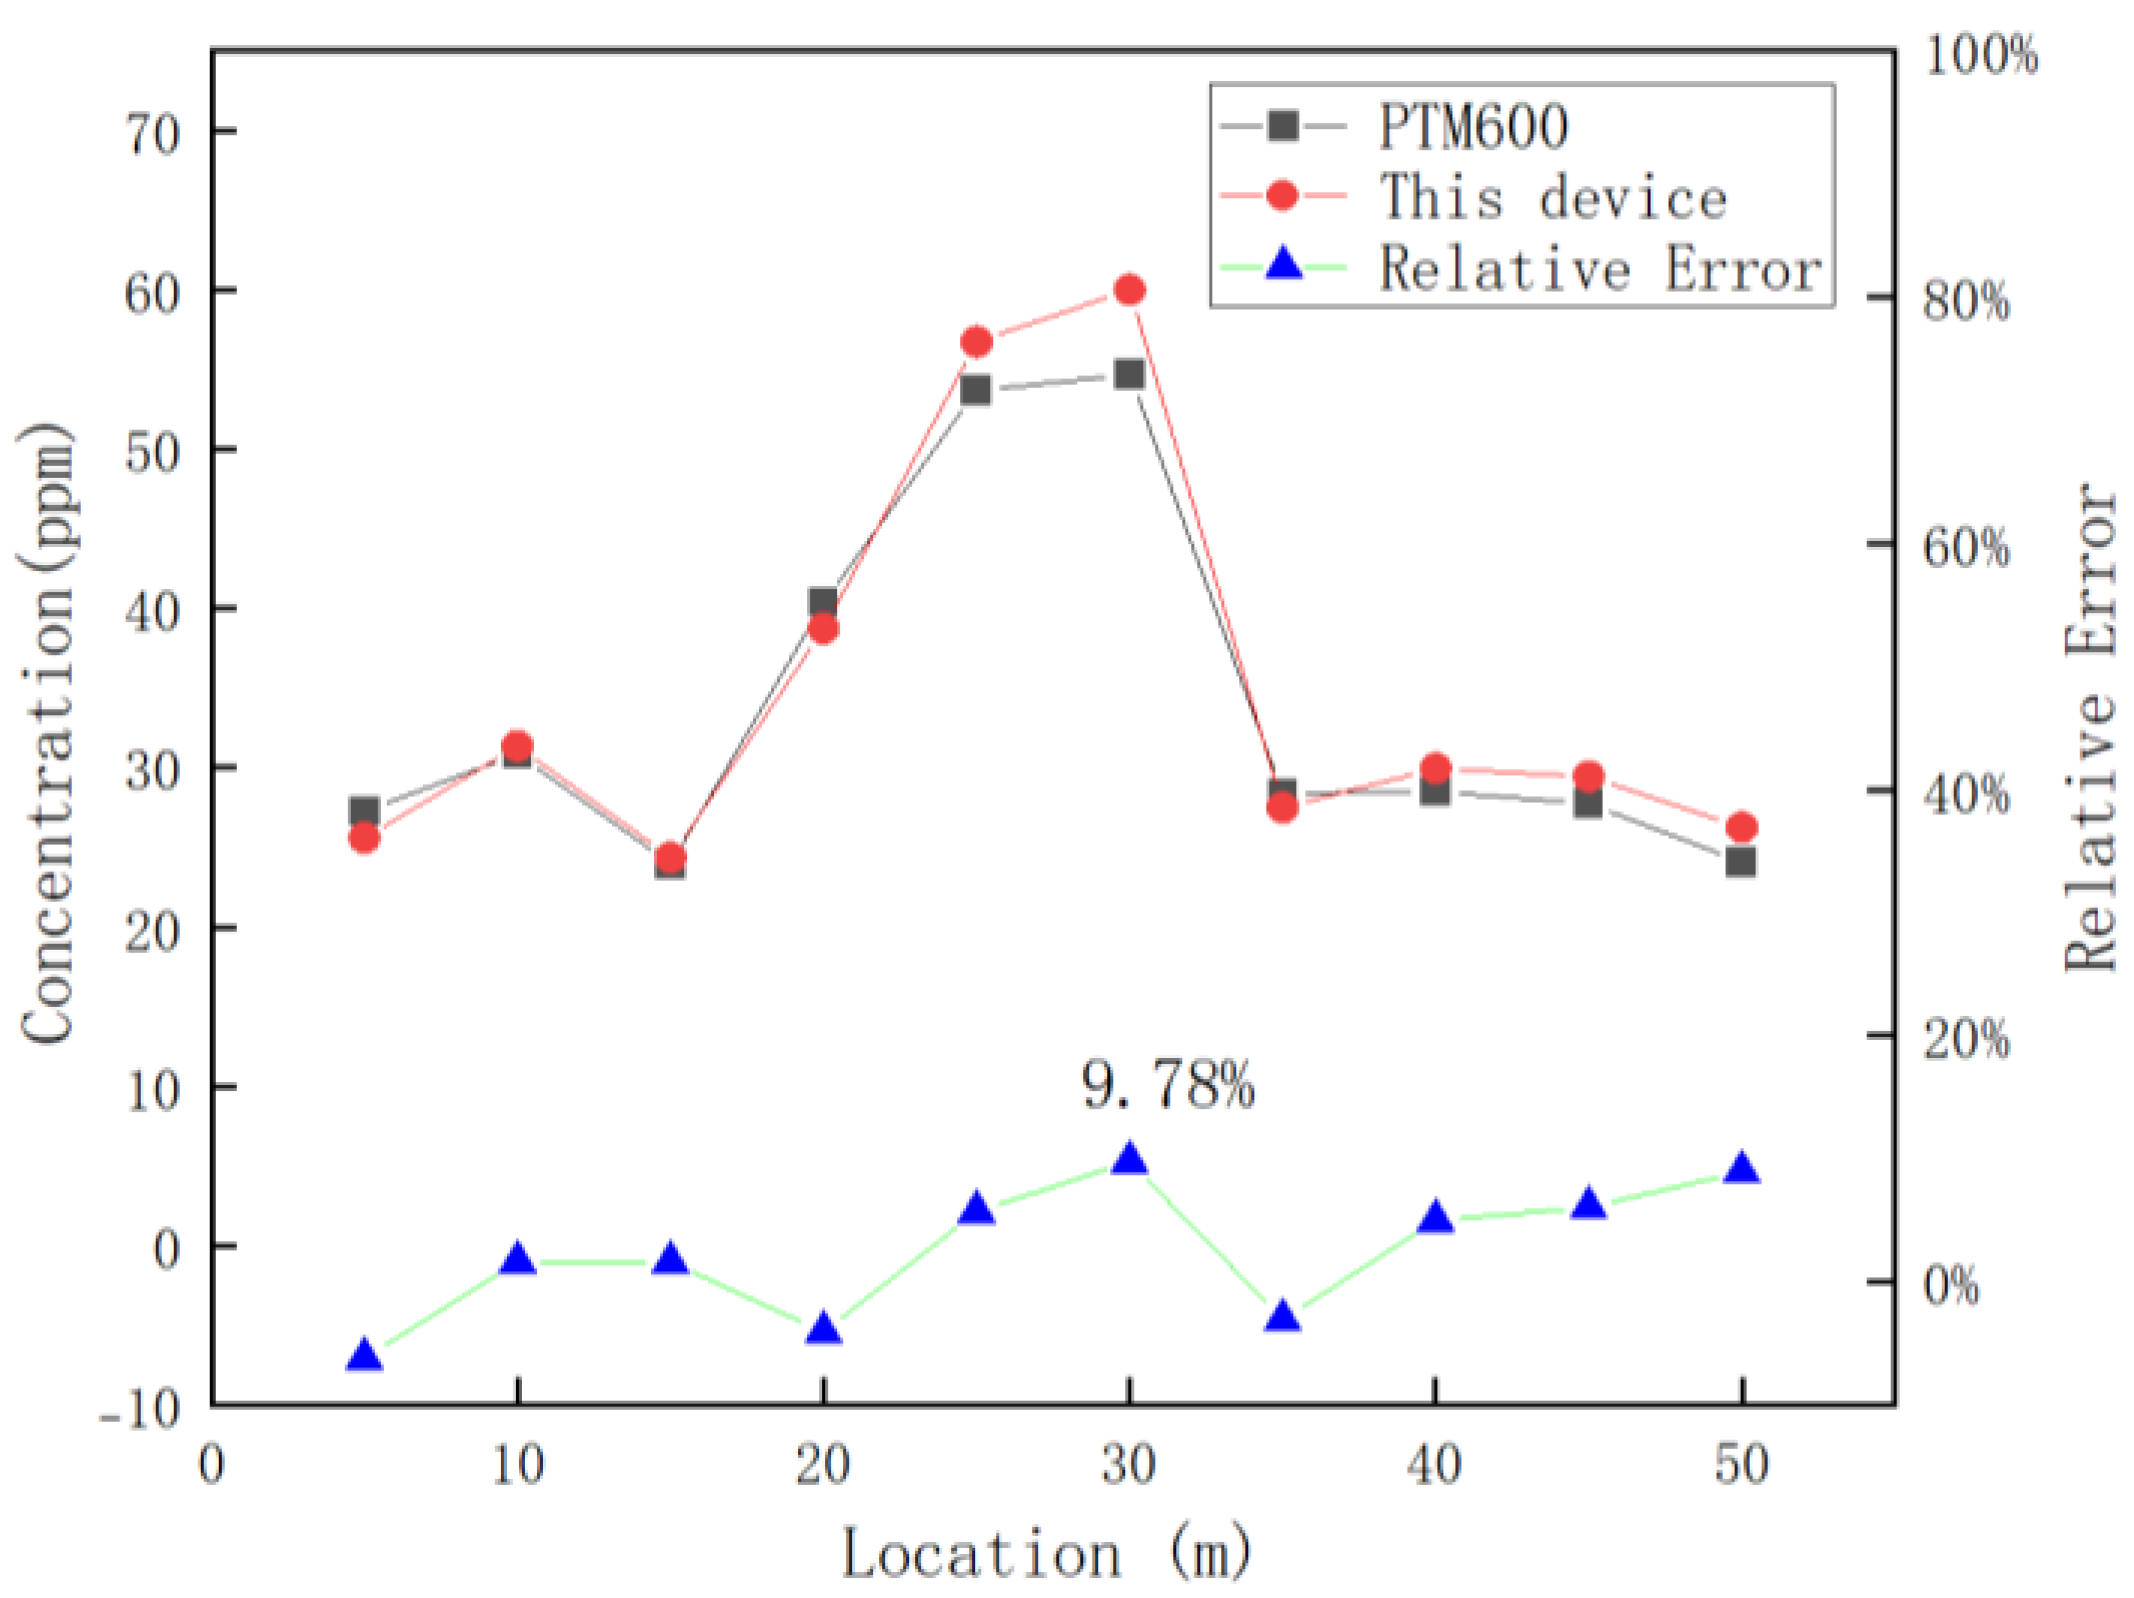
After verifying the accuracy and reliability of the detection device, the device was equipped with an inspection robot to conduct continuous dynamic detection in Luoyang Shengsheng Ranch, as shown in Figure 15b. During detection, the traveling speed of the trolley was 0.25 m/s, and the concentration data detected by the greenhouse gas detection device were transmitted to the upper computer of the trolley through the serial port. The data collected by this device and the PTM600 portable gas analyzer were exported and corresponded according to the time. The two devices averaged 10 data points for each position after the measurement was stabilized, and the results are shown in Figure 16.
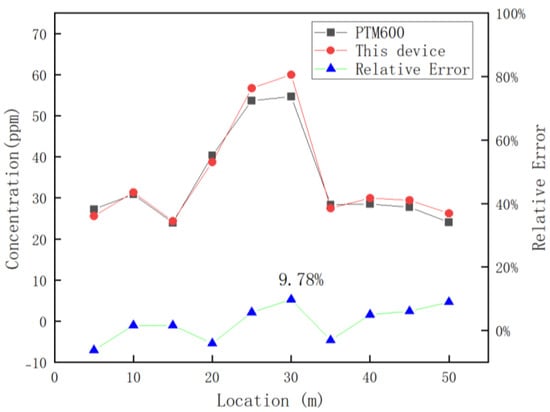
Figure 16.
Comparison of the results of this device with the PTM600 in dairy farm spotting tests.
Figure 16 reveals that the detection error peaks at 9.78% for both devices when the detection position is 30 m. This maximum error arises from two primary factors: the inherent accuracy limitations of the detection device itself and external environmental disturbances.
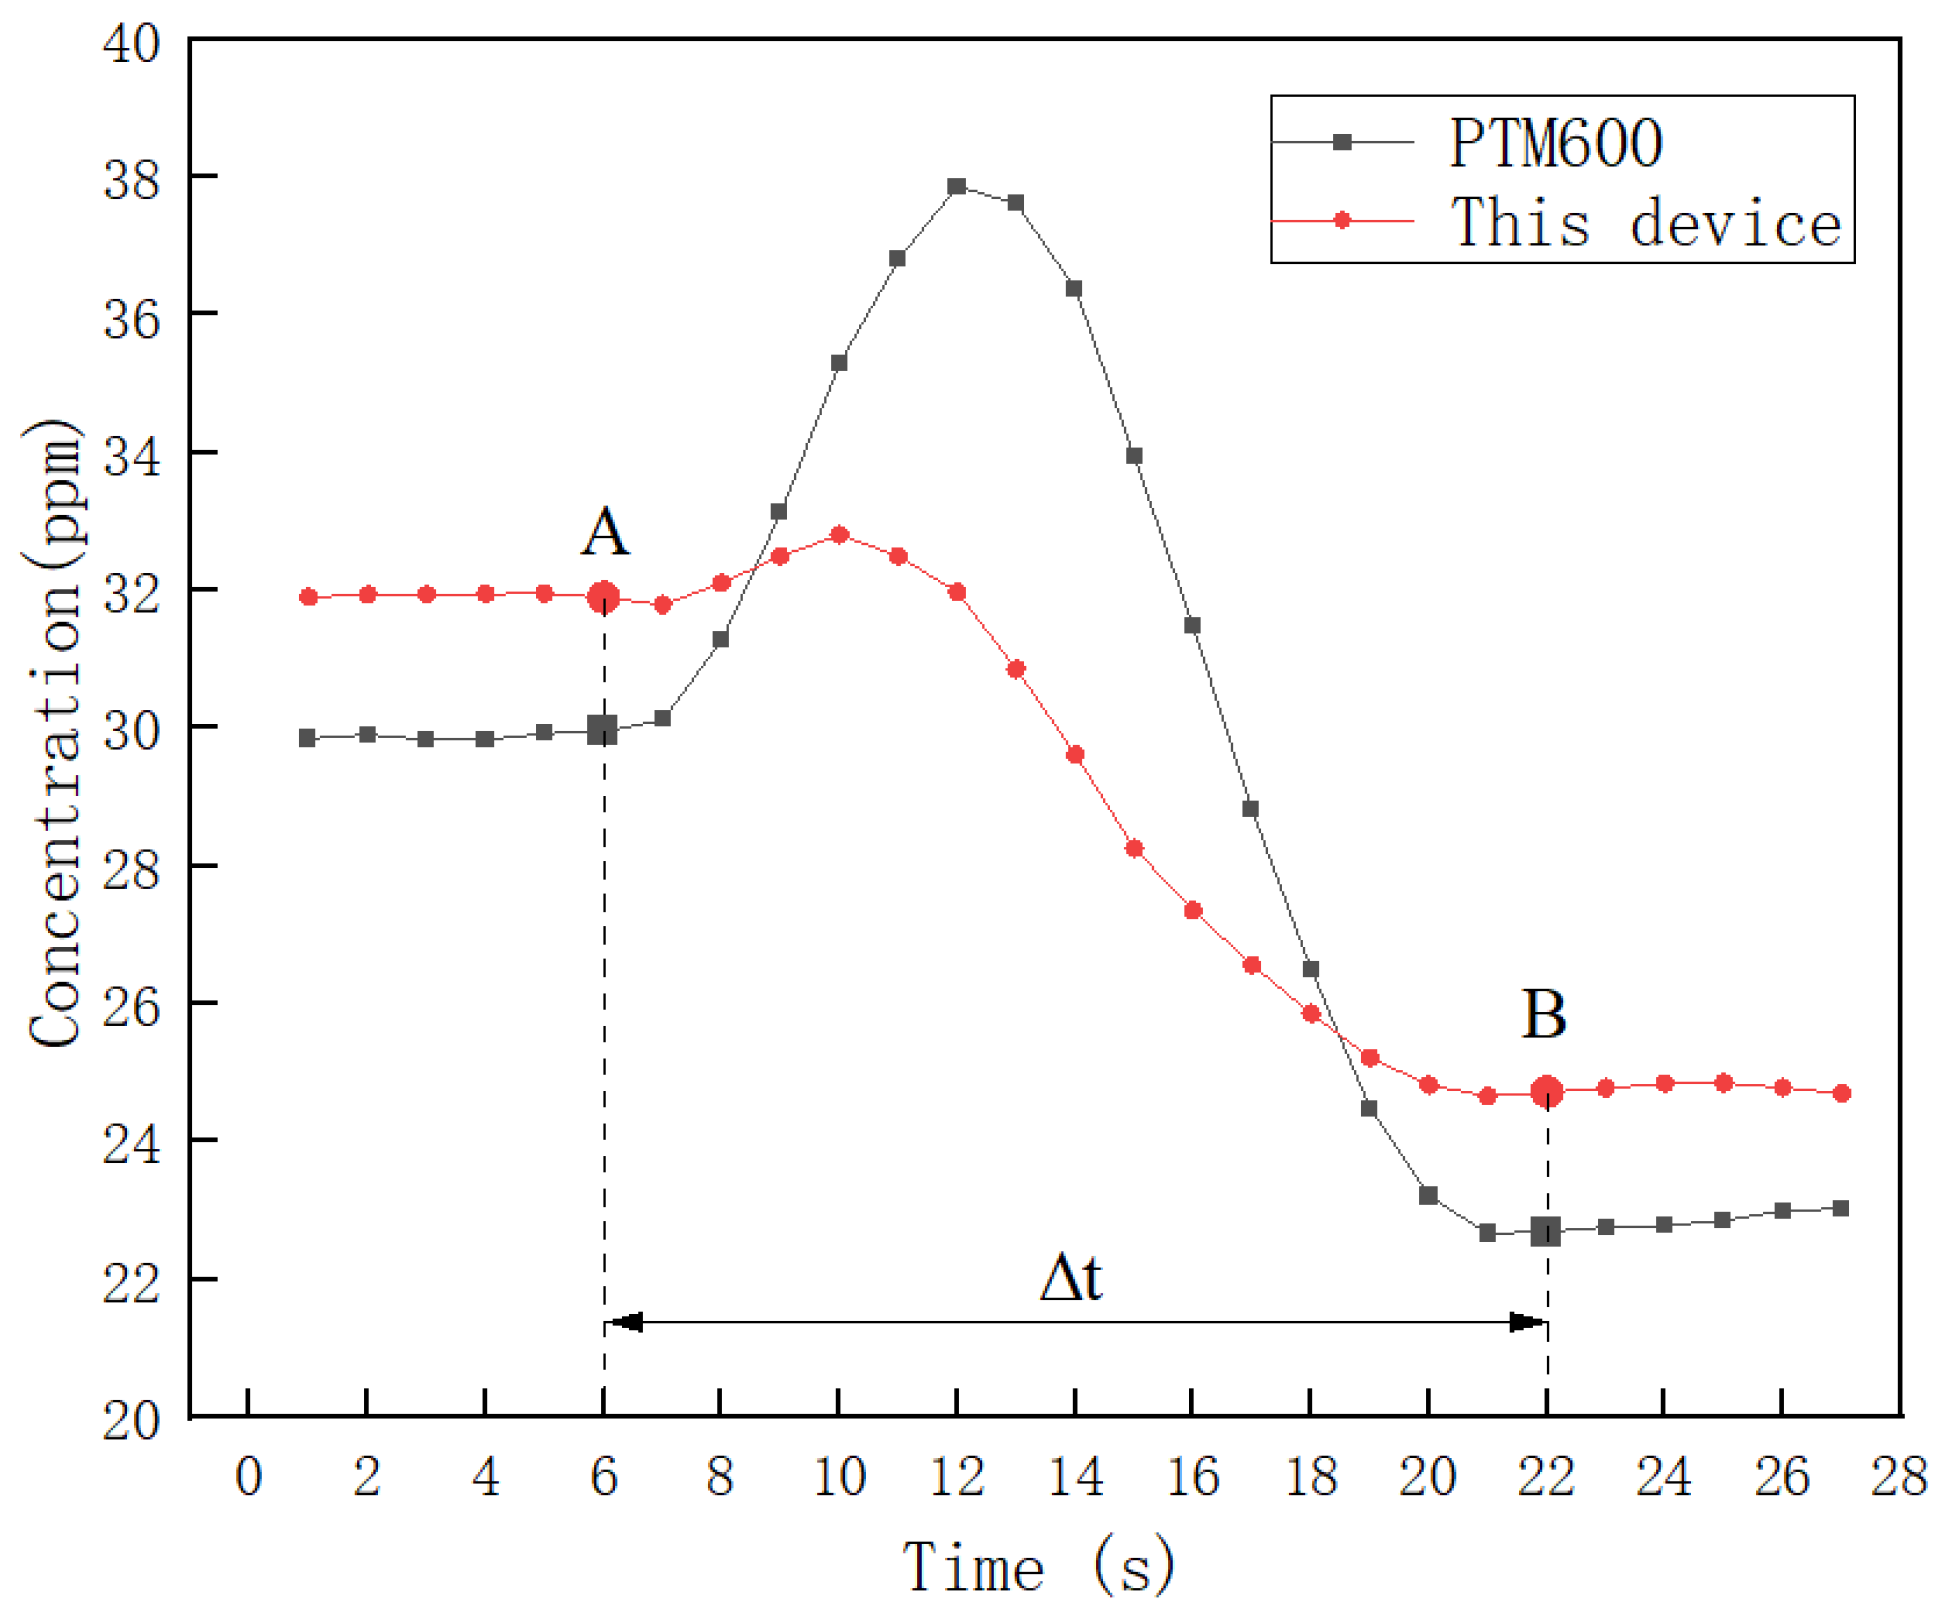
To study the dynamic response time between the two devices, data processing and analysis were carried out from one measurement-stabilized position A to the next measurement-stabilized position B. The data were analyzed in the following way. Where the interval of AB is 5 m, Δt is the time from A to B, when Δt is maximum. The result is shown in Figure 17.
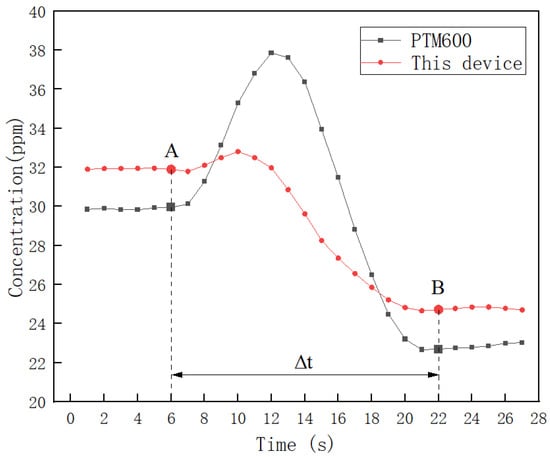
Figure 17.
Comparison of dynamic response times between this device and PTM600.
To enhance the precision of the concentration change trends, the collected data were smoothed using the neighbor averaging method. Figure 17 illustrates that, despite minor fluctuations, both devices exhibit a similar overall trend from position A to position B. Notably, the PTM600 exhibits larger fluctuations, indicating its superior resistance to external interference. By averaging the five stabilized data points at position B, a concentration difference of 1.91 ppm was observed between the two devices. Additionally, the time elapsed from A to B, representing the dynamic response time of the device, is less than 16 s, as is evident in Figure 17.
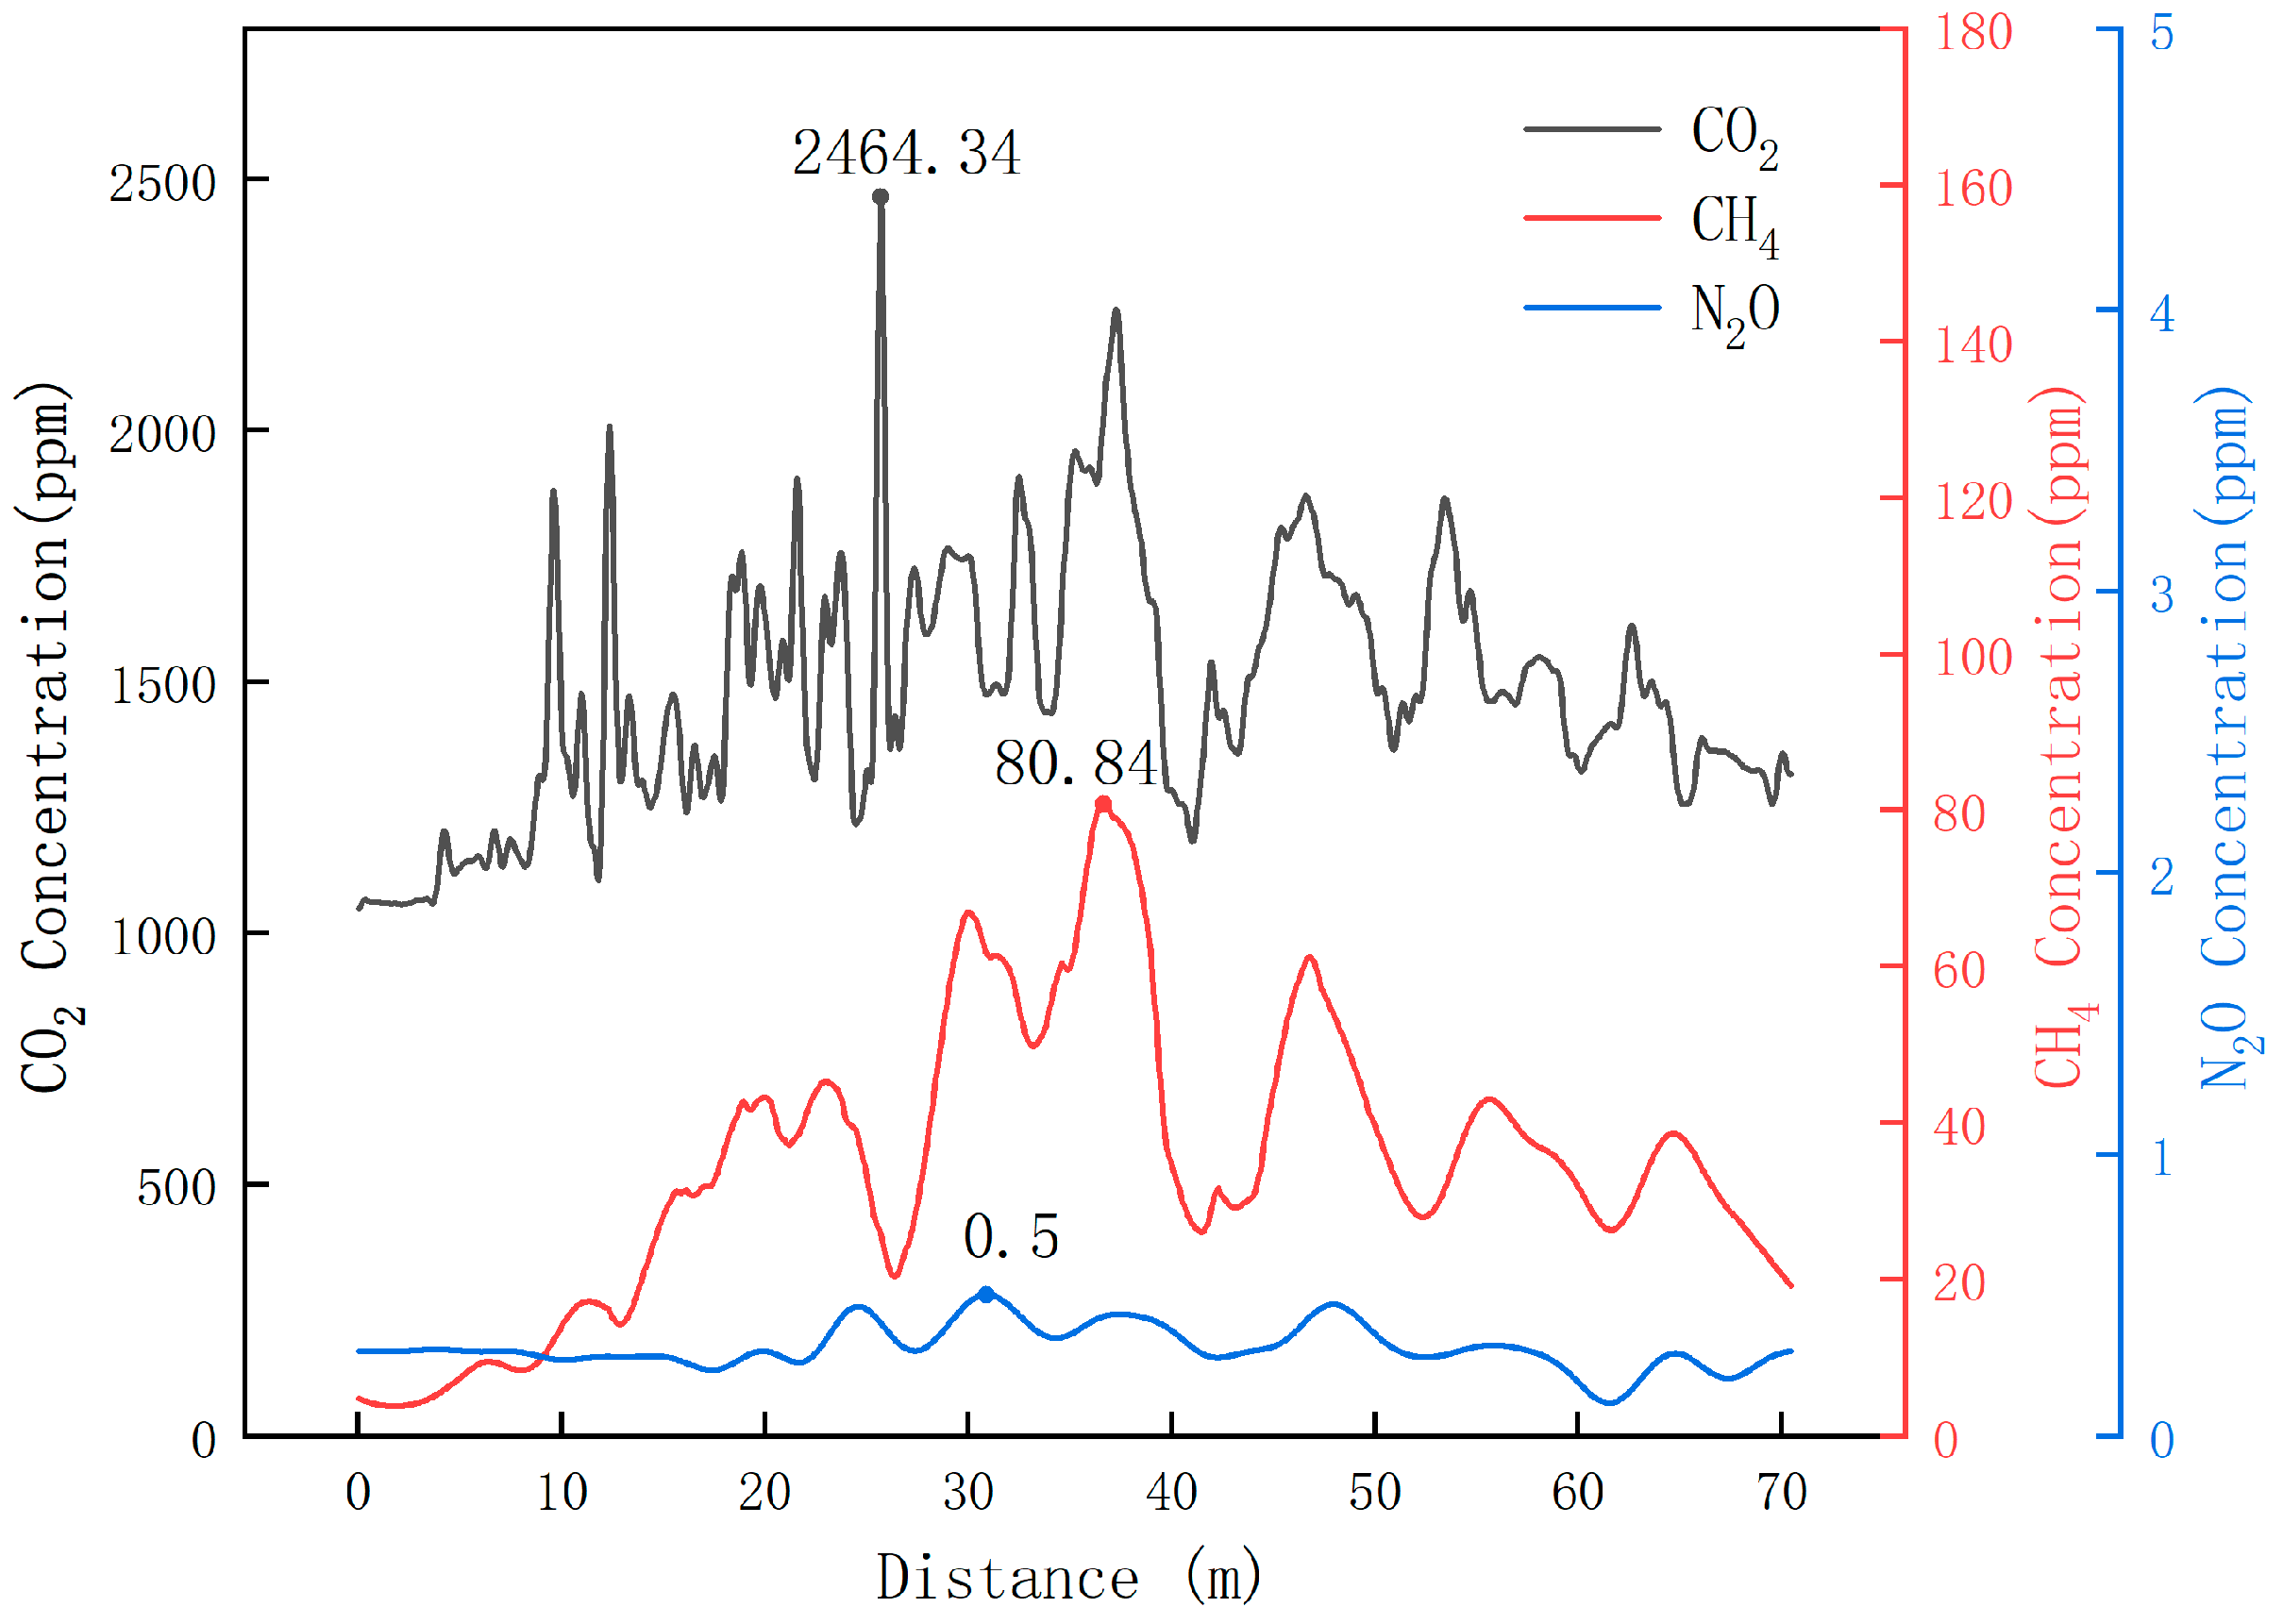
Based on the above experiments, this study verified that the self-developed greenhouse gas detection device has a certain degree of accuracy and reliability both under laboratory conditions and in the complex dairy farm environment. Therefore, in this study, this device was also used to collect greenhouse gases in the corridor of the cowshed of Luoyang Shengsheng Farm, and the detection results are shown in Figure 18.
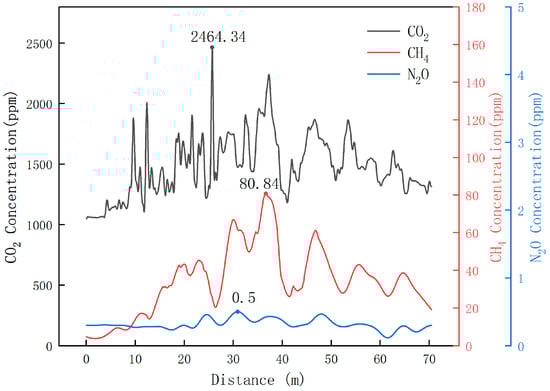
Figure 18.
Dynamic test results of greenhouse gas in the corridor of the cowshed of Luoyang Shengsheng Farm.
The results show that the maximum concentration of CO2 did not exceed 2464.34 ppm, the maximum concentration of CH4 did not exceed 80.84 ppm, and the maximum concentration of N2O did not exceed 0.5 ppm in winter at Luoyang Shengsheng Farm.
4. Discussion
4.1. Comparison of Related Studies
To further explore the feasibility of this study, this paper summarizes and compares the results of related studies, as shown in Table 8.
Table 8.
The comparisons of NDIR-based multi-gas detection methods with those described of other works.
Table 8 shows that some scholars have performed research on multi-gas detection devices; however, most of the gases used are one or two greenhouse gases, and there is no research on CH4, CO2, and N2O at the same time. Therefore, this paper investigates the mutual interference among CH4, CO2, and N2O and expands the content of non-spectral infrared multi-gas detection.
Moreover, this paper compares and analyzes the results of several scholars’ studies on greenhouse gas detection on dairy farms, as shown in Table 9.
Table 9.
Comparison of greenhouse gas detection methods for dairy farms.
Table 9 reveals that greenhouse gases detected in dairy farms are primarily stationary, which poses significant limitations. For instance, stationary detection can only capture concentrations from a limited number of locations within extensive dairy farms, where multiple locations require monitoring. Boosting the number of detection devices undoubtedly incurs considerable additional costs. In contrast, mobile detection offers cost savings by reducing the need for fixed equipment. This approach necessitates regular inspections along established routes.
4.2. Error Analysis
According to the experimentally measured results, although this study corrected the interference from the concentration model of the three gases, there was still a certain error in the measurement results of this detection device, and, after analysis, the main reasons for the error are as follows:
- (1)
- The concentration ranges of methane and nitrous oxide are very small, the configuration of gas concentrations is not guaranteed to be 100% accurate, and there may be some errors compared to the true concentrations. This is mainly due to the limitations of the existing technology, and there is a certain precision deviation in the gas distribution instrument storage itself.
- (2)
- The three-gas concentration models calibrated based on the least-squares method do not reach 100% accuracy. They also produce errors, mainly due to the limited number of samples, and all of them only use linear fitting to calculate the cross-interference coefficients between the channels.
- (3)
- The concentration of the configured standard gas is not continuous, but there is a gradient, so the limited number of samples may also contribute to the error.
- (4)
- Due to the limitations of the existing technology, the transmittance of the filter for the gas to be measured is not 100%, which leads to certain errors in the light intensity received by the detector, which in turn leads to errors in the electrical signal and the measurement results.
- (5)
- Errors are caused by external environmental disturbances during on-site testing and lack of professionalism in operation.
In order to further reduce the measurement error of the gas detection equipment, the next steps will involve increasing the calibration sample size, optimizing the concentration model, comparing a variety of algorithms for cross-interference correction between the channels, and, after the system correction is completed, a secondary calibration of the measurement results in order to further reduce the measurement error.
4.3. Farm Use
Livestock farming, particularly dairy farming, is a significant contributor to greenhouse gas (GHG) emissions. Monitoring GHGs from dairy farms is, therefore, crucial. Currently, monitoring these gases primarily relies on direct measurements using sensors installed in specific dairy farm areas. However, existing methods often lack precision and struggle to capture all emission sources, especially on large-scale farms. Furthermore, high-quality GHG monitoring equipment is costly and requires specialized knowledge for installation and maintenance, posing a challenge for many dairy farms.
In this study, we developed a GHG detection device based on non-dispersive infrared (NDIR) technology. NDIR’s high selectivity, long lifetime, low maintenance, and stability make it suitable for cost-effective GHG detection in dairy farms. Additionally, our device is equipped with an inspection robot that can monitor GHG distribution across multiple dairy farm areas, enhancing dairy farm GHG management. By monitoring greenhouse gas (GHG) emissions from dairy farms, dairy farmers can expose inefficiencies in their management practices, such as improper feed utilization or inadequate manure management. By addressing these issues, dairy farmers can enhance their productivity and economic efficiency. Additionally, by pinpointing the primary sources of emissions, dairy farmers can promptly implement measures to mitigate their GHG output. Furthermore, proactive management and a reduction in GHGs can enhance a farm’s brand image and competitiveness in the market.
However, this study still has room for improvement. For instance, we did not calibrate the gas at different temperatures, limiting our ability to accurately measure GHGs. Additionally, we only monitored GHGs in a fixed plane of the dairy farm, and the collected data could not be synchronized with a mobile phone client in real-time. Future work will focus on addressing these limitations and promoting the use of our research findings in dairy farm GHG monitoring.
5. Conclusions
In this study, a greenhouse gas (GHG) detection device based on a broadband light source and a four-channel thermopile detector was constructed based on the NDIR principle, and the concentrations of CH4, N2O, and CO2 in the ranges of 0~100 ppm, 0~500 ppm, and 0~20%, respectively, were measured simultaneously. After the calibration of CH4, N2O, and CO2, an interference model between the three gases was established by the least-squares method, and the model was corrected to detect the three gases at different concentrations. The results show that the full-range deviation of the detection device was lower than 0.81%, the repeatability was lower than 0.39%, the stability was lower than 0.61%, and the response time was lower than 10 s. This study also carried out on-site testing of greenhouse gases in Luoyang Shengsheng Ranch, and the results show that the relative error of this device and the PTM600 portable gas analyzer were within 9.78%, and the dynamic response time of this device was within 16 s. Therefore, this device can be relatively fast and accurate. It can be shown that this study extends the scope of GHG monitoring in dairy farms compared with the traditional fixed-point detection, which is of great significance for the further realization of the comprehensive monitoring of GHG emissions from dairy farms as well as for “carbon emission reduction”. In addition, this study also makes a comparative analysis with related studies also taking part in the discussion, analyzes the causes of errors in the gas detection process in the area of error analysis, and proposes some ways to further improve the accuracy of the gas detection results, which provides ideas for the next research project.
Author Contributions
Conceptualization, Q.L., J.J., J.M.B. and K.Z.; methodology, Q.L., J.J., J.M.B. and K.Z.; investigation, K.Z., Y.H. and H.L.; resources, J.J. and K.Z.; data curation, Y.H. and H.L.; writing—original draft preparation, Y.H.; writing—review and editing, K.Z. and Y.H.; supervision, K.Z., Y.H. and H.L.; project administration, Q.L., J.J. and K.Z. All authors have read and agreed to the published version of the manuscript.
Funding
This research was funded by the National Key R&D Plan Key projects (Grant No. 2023YFD2000702), International Science and Technology Cooperation Project of Henan Province Key Research and Development Projects (Grant No. 232102521006), University science and technology innovation talent project of Henan Province (Grant No. 24HASTIT052).
Institutional Review Board Statement
Not applicable.
Informed Consent Statement
Not applicable.
Data Availability Statement
Data are contained within the article.
Conflicts of Interest
The authors declare no conflict of interest. Although Jeffrey Bewley works with a company, this article has no conflict of interest with the company.
References
- Mikhaylov, A.; Moiseev, N.; Aleshin, K.; Burkhardt, T. Global climate change and greenhouse effect. Entrep. Sustain. Issues 2020, 7, 2897. [Google Scholar] [CrossRef] [PubMed]
- Gills, B.; Morgan, J. Global climate emergency: After COP24, climate science, urgency, and the threat to humanity. In Economics and Climate Emergency; Routledge: London, UK, 2022; pp. 253–270. [Google Scholar]
- Lacasta, N.S.; Dessai, S.; Kracht, E.; Vincent, K. Articulating a consensus: The EU’s position on climate change. In Europe and Global Climate Change: Politics, Foreign Policy and Regional Cooperation; Edward Elgar: Cheltenham, UK, 2007; pp. 211–231. [Google Scholar] [CrossRef]
- Liu, L.; Wang, X.; Wang, Z. Recent progress and emerging strategies for carbon peak and carbon neutrality in China. Greenh. Gases Sci. Technol. 2023, 17, 732–759. [Google Scholar] [CrossRef]
- Rivera, J.E.; Chará, J. CH4 and N2O emissions from cattle excreta: A review of main drivers and mitigation strategies in grazing systems. Front. Sustain. Food Syst. 2021, 5, 657936. [Google Scholar] [CrossRef]
- Wattiaux, M.; Uddin, M.; Letelier, P.; Jackson, R.; Larson, R. Invited Review: Emission and mitigation of greenhouse gases from dairy farms: The cow, the manure, and the field. Appl. Anim. Sci. 2019, 35, 238–254. [Google Scholar] [CrossRef]
- Joo, H.; Ndegwa, P.; Heber, A.; Ni, J.-Q.; Bogan, B.; Ramirez-Dorronsoro, J.; Cortus, E. Greenhouse gas emissions from naturally ventilated freestall dairy barns. Atmos. Environ. 2015, 102, 384–392. [Google Scholar] [CrossRef]
- Jia, L.; Cheng, P.; Yu, Y.; Chen, S.-H.; Wang, C.-X.; He, L.; Nie, H.-T.; Wang, J.-C.; Zhang, J.-C.; Fan, B.-G. Regeneration mechanism of a novel high-performance biochar mercury adsorbent directionally modified by multimetal multilayer loading. J. Environ. Manag. 2023, 326, 116790. [Google Scholar] [CrossRef]
- Barrancos, J.; Briz, S.; Nolasco, D.; Melián, G.; Padilla, G.; Padrón, E.; Fernández, I.; Pérez, N.; Hernández, P.A. A new method for estimating greenhouse gases and ammonia emissions from livestock buildings. Atmos. Environ. 2013, 74, 10–17. [Google Scholar] [CrossRef]
- D’Urso, P.R.; Arcidiacono, C. Effect of the milking frequency on the concentrations of ammonia and greenhouse gases within an open dairy barn in hot climate conditions. Sustainability 2021, 13, 9235. [Google Scholar] [CrossRef]
- Ngwabie, N.; Jeppsson, K.-H.; Nimmermark, S.; Swensson, C.; Gustafsson, G. Multi-location measurements of greenhouse gases and emission rates of methane and ammonia from a naturally-ventilated barn for dairy cows. Biosyst. Eng. 2009, 103, 68–77. [Google Scholar] [CrossRef]
- Dobrokhotov, V.; Larin, A. Multisensory gas chromatography for field analysis of complex gaseous mixtures. ChemEngineering 2019, 3, 13. [Google Scholar] [CrossRef]
- Saxena, P.; Shukla, P. A review on recent developments and advances in environmental gas sensors to monitor toxic gas pollutants. Environ. Prog. Sustain. Energy 2023, 42, e14126. [Google Scholar] [CrossRef]
- Xu, M.; Xu, Y.; Tao, J.; Wen, L.; Zheng, C.; Yu, Z.; He, S. Development of a compact NDIR CO2 gas sensor for harsh environments. Infrared Phys. Technol. 2024, 136, 105035. [Google Scholar] [CrossRef]
- Fu, L.; You, S.; Li, G.; Fan, Z. Enhancing methane sensing with NDIR technology: Current trends and future prospects. Rev. Anal. Chem. 2023, 42, 20230062. [Google Scholar] [CrossRef]
- Sun, Q.; Liu, T.; Yu, X.; Huang, M. Non-interference NDIR detection method for mixed gases based on differential elimination. Sens. Actuators B Chem. 2023, 390, 133901. [Google Scholar] [CrossRef]
- Qin, Z.; Huang, H.; Lin, K.; Tang, Y.; Tang, J. NDIR-based low-cost integrated three-component gas detection system. In Proceedings of the 2023 2nd International Symposium on Sensor Technology and Control (ISSTC), Baoding, China, 4–6 August 2023; pp. 63–68. [Google Scholar]
- Liang, J.-G.; Jiang, Y.; Wu, J.-K.; Wang, C.; von Gratowski, S.; Gu, X.; Pan, L. Multiplex-Gas Detection based on Non-Dispersive Infrared Technique: A Review. Sens. Actuators A Phys. 2023, 356, 114318. [Google Scholar] [CrossRef]
- de Hoyos-Vazquez, F.; Carreno-de Leon, M.; Serrano-Nunez, E.; Flores-Alamo, N.; Ríos, M.S. Development of a novel non-dispersive infrared multi sensor for measurement of gases in sediments. Sens. Actuators B Chem. 2019, 288, 486–492. [Google Scholar] [CrossRef]
- Xie, J.; Zhang, Y.L.; Yuan, Y.F. Research of Weak Signal Processing Circuit Based on Non-Dispersive Infrared Automobile Exhaust Sensor. In Proceedings of the Applied Mechanics and Materials, Guangzhou, China, 13–14 April 2013; pp. 163–167. [Google Scholar]
- Tan, Q.; Tang, L.; Yang, M.; Xue, C.; Zhang, W.; Liu, J.; Xiong, J. Three-gas detection system with IR optical sensor based on NDIR technology. Opt. Lasers Eng. 2015, 74, 103–108. [Google Scholar] [CrossRef]
- Wang, H.; Wang, J.; Ma, X.; Chen, W.; Chen, D.; Li, Q. Note: A NDIR instrument for multicomponent gas detection using the galvanometer modulation. Rev. Sci. Instrum. 2017, 88, 116103. [Google Scholar] [CrossRef]
- Dong, M.; Zheng, C.; Miao, S.; Zhang, Y.; Du, Q.; Wang, Y.; Tittel, F.K. Development and measurements of a mid-infrared multi-gas sensor system for CO, CO2 and CH4 detection. Sensors 2017, 17, 2221. [Google Scholar] [CrossRef]
- Xu, M.; Peng, B.; Zhu, X.; Guo, Y.J.S. Multi-Gas Detection System Based on Non-Dispersive Infrared (NDIR) Spectral Technology. Sensors 2022, 22, 836. [Google Scholar] [CrossRef]
- Wu, W.; Zhang, G.; Kai, P. Ammonia and methane emissions from two naturally ventilated dairy cattle buildings and the influence of climatic factors on ammonia emissions. Atmos. Environ. 2012, 61, 232–243. [Google Scholar] [CrossRef]
- Ngwabie, N.; Jeppsson, K.-H.; Gustafsson, G.; Nimmermark, S. Effects of animal activity and air temperature on methane and ammonia emissions from a naturally ventilated building for dairy cows. Atmos. Environ. 2011, 45, 6760–6768. [Google Scholar] [CrossRef]
- Ngwabie, N.M.; Vanderzaag, A.; Jayasundara, S.; Wagner-Riddle, C. Measurements of emission factors from a naturally ventilated commercial barn for dairy cows in a cold climate. Biosyst. Eng. 2014, 127, 103–114. [Google Scholar] [CrossRef]
- Li, G.-L.; Yan, Z.; Song, N.; Dong, M.; Ye, W.-L.; Zheng, C.-T.; Wang, Y.-D. Design and Performances of a Carbon Monoxide Sensor Using Mid-Infrared Absorption Spectroscopy Technique at 4.6 µm. Spectrosc. Lett. 2015, 48, 454–461. [Google Scholar] [CrossRef]
- Wong, J.Y.; Anderson, R.L. Non-Dispersive Infrared Gas Measurement; Lulu.com: Morrisville, NC, USA, 2012. [Google Scholar]
- Crawley, L.H. Application of Non-Dispersive Infrared (NDIR) Spectroscopy to the Measurement of Atmospheric Trace Gases. Gp General Practitioner. Master’s Thesis, University of Canterbury, Christchurch, New Zealand, 2008. [Google Scholar] [CrossRef]
- Stutz, J.; Platt, U. Improving long-path differential optical absorption spectroscopy with a quartz-fiber mode mixer. Appl. Opt. 1997, 36, 1105–1115. [Google Scholar] [CrossRef]
- Björck, Å. Least squares methods. Handb. Numer. Anal. 1990, 1, 465–652. [Google Scholar] [CrossRef]


Disclaimer/Publisher’s Note: The statements, opinions and data contained in all publications are solely those of the individual author(s) and contributor(s) and not of MDPI and/or the editor(s). MDPI and/or the editor(s) disclaim responsibility for any injury to people or property resulting from any ideas, methods, instructions or products referred to in the content. |
© 2024 by the authors. Licensee MDPI, Basel, Switzerland. This article is an open access article distributed under the terms and conditions of the Creative Commons Attribution (CC BY) license (https://creativecommons.org/licenses/by/4.0/).