Article

Maximum Entropy Analysis of Bird Diversity and Environmental Variables in Nanjing Megapolis, China

1
School of Ecology and Applied Meteorology, Nanjing University of Information Science and Technology, Nanjing 210044, China
2
School of Computer Science, Nanjing University of Information Science and Technology, Nanjing 210044, China
3
Reading Academy, Nanjing University of Information Science and Technology, Nanjing 210044, China
4
Longshan College, Nanjing University of Information Science and Technology, Nanjing 210044, China
*
Author to whom correspondence should be addressed.
Sustainability 2024, 16(5), 2139; https://doi.org/10.3390/su16052139
Submission received: 10 January 2024 / Revised: 28 February 2024 / Accepted: 2 March 2024 / Published: 5 March 2024
(This article belongs to the Section Sustainability, Biodiversity and Conservation)

Abstract

:
Against the background of global climate change and urbanization, the biodiversity of birds is facing unprecedented threats. In this paper, taking the Nanjing megapolis as an example, based on the distribution sites of 79 bird species and 17 environmental variables, the MaxEnt model was used to simulate the distribution of bird diversity, and the most important environmental variables were analyzed. The results show that (1) the MaxEnt model is suitable for simulation of the potential distribution of bird diversity in the Nanjing megapolis; (2) the areas with the highest bird diversity in the Nanjing megapolis were mainly distributed in the mountains and hills where the forests are located; (3) the five most important environmental variables affecting bird distribution were ranked as maximum temperature of the warmest month (MTWM) > Digital Elevation Model (DEM) > precipitation of the wettest month (PWM) > distance to the nearest forest (DF) > Fractional Vegetation Cover index (FVC), with MTWM, PWM, and DF being negatively correlated with bird diversity, whereas FVC and DEM exhibited positive correlations with bird diversity; and (4) the contribution rates of the three types of environmental variables were ranked as follows: habitat environmental variables > meteorological environmental variables > disturbance environmental variables. Sufficient bird habitats should be maintained in cities, and disturbances from human activities should be reduced to achieve the harmonious coexistence of humans and animals in the context of climate change and urbanization, thereby promoting sustainable development.

1. Introduction

In the context of global climate change, the degradation of species habitats is becoming increasingly serious, which poses an unprecedented threat to global biodiversity [1,2]. Simultaneously, habitat reduction and species homogeneity [3] caused by urbanization present further challenges to biodiversity [4,5]. Cities are areas where humans and other biological communities coexist [6] and have great potential for biodiversity conservation [7]. With the rapid development of cities in East Asia [8], it is urgent to take measures to reduce the negative impacts of urbanization on biodiversity [9]. Specifically, birds are an important part of biodiversity; because of their wide distribution, large number, ease of observation, and high sensitivity to the environment, they are often used as a means of monitoring environmental change and as an indicator of species biodiversity [10,11,12]. Therefore, under the background of global climate change and urbanization, urban bird diversity has become a hot topic in studies on urban ecology and sustainable development [13].
Global climate change has different degrees of negative impacts on bird diversity, including different bird species [14,15] in different regions [16,17,18]. The impact of urbanization on bird diversity exists in certain stages. In the early stage of urbanization, urban expansion was the main cause, which directly led to fragmentation or even loss of habitat and a significant decline in bird diversity [19,20]. In the later stage of urbanization, stock development was the focus. Cities can provide more diversified food resources and habitats for birds, enabling some birds to live better in urban environments and increasing urban-adaptable species [21]. For example, the newly built small wetlands in the central urban area will increase bird diversity in some areas [22], with bird diversity in the urban center being higher in winter [23]. In recent years, the urbanization process in East Asia has been accelerating [24], which may result in greater uncertainties in urban bird diversity. Therefore, against the background of rapid urbanization, it is important to clarify the spatial distribution of bird diversity and its response relationship with the environment and maintain a high level of bird diversity [25]. In Nanjing, a megapolis in East Asia, global climate change has caused the loss of bird habitats and changes in habitat quality, leading to a decline in its bird diversity [26]. Additionally, urbanization has changed the habitats of local birds, and their distribution is more concentrated in urban parks and green spaces [27,28].
For the spatial distribution of bird diversity, ecological niche models (ENMs) were generally used; that is, the species distribution sites and their associated environmental variables were used to estimate the ecological needs of species, thus simulating the distribution of species. ENMs encompass a variety of models, such as the Bioclim model, which determines species’ ecological niches by analyzing the statistical distribution of bioclimatic variables and predicts potential distribution ranges of species globally or regionally [29], and GARP, which uses a combination of rules based on genetic algorithms for local environmental spatial modeling [30]. Among these, the Maximum Entropy (MaxEnt) model stands out for its ability to produce highly accurate predictions even with small sample sizes of species data [31,32], and it has been adopted by many researchers worldwide [33]. Scholars have successfully applied it to bird distribution studies [34,35]. However, MaxEnt is mainly used for the study of large-scale [26,36,37] or national nature reserves [38], and it lacks studies on the distribution of bird diversity and the importance of environmental variables at the urban scale.
Therefore, this paper targets the Nanjing megapolis for a case analysis, utilizing the MaxEnt model to make a refined prediction of the bird diversity distribution and investigate the associated environmental variables. We aim to bridge the gap in research on bird diversity distribution at the urban scale. Specifically, it is intended to offer a theoretical basis for the construction and planning of megapolises based on analyses of the potential distribution of birds and environmental variables. This paper anticipates contributing to the harmonious coexistence of humans and birds within the context of future global climate change and urbanization processes.

2. Materials and Methods
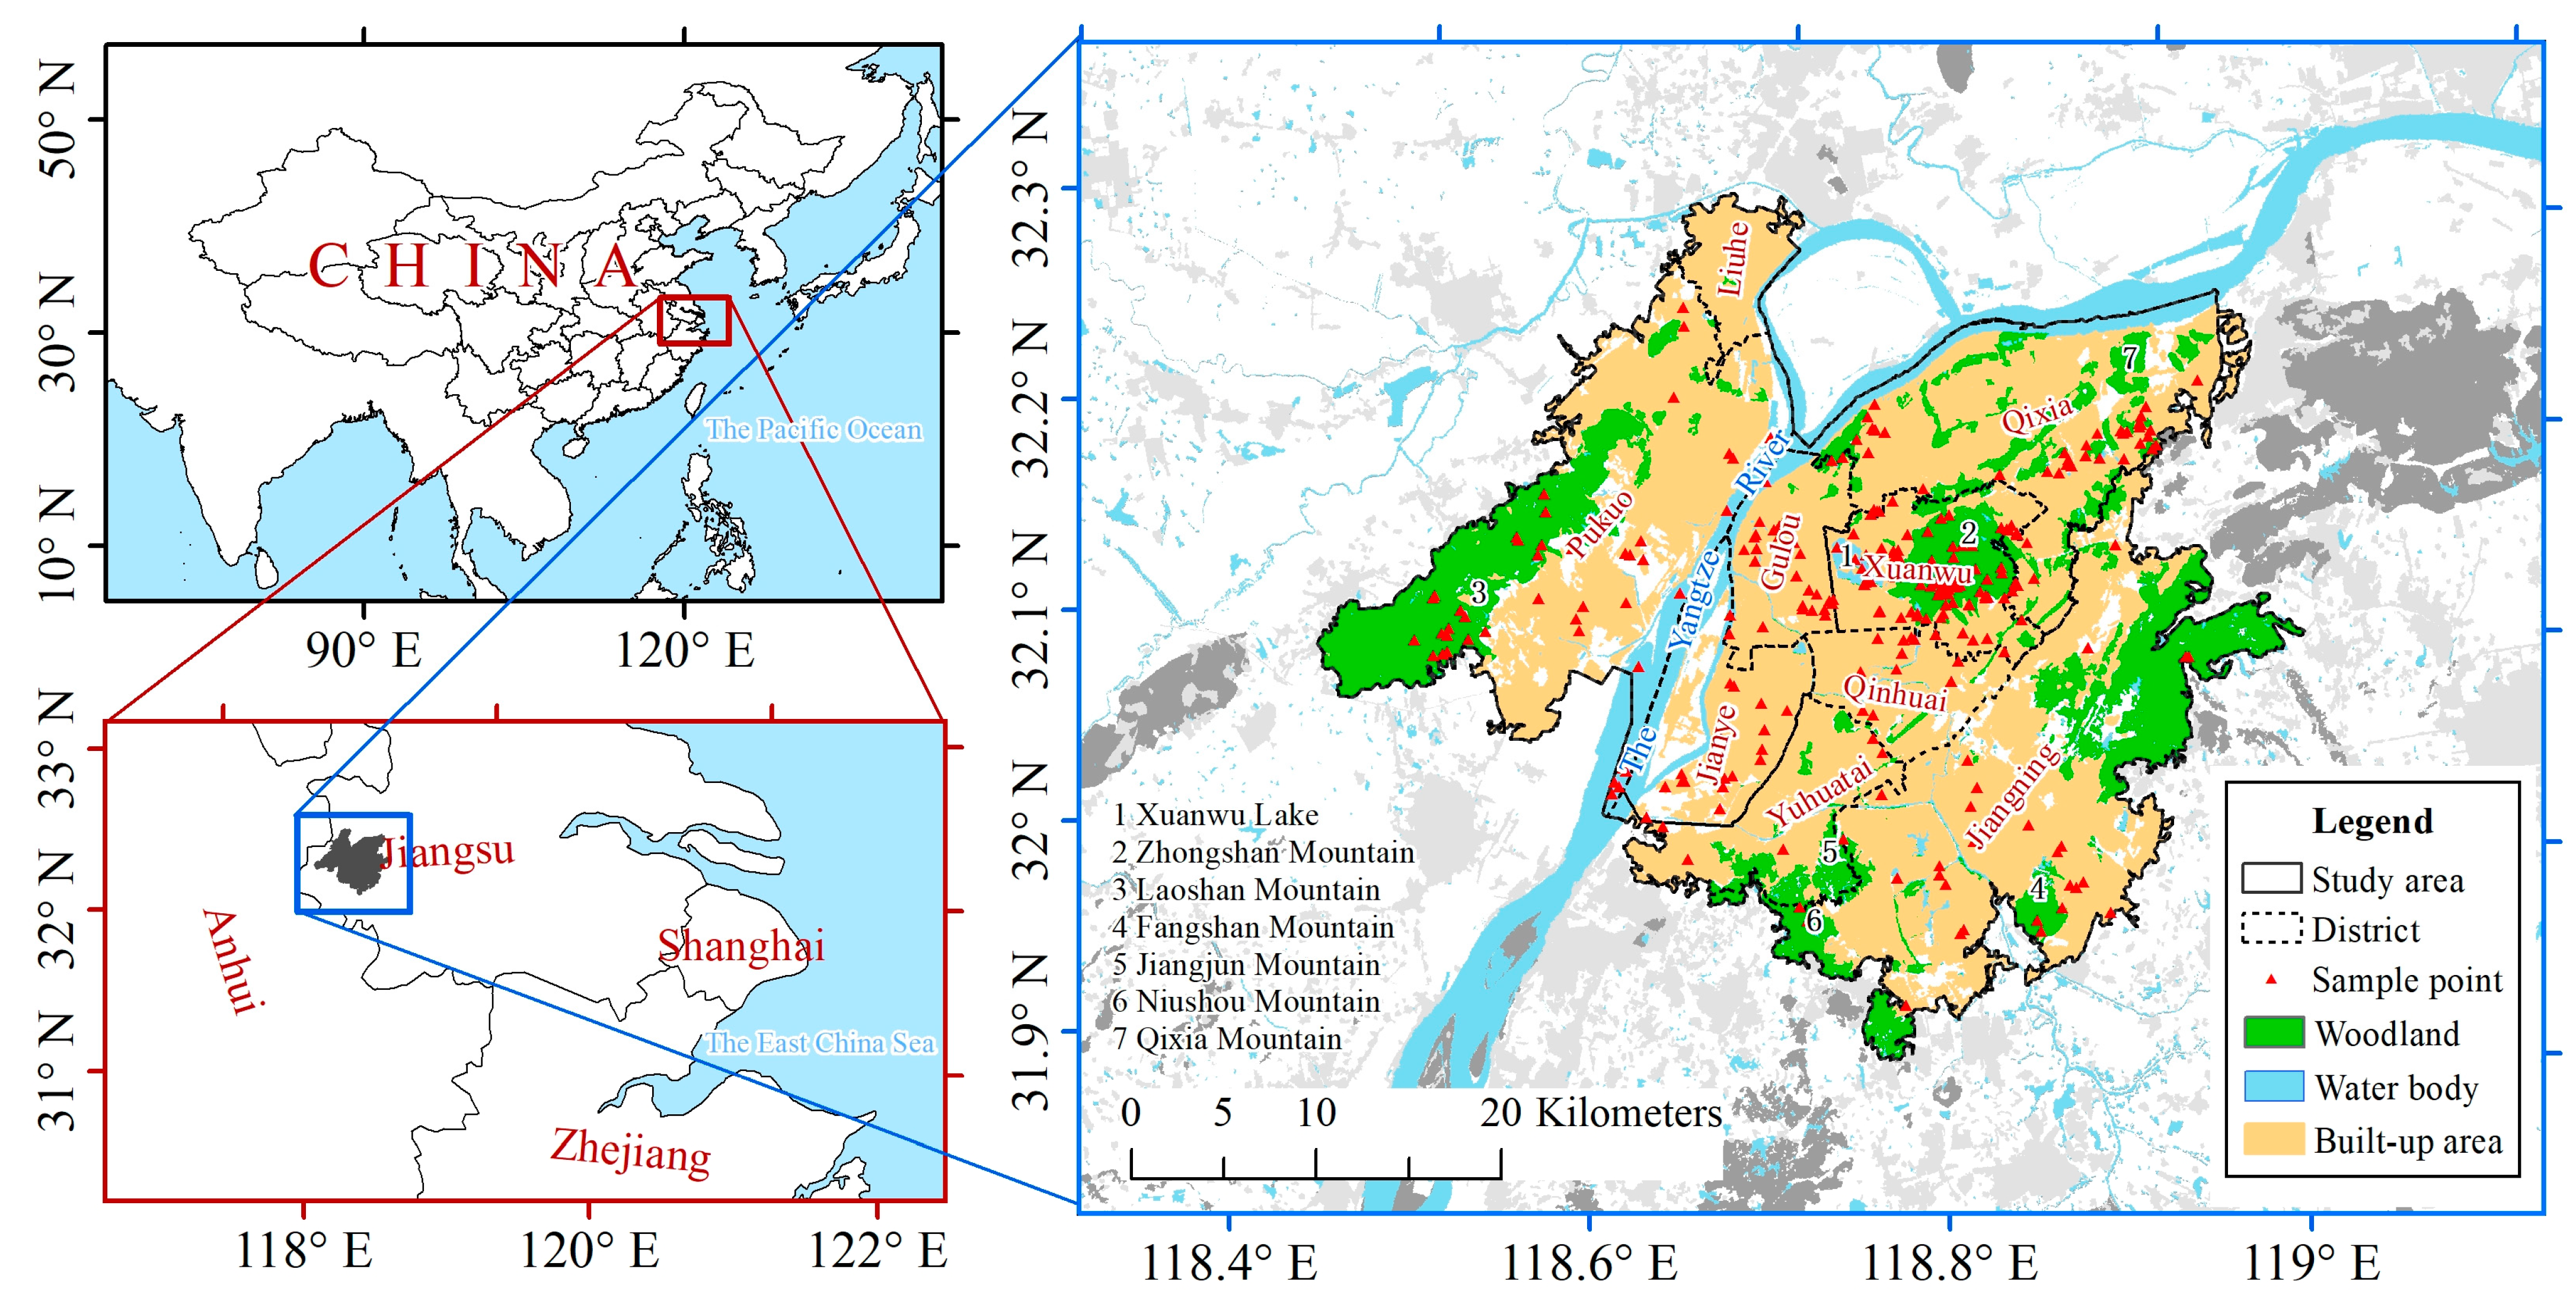
2.1. Study Area

The study area considered in this paper is the Nanjing megapolis (118°27′ E, 31°48′ N–119°4′ E, 32°17′ N, Figure 1), which has an area of 1127.78 km2. The terrain of this area is relatively flat and mainly composed of low mountains, hills, and plains, and it has a subtropical monsoon climate with four distinct seasons. The main vegetation is evergreen and deciduous broad-leaved forest, which is suitable for supporting a variety of bird habitats. Simultaneously, this area is a megapolis in the Yangtze Delta urban agglomeration with a developed economy, a large population [39], and an urbanization rate of more than 86% [40]. The unique coexistence of high bird diversity and a high urban rate in this area provides an ideal research area for exploring solutions to the harmonious coexistence of birds and humans.

2.2. Environment Variables

2.2.1. Data Sources

The bird distribution data were obtained from the China Bird Watching Records Center website (http://www.birdreport.cn/, (accessed on 15 September 2023)), and all the birding records uploaded by volunteers in the study area from 2017 to 2021 were selected. To ensure model accuracy and to eliminate model bias caused by spatial autocorrelation, this paper only selected birds with more than 10 occurrences as research objects; only 1 distribution site record for each species was retained in each grid, and a total of 4391 bird-watching records with clear latitudinal and longitudinal information were ultimately chosen.
The meteorological data were obtained from the 1 km resolution monthly mean temperature, maximum temperature, minimum temperature, and precipitation dataset (1901–2022) of the Institute of Tibetan Plateau Research [41,42]. Based on the monthly mean, maximum, and minimum temperatures, as well as precipitation data from the Nanjing urban area spanning 1991 to 2020, various climate indices were calculated; the vegetation coverage index was obtained from the MODIS data product (MOD13Q1), and the average value of the Eco-environment Vulnerability Index (EVI) for the Nanjing megapolis in 2020 was extracted with a spatial resolution of 250 m; the night light index was from 2020. The night-light remote sensing image of the NPP-VIIRS (Visible Infrared Imaging Radiometer) was taken in 2014 with a spatial resolution of approximately 500 m; the altitude of the Nanjing megapolis was obtained from the STRM (Shuttle Radar Topography Mission) elevation data, which were compiled by NASA and the National Imagery and Mapping Agency (NIMA). The spatial resolution of the data was 90 m, and the topographic relief was calculated based on altitude data. The population density data were obtained from WorldPop population data (www.worldpop.org, (accessed on 29 September 2023)) with a resolution of 100 m. The density was obtained from the 2020 Baidu map road data, and ArcGIS 10.2 software was used to calculate the road density. The water and forest data were obtained from the 30 m global land-cover data GlobeLand30 2020. These data are global land-cover data developed in China, and they have a 30 m spatial resolution. The water and forest data in the Nanjing megapolis were extracted, and the distances to the waters and forests were calculated using ArcGIS 10.2 software. The above data were uniformly resampled to a resolution of 100 m.

2.2.2. Environment Variable Selection

Based on previous studies [43,44], combined with the environmental characteristics of bird habitats and considering the three aspects of meteorology, habitat, and disturbance, we selected 17 environmental variables that affect bird distribution to construct our model (Table 1). Because of certain correlations among some environmental variables, overfitting of the model analysis results may occur. Therefore, this paper conducted screening and correlation analysis on environmental variables [45]. First, all environmental variables were preliminarily simulated in the model to obtain the contribution rate of each environmental variable to the model, and the environmental variables with a cumulative contribution rate of more than 95% were selected. Then, we analyzed the correlation of environmental variables [46] and found that if the absolute value of the correlation coefficient between two environmental variables was greater than 0.8, only the variable with a larger contribution rate in the initial simulation was retained [47]. Finally, 11 of 17 environmental variables were selected as inputs for model simulations (Table 1, Figure 2).

2.3. Model Building

The Maximum Entropy principle was first proposed by Jaynes [48], and the formula is expressed as follows:
S P P 0 = i P i l n P i P 0 i
where S represents entropy and P 0 is the prior distribution under known conditions P . P i refers to the occurrence probability of i . The MaxEnt model is a machine learning model developed by Phillips et al. based on this principle and can simulate the potential distribution of target species in the study area based on the actual species distribution sites and the environmental variables in the species distribution area [49]. It has high precision and requires a small number of samples [31,32], so it is suitable for the present study, which focuses on small scale and high resolution, and it is used to hypothesize the potential distribution of each bird species in cities.
Seventy-five percent of the data were selected as training data, and the remaining twenty-five percent were used as the test set for model validation. The maximum number of iterations of the model run was set to 5000. The model was run repeatedly 10 times. The logistic mode was selected as the result output type, and the rest of the default parameters were used [49].

2.4. Model Evaluation

The reliability of the prediction results was evaluated by using the area under the curve (AUC) of the receiver operating characteristic (ROC) [49,50,51,52]. The evaluation criteria are described as follows: poor (0.6–0.7), fair (0.7–0.8), good (0.8–0.9), and excellent (0.9–1.0) [53,54,55]. In this paper, the AUC values of all the birds were between 0.795 and 0.974, indicating that there are certain differences between different species. The average AUC was 0.86, indicating that each model had good prediction accuracy and could be used for the prediction of the spatial distribution of bird diversity.
In this paper, the contribution degree and permutation importance index in the MaxEnt model were used to comprehensively evaluate the importance of environmental variables. The contribution degree focused on quantifying the specific impact of each environmental variable on the model prediction results and determined the features in the model that are the key factors dominating the prediction results, while the permutation importance determined the environmental variables that were critical to maintaining the model’s performance [56].
According to the equal training sensitivity and specificity logistic threshold of each bird in the MaxEnt model [57,58], the prediction results of each bird model were converted from the logistic distribution probability values to binomial values of 0–1. That is, if the distribution probability of a certain bird species in a certain grid was greater than the threshold, there was a distribution in this grid (1); otherwise, there was no distribution (0). The raster calculator tool in ArcGIS was used to perform overlay analysis on the binarized distribution predictions of each bird to obtain the spatial distribution map of bird diversity.

3. Results

3.1. Bird Species Composition in the Nanjing Urban Area

In this study, a total of 79 bird species at 277 distribution sites were selected. From a taxonomic perspective, these birds are part of 12 orders, 33 families, and 62 genera. Passeriformes accounted for the largest number of species, accounting for 55.70% of all species (Table 2). In terms of migration patterns, there were 63 species of migratory birds (79.7%) and 16 species of resident birds (20.3%) [59].

3.2. Spatial Distribution of Bird Diversity

The bird diversity spatial distribution in the Nanjing urban area showed significant heterogeneity. The areas with the maximum value of bird diversity were mainly concentrated in the mountains and hills in the urban area and its vicinity (e.g., Zhongshan Mountain and its northern part, Laoshan Mountain and its surrounding areas, and Fangshan Mountain and its northeastern part). The area with the second-most bird diversity was composed of four parts. The first part was located in the extension of the area with the highest value; the second part was concentrated in a smaller, mountainous area and its surroundings (such as Jiangjun Mountain, Niushou Mountain, and Qixia Mountain); the third part was in the parks inside the study area (such as Bailuzhou Park, Gulin Park, and Qingliangshan Park); and the last part was along the coast of large areas of water, on the islands in the center of the lake or the islands in the center of the river (such as the wetlands along the Yangtze River and Xuanwu Lake). From the perspective of land use, the areas with high bird diversity were mainly distributed in forests and wetlands, while there were fewer artificial surfaces and cultivated land. For example, the north bank of the Yangtze River was mainly populated by residential buildings, and bird diversity was lower than that on the south bank, which has more natural tidal flats. From the perspective of bird classification, the overall distribution area of migratory birds and resident birds was generally the same, with the difference being that the distribution of resident birds was more concentrated in large areas of mountains and hills and around large areas of water bodies. From the perspective of administrative area, Xuanwu District had the highest bird diversity, Yuhuatai District and Qinhuai District had the least, and Pukou District and Jiangning District had an uneven distribution of bird diversity, with a high concentration around the mountains. In general, birds were mainly distributed in forests and surrounding habitats (Figure 3).

3.3. The Importance of Environmental Variables

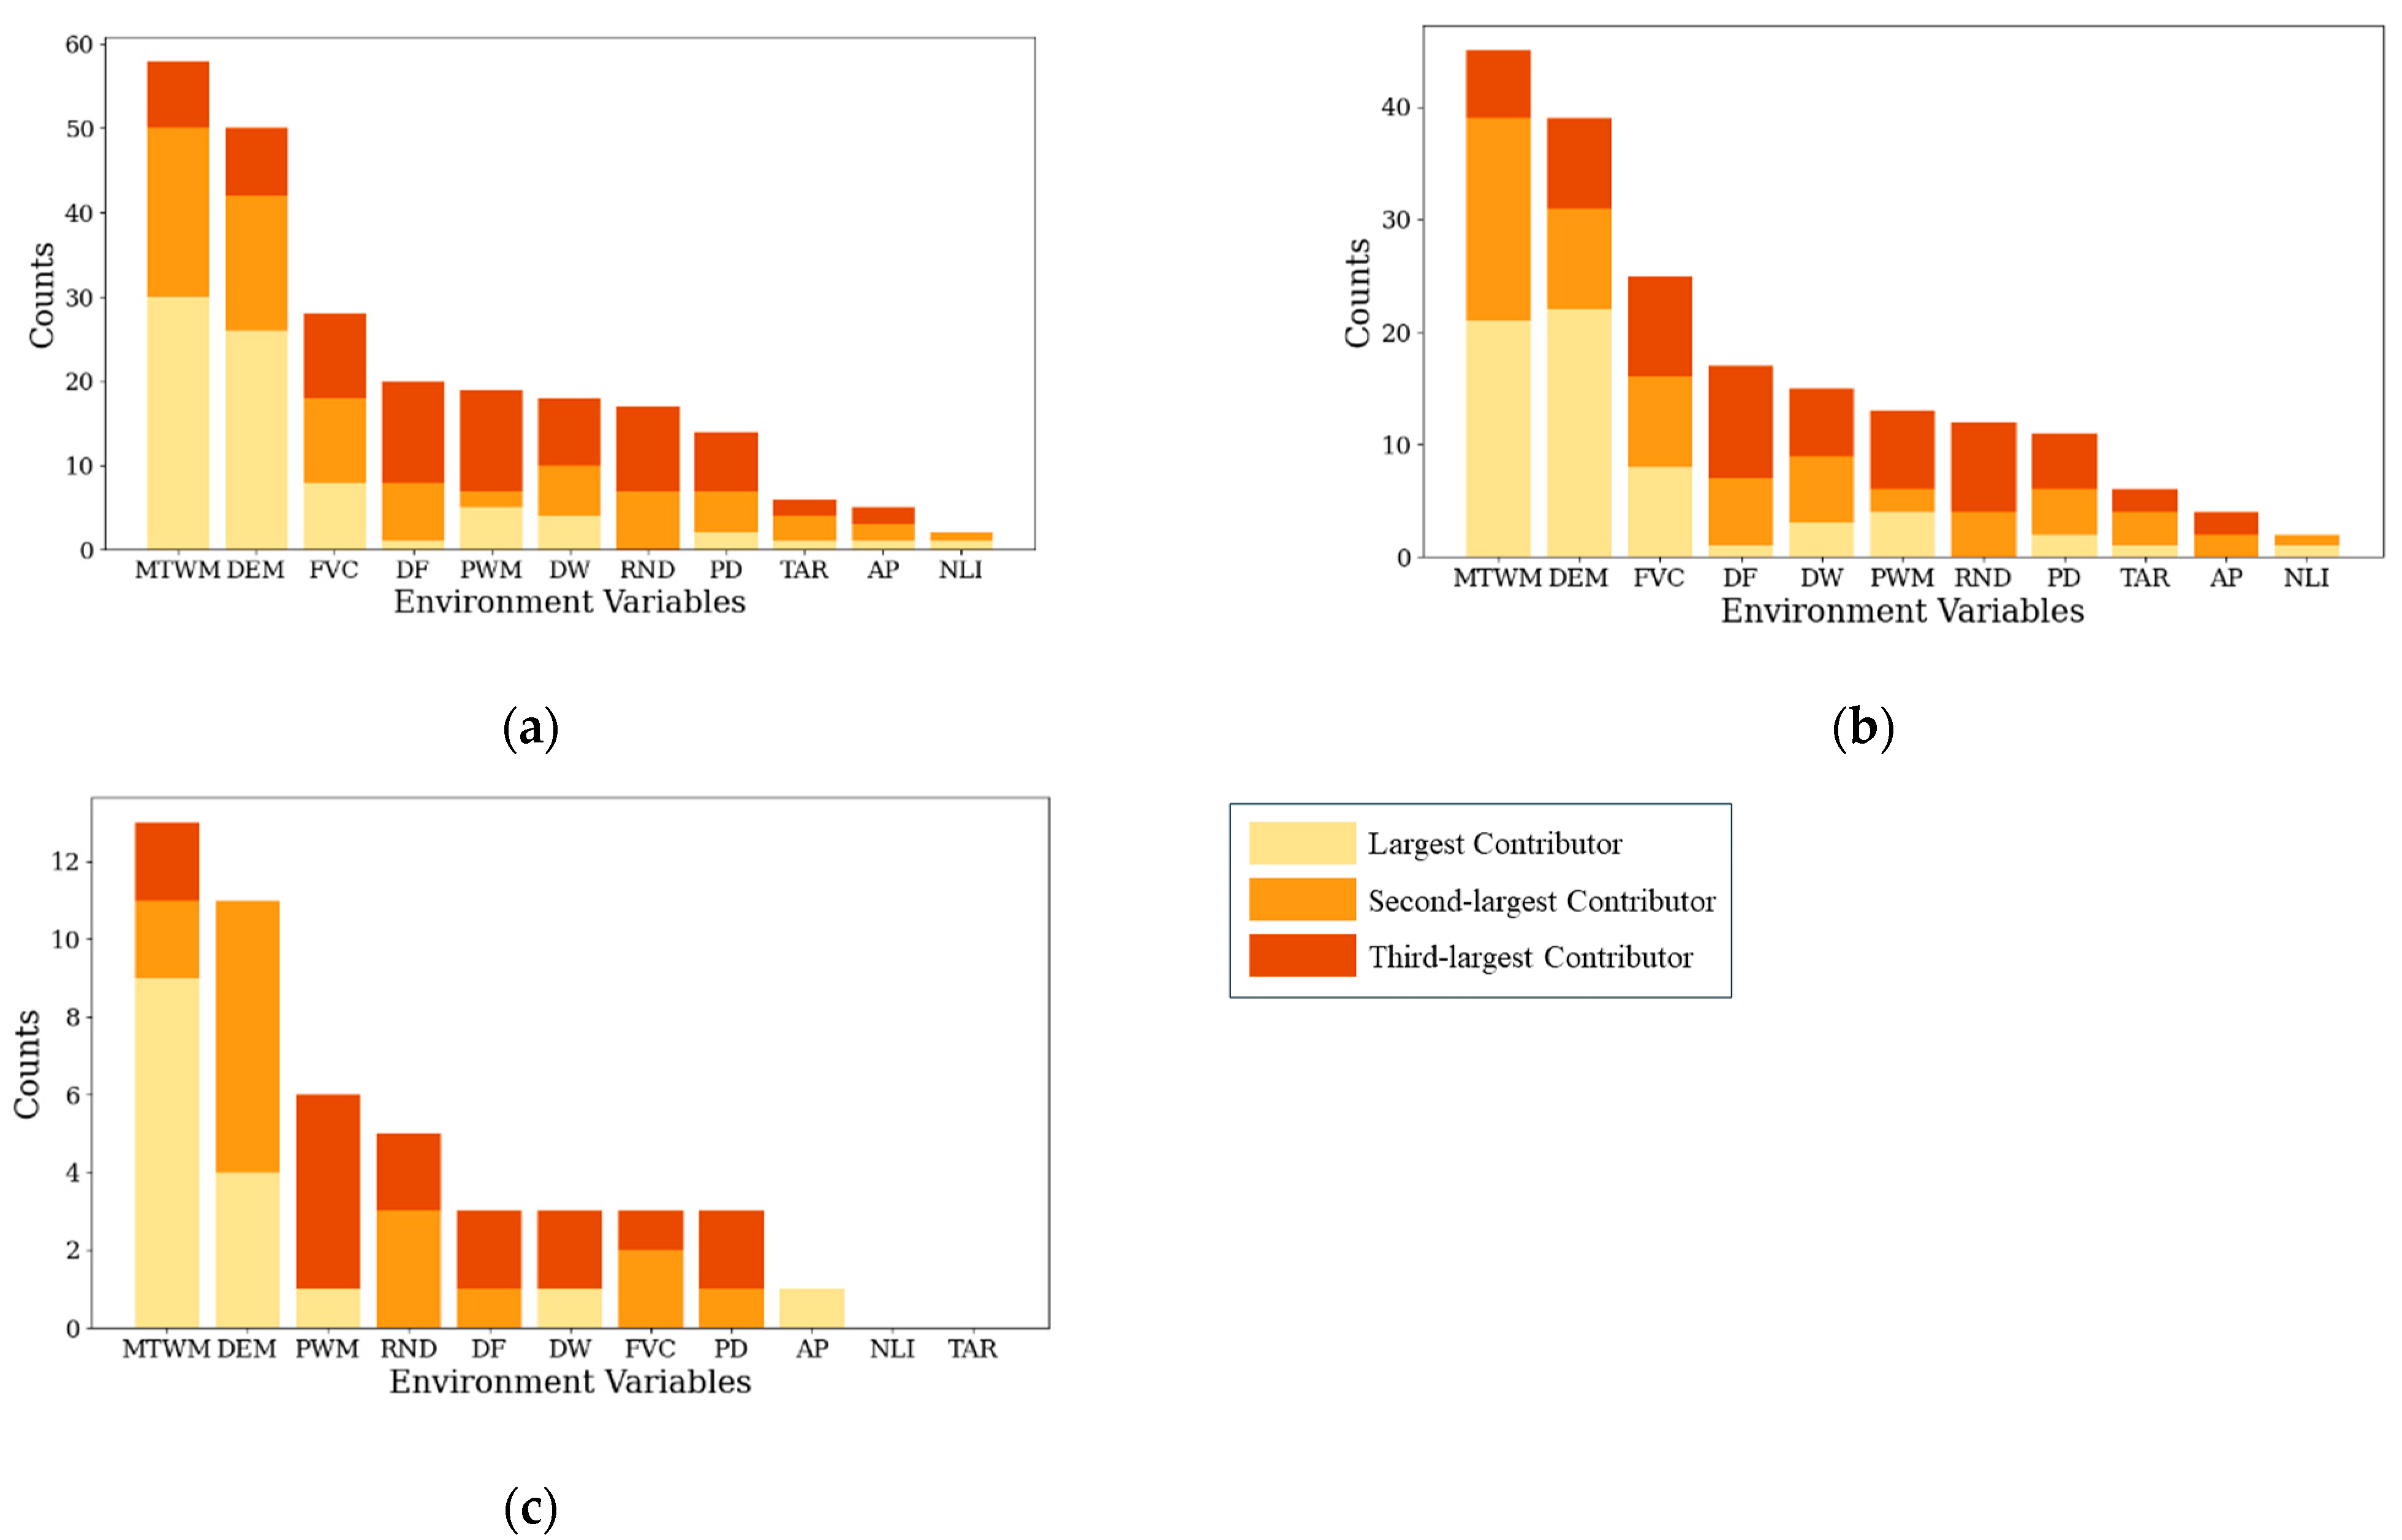
3.3.1. Permutation Importance of Environmental Variables

The permutation importance ranking for the five key environmental variables for all birds is as follows: MTWM (24.68%), PWM (8.60%), DEM (7.56%), DF (6.75%), and DW (6.13%). For migratory birds, the leading variables are MTWM (25.01%), DEM (7.55%), PWM (7.42%), DF (7.13%), and FVC (5.98%). In contrast, for resident birds, the top contributors are MTWM (21.21%), PWM (10.08%), RND (7.13%), DEM (7.03%), and AP (6.61%). These environmental variables are critical to maintaining model performance (Figure 4).
To determine the environmental variables that are important for maintaining the model’s performance, the number of times each variable was ranked among the top three in permutation importance for each species was tallied. The number of times that MTWM (67 times) was ranked as one of the top three in permutation importance for each species was far higher than the number of times for other environmental variables. Compared with migratory birds, the PWM and AP of resident birds had a greater impact on the model. In general, MTWM (67 times), PWM (32 times), DF (26 times), DEM (25 times), DW (19 times), and FVC (15 times) were ranked among the top three in permutation importance for various species at least 15 times, indicating their significant role in the accuracy of the model (Figure 5).

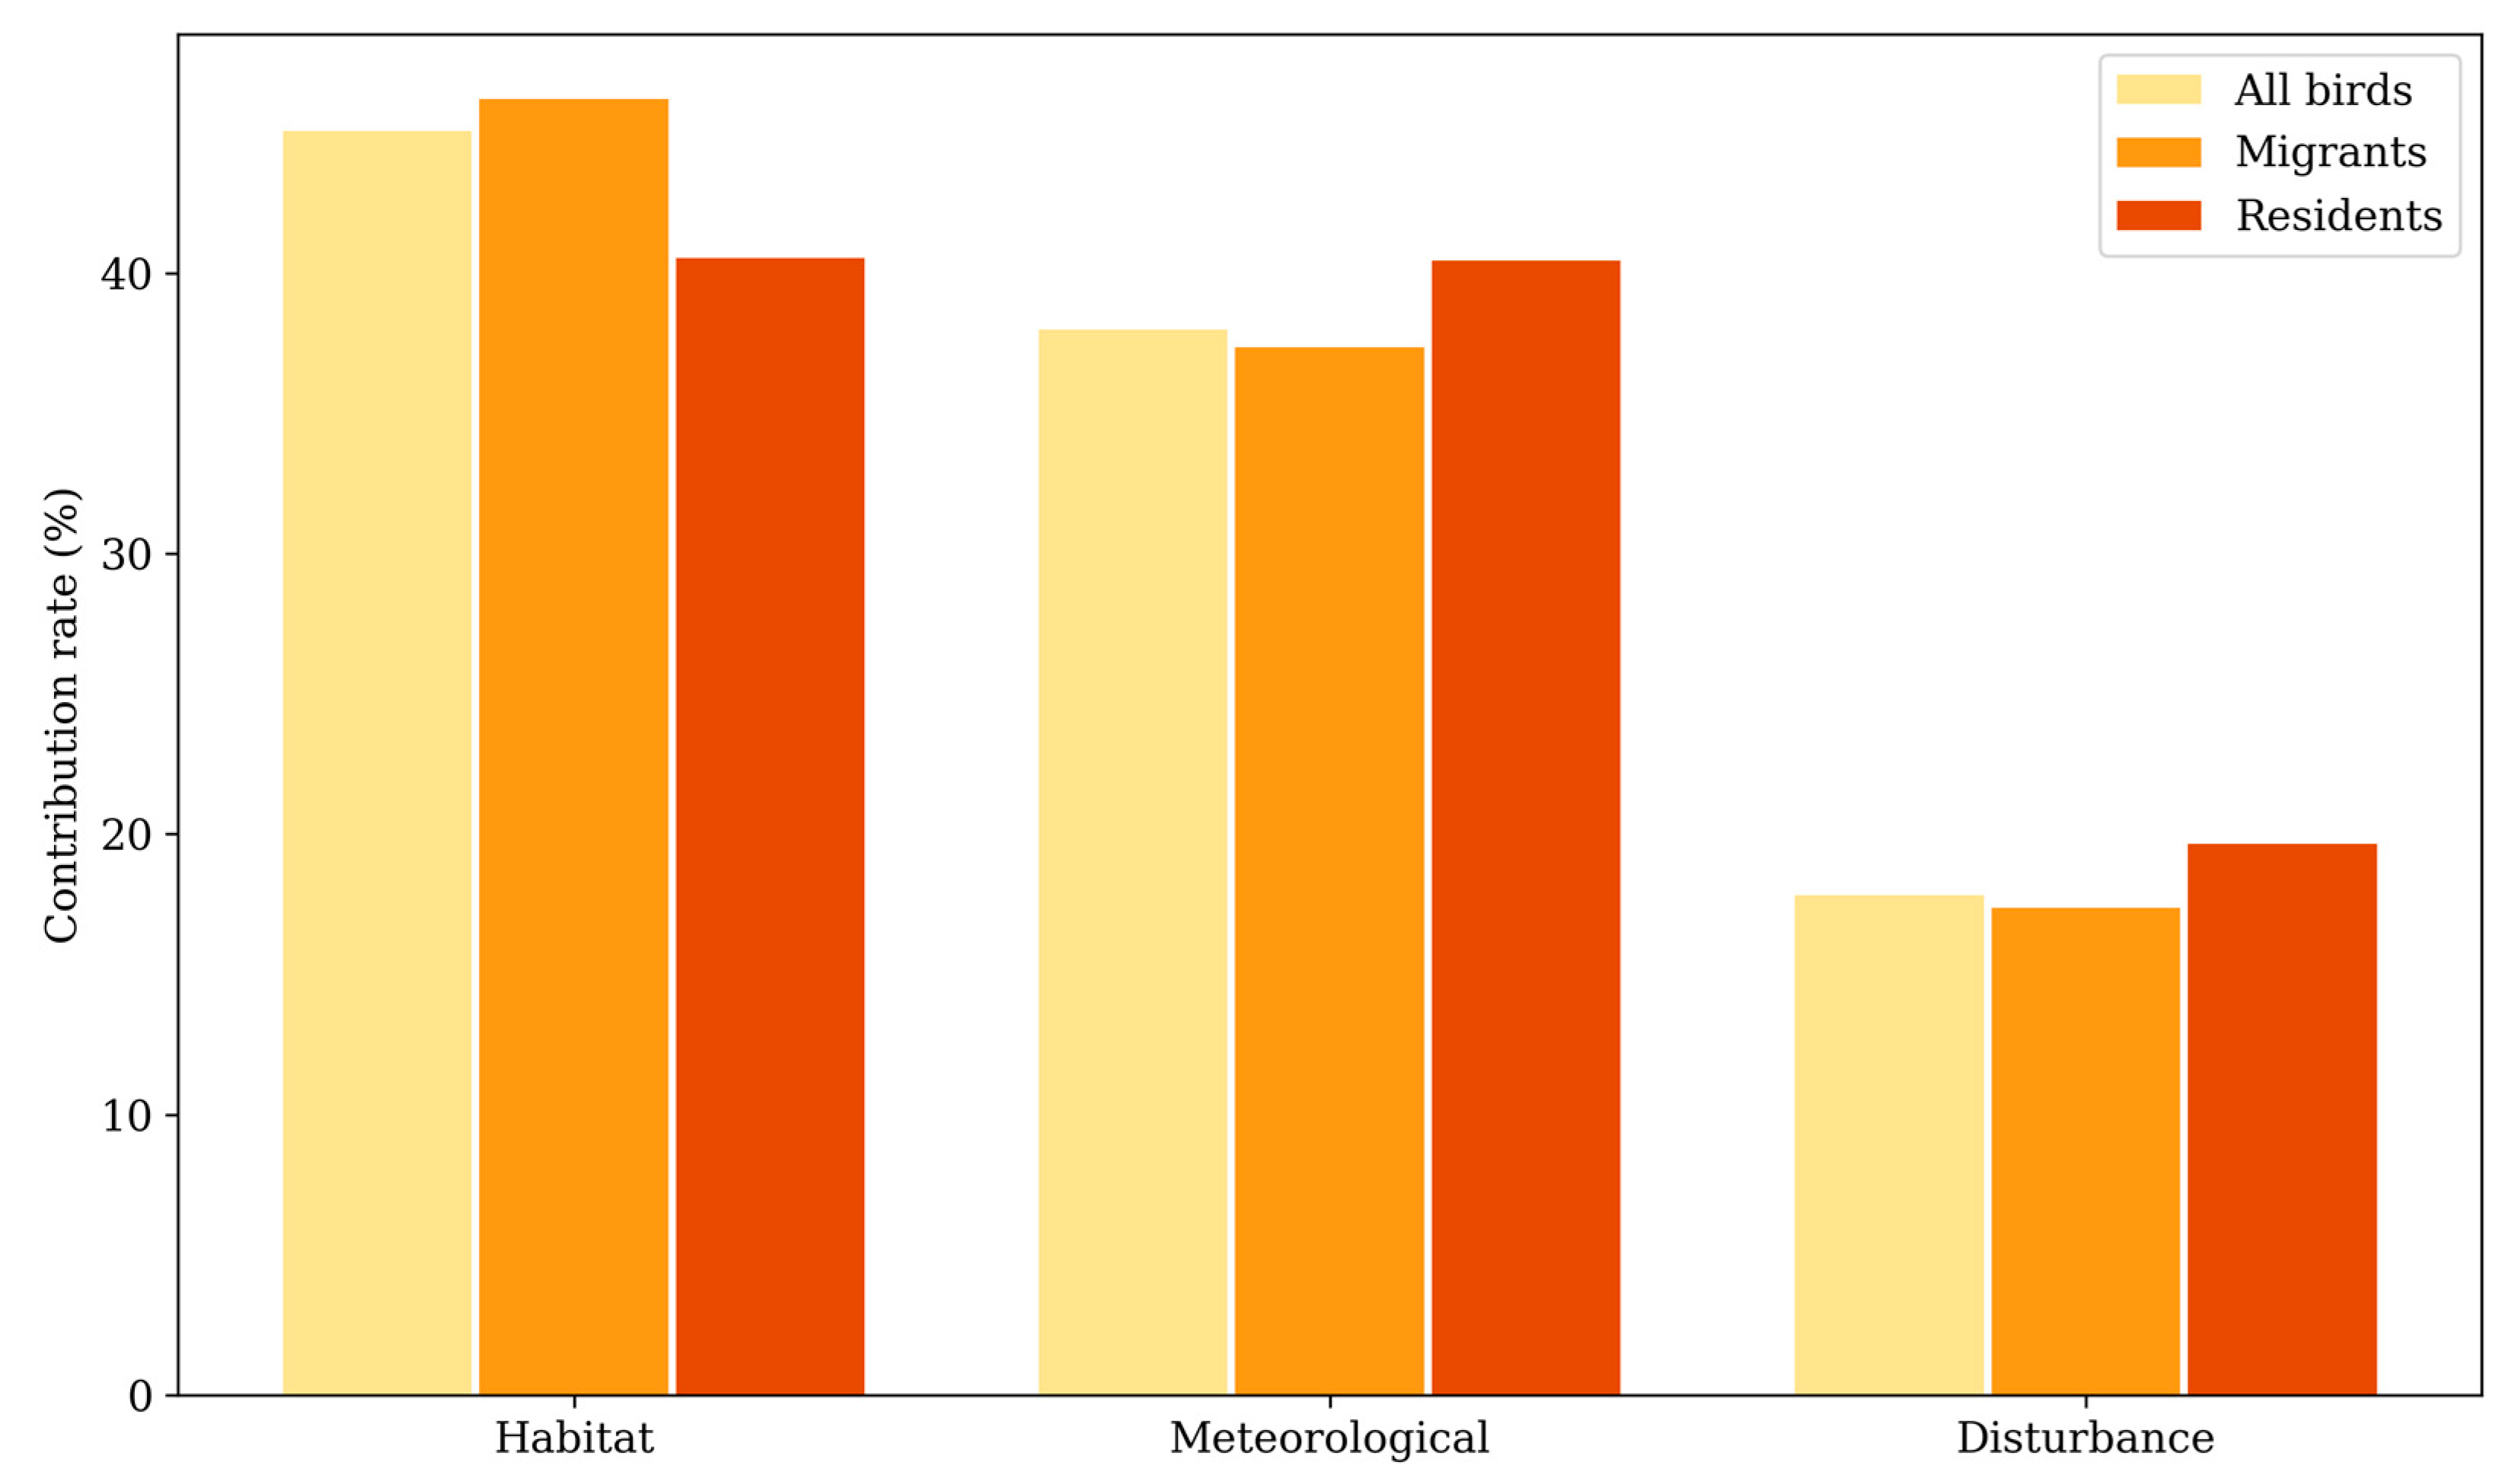
3.3.2. Contribution Rate of Environmental Variables

The contribution rate analysis revealed a generally normal distribution for all environmental variables. However, there were more outliers above the upper quartile, reflecting the differences in the habits of different birds and the significant differences in environmental factors among the different birds. The top five contributors to the median contribution rate for all birds were MTWM (18.86%), DEM (15.25%), FVC (7.83%), DF (7.75%), and PWM (7.30%). The contributors for migratory birds were MTWM (17.81%), DEM (15.25%), FVC (8.75%), DF (7.59%), and DW (7.03%), while the contributors for resident birds were MTWM (23.78%), DEM (15.27%), PWM (9.48%), PD (8.16%), and RND (7.44%). Compared with migratory birds, the contribution of the disturbance environmental variables to the resident birds was greater (Figure 6).
For all species, the proportion of species with MWTM (58 times) and DEM (50 times) as the top three contribution rates was higher than that of other environmental variables. For all bird species, MTWM (58 times), DEM (50 times), FVC (28 times), DF (20 times), and PWM (19 times) appeared more among the top three contribution rates and were more important for bird diversity distribution. FVC was more important to migratory birds, and PWM was more important to resident birds (Figure 7).

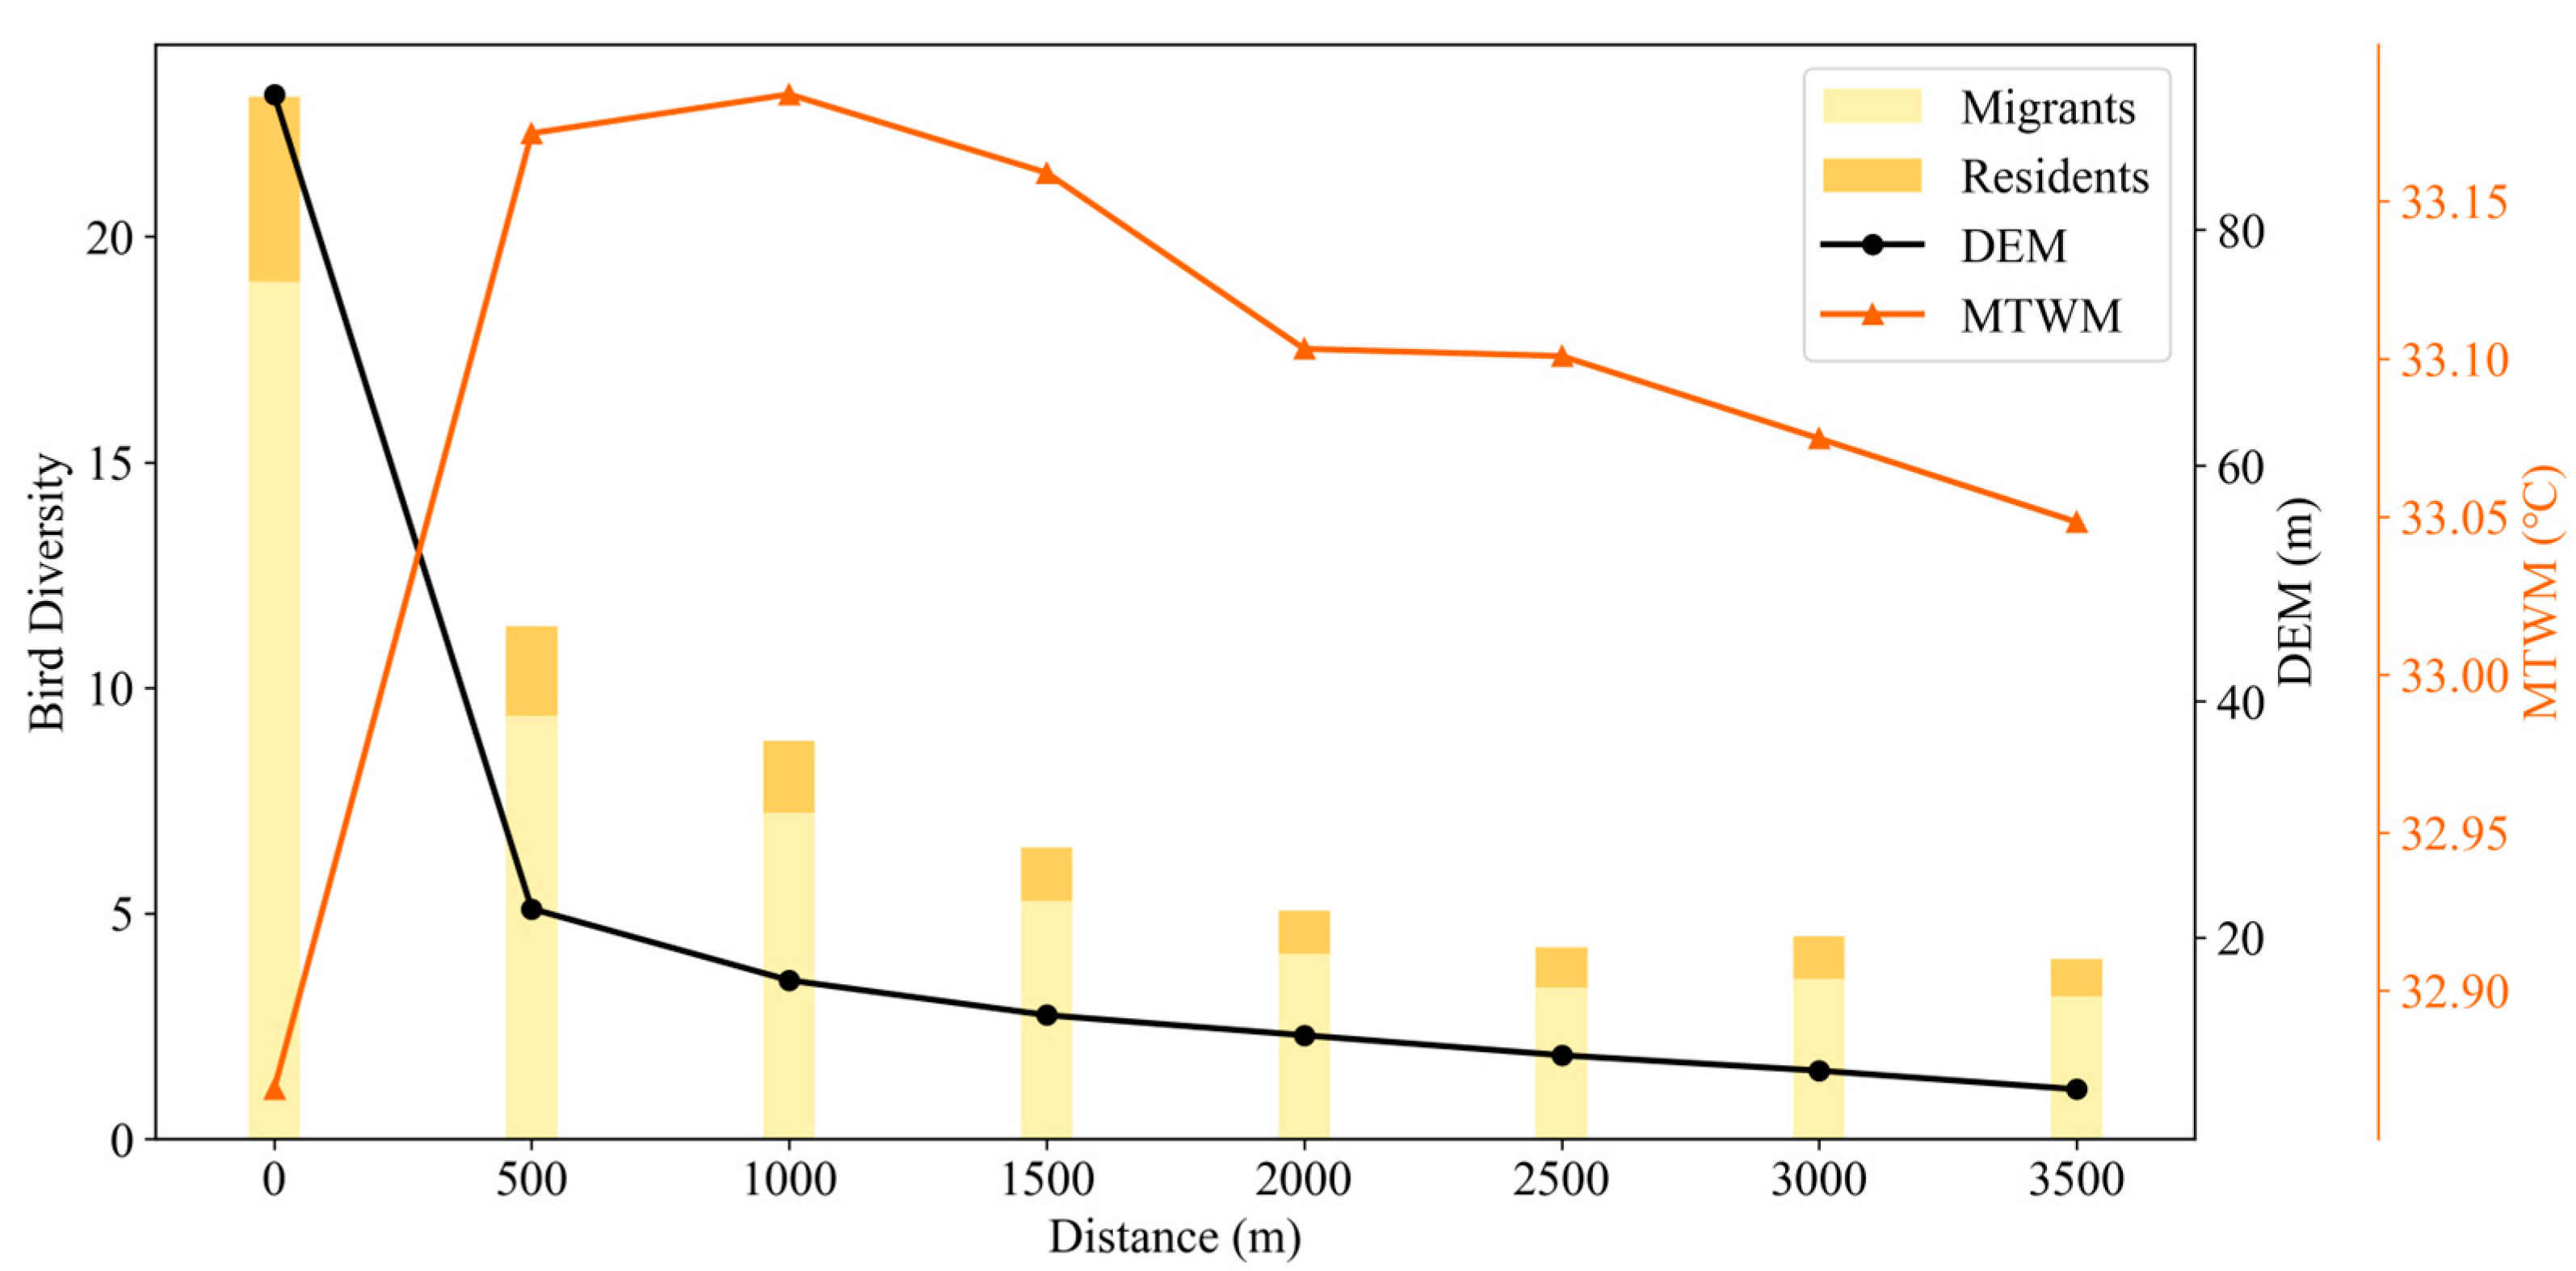
3.4. Effects of Environmental Variables

Based on permutation importance and contribution rate, the most important environmental variables that affected the distribution of bird diversity were MTWM, DEM, FVC, DF, and PWM. Through correlation analysis [46], we further studied their positive and negative contributions to bird diversity to elaborate on the influences of the first five environmental variables.
MTWM, PWM, and DF were negatively correlated with bird diversity, indicating that the temperature of the warmest month was lower, the precipitation of the warmest month was lower, and the areas close to forests had higher bird diversity. FVC and DEM were positively correlated with bird diversity, indicating that bird diversity is high in areas with high vegetation coverage and high altitude. Among them, the correlation coefficient between MTWM and bird diversity had the largest absolute value (Table 3). The environmental variables all passed the significance test at the 0.01 level [60]. The negative effects of MTWM, PWM, and DF on bird diversity and the positive effects of FVC and DEM on bird diversity are credible and consistent with the current study [61,62,63].
Based on the analysis of positive and negative contributions, we further analyzed the causes and relationships of the five most important environmental variables. According to the previous analysis, bird diversity was higher in places close to forests and with high vegetation coverage (Figure 3). In contrast, the Nanjing urban area had a relatively large area of forest-covered mountains and hills, i.e., areas with higher DEM values had low DF values (low values represent areas close to forests) and high FVC values, making DEM a more important environmental variable (Figure 2e,g,h). Among these five environmental variables, MTWM had the largest impact on bird diversity. The temperature of the warmest month near forests was lower, while the high-value areas of bird diversity were also distributed in large areas of mountains and hills, showing a clear negative correlation between the two. PWM also has a great impact on the model, which is consistent with the results of Yuan et al. [64]. The loss of heat from the body after their feathers become wet would be accelerated [65]. During the months with the most precipitation, birds may tend to reduce their activity range and focus on forests that provide more shelter from rain. Therefore, the five most important environmental variables reflected the importance of habitat on the distribution of bird diversity to varying degrees (Figure 8).
In order to understand the impact of three different types of environmental variables on birds, this paper conducts statistics on meteorological environmental variables, habitat environmental variables, and interference environmental variables. For all bird species, meteorological variables accounted for 37.97% of the total environmental factors, habitat variables for 45.05%, and disturbance variables for 17.83%. Therefore, for the impact on birds in the Nanjing urban area, habitat environment variables > meteorological environment variables > interference environment variables (Figure 9), which is consistent with the study of Liu et al. [66].

4. Discussion

In order to provide a more effective basis for bird protection in megacities, this paper further explores the impact mechanisms of three types of environmental variables on the distribution of birds in the Nanjing megapolis. In the urban area of Nanjing, habitat environmental variables have the greatest impact on bird distribution (Figure 9). This substantial impact likely stems from the strong dependency of bird communities on food sources and habitats within the environment, reflecting the intimate connection between habitats and urban avian populations [67]. Urban forests provide ideal shelters, nesting sites, and foraging environments for birds and thus are important habitats for birds [68,69]. Although meteorological environment variables are related to bird diversity, the study area is concentrated in built-up areas with relatively small scale, and the differences in meteorological environment variables within the region are relatively small; therefore, its impact on the distribution of birds is second only to the habitat environmental variables. The contribution of disturbance environmental variables to bird distribution, although relatively minor, is primarily attributed to the direct effects of human activities. Based on the contribution analysis of the three types of environmental variables, the forest habitats of birds should be protected, and disturbances from human activities affecting birds should be reduced.
The scientific novelty of this paper primarily lies in the application of the MaxEnt model to a relatively small area of a megapolis, as opposed to broader regions such as states, countries, or even transnational areas [36,70,71]. The challenges of small-scale research are twofold: first, the smaller study area yields fewer bird observation data; second, the internal environmental variables, especially meteorological ones, exhibit less heterogeneity, demanding higher data resolution. The chosen study area provided over 4000 valid data points. Coupled with the high precision of the MaxEnt model and its ability to operate with minimal samples, the first challenge was effectively overcome. For the second challenge, the high resolution of meteorological data ensured the accuracy of the research findings [41,42]. Furthermore, there have been a few studies that focused on city areas (including rural zones) and successfully applied the MaxEnt model to analyze the potential distribution of birds. For instance, Wang et al. examined the distribution of 10 flagship bird species in Lishui city [72], and Chen et al. studied the distribution of 6 representative bird species in Wuhan city [73]. These studies further substantiate the applicability of MaxEnt to small-scale studies.
This paper offers direct practical value for government departments responsible for wildlife conservation and urban planning in terms of planning and management decisions. The predicted potential distribution areas for birds can be compared with existing nature reserves to identify gaps in bird conservation [58], which assists in determining conservation priorities and devising strategies for precise protection of avian species. These predictions can also be applied to the planning and rational assessment of the Nanjing Habitat Networks [40], aiming to foster a harmonious coexistence between humans and birds in the megapolis. The analysis of the contribution of environmental variables to bird distribution underscores the extreme importance of habitat conditions in megacities for avian populations. These findings not only provide a basis for government authorities to prioritize the protection of urban bird habitats but can also be used to raise public awareness and involvement in the conservation of urban bird diversity [73]. However, like many similar studies, this paper shares common limitations regarding urban management and conservation actions, notably that the bird data are sourced from volunteer uploads and records for certain bird species are sparse, potentially leading to errors in the model results [74]. In the future, it is essential to assess the viability of this research in additional megapolises that are severely challenged by both climate change and urbanization.

5. Conclusions

In this paper, to explore the harmonious symbiosis between humans and birds considering the background of global climate change and urbanization, the MaxEnt model was applied to simulate the megapolis-scale bird distribution, revealing the spatial distribution of bird diversity and identifying its most significant environmental variables in the Nanjing urban area from 2017 to 2021. The main conclusions regarding the important environmental variables are described as follows:
(1)
Based on the distribution site data of 17 environmental variables and 79 bird species, the MaxEnt model was used to simulate the potential distribution of various birds in the Nanjing urban area. The validation result (AUC = 0.86) was very good and can be used to simulate the latent distribution of bird diversity in the Nanjing urban area.
(2)
The areas with the highest bird diversity are mainly concentrated in the mountains and hills and near the Nanjing urban area (such as Zhongshan and its northern part, Laoshan and its surrounding areas, Fangshan and its northeastern part, etc.), and resident birds are more distributed in high-diversity areas than migratory birds.
(3)
Based on the permutation importance and contribution rate, the five most important environmental variables for bird diversity distribution were ranked as MTWM > DEM > PWM > DF > FVC. MTWM, PWM, and DF were negatively correlated with bird diversity, while FVC and DEM were positively correlated with bird diversity. The disturbance of environmental variables had a greater impact on the distribution of resident birds than that of migratory birds.
(4)
The ranking of the contribution of the three major types of environmental variables is habitat environmental variables > meteorological environmental variables > disturbance environmental variables. The five most important environmental variables and three major environmental variables show that the habitat environment is very important to the diversity of urban birds. During the development of cities, sufficient habitats for birds should be retained, and disturbances from human activities should be reduced.

Author Contributions

Conceptualization, Y.W. and J.L. (Jingcheng Lai); methodology, Y.W. and J.L. (Jingcheng Lai); software, J.L. (Jingcheng Lai); validation, T.H., Y.L. and J.L. (Jishuang Liu); formal analysis, Y.Z.; resources, Y.W.; data curation, Y.W.; writing—original draft preparation, J.L. (Jingcheng Lai); writing—review and editing, Y.W.; visualization, J.L. (Jingcheng Lai); supervision, Y.W.; project administration, Y.W. All authors have read and agreed to the published version of the manuscript.

Funding

This research was funded by the Jiangsu Students’ Platform for Innovation and Entrepreneurship Training Program, grant number 202310300137Y, and the National Key R&D Program of China, grant number 2019YFB2102003.

Institutional Review Board Statement

Not applicable.

Informed Consent Statement

Not applicable.

Data Availability Statement

The data presented in this study are available on request from the corresponding author.

Conflicts of Interest

The authors declare no conflicts of interest.

References

  1. Barnosky, A.D.; Matzke, N.; Tomiya, S.; Wogan, G.O.U.; Swartz, B.; Quental, T.B.; Marshall, C.; McGuire, J.L.; Lindsey, E.L.; Maguire, K.C.; et al. Has the Earth’s sixth mass extinction already arrived? Nature 2011, 471, 51–57. [Google Scholar] [CrossRef]
  2. Rands, M.R.W.; Adams, W.M.; Bennun, L.; Butchart, S.H.M.; Clements, A.; Coomes, D.; Entwistle, A.; Hodge, I.; Kapos, V.; Scharlemann, J.P.W.; et al. Biodiversity Conservation: Challenges Beyond 2010. Science 2010, 329, 1298–1303. [Google Scholar] [CrossRef]
  3. Zivanovic, A.J.; Luck, G.W. Social and environmental factors drive variation in plant and bird communities across urban greenspace in Sydney, Australia. J. Environ. Manag. 2016, 169, 210–222. [Google Scholar] [CrossRef]
  4. Hahs, A.K.; Fournier, B.; Aronson, M.F.J.; Nilon, C.H.; Herrera-Montes, A.; Salisbury, A.B.; Threlfall, C.G.; Rega-Brodsky, C.C.; Lepczyk, C.A.; La Sorte, F.A.; et al. Urbanisation generates multiple trait syndromes for terrestrial animal taxa worldwide. Nat. Commun. 2023, 14, 4751. [Google Scholar] [CrossRef]
  5. Silva, J.L.S.; de Oliveira, M.T.P.; Cruz-Neto, O.; Tabarelli, M.; Lopes, A.V. Plant–pollinator interactions in urban ecosystems worldwide: A comprehensive review including research funding and policy actions. Ambio 2021, 50, 884–900. [Google Scholar] [CrossRef]
  6. Gregory, R.; Noble, D.; Field, R.; Marchant, J.; Raven, M.J.; Gibbons, D. Using birds as indicators of biodiversity. Ornis Hung. 2003, 12, 11–24. [Google Scholar]
  7. Panwar, H.; Dhote, M. Toolkit for Conservation of Urban Biodiversity: A Web or Mobile App-Based Tool for Conserving Biodiversity in Urban Areas. In Handbook of Research on Sustainable Development Goals, Climate Change, and Digitalization; Castanho, R.A., Ed.; IGI Global: Hershey, PA, USA, 2022; pp. 506–519. [Google Scholar]
  8. Jawon, L. Lesson for New Urbanism from the Traditional Space in East Asia. Int. J. Adv. Cult. Technol. 2018, 6, 143–151. [Google Scholar] [CrossRef]
  9. Chace, J.F.; Walsh, J.J. Urban effects on native avifauna: A review. Landsc. Urban Plan. 2006, 74, 46–69. [Google Scholar] [CrossRef]
  10. Gaston, K.J.; Blackburn, T.M. Mapping biodiversity using surrogates for species richness: Macro-scales and New World birds. Proc. R. Soc. London. Ser. B Biol. Sci. 1995, 262, 335–341. [Google Scholar] [CrossRef]
  11. Khera, N.; Mehta, V.; Sabata, B.C. Interrelationship of birds and habitat features in urban greenspaces in Delhi, India. Urban For. Urban Green. 2009, 8, 187–196. [Google Scholar] [CrossRef]
  12. Tiwary, N.K.; Urfi, A.J. Spatial variations of bird occupancy in Delhi: The significance of woodland habitat patches in urban centres. Urban For. Urban Green. 2016, 20, 338–347. [Google Scholar] [CrossRef]
  13. Wu, J. Urban ecology and sustainability: The state-of-the-science and future directions. Landsc. Urban Plan. 2014, 125, 209–221. [Google Scholar] [CrossRef]
  14. Ma, L.; Conradie, S.R.; Crawford, C.L.; Gardner, A.S.; Kearney, M.R.; Maclean, I.M.D.; McKechnie, A.E.; Mi, C.R.; Senior, R.A.; Wilcove, D.S. Global patterns of climate change impacts on desert bird communities. Nat. Commun. 2023, 14, 211. [Google Scholar] [CrossRef]
  15. Martinez-Ruiz, M.; Dykstra, C.R.; Booms, T.L.; Henderson, M.T. Conservation Letter: Effects of Global Climate Change on Raptors. J. Raptor Res. 2023, 57, 92–105. [Google Scholar] [CrossRef]
  16. Lemoine, N.; Schaefer, H.C.; Böhning-Gaese, K. Species Richness of Migratory Birds Is Influenced by Global Climate Change. Glob. Ecol. Biogeogr. 2007, 16, 55–64. [Google Scholar] [CrossRef]
  17. Williams, S.E.; Middleton, J. Climatic Seasonality, Resource Bottlenecks, and Abundance of Rainforest Birds: Implications for Global Climate Change. Divers. Distrib. 2008, 14, 69–77. [Google Scholar] [CrossRef]
  18. Wilsey, C.; Taylor, L.; Bateman, B.; Jensen, C.; Michel, N.; Panjabi, A.; Langham, G. Climate Policy Action Needed to Reduce Vulnerability of Conservation-Reliant Grassland Birds in North America. Conserv. Sci. Pract. 2019, 1, e21. [Google Scholar] [CrossRef]
  19. Grande, T.; Aguiar, L.; Machado, R. Heating a Biodiversity Hotspot: Connectivity Is More Important Than Remaining Habitat. Landsc. Ecol. 2020, 35, 639–657. [Google Scholar] [CrossRef]
  20. Quesnelle, P.E.; Fahrig, L.; Lindsay, K.E. Effects of habitat loss, habitat configuration and matrix composition on declining wetland species. Biol. Conserv. 2013, 160, 200–208. [Google Scholar] [CrossRef]
  21. Zorzal, R.R.; Diniz, P.; Oliveira, R.d.; Duca, C. Drivers of avian diversity in urban greenspaces in the Atlantic Forest. Urban For. Urban Green. 2021, 59, 126908. [Google Scholar] [CrossRef]
  22. Wang, T.; Zhou, L. The spatial-temporal patterns of bird diversity and its determinants in the small wetlands in Hefei City. Biodivers. Sci. 2022, 30, 21445. [Google Scholar] [CrossRef]
  23. Tzortzakaki, O.; Kati, V.; Kassara, C.; Tietze, D.T.; Giokas, S. Seasonal patterns of urban bird diversity in a Mediterranean coastal city: The positive role of open green spaces. Urban Ecosyst. 2018, 21, 27–39. [Google Scholar] [CrossRef]
  24. Gopal, B. Does inland aquatic biodiversity have a future in Asian developing countries? Hydrobiologia 2005, 542, 69–75. [Google Scholar] [CrossRef]
  25. Liu, Z.; Zhou, Y.; Yang, H.; Liu, Z. Urban green infrastructure affects bird biodiversity in the coastal megalopolis region of Shenzhen city. Appl. Geogr. 2023, 151, 102860. [Google Scholar] [CrossRef]
  26. Hou, P.; Bai, J.; Chen, Y.; Hou, J.; Zhao, J.; Ma, Y.; Zhai, J. Analysis on the hotspot characteristics of bird diversity distribution along the continental coastline of China. Front. Mar. Sci. 2022, 9, 1007442. [Google Scholar] [CrossRef]
  27. Yang, X.; Tan, X.; Chen, C.; Wang, Y. The influence of urban park characteristics on bird diversity in Nanjing, China. Avian Res. 2020, 11, 45. [Google Scholar] [CrossRef]
  28. Zhao, Z.; Borzée, A.; Li, J.; Chen, S.; Shi, H.; Zhang, Y. Urban Bird Community Assembly Mechanisms and Driving Factors in University Campuses in Nanjing, China. Animals 2023, 13, 673. [Google Scholar] [CrossRef] [PubMed]
  29. Busby, J. BIOCLIM—A bioclimate analysis and prediction system. Plant Prot. Q. 1991, 6, 8–9. [Google Scholar]
  30. Stockwell, D. The GARP modelling system: Problems and solutions to automated spatial prediction. Int. J. Geogr. Inf. Sci. 1999, 13, 143–158. [Google Scholar] [CrossRef]
  31. Li, Y.; Gao, X.; An, Q.; Sun, Z.; Wang, H. Ecological niche modeling based on ensemble algorithms to predicting current and future potential distribution of African swine fever virus in China. Sci. Rep. 2022, 12, 15614. [Google Scholar] [CrossRef] [PubMed]
  32. Liu, L.; Guan, L.; Zhao, H.; Huang, Y.; Mou, Q.; Liu, K.; Chen, T.; Wang, X.; Zhang, Y.; Wei, B.; et al. Modeling habitat suitability of Houttuynia cordata Thunb (Ceercao) using MaxEnt under climate change in China. Ecol. Inform. 2021, 63, 101324. [Google Scholar] [CrossRef]
  33. Bai, X.; Wang, W.; Jiang, W.; Shi, H.; Chen, K.; Chen, M. Simulation of Potential Suitable Distribution of Endangered Waterfowl and Its Gap Analysis of National Nature Reserves in Beijing-Tianjin-Hebei Region under Climate Change Scenarios. Res. Environ. Sci. 2019, 32, 1001. [Google Scholar] [CrossRef]
  34. Kane, M.E.; Brewer, D.E.; Gehring, T.M.; Shirkey, B.T.; Pangle, K.L.; Uzarski, D.G.; Picciuto, M.A.; Simpson, J.W. King Rail (Rallus elegans) presence in the Midwestern United States is predicted by local-scale factors and avian community. Ecol. Evol. 2023, 13, e10732. [Google Scholar] [CrossRef]
  35. Moreno, R.; Zamora, R.; Molina, J.R.; Vasquez, A.; Herrera, M.Á. Predictive modeling of microhabitats for endemic birds in South Chilean temperate forests using Maximum entropy (Maxent). Ecol. Inform. 2011, 6, 364–370. [Google Scholar] [CrossRef]
  36. Venne, S.; Currie, D.J. Can habitat suitability estimated from MaxEnt predict colonizations and extinctions? Divers. Distrib. 2021, 27, 873–886. [Google Scholar] [CrossRef]
  37. Virkkala, R.; Leikola, N.; Kujala, H.; Kivinen, S.; Hurskainen, P.; Kuusela, S.; Valkama, J.; Heikkinen, R.K. Developing fine-grained nationwide predictions of valuable forests using biodiversity indicator bird species. Ecol. Appl. 2022, 32, e2505. [Google Scholar] [CrossRef] [PubMed]
  38. Wan, H.; Li, H.; Wu, J.; Liu, Y. Spatial distribution pattern in mammal and bird richness and their relationship with ecosystem services in Sanjiangyuan National Park, China. J. Mt. Sci. 2021, 18, 1662–1677. [Google Scholar] [CrossRef]
  39. Qin, X.; Wei, Y.; Yu, Z.; Xiong, N. Urbanization, Suburbanization, and Population Redistribution in Urban China: A Case Study of Nanjing. J. Urban Plan. Dev. 2022, 148, 05022034. [Google Scholar] [CrossRef]
  40. Ding, Z.; Cao, J.; Wang, Y. The Construction and Optimization of Habitat Networks for Urban–Natural Symbiosis: A Case Study of the Main Urban Area of Nanjing. Forests 2023, 14, 133. [Google Scholar] [CrossRef]
  41. Peng, S. 1-km Monthly Mean Temperature Dataset for China (1901–2021); National Tibetan Plateau/Third Pole Environment Data Center: Beijing, China, 2019. [Google Scholar] [CrossRef]
  42. Peng, S. 1-km Monthly Precipitation Dataset for China (1901–2021); National Tibetan Plateau/Third Pole Environment Data Center: Beijing, China, 2020. [Google Scholar] [CrossRef]
  43. Na, X.; Zang, S.; Zhang, Y.; Li, W. Assessing Breeding Habitat Suitability for the Endangered red-Crowned Crane (Grus japonensis) Based on Multi-Source Remote Sensing Data. Wetlands 2015, 35, 955–967. [Google Scholar] [CrossRef]
  44. Zhao, N.; Xia, S.; Yu, X.; Duan, H.; Li, J.; Chen, Y. Habitat suitability assessment of shorebirds in Bohai Bay coast using MaxEnt Model. Chin. J. Ecol. 2020, 39, 194–205. [Google Scholar]
  45. Zhang, K.; Yao, L.; Meng, J.; Tao, J. Maxent modeling for predicting the potential geographical distribution of two peony species under climate change. Sci. Total Environ. 2018, 634, 1326–1334. [Google Scholar] [CrossRef] [PubMed]
  46. Pearson, K.; Henrici, O.M.F.E. VII. Mathematical contributions to the theory of evolution.—III. Regression, heredity, and panmixia. Philos. Trans. R. Soc. Lond. Ser. A Contain. Pap. Math. Phys. Character 1896, 187, 253–318. [Google Scholar] [CrossRef]
  47. Yi, Y.; Cheng, X.; Yang, Z.; Zhang, S. Maxent modeling for predicting the potential distribution of endangered medicinal plant (H. riparia Lour) in Yunnan, China. Ecol. Eng. 2016, 92, 260–269. [Google Scholar] [CrossRef]
  48. Jaynes, E.T. Information Theory and Statistical Mechanics. Phys. Rev. 1957, 106, 620–630. [Google Scholar] [CrossRef]
  49. Phillips, S.J.; Dudík, M. Modeling of species distributions with Maxent: New extensions and a comprehensive evaluation. Ecography 2008, 31, 161–175. [Google Scholar] [CrossRef]
  50. Merow, C.; Smith, M.J.; Silander Jr, J.A. A practical guide to MaxEnt for modeling species' distributions: What it does, and why inputs and settings matter. Ecography 2013, 36, 1058–1069. [Google Scholar] [CrossRef]
  51. Phillips, S.J.; Anderson, R.P.; Schapire, R.E. Maximum entropy modeling of species geographic distributions. Ecol. Model. 2006, 190, 231–259. [Google Scholar] [CrossRef]
  52. Radosavljevic, A.; Anderson, R. Making better MAXENT models of species distributions: Complexity, overfitting and evaluation. J. Biogeogr. 2013, 41, 629–643. [Google Scholar] [CrossRef]
  53. Araújo, M.B.; New, M. Ensemble forecasting of species distributions. Trends Ecol. Evol. 2007, 22, 42–47. [Google Scholar] [CrossRef]
  54. Braunisch, V.; Suchant, R. Predicting species distributions based on incomplete survey data: The trade-off between precision and scale. Ecography 2010, 33, 826–840. [Google Scholar] [CrossRef]
  55. Swets, J.A. Measuring the Accuracy of Diagnostic Systems. Science 1988, 240, 1285–1293. [Google Scholar] [CrossRef] [PubMed]
  56. Altmann, A.; Toloşi, L.; Sander, O.; Lengauer, T. Permutation importance: A corrected feature importance measure. Bioinformatics 2010, 26, 1340–1347. [Google Scholar] [CrossRef] [PubMed]
  57. Xing, M.; Hao, W.; Wei, Y.; Yong, D.; Jianchao, L.; Huijian, H.; Sheng-Rong, Q. Analysis on the hotspot and conservation gaps of bird biodiversity in Guangdong Province based on MaxEnt model. Biodivers. Sci. 2021, 29, 1097. [Google Scholar]
  58. Zhang, D.; Zeng, J.; Namaiti, A. Identification of bird conservation gaps of protected areas in high-intensity development area: A case study of Tianjin, China. Ying Yong Sheng Tai Xue Bao = J. Appl. Ecol. 2023, 34, 1621–1629. [Google Scholar] [CrossRef]
  59. Zheng, M.; Deng, W.; Ding, P.; Ding, C.; Dong, L.; Jia, C.; Lei, F.; Liang, W.; LU, X.; Ma, M.; et al. Checklist on the Classification and Distribution of the Birds of China, 3rd ed.; Science Press: Beijing, China, 2017. [Google Scholar]
  60. Fisher, R.A. Statistical Methods for Research Workers. In Breakthroughs in Statistics: Methodology and Distribution; Kotz, S., Johnson, N.L., Eds.; Springer: New York, NY, USA, 1992; pp. 66–70. [Google Scholar]
  61. Chen, S.; Yin, D.; Li, Y.; Sun, Y.; Li, c. Analysis of differences of rainfall between urban and rural regions in Nanjing. J. Meteorol. Environ. 2016, 32, 27–33. [Google Scholar] [CrossRef]
  62. Liu, G.; Zhang, Q.; Li, G.; Doronzo, D. Response of land cover types to land surface temperature derived from Landsat-5 TM in Nanjing Metropolitan Region, China. Environ. Earth Sci. 2016, 75, 1386. [Google Scholar] [CrossRef]
  63. Tu, L.; Qin, Z.; Li, W.; Geng, J.; Yang, L.; Zhao, S.; Zhan, W.; Wang, F. Surface urban heat island effect and its relationship with urban expansion in Nanjing, China. J. Appl. Remote Sens. 2016, 10, 026037. [Google Scholar] [CrossRef]
  64. Yuan, Y.; Zou, X.; Shi, F.; Gao, X.; Hu, L.; Zhang, Z. Bird Habitat Suitability Distribution in Dongting Lake Basin Under Different Climate Change Scenarios. J. Hydroecol. 2022, 43, 56–62. [Google Scholar] [CrossRef]
  65. Hume, R.A. Reactions of birds to heavy rain. Br. Birds 1986, 79, 326–329. [Google Scholar]
  66. Liu, J.; Niu, J.; Zou, Y.; Lu, S.; Wang, T. Changes in the Waterbird Community of the Ecological Restored Wetlands in Pudong Dongtan, Shanghai. Resour. Environ. Yangtze Basin 2015, 24, 219–226. [Google Scholar]
  67. Zhu, G.; Wang, X.; Zhang, W.; Wu, Y.; Yong, F.; Li, C.; Cui, p. Eflects of Urban Landscape Pattern on Bird Community: A Case Study of Lishui District, Nanjing. J. Ecol. Rural. Environ. 2022, 38, 327–333. [Google Scholar] [CrossRef]
  68. Pizo, M.A. Frugivory and habitat use by fruit-eating birds in a fragmented landscape of southeast Brazil. Ornitol. Neotrop. 2004, 15, 117–126. [Google Scholar] [CrossRef]
  69. Reidy, J.L.; Thompson, F.R.; Kendrick, S.W. Breeding bird response to habitat and landscape factors across a gradient of savanna, woodland, and forest in the Missouri Ozarks. For. Ecol. Manag. 2014, 313, 34–46. [Google Scholar] [CrossRef]
  70. Dai, S.; Feng, D.; Xu, B. Monitoring potential geographical distribution of four wild bird species in China. Environ. Earth Sci. 2016, 75, 34–46. [Google Scholar] [CrossRef]
  71. Farashi, A.; Shariati, M. Biodiversity hotspots and conservation gaps in Iran. J. Nat. Conserv. 2017, 39, 37–57. [Google Scholar] [CrossRef]
  72. Wang, Y.; Shi, J.; Wu, Y.; Zhang, W.; Yang, X.; Lv, H.; Xia, S.; Zhao, S.; Tian, J.; Cui, P.; et al. Selection of Flagship Species and Their Use as Umbrellas in Bird Conservation: A Case Study in Lishui, Zhejiang Province, China. Animals 2023, 13, 1825. [Google Scholar] [CrossRef]
  73. Chen, D.; Pan, Y.; Wu, X. Recognition and Characteristics of Bird Habitat in Wuhan Based on MaxEnt Model. J. Chin. Urban For. 2021, 19, 60–65. [Google Scholar] [CrossRef]
  74. Chen, X.; Lei, Y.; Zhang, X.; Jia, H. Effects of sample sizes on accuracy and stability of maximum entropy model inpredicting species distribution. Sci. Silvae Sin. 2012, 48, 53–59. [Google Scholar] [CrossRef]
Figure 1. Geographical location map of the study area.
Sustainability 16 02139 g001
Figure 2. Distribution of environmental variables used for modeling, including (a) TAR, (b) MTWM, (c) PWM, (d) AP, (e) DF, (f) DW, (g) FVC, (h) DEM, (i) NLI, (j) RND, and (k) PD.
Sustainability 16 02139 g002
Figure 3. (a) Distribution map of all bird diversity in the Nanjing urban area; (b) distribution map of migrant diversity in the Nanjing megapolis; (c) distribution map of resident diversity in the Nanjing megapolis.
Sustainability 16 02139 g003
Figure 4. (a) Permutation importance of each environmental variable for all birds; (b) permutation importance of each environmental variable for migrants; (c) permutation importance of each environmental variable for residents.
Sustainability 16 02139 g004
Figure 5. (a) Counts of environmental variables ranked in the top three for permutation importance across all birds; (b) counts of environmental variables ranked in the top three for permutation importance across migrants; (c) counts of environmental variables ranked in the top three for permutation importance across residents.
Sustainability 16 02139 g005
Figure 6. (a) Contribution rate of each environmental variable for all birds; (b) contribution rate of each environmental variable for migrants; (c) contribution rate of each environmental variable for residents.
Sustainability 16 02139 g006
Figure 7. (a) Counts of environmental variables ranked in the top three for contribution rate across all birds; (b) counts of environmental variables ranked in the top three for contribution rate across migrants; (c) counts of environmental variables ranked in the top three for contribution rate across residents.
Sustainability 16 02139 g007
Figure 8. Relationship between DEM, WTWM, bird diversity, and distance to large areas of mountains and hills.
Sustainability 16 02139 g008
Figure 9. Contribution rates of the three major environmental variables.
Sustainability 16 02139 g009
Table 1. Environmental variables selected in this paper.
Environmental VariablesAbbreviationSource of Original DataIncluded in Model
Meteorological
environmental variables
Annual mean temperature (°C)AMTInstitute of Tibetan Plateau ResearchNo
Temperature seasonality (°C)TSInstitute of Tibetan Plateau ResearchNo
Maximum temperature of the warmest month (°C)MTWMInstitute of Tibetan Plateau ResearchYes
Minimum temperature of the coldest month (°C)MTCMInstitute of Tibetan Plateau ResearchNo
Temperature annual range (°C)TARInstitute of Tibetan Plateau ResearchYes
Annual precipitation (mm)APInstitute of Tibetan Plateau ResearchYes
Precipitation of the wettest month (mm)PWMInstitute of Tibetan Plateau ResearchYes
Precipitation of the driest month (mm)PDMInstitute of Tibetan Plateau ResearchNo
Precipitation seasonality (mm)PSInstitute of Tibetan Plateau ResearchNo
Habitat
environmental variables
Distance to the nearest forest (m)DFGlobeLand30 2020Yes
Distance to the nearest surface water (m)DWGlobeLand30 2020Yes
Fractional Vegetation Cover indexFVCMODIS EVI dataYes
Digital Elevation Model (m)DEMSTRM DEMYes
Topographic reliefTRSTRM DEMNo
Interference
environmental variables
Night light indexNLINPP-VIIRS night light indexYes
Road network density (m/hm2)RNDBaidu map road dataYes
Population density (/hm2)PDWorldPop Population DataYes
Table 2. Bird orders, number of families, genera, and species, and percentage of total number of species in the study area.
OrderNumber of FamiliesNumber of GeneraNumber of SpeciesPercentage of Total Number of Species
Accipitriformes15911.39%
Anseriformes1222.53%
Columbiformes2222.53%
Coraciiformes1333.80%
Cuculiformes1345.06%
Galliformes1111.27%
Gruiformes1222.53%
Passeriformes20334455.70%
Pelecaniformes2445.06%
Piciformes1345.06%
Podicipediformes1111.27%
Strigiformes1333.80%
Table 3. Major environmental variables affecting bird diversity and their positive and negative contributions.
Environmental VariablesCorrelation Coefficient (p < 0.01)
MTWM−0.59
PWM−0.04
DF−0.30
FVC0.42
DEM0.46
Disclaimer/Publisher’s Note: The statements, opinions and data contained in all publications are solely those of the individual author(s) and contributor(s) and not of MDPI and/or the editor(s). MDPI and/or the editor(s) disclaim responsibility for any injury to people or property resulting from any ideas, methods, instructions or products referred to in the content.

