Article

Impact of Superabsorbent Polymer on Shrinkage and Compressive Strength of Mortar and Concrete

by
Wissawin Arckarapunyathorn
1,
Pochpagee Markpiban
2,* and
Raktipong Sahamitmongkol
1,*
1
Department of Civil Engineering, King Mongkut’s University of Technology Thonburi (KMUTT), Bangkok 10140, Thailand
2
Department of Civil Engineering, College of Engineering, Rangsit University, Pathumthani 12000, Thailand
*
Authors to whom correspondence should be addressed.
Sustainability 2024, 16(5), 2158; https://doi.org/10.3390/su16052158
Submission received: 9 January 2024 / Revised: 28 February 2024 / Accepted: 28 February 2024 / Published: 5 March 2024
(This article belongs to the Special Issue Sustainable Construction Materials and Technologies)

Abstract

:
This article aims to study the effects of mixtures with superabsorbent polymers (SAPs) when using different mixing methods. The mixing methods used in this study are the dry mixing method and wet mixing method. Autogenous shrinkage, total shrinkage, drying shrinkage, compressive strength, and curing sensitivity index values are investigated. The results show that mixtures with SAPs have reduced autogenous shrinkage and total shrinkage. Shrinkage is more effectively reduced by the dry SAP mixing method than the wet SAP mixing method. The compressive strength derived by the dry SAP mixing method is higher than that derived by the wet SAP mixing method.

1. Introduction

The cracking of concrete is a big problem in concrete structures. It can be caused by several factors. The cracking of concrete structures due to shrinkage is frequently found, especially in the case of high cement content, a low water-to-binder ratio, and high-performance concrete. High-performance concrete, which has a very low water-to-binder ratio, causing low permeability [1,2,3], is used worldwide in the present day. The reaction of unhydrated cement with an inadequate amount of water or moisture from capillary pores causes self-desiccation, which leads to severely increased autogenous shrinkage. An increase in autogenous shrinkage increases the risk of cracking in concrete under the restraint of the structure [4].
In general, the hydration reaction in concrete needs water. If the water in the capillary pore within concrete is used for the hydration reaction and evaporation to the external environment occurs until desiccation is achieved or there is a lack of water in the concrete, the hydration reaction is discontinued. The prevention of evaporation in concrete could prolong the hydration reaction. So, external curing is used to facilitate the hydration reaction, increase the compressive strength of concrete and, furthermore, reduce drying shrinkage. However, this curing method cannot decrease autogenous shrinkage because external water cannot spread into the interior or center of concrete.
Internal curing (IC) is also used to reduce autogenous shrinkage and mitigate cracking risk [4,5]. The difference between external and internal curing is the moisture provided to concrete for the hydration reaction. In the case of high-density or very thick concrete during external curing, the water cannot thoroughly permeate into concrete. For internal curing, the appropriate material must have the properties of high water absorption and good desorption. IC agents are used as additives or for the partial replacement of the mixture in fresh concrete. When an IC agent is thoroughly distributed inside concrete, it gradually releases water to mitigate the self-desiccation, causing a reduction in autogenous shrinkage by keeping moisture inside the concrete. In addition, the hydration reaction and compressive strength of concrete has also been fully developed. A superabsorbent polymer (SAP) is one of the appropriate materials used as an IC agent in construction technology, playing a crucial role in extending the service lives of structures. Enhanced structural serviceability not only contributes to environmental sustainability but also bolsters economic viability.
SAPs can be classified as sodium-based and potassium-based. Their water absorption properties are similar, but their desorption abilities are different. Sodium-based SAPs cannot desorb or can desorb a small amount of water, while potassium-based SAPs can substantially desorb water.
Previous studies have shown that by using an SAP as an IC agent, autogenous shrinkage was reduced [1,3,5], while drying shrinkage could have either decreased or increased [1,5]. Unfortunately, mixing SAPs into a mixture generally degrades its mechanical properties [3,5]. In the present day, there are two methods of mixing SAPs into mixtures: dry and wet mixing methods. In the dry mixing method [1,2,3,5,6,7,8,9,10,11,12], a dry SAP is mixed into a mixture. The dry SAP will absorb IC water during mixing. The disadvantage of the dry mixing method is that it decreases the mechanical properties and increases the drying shrinkage. In the wet mixing method, a pre-wetted SAP is mixed into a mixture [12,13]. It appears that the majority of studies on SAP have primarily explored a limited range of effects using either the dry mixing method or the wet mixing method. Consequently, there is still a gap in knowledge regarding the selection of the most suitable and efficient mixing method. To address this gap, this paper undertakes a comprehensive examination of both methods and compares their effectiveness. The study investigates the impact of SAP as an internal curing (IC) agent on the shrinkage and compressive strength in mixtures, with the findings being thoroughly tested and discussed. Additionally, the study evaluates and proposes a curing sensitivity index (CSI).

2. Experimental Program
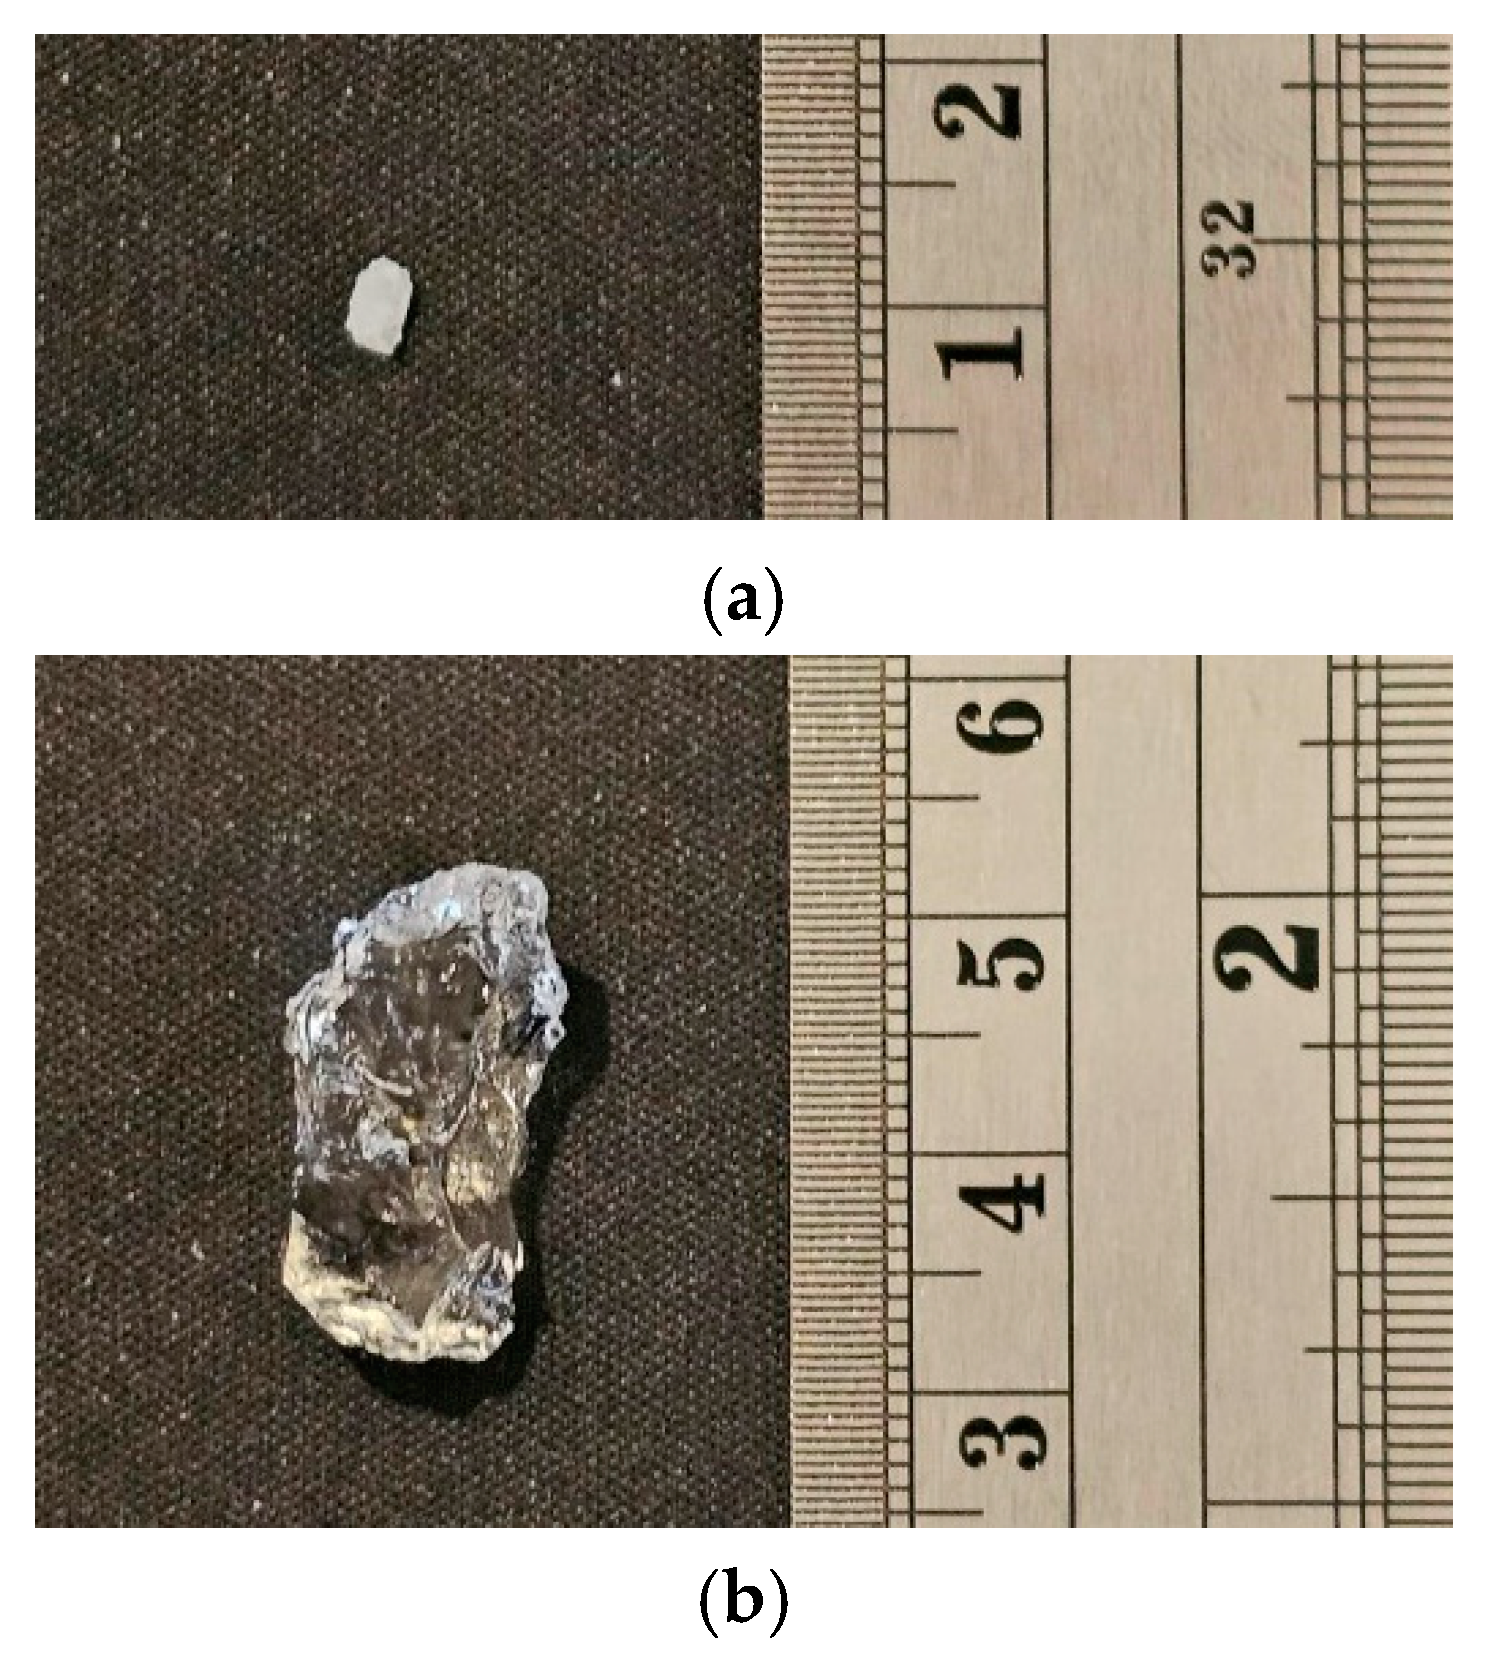
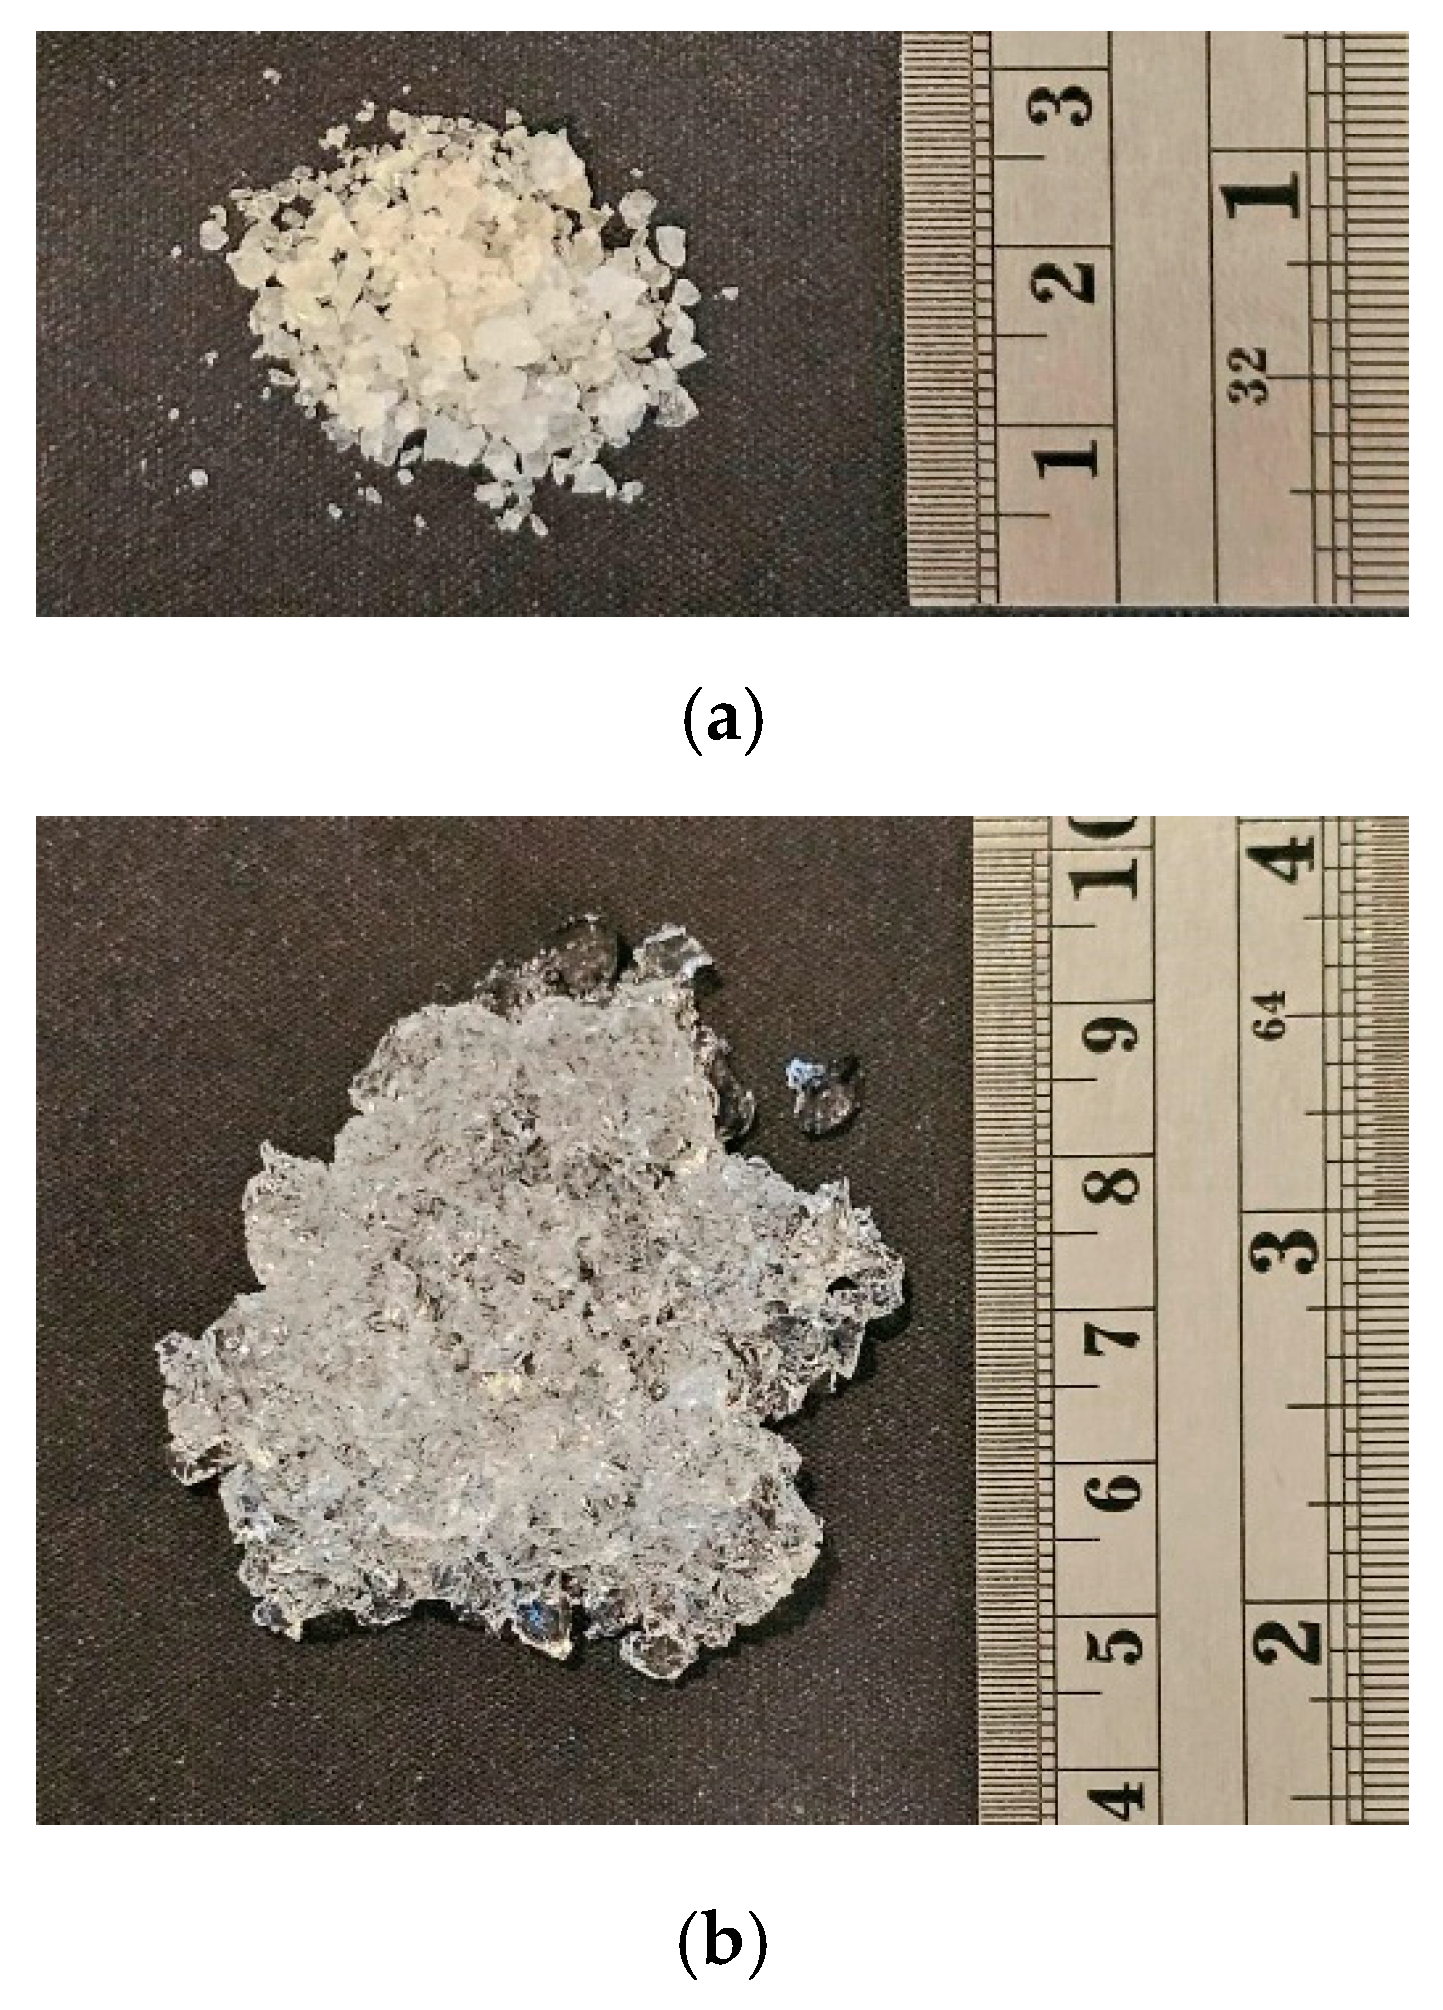
2.1. Materials

Ordinary Portland cement type I was used. The specific gravity was 3.15. The chemical compositions are shown in Table 1.
River sand was used as a fine aggregate. The specific gravity, fineness modulus, and water absorption of the river sand were 2.63, 2.57, and 0.94%, respectively. The fine aggregate was sieved through a No. 4 (opening 4.75 mm) sieve to remove large particles. Crushed limestone was used as a coarse aggregate with a maximum size of 20 mm. The specific gravity, fineness modulus, and water absorption of the crushed limestone were 2.61, 6.49, and 0.75%, respectively. The fine and coarse aggregate, in the saturated surface dry (SSD) condition, was used according to the ASTM C128 standard [14]. Tap water was used as mixing water.
The SAP used in this study was potassium-based. A covalently cross-linked acrylamide/acrylic acid copolymer was used as the SAP in the dry condition, with a specific gravity of 1.34. The particle size was 75 to 3300 µm for mortar and 150 to 300 µm for concrete in the dry state. The particle sizes of the dry and wet SAP are shown in Figure 1. The gradation of the original dry SAP is shown in Figure 2. Three types of SAP, original dry SAP, wet SAP, and ground wet surface dry SAP, were used. The wet SAP was original dry SAP, which was soaked in water for 3 h. The ground wet SAP was wet SAP, which was ground for 1 min. In Figure 3a,b, the original dry SAP and ground wet SAP are shown.

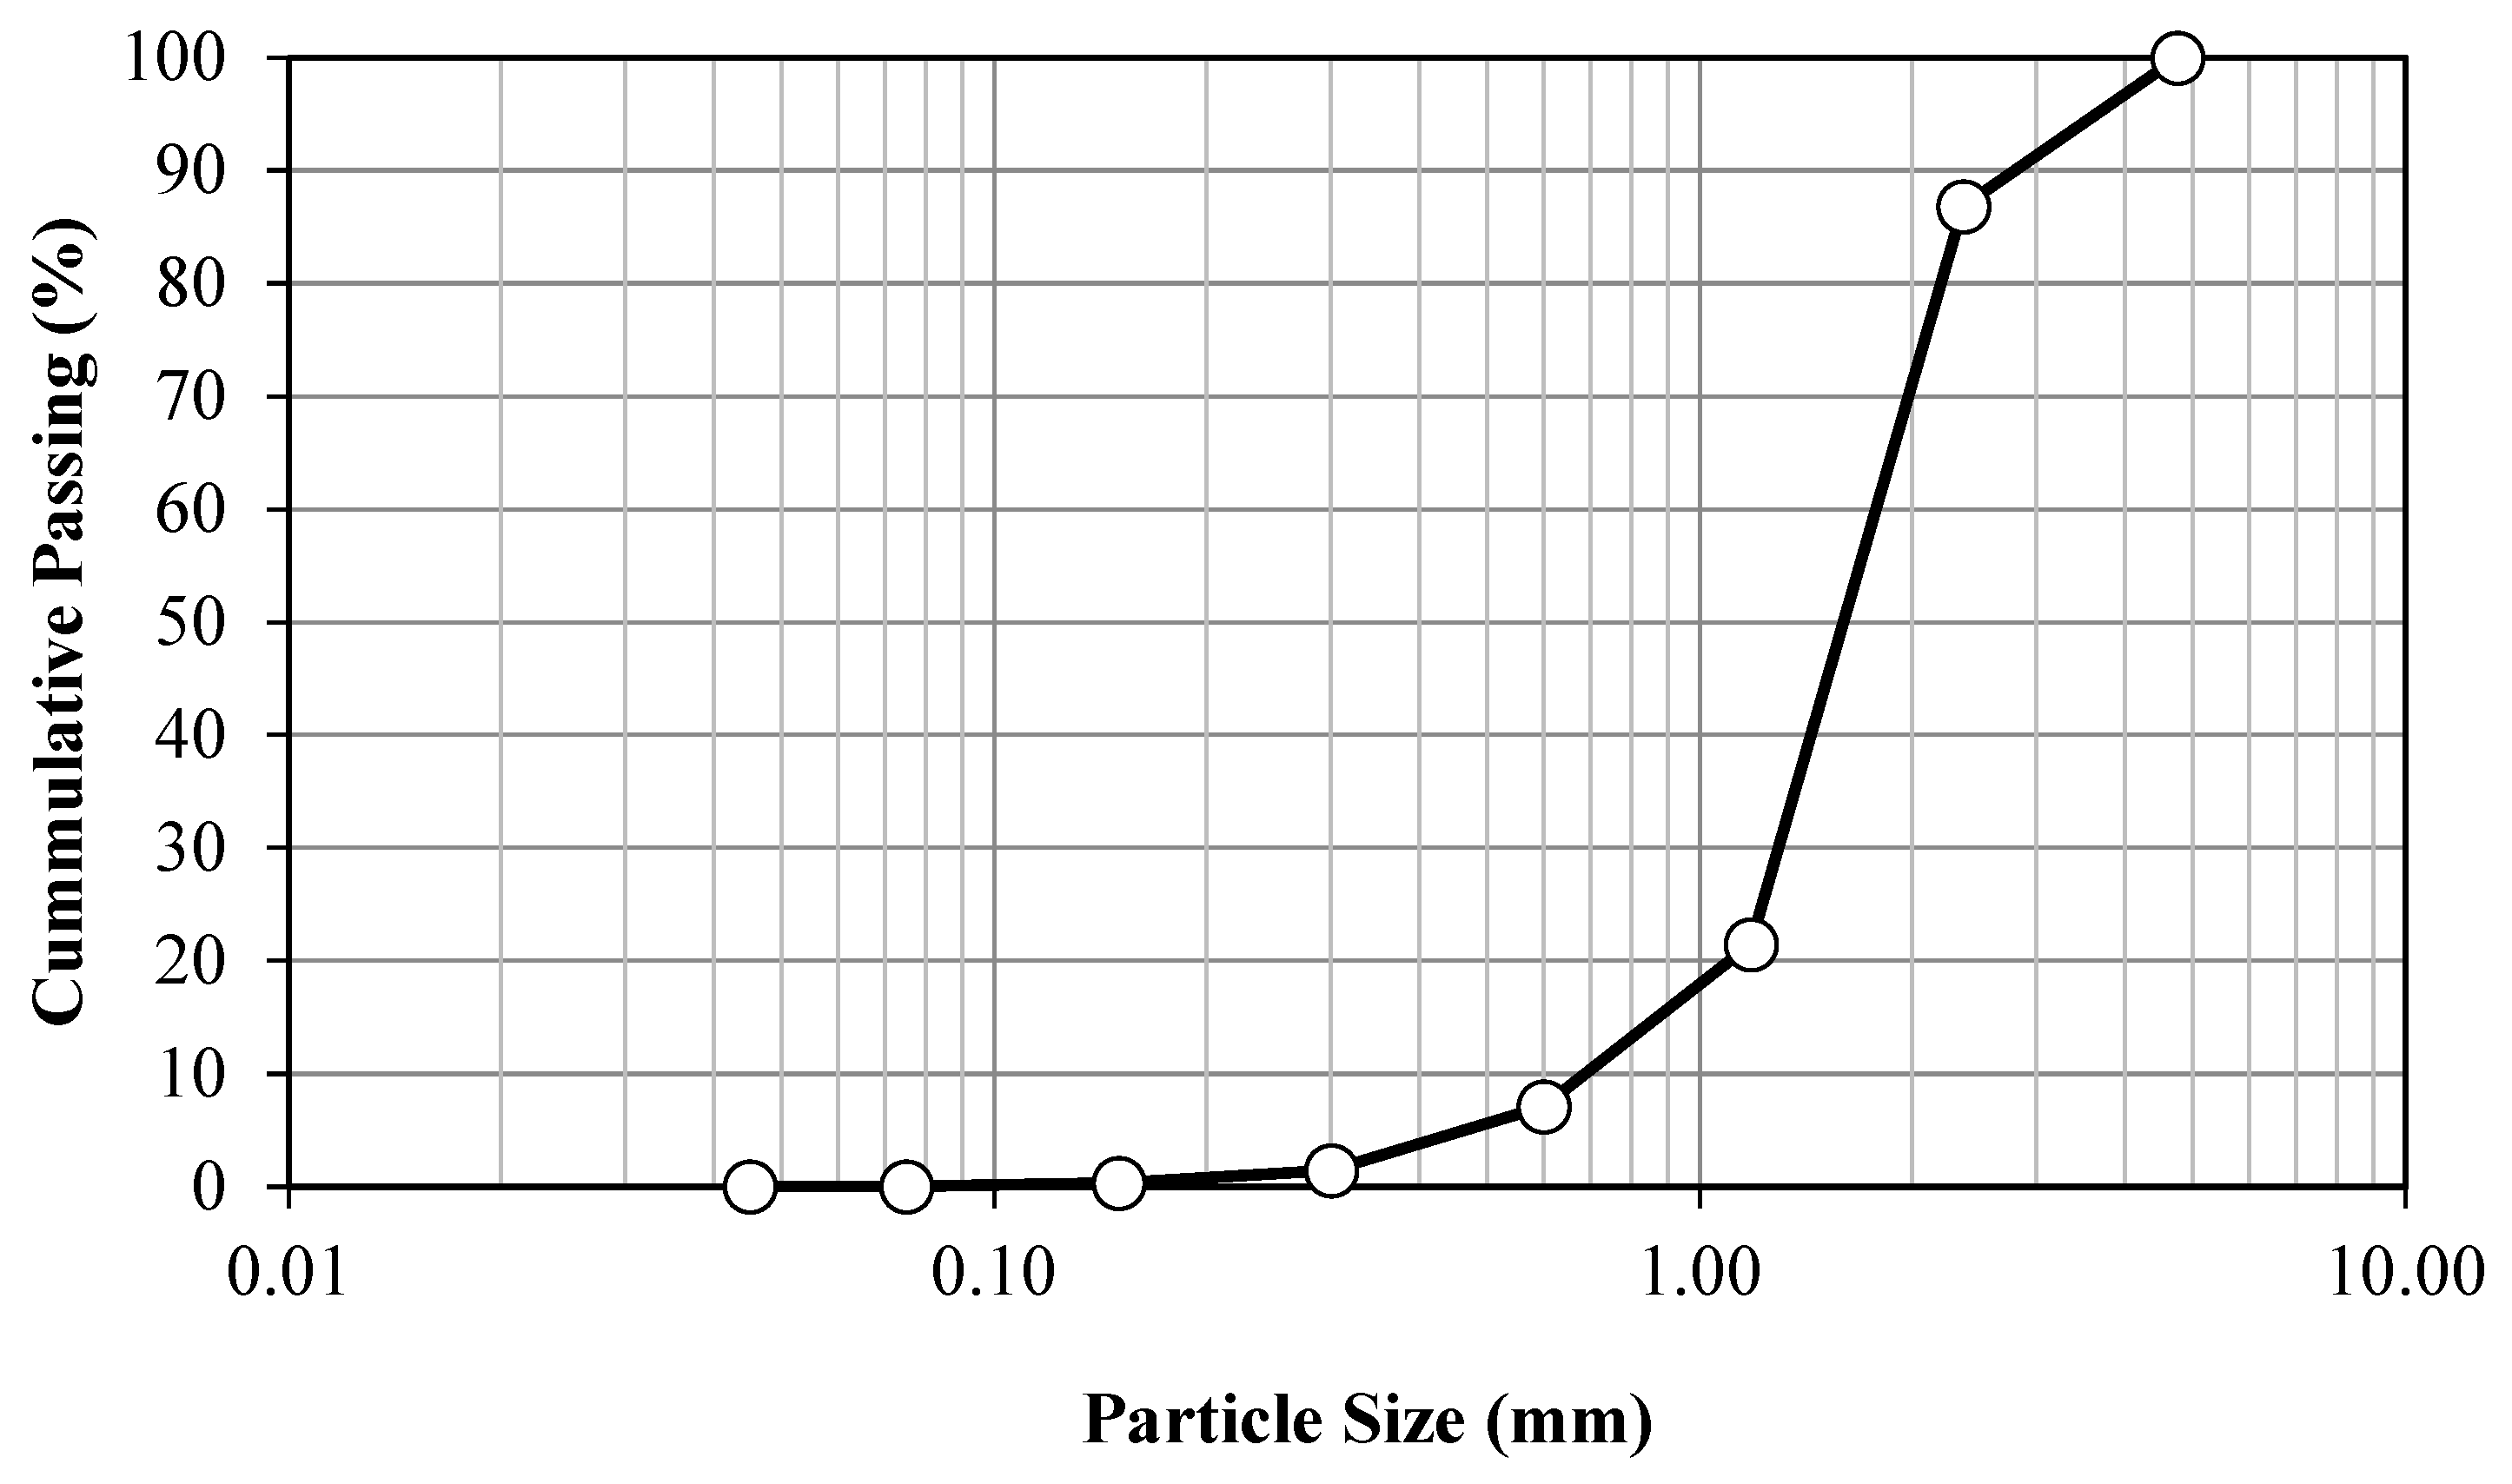
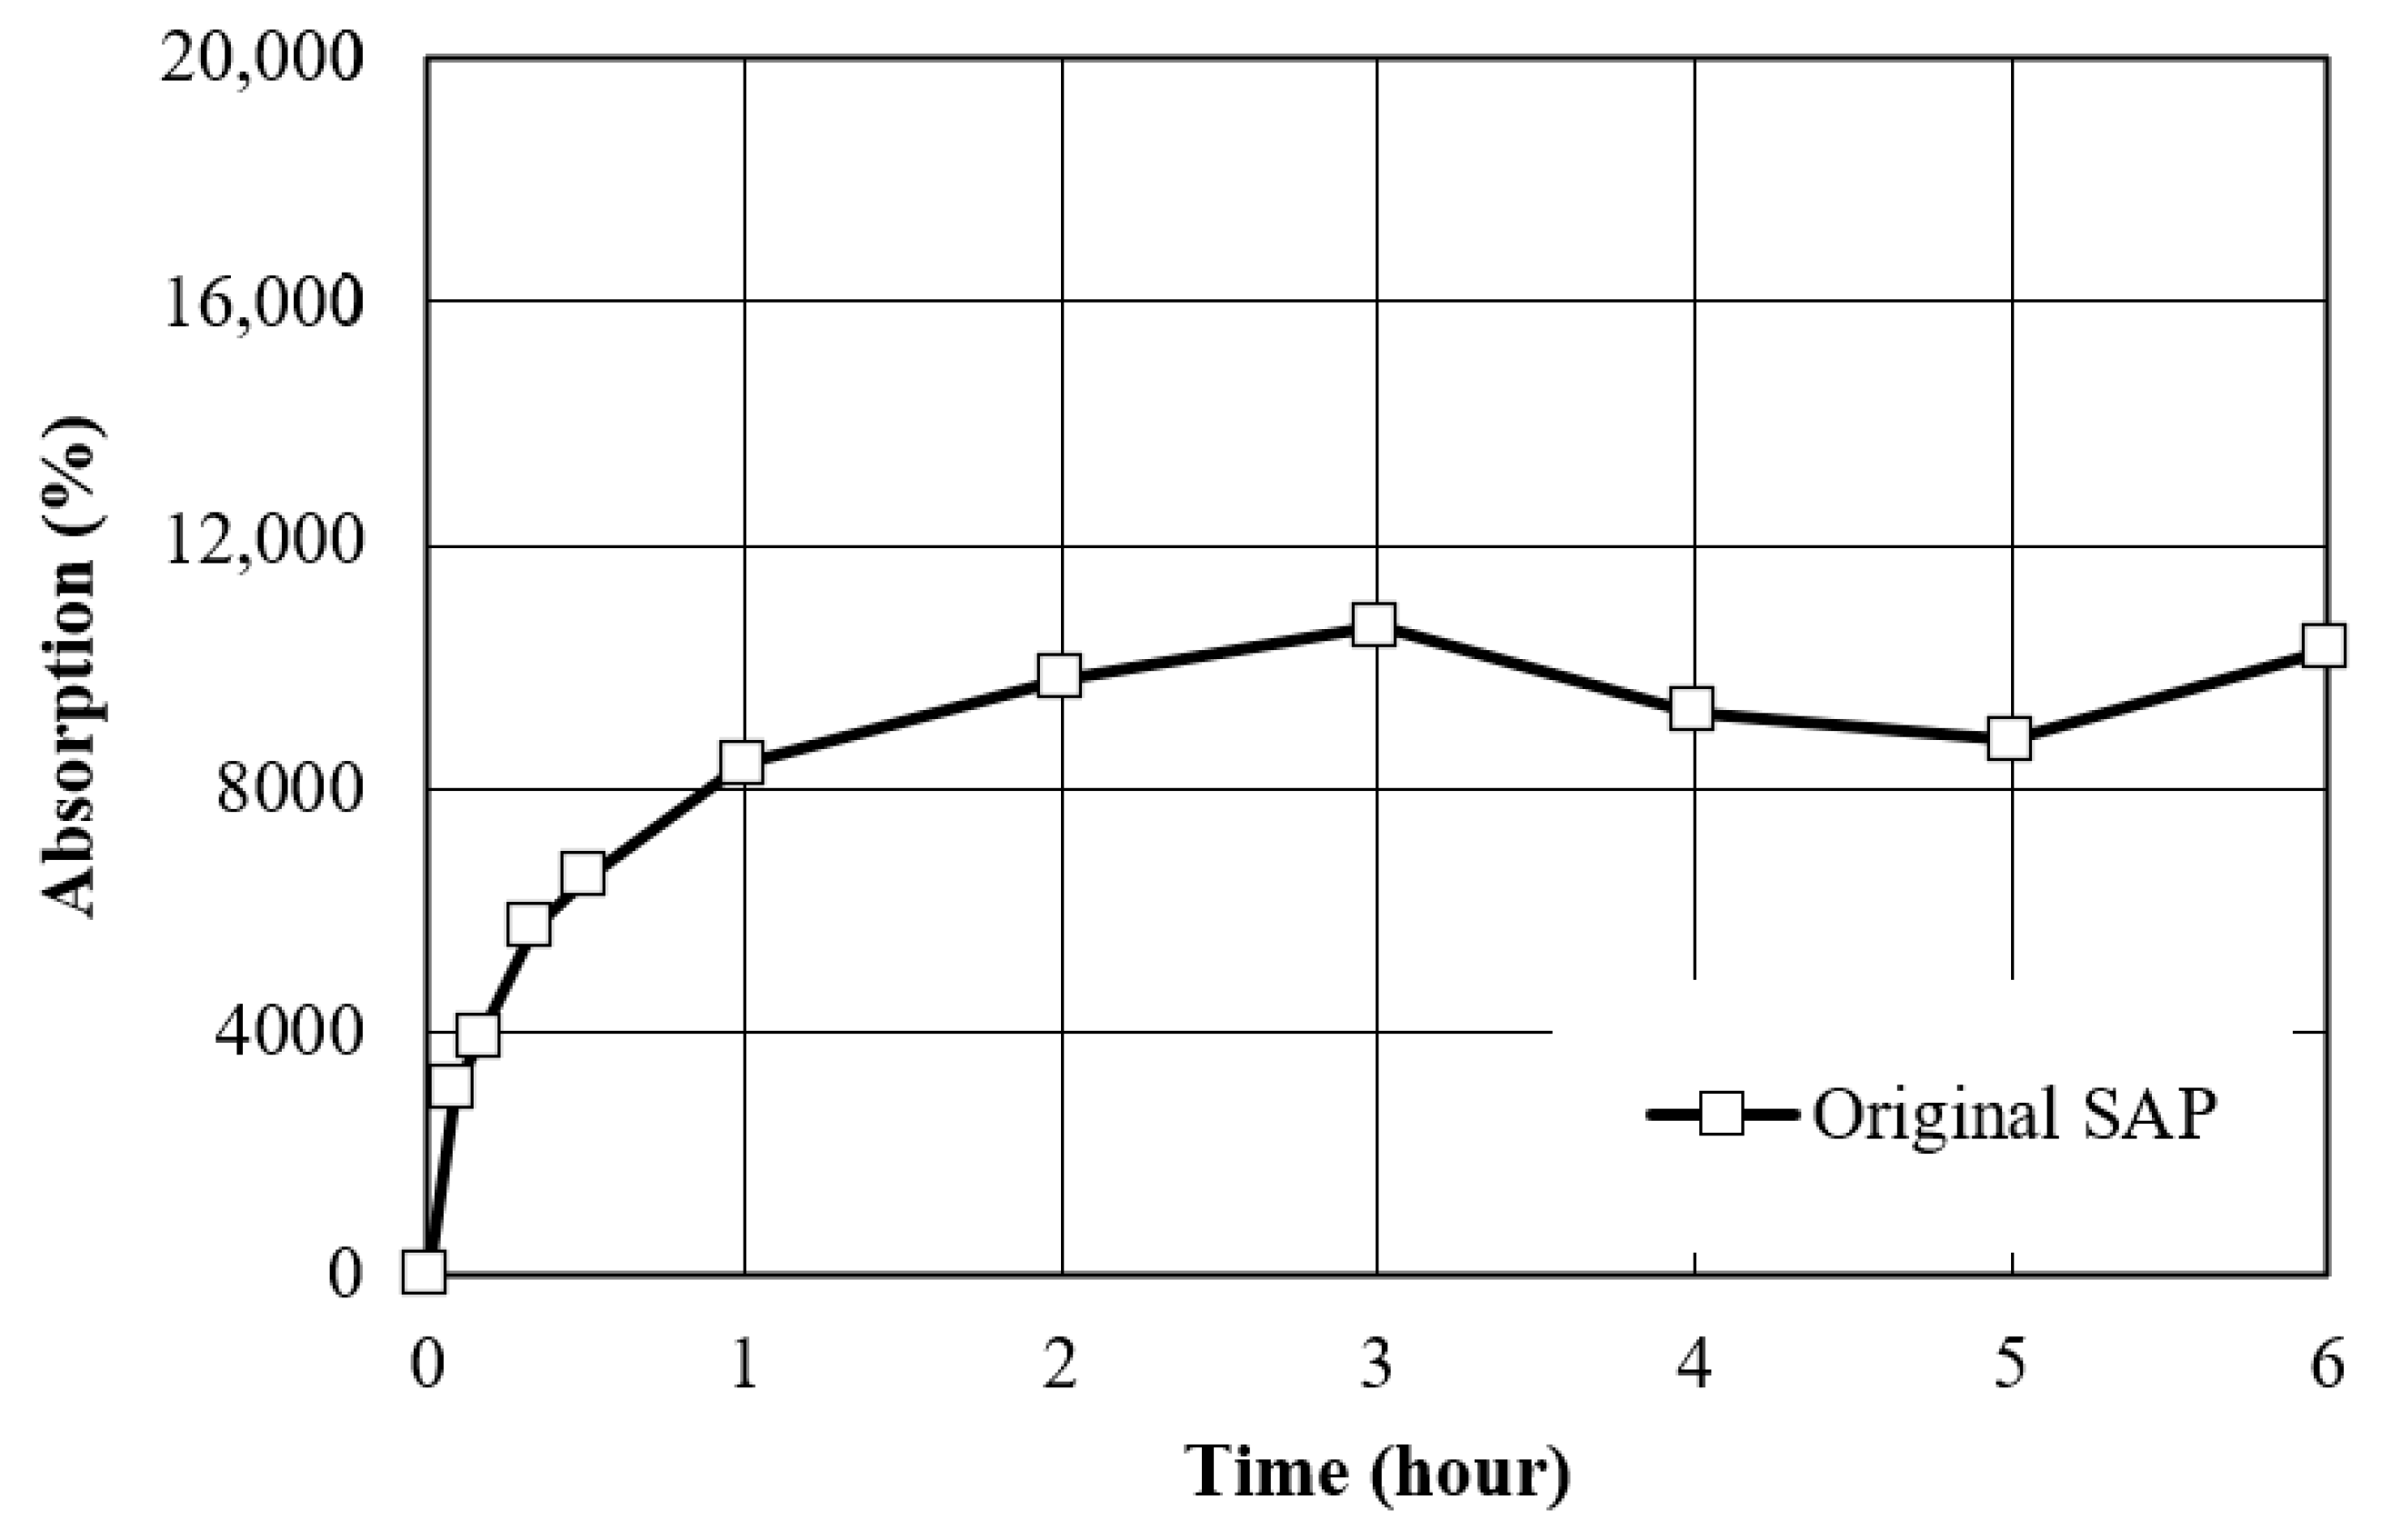
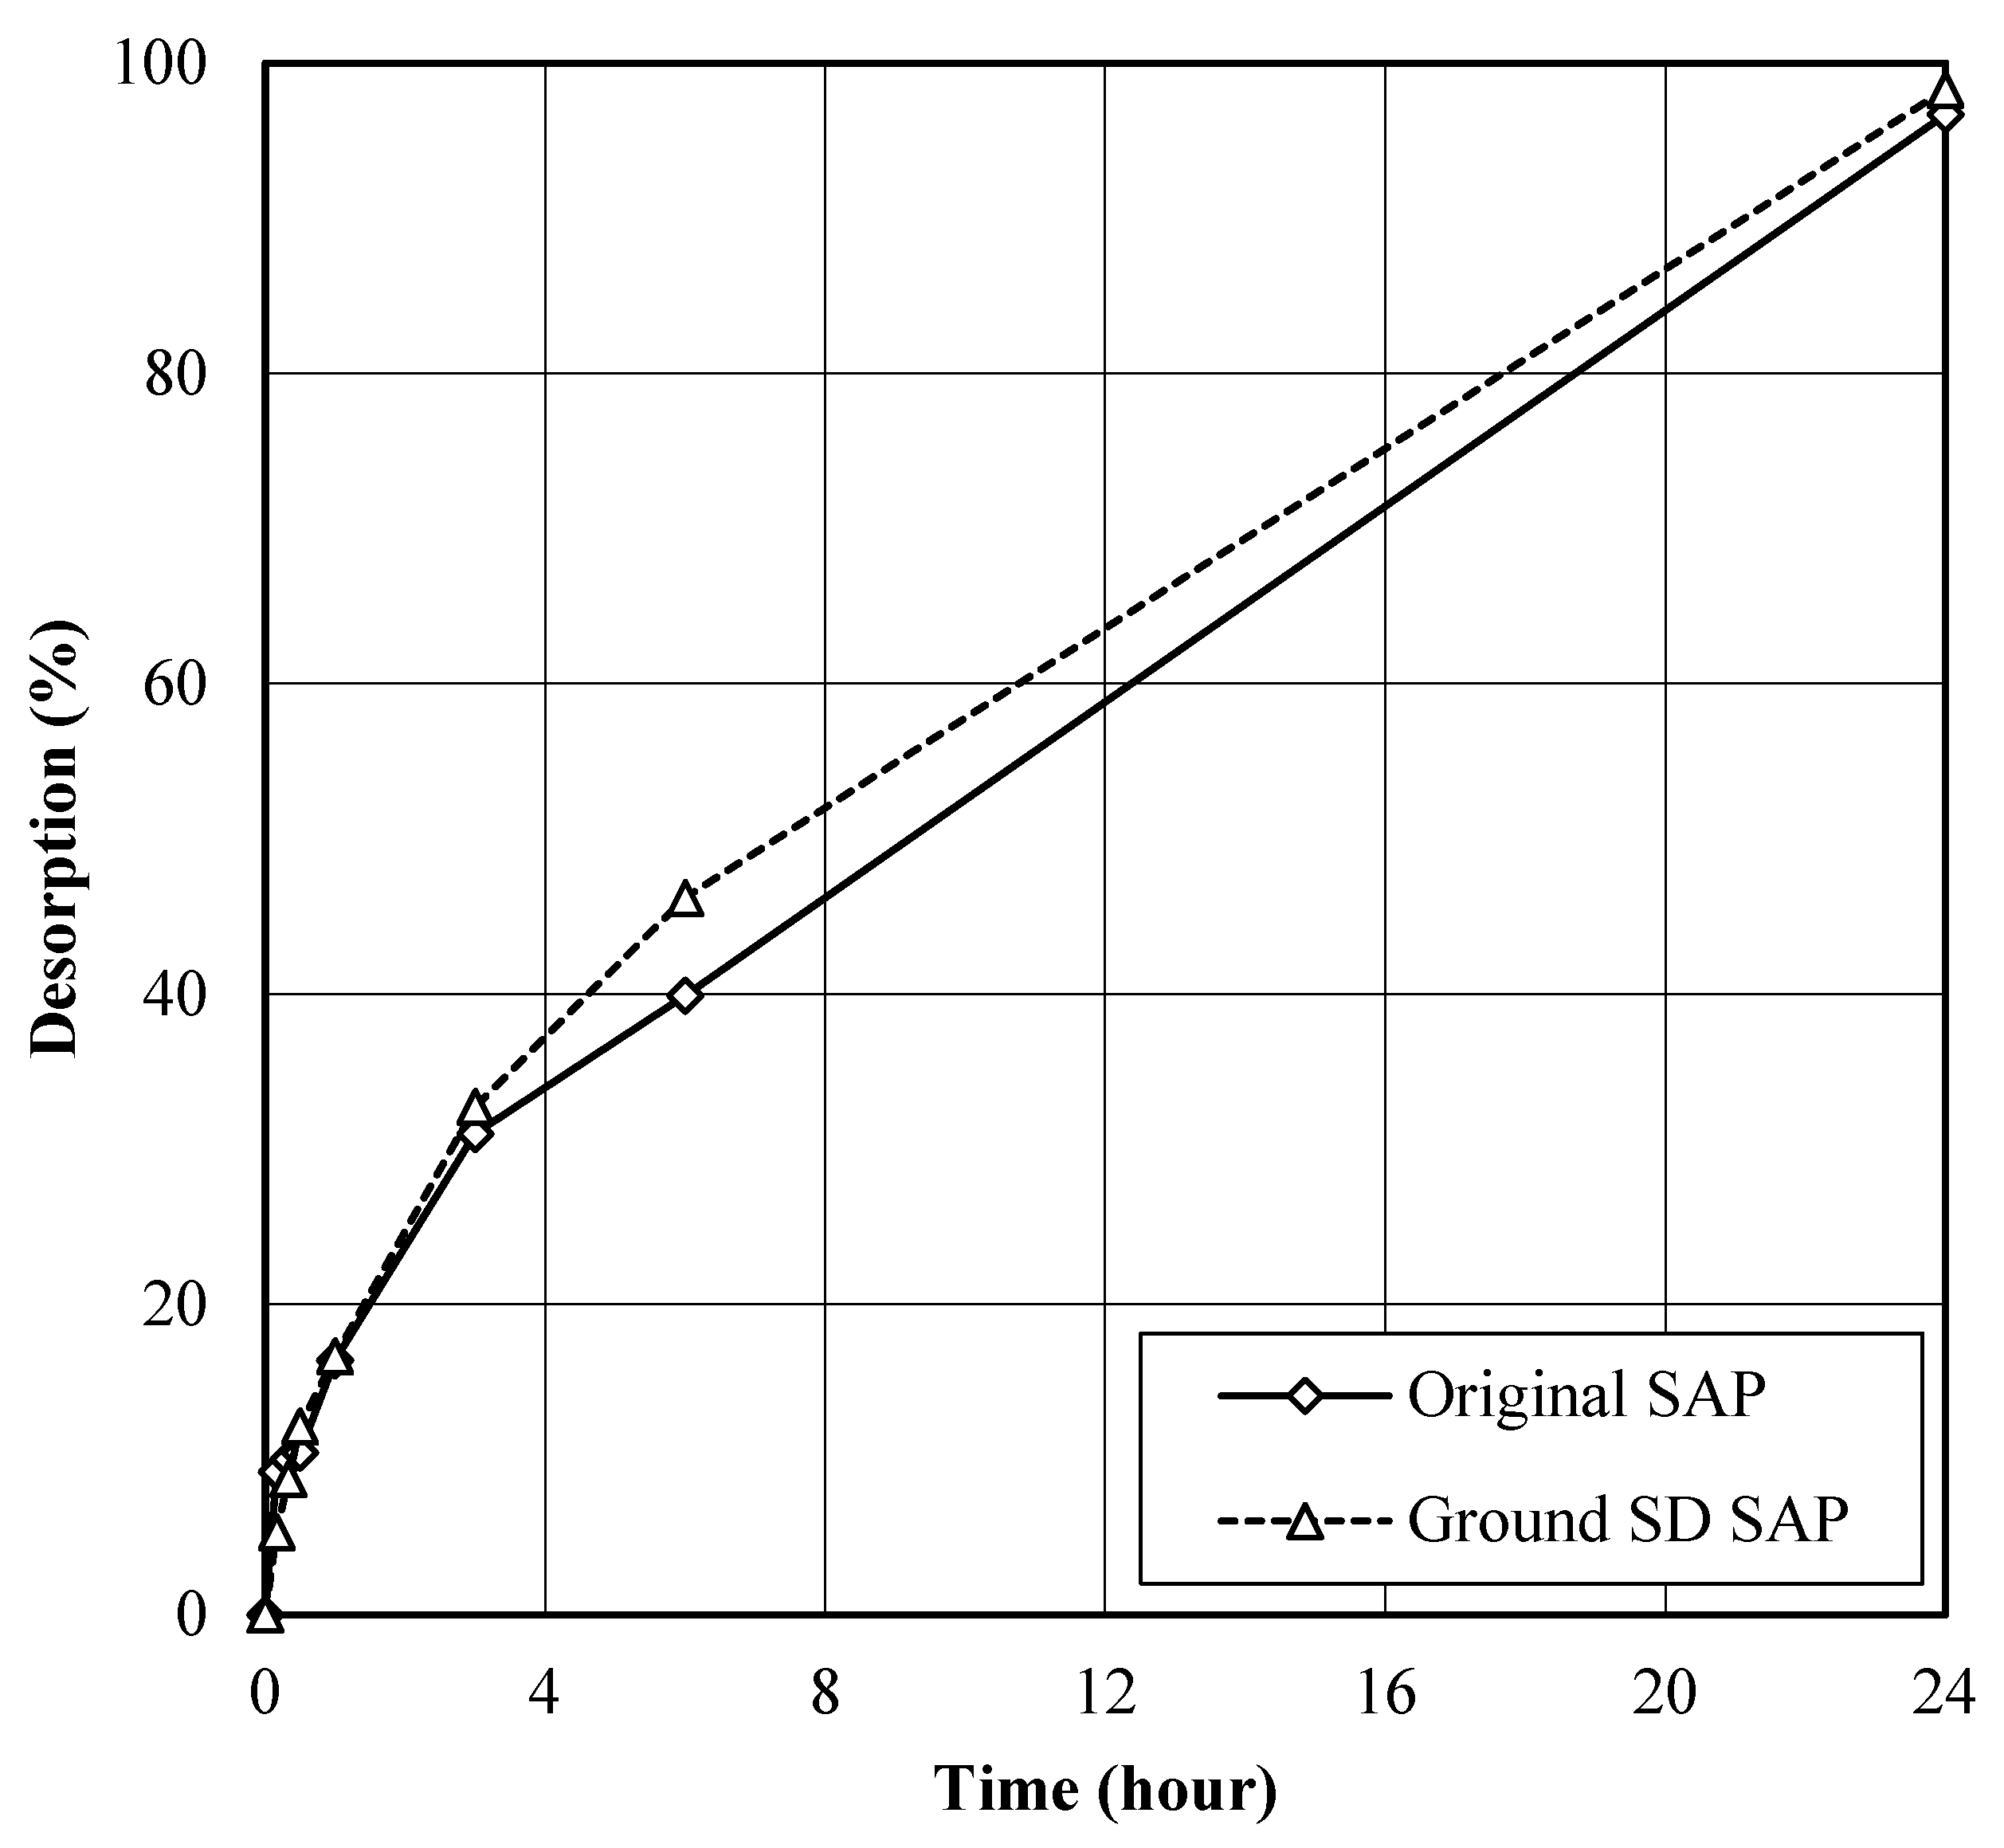
2.2. Absorption and Desorption of SAP
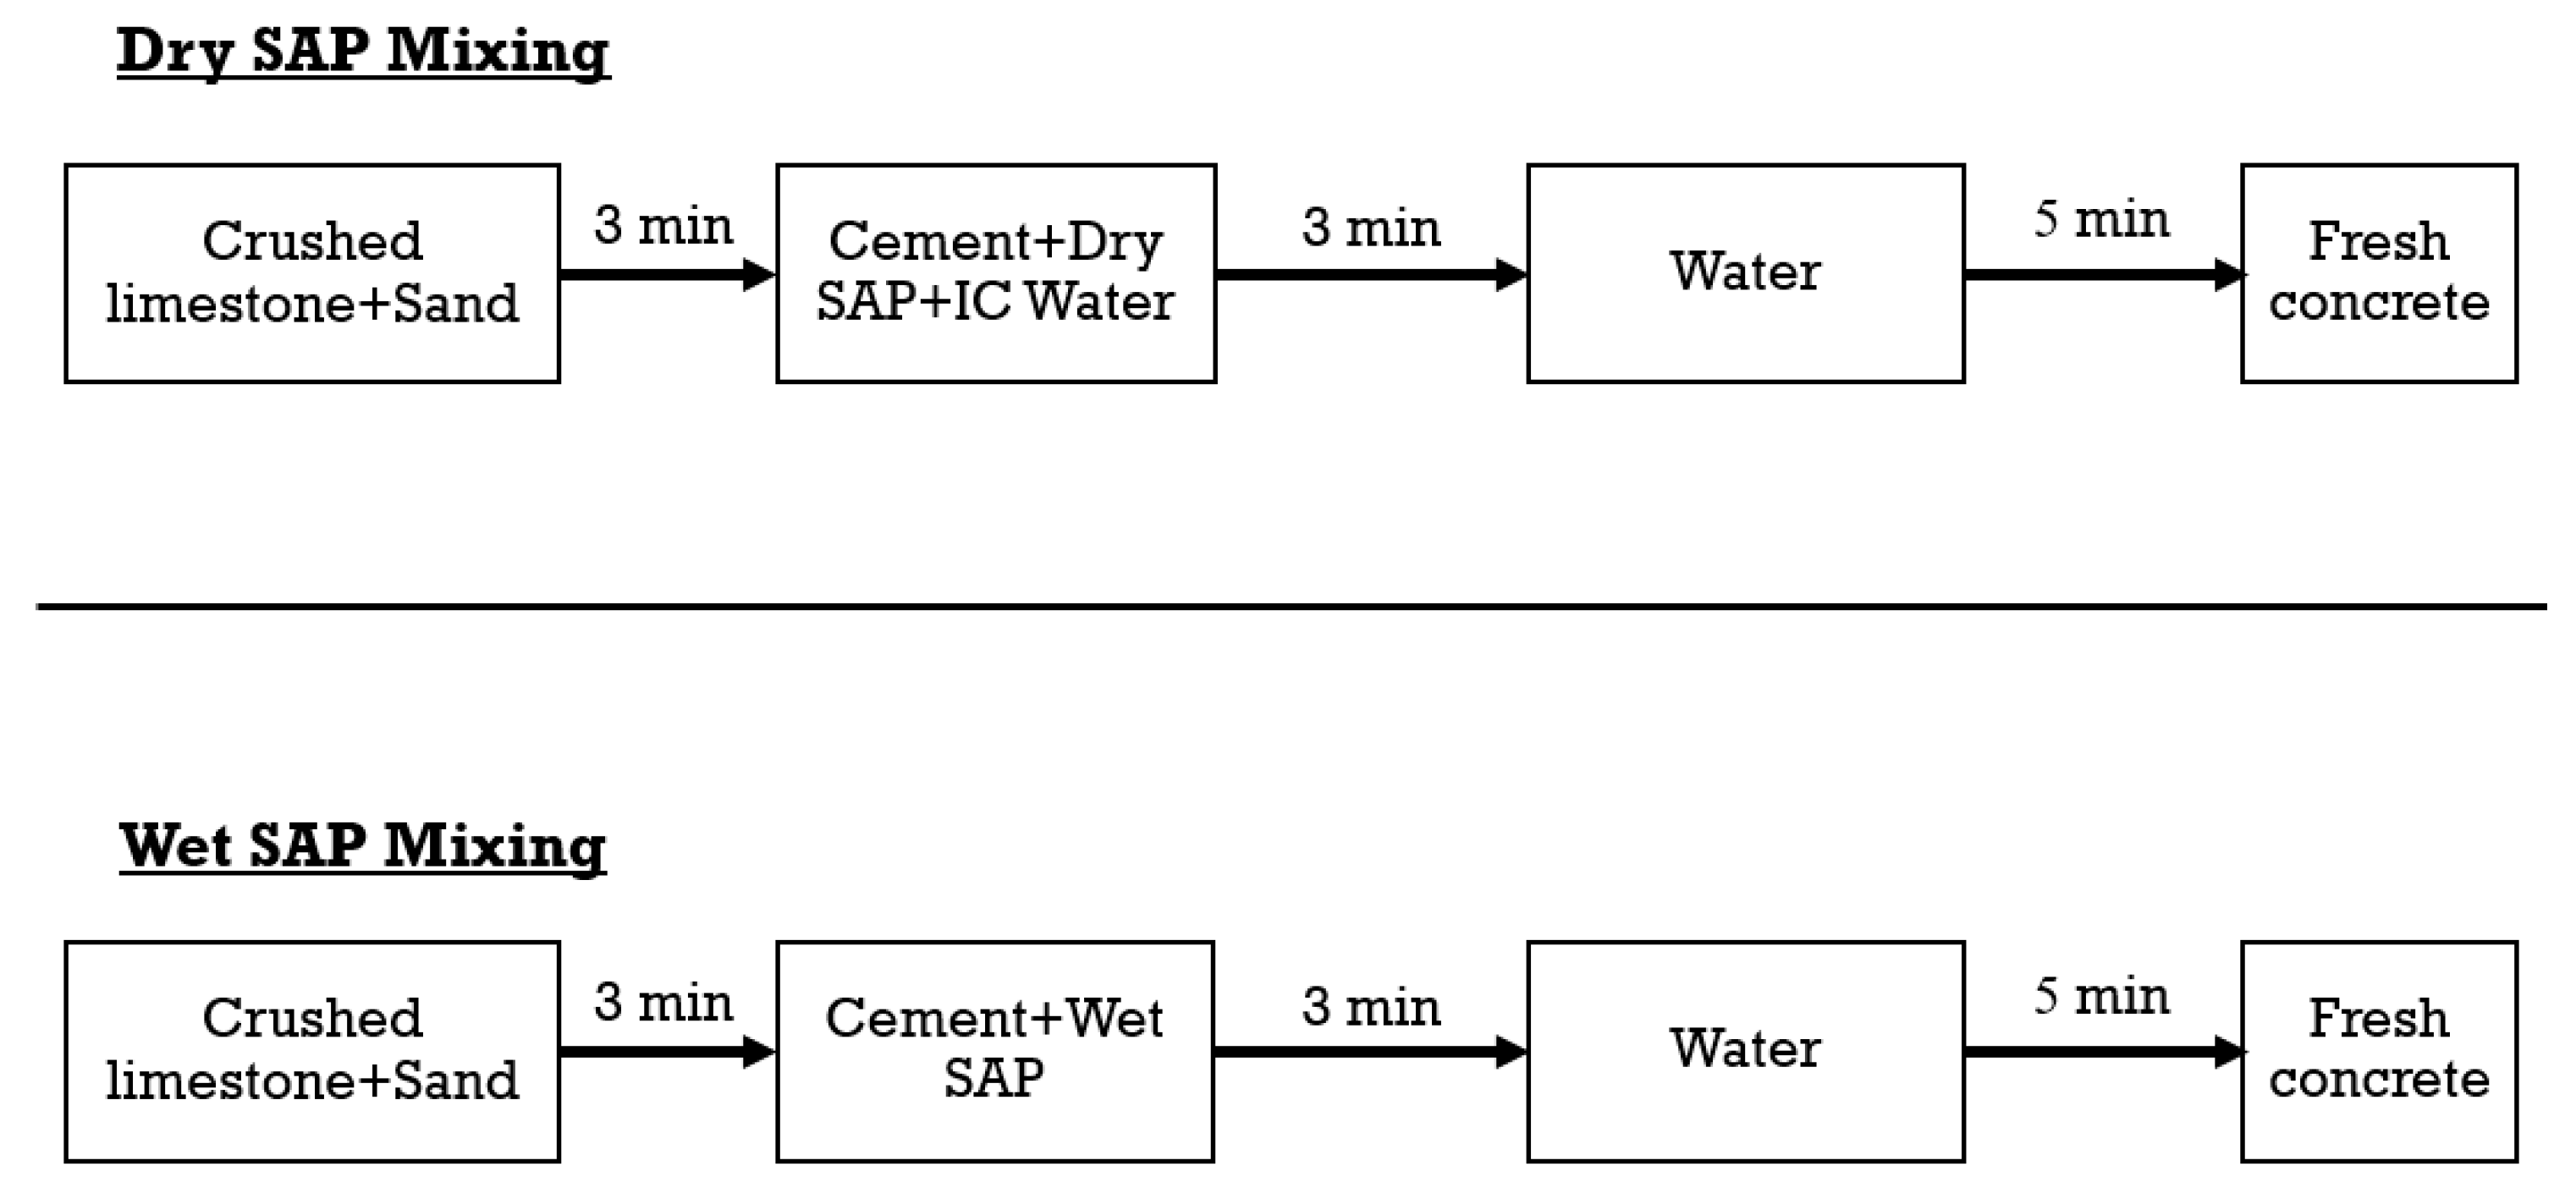
The absorption testing for SAP consists of 2 methods, including the teabag method [15,16,17]. The absorption capacity of SAP, in this study, was tested according to the teabag method presented in [15,16,17]. To perform the teabag method, a teabag containing dry SAP (0.2 to 0.3 g) is immersed in water and then blotted with a dry cloth at different time points: 0, 5, 10, 20, 30, 60, 120, 180, 240, 300, and 360 min. The absorption capacity of SAP is shown in Figure 4. The maximal absorption capacity is 106.71 g (water)/g (dry SAP) at 3 h.
The desorption testing for SAP was conducted according to ASTM C1761/C1761M-15 [18]. The wet surface dry condition SAP (5 g) was taken into a pan and stored in a chamber at 94% relative humidity (RH) and a temperature of 23 ± 1 °C. The desorption capacity of SAP is shown in Figure 5. Wet SAP and ground wet SAP can release 96.7% and 98.3% of the water they absorb in 3 h within 24 h. According to ASTM C1761/C1761M-15 [18], the IC agent must release at least 85% of its absorbed water.

2.3. Mixing Method

Two types of mixing method were employed: the dry SAP mixing method and wet SAP mixing method. For the dry SAP mixing method, the SAP absorbed water during mixing, while for the wet SAP mixing method, the SAP was pre-wetted with the corresponding amount of water for 3 h before mixing. By pre-wetting SAP to full capacity, the wet SAP mixing method ensures water availability and reduces self-desiccation. The wet SAP mixing method uses SAP that is fully saturated with water before mixing, which ensures water availability to prevent self-desiccation. Both mixing steps for mortar and concrete with SAP are shown in Figure 6 and Figure 7. In both mixing methods for mortar, the cement, water, IC water, and dry or wet SAP were premixed for 30 s at low speed. Then, the sand was added to mix for 210 s. The total mixing time was 4 min. For concrete mixing, crushed limestone and sand were premixed for 3 min. Next, the cement and dry or wet SAP were added and mixed for 3 min. Then, the water was added and mixed for 5 min. The total mixing time was 11 min.

2.4. Mixture Proportions

Five mortar mixtures were tested, as shown in Table 2. The mixture proportions were designed as W35, W35SD, W35SW, W35GSW, and W46. W35 and W46 were mortar mixtures without SAP, with water-to-binder ratios of 0.35 and 0.46, respectively. W35SD, W35SW, and W35GSW were mortar mixtures with SAP (0.1% by weight of cement content) prepared with different mixing methods and had a water-to-binder ratio of 0.35. The mixture prepared using the dry SAP mixing method is W35SD, and the mixtures prepared using the wet SAP mixing method are W35SW and W35GSW. The original size of the SAP was used in W35SW, while W35GSW used ground SAP. All SAP mixtures had an IC water-to-binder ratio of 0.107.
Three concrete mixtures were tested as shown in Table 3. Mixture proportions were designed as C35, C35SD, and C35SW. Mixture C35 had a water-to-binder ratio of 0.35 and no SAP. Mixtures C35SD and C35SW had a water-to-binder ratio of 0.35 and were mixed with SAP. Mixtures C35SD and C35SW used the dry and wet SAP mixing methods, respectively. The particle size of SAP was 150–300 µm in the dry stage. The amount of internal curing water was equivalent to 0.18 to the weight of cement according to powers’ model [4].

2.5. Flow Table and Setting Time Testing

The flow table testing was conducted using fresh mortar after mixing to assess its workability according to ASTM C230/C230M-14 [19]. Three specimens were tested to determine the average flow rate at 0, 60, and 120 min.
Setting time testing was carried out to ascertain the duration of the setting of mortar, which is crucial for determining optimal casting, placing, and finishing times, in accordance with ASTM C807-13 [20]. Three specimens of mortar were tested to determine the average needle penetration every 15 min. The initial and final setting times were defined as the times when needle penetration was 25 and 0 mm, respectively.

2.6. Autogenous Shrinkage Testing

Autogenous shrinkage occurs due to hydration and chemical shrinkage after setting time under sealed conditions without external forces. More autogenous shrinkage can be expected in the concrete with lower water-to-cement ratio (w/c).
To determine the autogenous shrinkage, specimens were prepared with dimensions of 25 × 25 × 285 mm for mortar and 75 × 75 × 285 mm for concrete. Three specimens of each type were tested. After 12 h of casting, the specimens were removed from the molds and wrapped with 10 layers of plastic and 2 layers of foil to maintain moisture (refer to Figure 8a). They were then stored in a chamber maintained at a temperature of 23 ± 1 °C and a relative humidity (RH) of 50 ± 2%. Autogenous shrinkage testing was conducted and monitored for a duration of 42 days.

2.7. Total Shrinkage Testing

Total shrinkage is the sum of autogenous shrinkage and drying shrinkage. Drying shrinkage tends to be more pronounced in mixtures with higher water-to-cement (w/c) ratios. In real-world scenarios, structures experience both types of shrinkage. When the w/c ratio exceeds 0.35, total shrinkage decreases as the w/c ratio increases. Conversely, when the w/c ratio is below 0.35, total shrinkage increases with higher w/c ratios. Factors such as low relative humidity, high wind speed, inadequate curing, and increased surface area can exacerbate the influence of drying shrinkage on concrete structures.
To determine the total shrinkage, specimens were prepared with dimensions of 25 × 25 × 285 mm for mortar and 75 × 75 × 285 mm for concrete. Three specimens of each type were tested. After 12 h of casting, the specimens were removed from the molds and wrapped in 10 layers of plastic and 2 layers of foil to maintain moisture for 7 days. Subsequently, the plastic and foil were removed (refer to Figure 8b). The specimens were then stored in a chamber at a temperature of 23 ± 1 °C and a relative humidity (RH) of 50 ± 2%. Total shrinkage and weight loss testing were conducted and monitored over a duration of 42 days.

2.8. Drying Shrinkage Calculation

The equation below shows how the drying shrinkage of mortar and concrete was determined, as mentioned in Section 2.7 on total shrinkage testing.
ΔD = ΔT − ΔA
where ΔD (µε) is the drying shrinkage at any age; ΔT (µε) is the total shrinkage at any age; ΔA (µε) is the autogenous shrinkage at any age.

2.9. Compressive Strength Testing

The compressive strength testing for mortar was conducted according to ASTM C109/C109M-13 [21]. Cubic specimens measuring 50 × 50 × 50 mm were used for mortar testing. For concrete, cylindrical specimens with dimensions of 100 mm in diameter and 200 mm in height were employed. After casting, three types of curing were applied: curing in water, covered with a plastic sheet (5 layers), and air-curing at room temperature (27–33 °C) with a relative humidity (RH) of 58–71%.
For mortar, five specimens of each curing type were tested at 7 and 28 days, respectively. Similarly, compressive strength for concrete was measured at the ages of 7 and 28 days. The average compressive strength of the three specimens was calculated for concrete at each testing age.

3. Test Results and Discussion

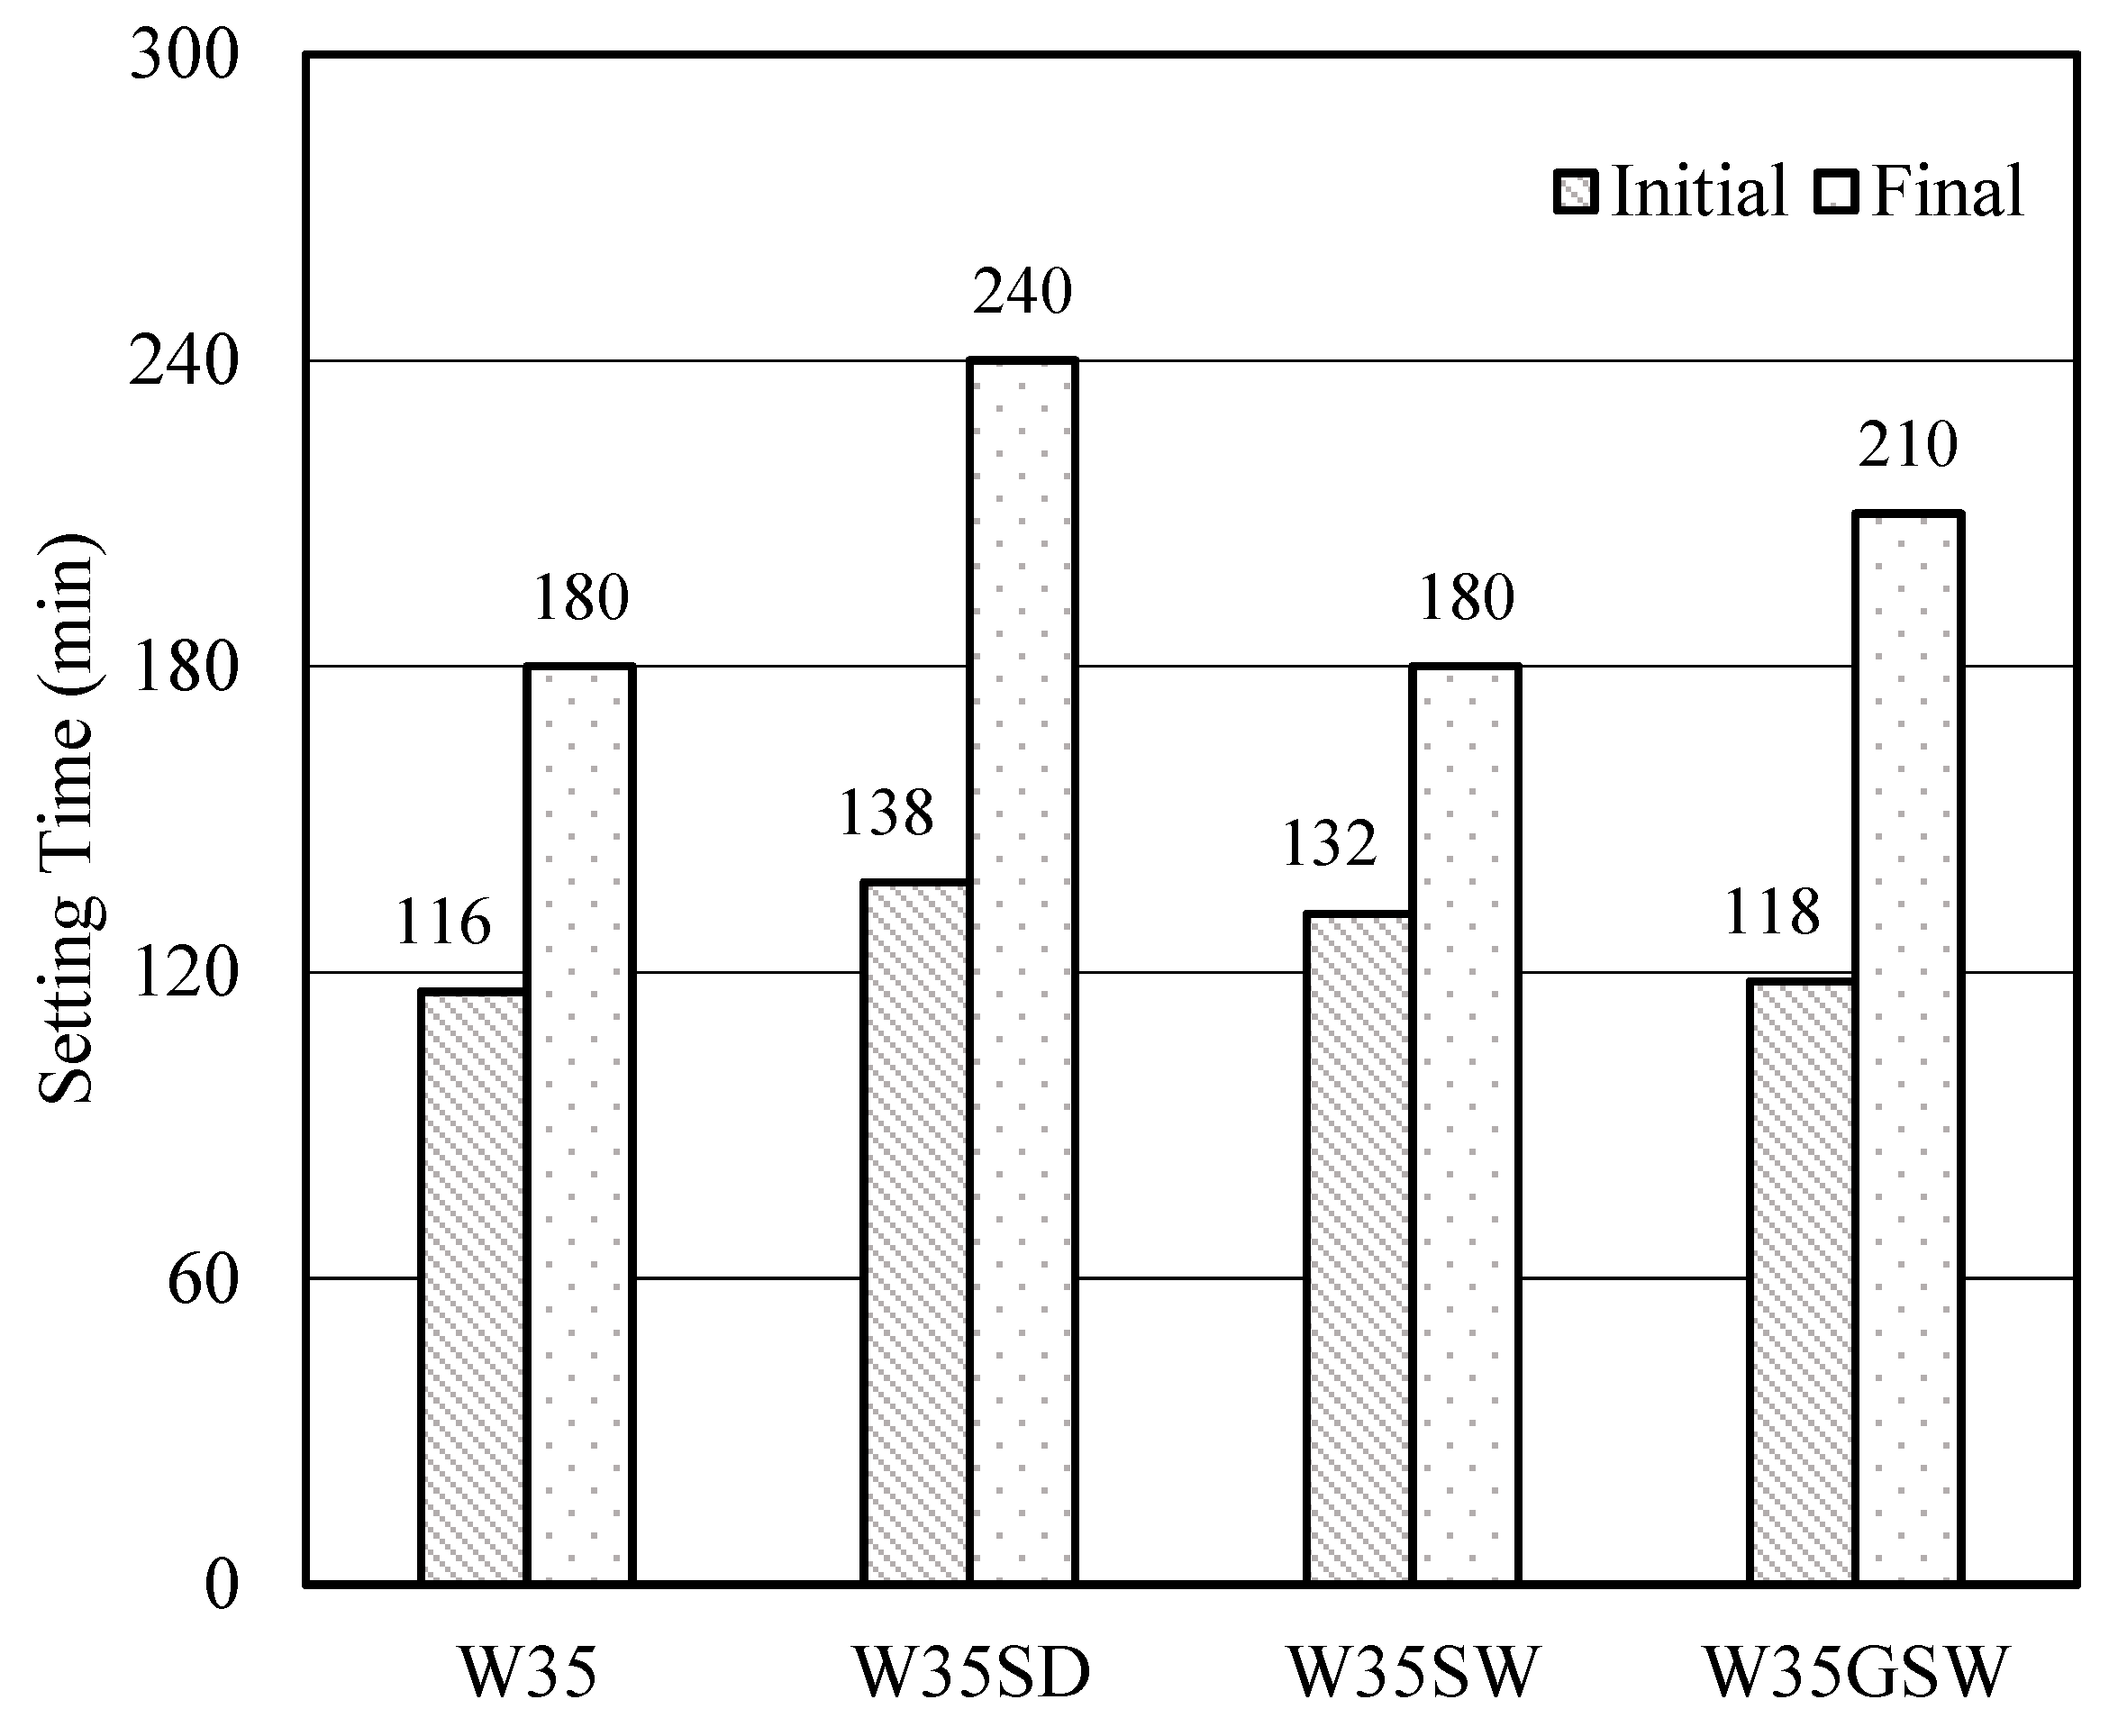
3.1. Setting Time and Flow Table

Figure 9 shows that mixtures with SAP have a prolonged initial setting time compared to W35. W35SW has longer initial setting time than W35GSW. The result also showed that the SAP with large particle size resulted in longer initial setting time than the case of the SAP with small particle size. The final setting time of W35SW was similar to that of W35. A possible explanation is that IC water in the SAP was desorbed in small amounts, which could not sufficiently affect the setting process. The final setting of W35GSW increased when compared to W35 because the w/c ratio increased due to SAP desorbing the IC water before hardening. The smaller total surface area of SAP in W35SW reduced the water desorption from internal curing compared to SAP in W35GSW. Although the size of SAP affected the final setting time, it could not be safely concluded that the particle size of SAP or the increase in IC water affected the final setting time.
In Figure 10, the flow of W35SD was the highest because the water content in the mixture was higher than in any other mixtures. This could be explained by the fact that the SAP in W35SD could not absorb all the IC water during mixing, resulting in an increase in the water content in the mixtures. The flow of W35SW and W35GSW was higher than W35. The flow of W35GSW and W35SW at 0 and 60 min was nearly the same. However, the flow of W35GSW at 120 min was greater than that of W35SW. This corresponds to the setting time fostered by the ability of SAP to release the IC water during setting.
The slumps of C35, C35SD, and C35SW were equal to 7.65, 20.5, and 11.25 cm, respectively. It was observed that the slump of concrete with SAP was higher when compared with concrete without SAP. This corresponded to the flow rate of mortar.

3.2. Shrinkage

In Figure 11, the mixture with SAP reduced autogenous shrinkage compared with W35 at 42 days. The autogenous shrinkage of W35SD was the lowest at all ages. The autogenous shrinkage of W35SD, W35SW, and W35GSW compared with W35 was reduced by 27.2%, 3.9%, and 0.2% at 42 days, respectively. The reduction in autogenous shrinkage occurred by two mechanisms. (1) During mixing, SAP could not absorb all the IC water in the dry SAP mixing method, and it partially desorbed water during mixing in the wet SAP mixing method, both of which resulted in an increase in the w/c ratio. (2) The IC water in SAP was released after mixing to reduce capillary suction and supply water used in the hydration reaction. The reduction in autogenous shrinkage of the mixtures with SAP at early ages corresponded with the previous study [7]. From the previous study [22], it was proposed that “the particle size of SAP was the cause of the effectiveness of SAP on mitigating autogenous shrinkage. SAP with larger particle size has large water absorptions and good effects on mitigating autogenous shrinkage”. However, in this study, it seemed that SAP with larger particle size could not always reduce autogenous shrinkage. The W35SW (mixtures with large SAP) had more autogenous shrinkage than W35GSW (mixtures with ground wet SAP) at early ages (1–28 days). A possible explanation was that the increasing pore size from large SAP increased water desorption, which led to the reduction in the resistance to shrinkage and increased autogenous shrinkage. According to Figure 5, despite the smaller particle size of ground wet SAP, it had slightly better water desorption than the larger particles. The reduction in autogenous shrinkage of the dry SAP mixing method observed in this study could be explained by the fact that dry SAP could absorb partial IC water. The remaining IC water would be combined with the water content of the mixtures, resulting in an increased w/c ratio, which delayed the setting time. It was also shown that W35SD had less autogenous shrinkage than W46, which was consistent with autogenous shrinkage behavior. A lower w/c ratio is anticipated to result in increased autogenous shrinkage, while a higher w/c ratio typically leads to decreased autogenous shrinkage. Consequently, the lower autogenous shrinkage observed in the mixture with dry SAP in comparison to wet SAP is evident.
In Figure 12, the total shrinkage of W35SD and W35GSW was less/lower than that of W35 after 14 and 12 days of mixing, respectively. The total shrinkage of W35SD was less/lower than that of W46 and another mixture with SAP. The dry SAP mixing method reduced the highest percentage of total shrinkage by 3.5% (reduction 50 µε) after 42 days when compared with W46. The total shrinkage of W35SD, W35SW, and W35GSW compared with W35 was increased by 7.8%, 15.9%, and 13.0% after 42 days, respectively. The results indicate that fine SAP exhibits less total shrinkage compared to coarse SAP. This may be due to the surface-to-volume ratio of internal curing water. Kamran [23] proposed that coarse SAP acts as a larger reservoir, while fine SAP acts as a smaller reservoir. Regarding moisture loss resulting in total shrinkage, it is observed that a higher loss of moisture can be found in coarse SAP than in fine SAP.
In Figure 13, the drying shrinkage of the mixtures with SAP was more/greater than that of W35. Among the mixtures with SAP, W35SW had the highest shrinkage, while W35GSW and W35SD had lower and the lowest shrinkage, respectively. The absorption and desorption ability of SAP water during mixing could affect w/c ratio, resulting in setting time and rate of flow loss of mortar. Using SAP could reduce drying shrinkage when compared with W46 (same water content). Compared with W35, the drying shrinkage of W35SD, W35SW, and W35GSW increased by 26.1%, 26.2%, and 19.9%, respectively, after 42 days.
In Figure 14, at the same level of weight loss, the drying shrinkage of W35 was the highest. However, all mixtures with SAP reduced the slope between drying shrinkage and weight loss when compared to W35 and W46. The drying shrinkage of mixtures with SAP was clearly lower than that of W35 and W46 when compared at all weight losses.
In this study, it seemed that the mixtures with SAP could not reduce the total and drying shrinkage. As shown in Figure 14, mixtures with SAP had lower drying shrinkage than W35 at the same level of weight loss. If weight loss of the sample could be prevented by external curing, a reduction in drying shrinkage occurred. Moreover, the reduction in drying shrinkage could decrease total shrinkage. The mixtures with SAP had lower total shrinkage of mixtures than W35, as shown in Figure 15. The lowest autogenous shrinkage of the mixtures with SAP could lead to the reduction in total shrinkage. Therefore, the dry SAP mixing method efficiently reduced shrinkage more than the wet SAP mixing method. It is important to note that dry SAP consists of numerous small water reservoirs distributed more homogeneously, whereas wet SAP comprises a few larger reservoirs. Once internal curing water has been utilized for hydration, any remaining water may transfer throughout the surrounding environment, potentially leading to drying shrinkage and weight loss in the hardened state. More drying shrinkage and weight loss might be expected in the mixture with a large amount of remaining water.
In Figure 16, the concrete with SAP had lower autogenous shrinkage than C35 after 42 days. The autogenous shrinkage of C35SD was the lowest at all ages. When compared with C35, the autogenous shrinkage of C35SD and C35SW was reduced by 15% and 9.1%, respectively, after 42 days, respectively. It could be concluded that the dry SAP mixing method was more efficient in reducing autogenous shrinkage in concrete, as well as in mortar, than the wet SAP mixing method. This may be due to the reduction in self-desiccation from dry SAP that results from lowering the capillary pressure in the fresh paste, which is in good agreement with the literature [7].
In Figure 17, the total shrinkage of C35SD was less than that of C35 and C35SW at all ages. The total shrinkage of C35SW was higher than C35 at all ages. The total shrinkage of C35SD, compared with C35 and C35SW, decreased by 9.5% and 13.5%, respectively, at/after 42 days. The total shrinkage of C35SD was less than C35, due to the ratio of autogenous-to-drying shrinkage (A/D ratio), which was higher when compared with the results derived from equivalent mortar specimens. The A/D ratio of C35SD and W35SD was equal to 60:40 and 30:70 (the autogenous shrinkage in mortar and concrete was equal). The larger size of specimens and adding coarse aggregate in concrete increased the A/D ratio. The increase in A/D ratio led to the decrease in drying shrinkage. Ultimately, the total shrinkage of C35SD was less than C35.
In Figure 18, the concrete with SAP tended to increase drying shrinkage when compared with C35. The drying shrinkage of C35SW was the highest. The drying shrinkage of C35SW, compared with C35, increased by 23.6% at/after 42 days. However, the drying shrinkage of C35SD, compared with C35, decreased by 1.8% at/after 42 days.
In Figure 19, at the same level of weight loss, the drying shrinkage of C35 was the highest. However, the slope of the relationship between weight loss and drying shrinkage was lower for all types of concrete when compared to C35. The drying shrinkage of concrete with SAP was clearly lower than C35 when compared at all weight losses.
In Figure 20, the concrete with SAP had the lowest autogenous shrinkage, which reduced the total shrinkage. Therefore, the dry SAP mixing method was more efficient in reducing shrinkage than the wet SAP mixing method.

3.3. Compressive Strength

Figure 21A,B show the compressive strength at 7 and 28 days for the mortar with/without SAP. As expected, the mixture with SAP had lower compressive strength than W35. Compared with W35, the compressive strength (water submersion at 7 and 28 days) of W35SD, W35SW, and W35GSW was decreased by 20.01–25.81% and 30.68–31.76%, respectively. The reason for the decrease in comprehensive strength was that IC water in SAP was released during mixing for the wet SAP mixing method, and the SAP could not fully absorb the water for the dry SAP mixing method. Both factors affected the w/c ratio and decreased strength. The W35SD and W35GSW had higher compressive strength (water submersion at 7 days) than W46, but W35SW had lower compressive strength than W46. The compressive strength of W46 at 28 days was higher than that of mixtures with SAP. The reduction in compressive strength of mixtures with SAP could be due to increasing porosity and w/c ratio [13,24]. In addition, the compressive strength of the dry SAP mixing method (W35SD) was higher than that of the wet SAP mixing method (W35SW). The compressive strength of W35GSW was higher than that of W35SW, due to W35GSW containing smaller particle sizes of SAP than W35SW. Larger SAP particles and wet SAP left larger pores in the cement paste after hydration than smaller particles and dry sap. For air exposure and plastic wrapping, compressive strength seemed to be less.

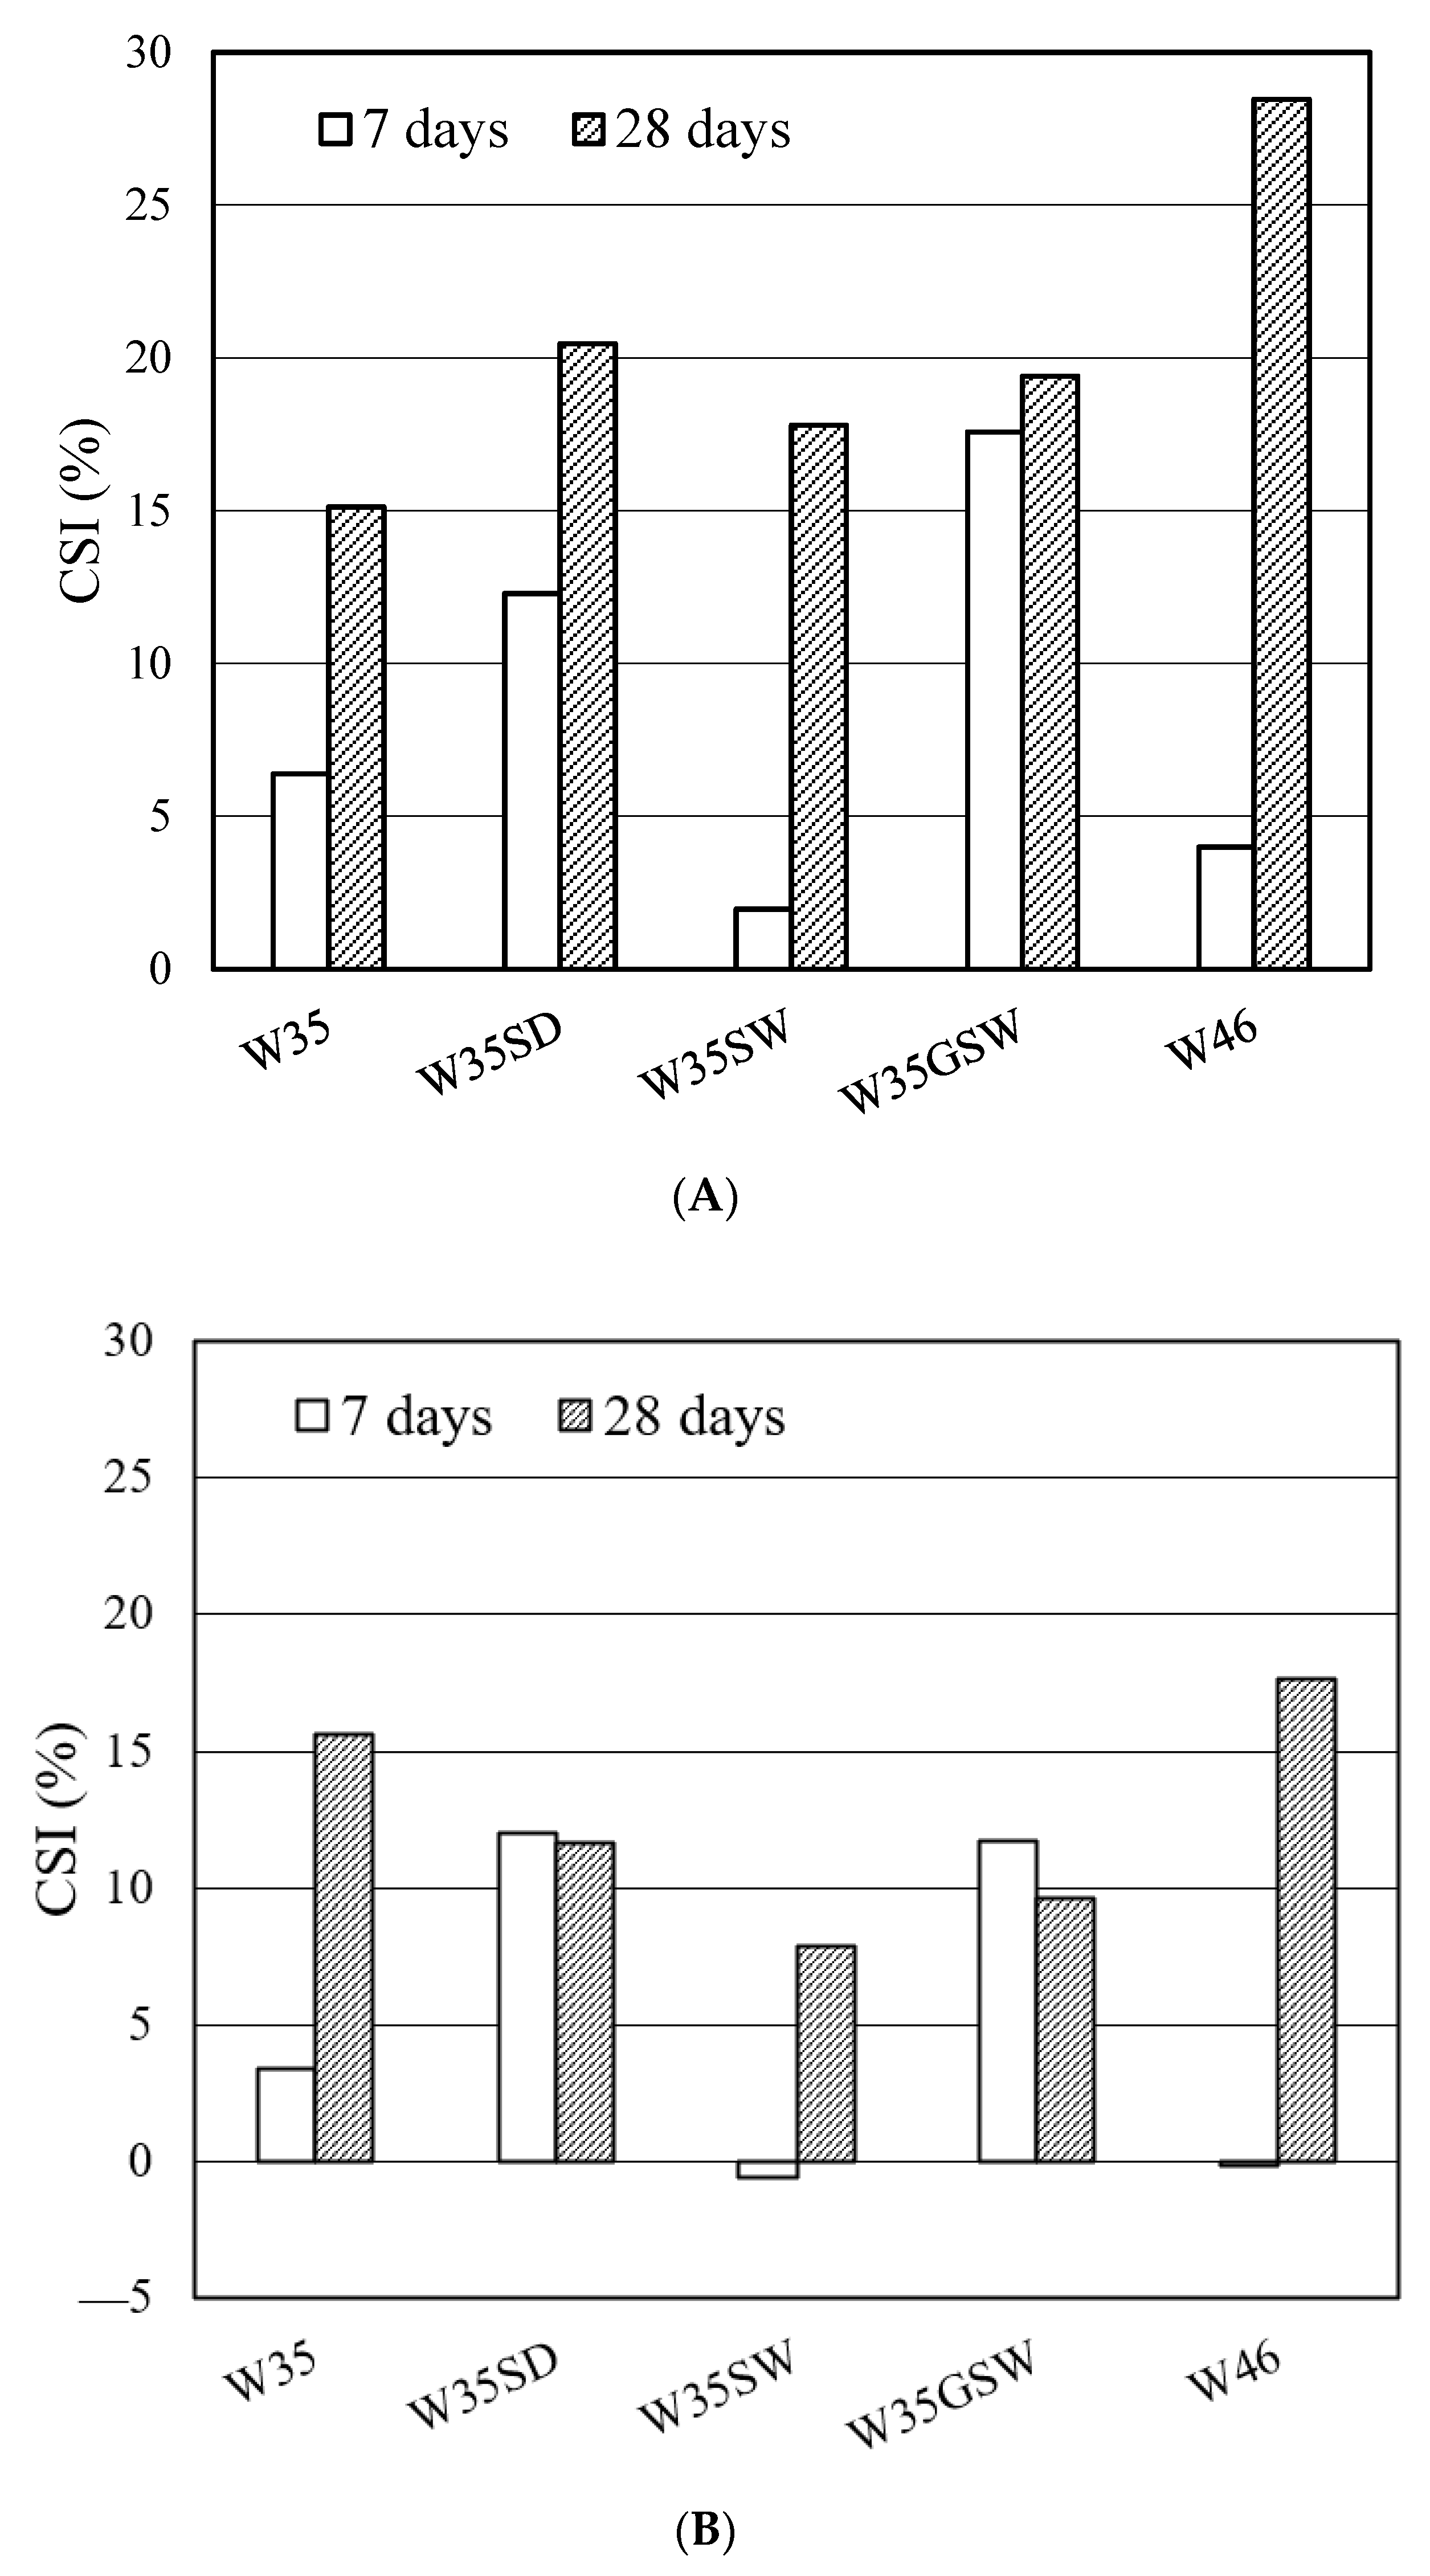
3.4. Curing Sensitivity Index (CSI)

From the result of compressive strength, CSI can be determined as follows:
CSI   ( % ) = f c W C f c ( O C ) f c W C × %
where CSI (%) is curing sensitivity index; fc′(WC) is the compressive strength with curing in water; fc′(OC) is the compressive strength with other curing. The CSI shows that curing affects compressive strength. A high value signifies a greater effect on reducing compressive strength.
Figure 22A shows the CSI by air exposure at 7 and 28 days for the mortar with/out SAP. It was found that the use of SAP reduced CSI at 28 days when compared with W46. SAP could reduce CSI by its internal curing, because it supplied subsequent water for hydration reaction. The particle size of SAP was important for mitigation of CSI. For W35GSW, its CSI was higher than that of W35 at all ages. It could be due to the small particle size of SAP, which increased the surface area to release more IC water, and could lower IC water retention. For these reasons, it could not maintain the hydration reaction to reduce CSI.
For CSI by plastic wrapping shown in Figure 22B, it was found that the use of SAP reduced CSI at 28 days when compared with W35 and W46. The CSI by the dry SAP mixing method (W35SD) was higher than the other mixing method. The W35SW mixture was the most effective in reducing CSI due to large particle size of SAP, which enhanced IC water retention.

4. Conclusions

This study focused on the effect of the SAP mixing method. The effects of two mixing methods for SAP on the properties of mortars were investigated. According to the findings in this study, the following conclusions can be drawn:
(1)
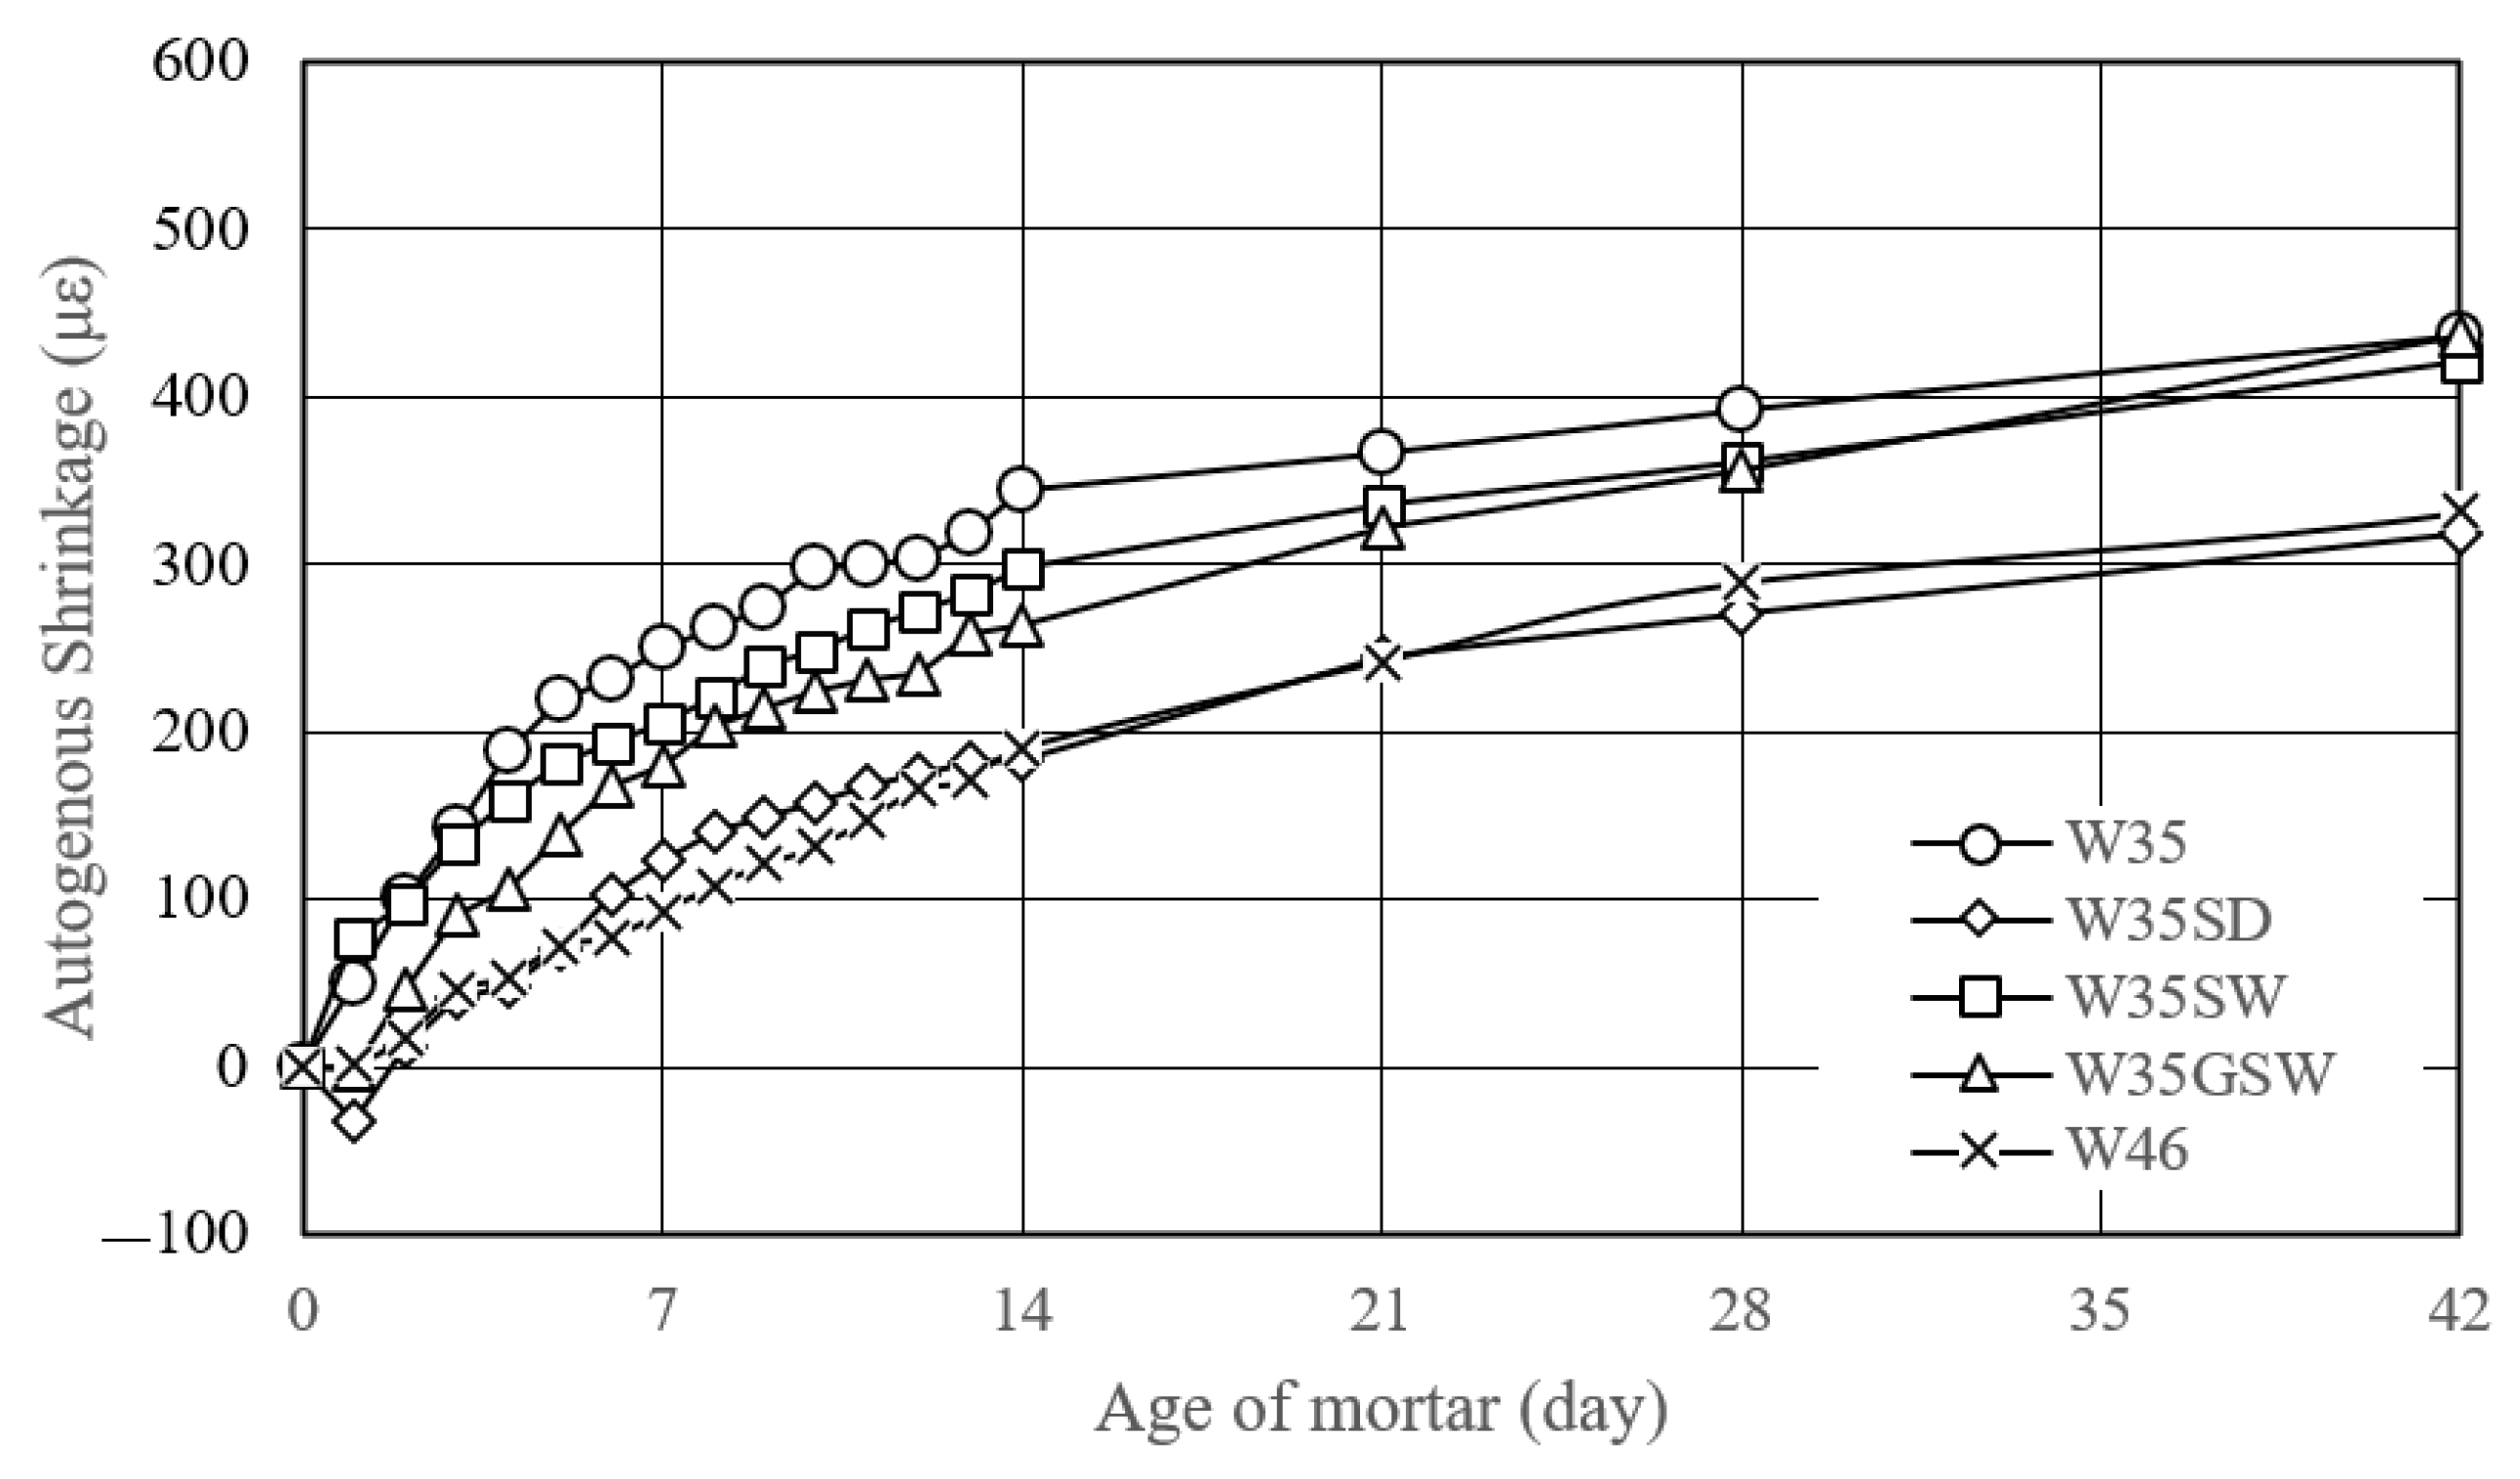
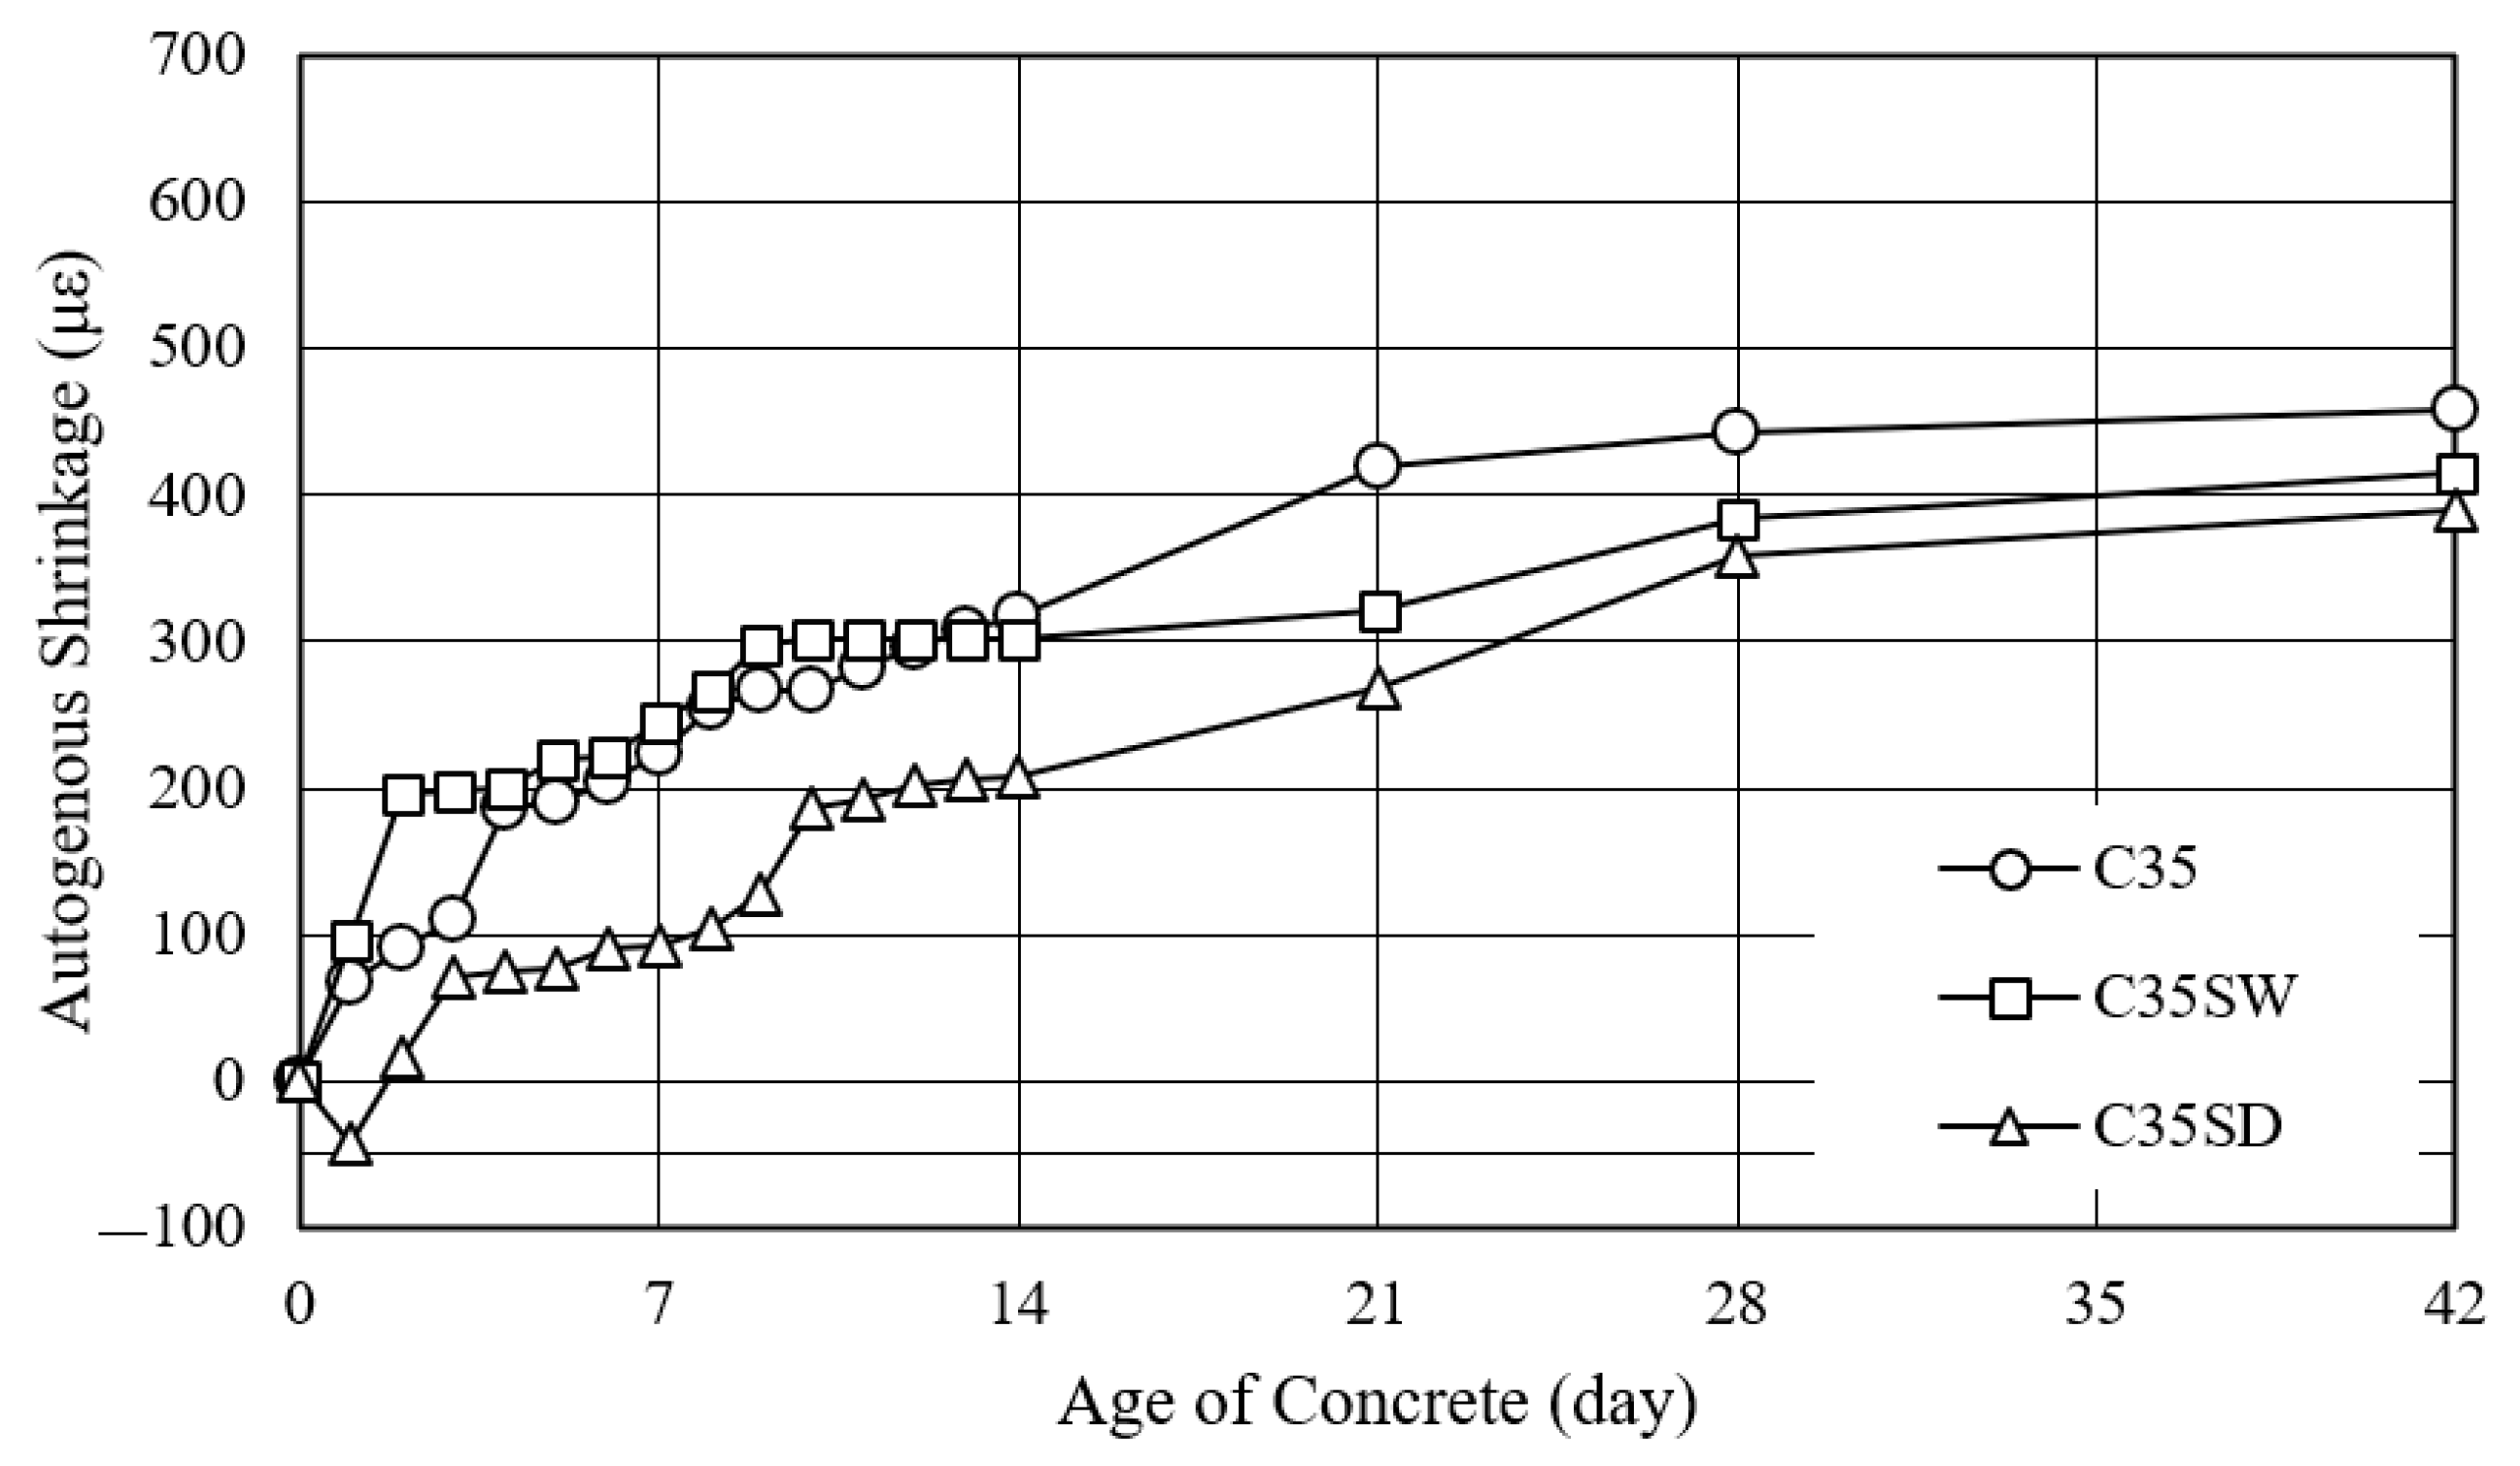
The use of SAP in the mixtures reduced autogenous shrinkage compared to W35 at 42 days due to the extra water incorporated in the mixtures. Moreover, the dry SAP mixing method reduced autogenous shrinkage more than the wet SAP mixing method in both mortar and concrete mixtures.
(2)
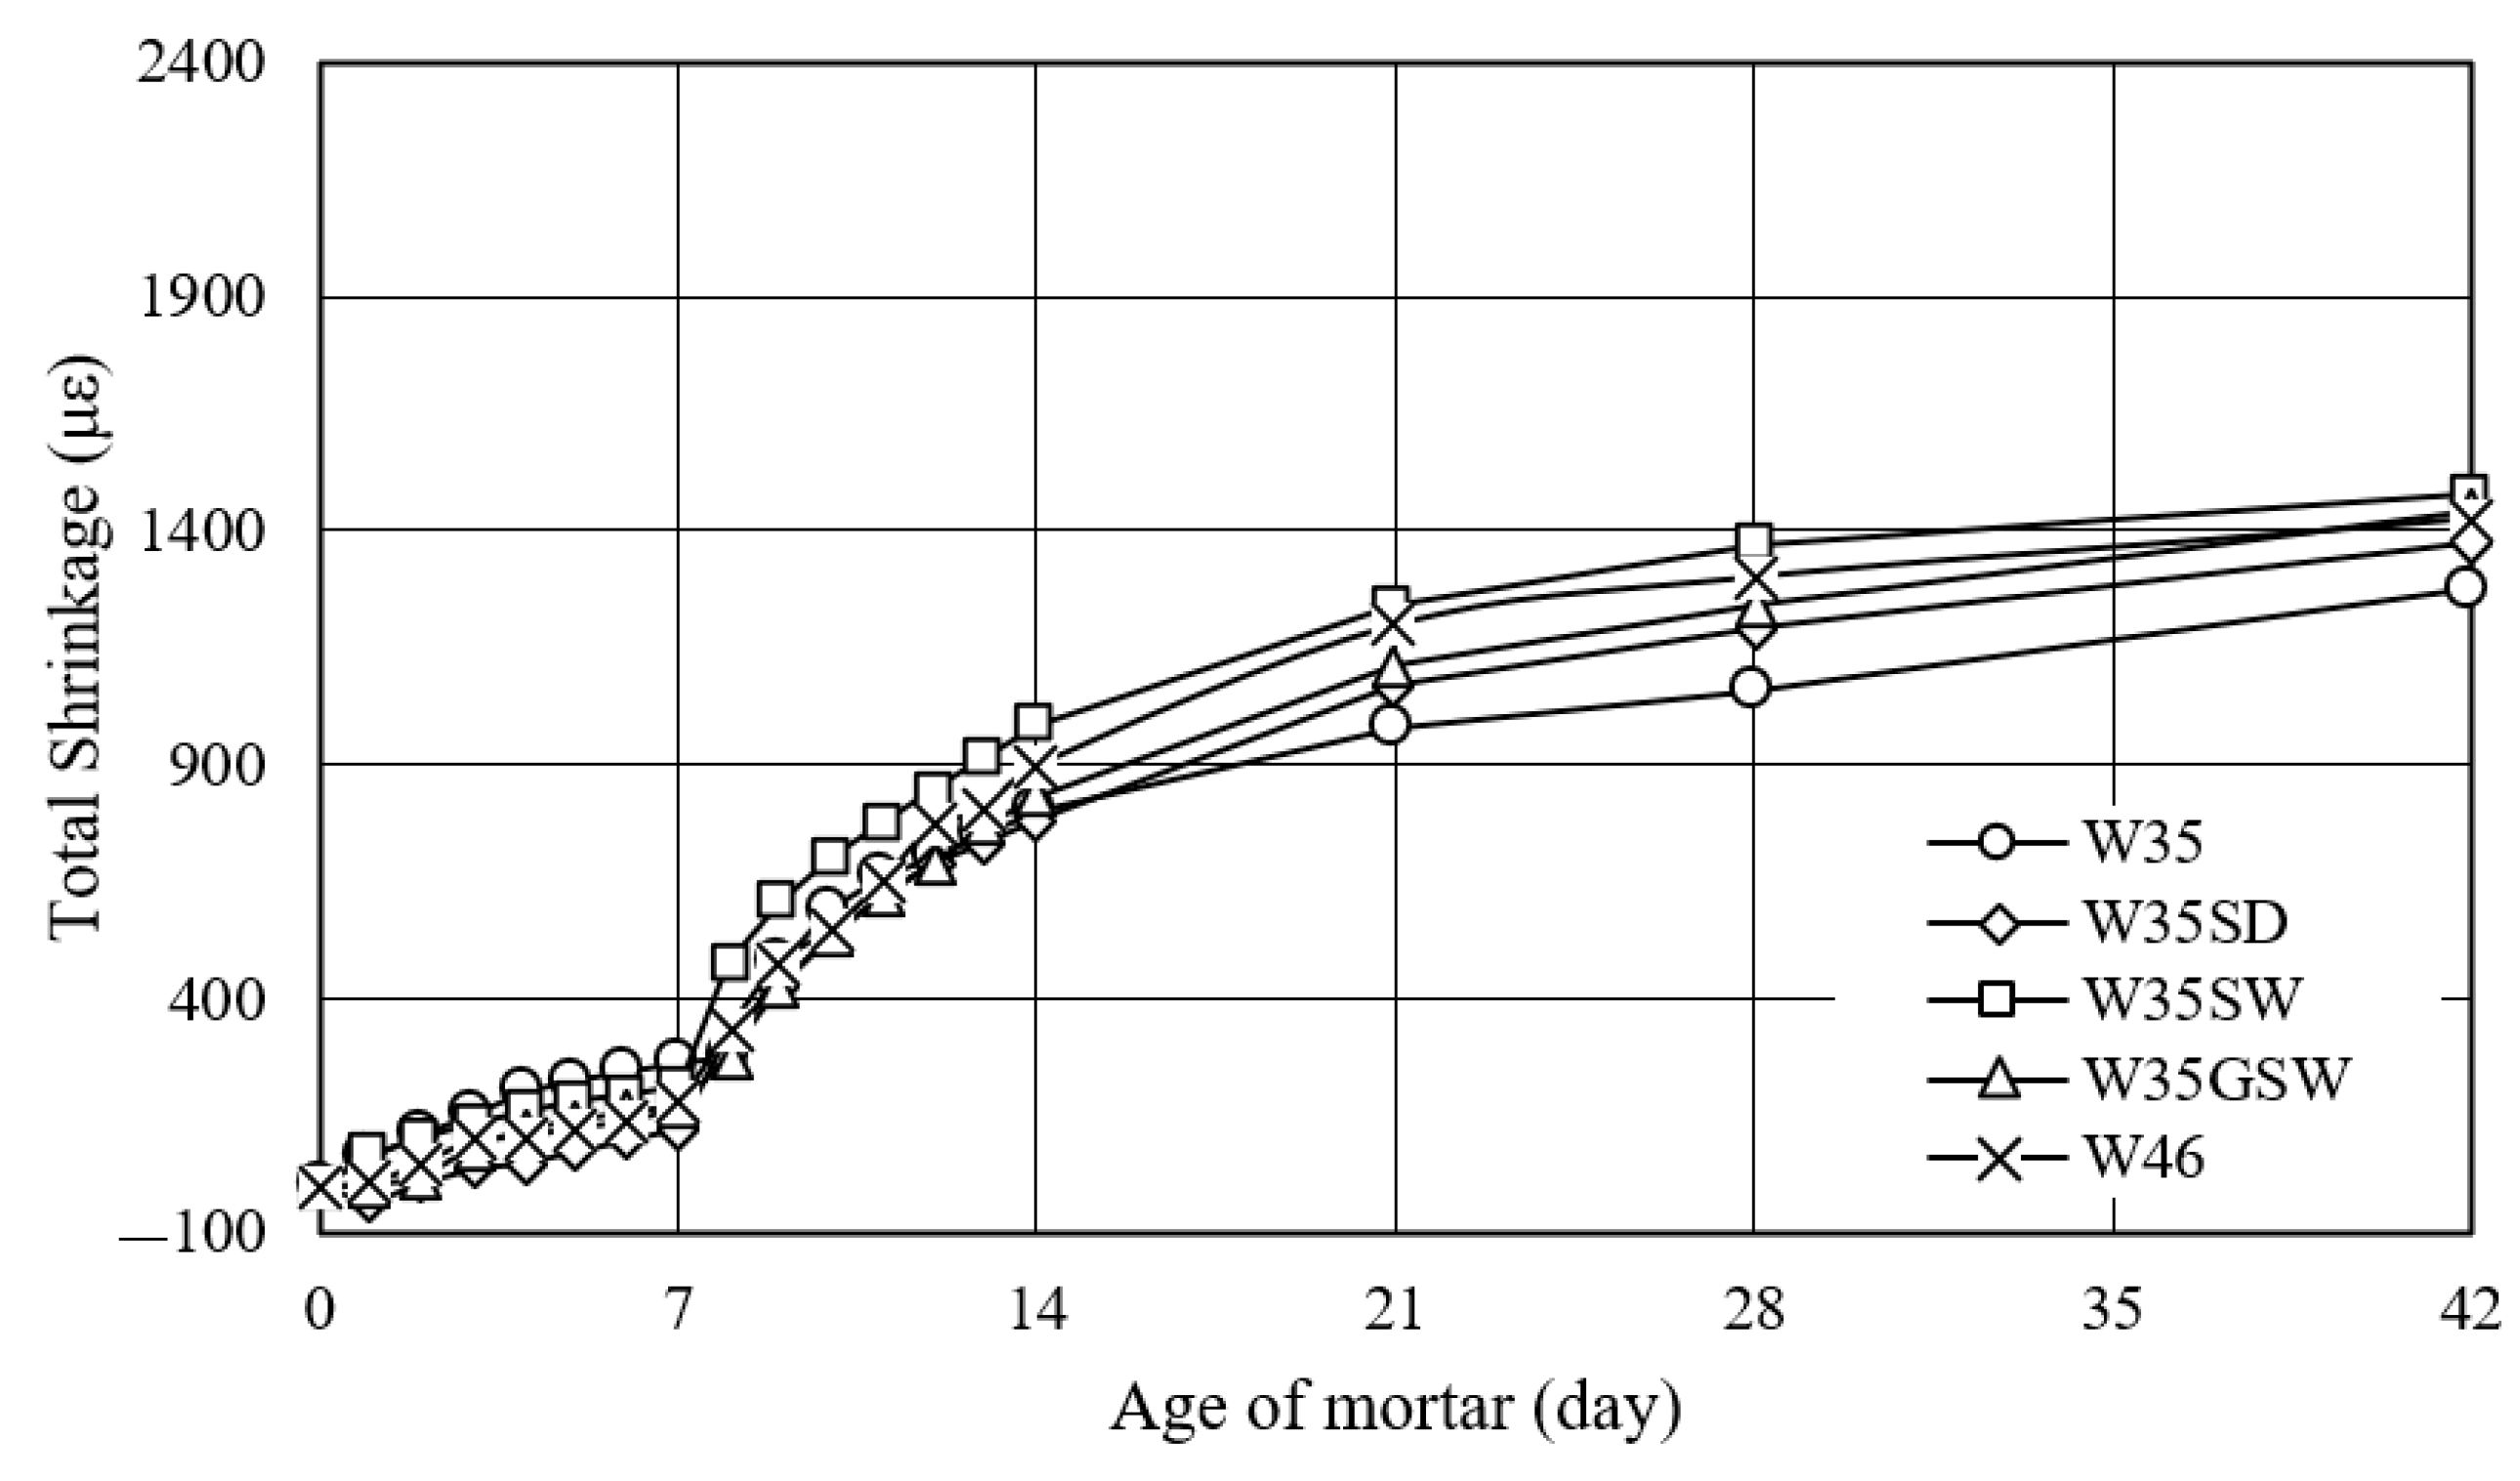
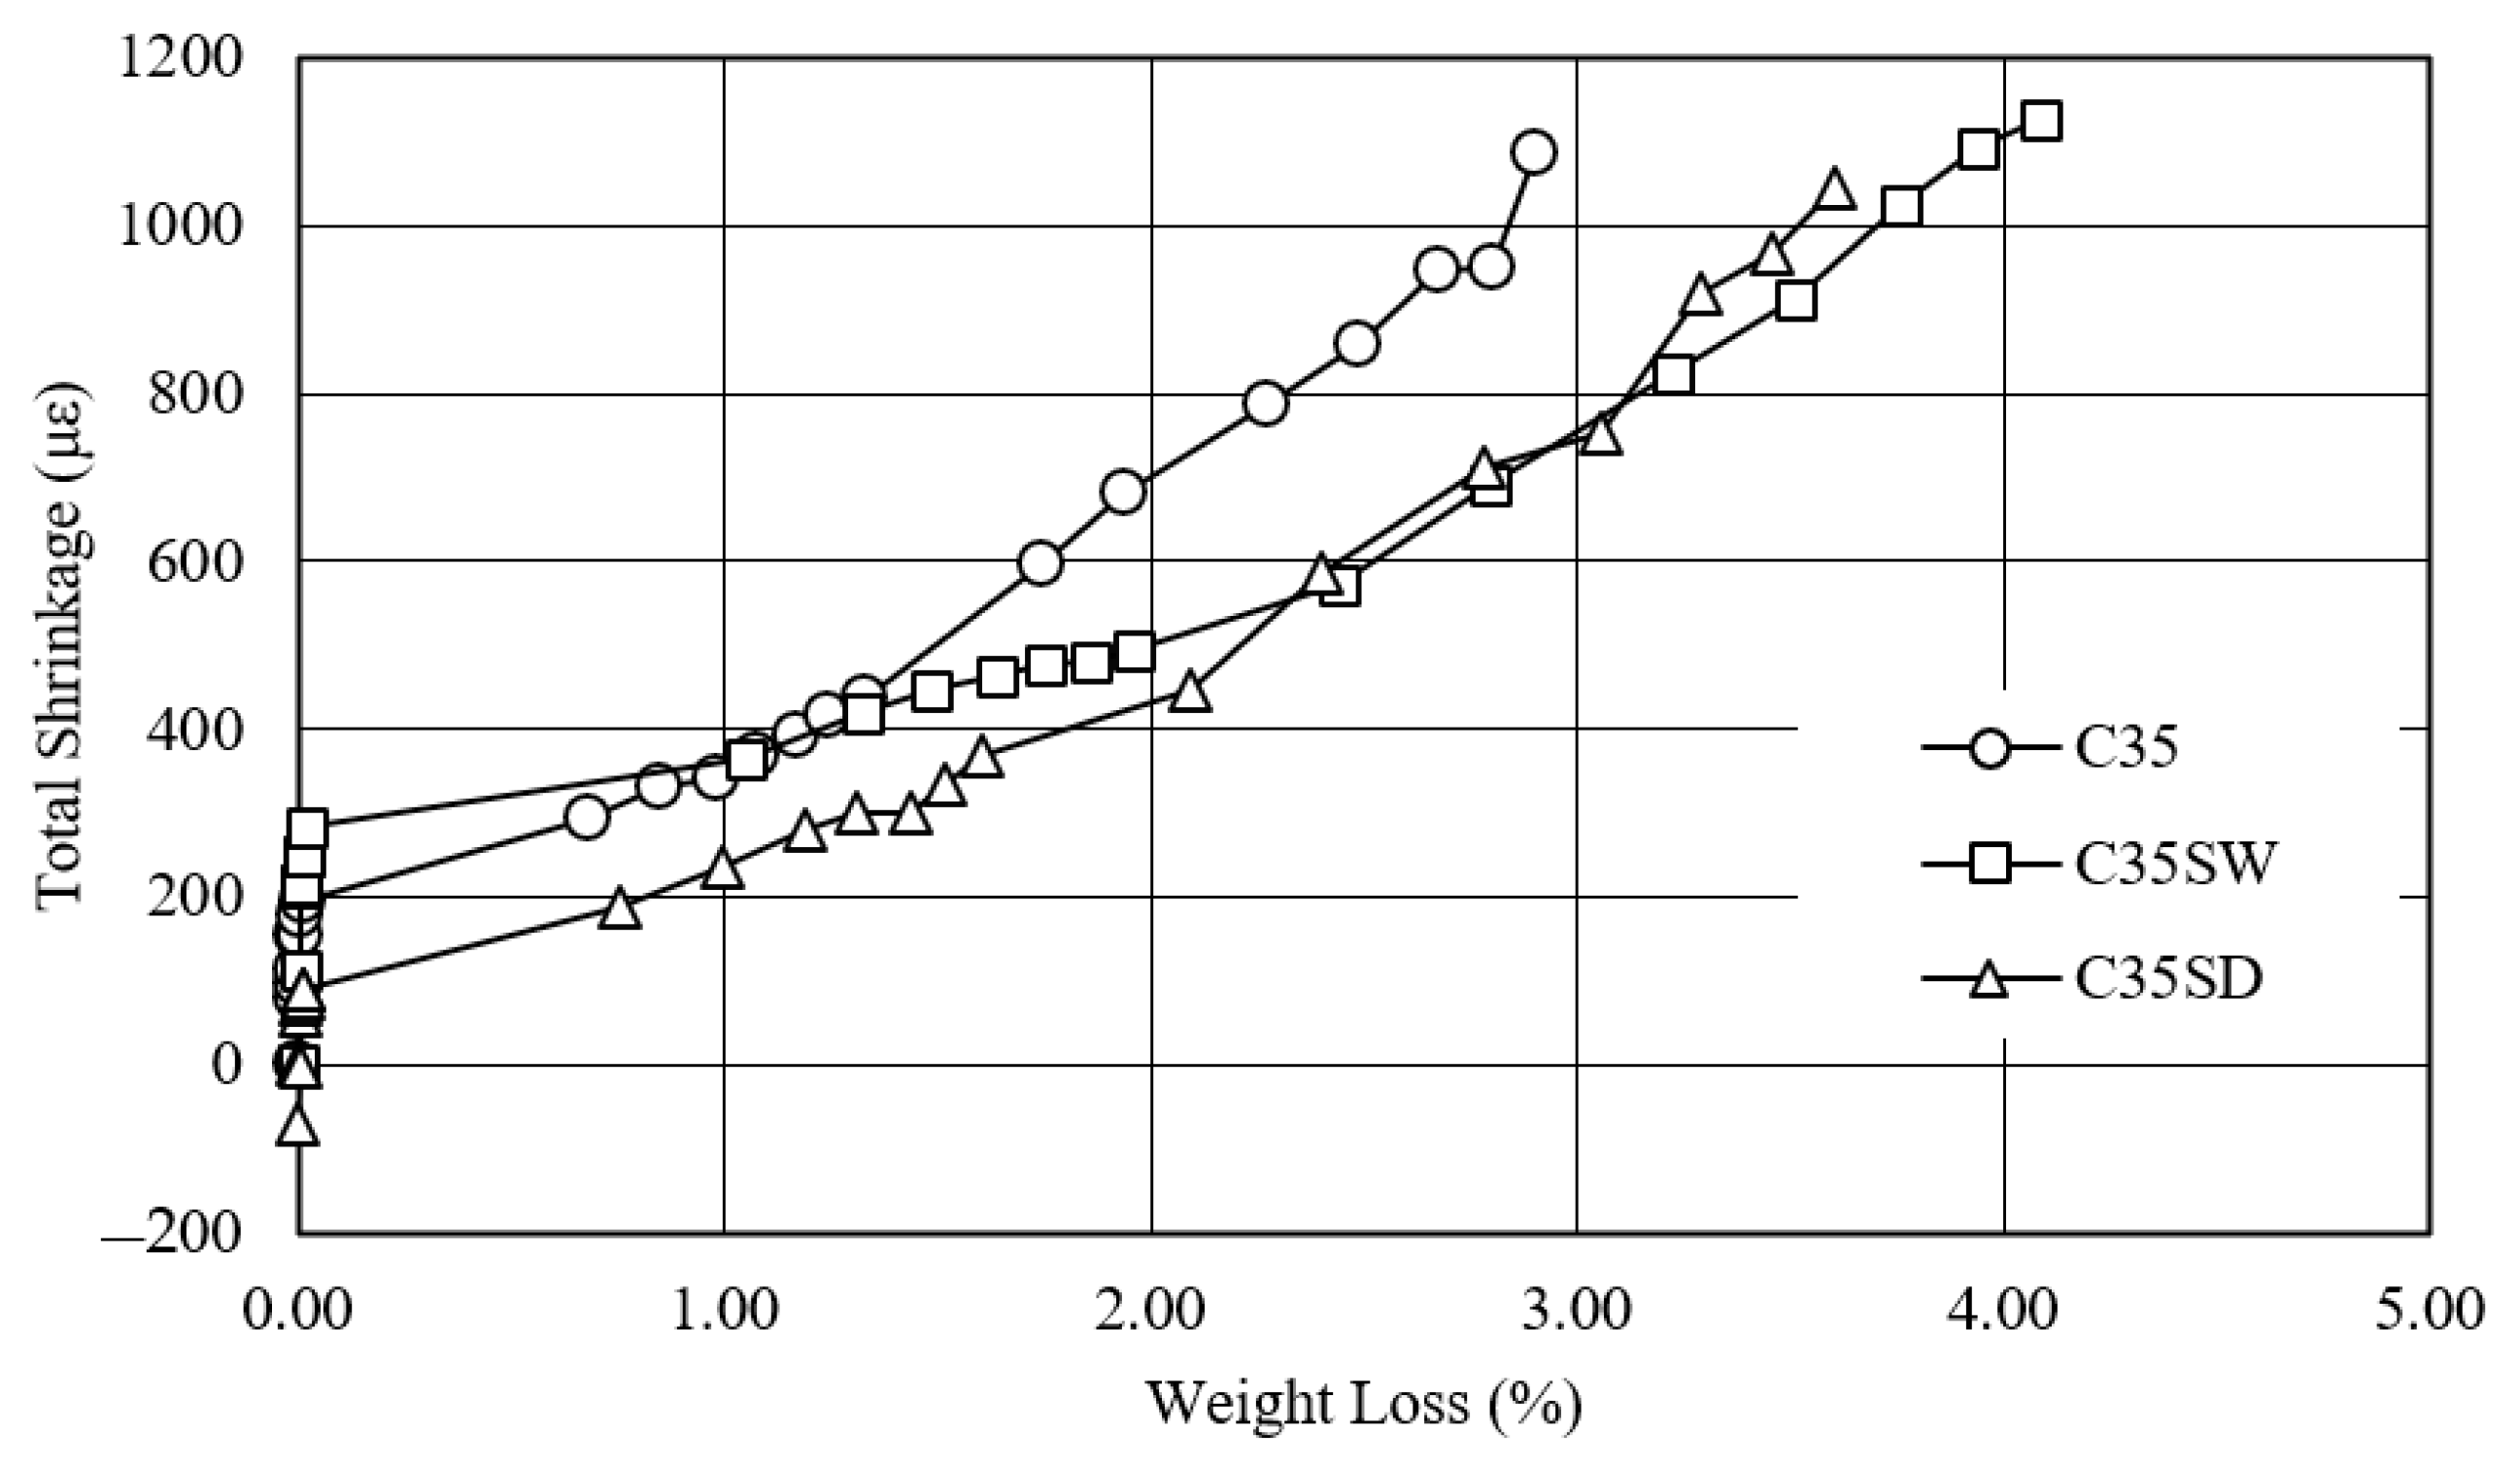
The total shrinkage of W35SD and W35GSW was less than W35 at 14 and 12 days, respectively. In comparison to W46 and another mixture containing SAP, the dry SAP mixing method reduced total shrinkage more effectively. Moreover, fine SAP showed better performance in reducing total shrinkage than coarse SAP.
(3)
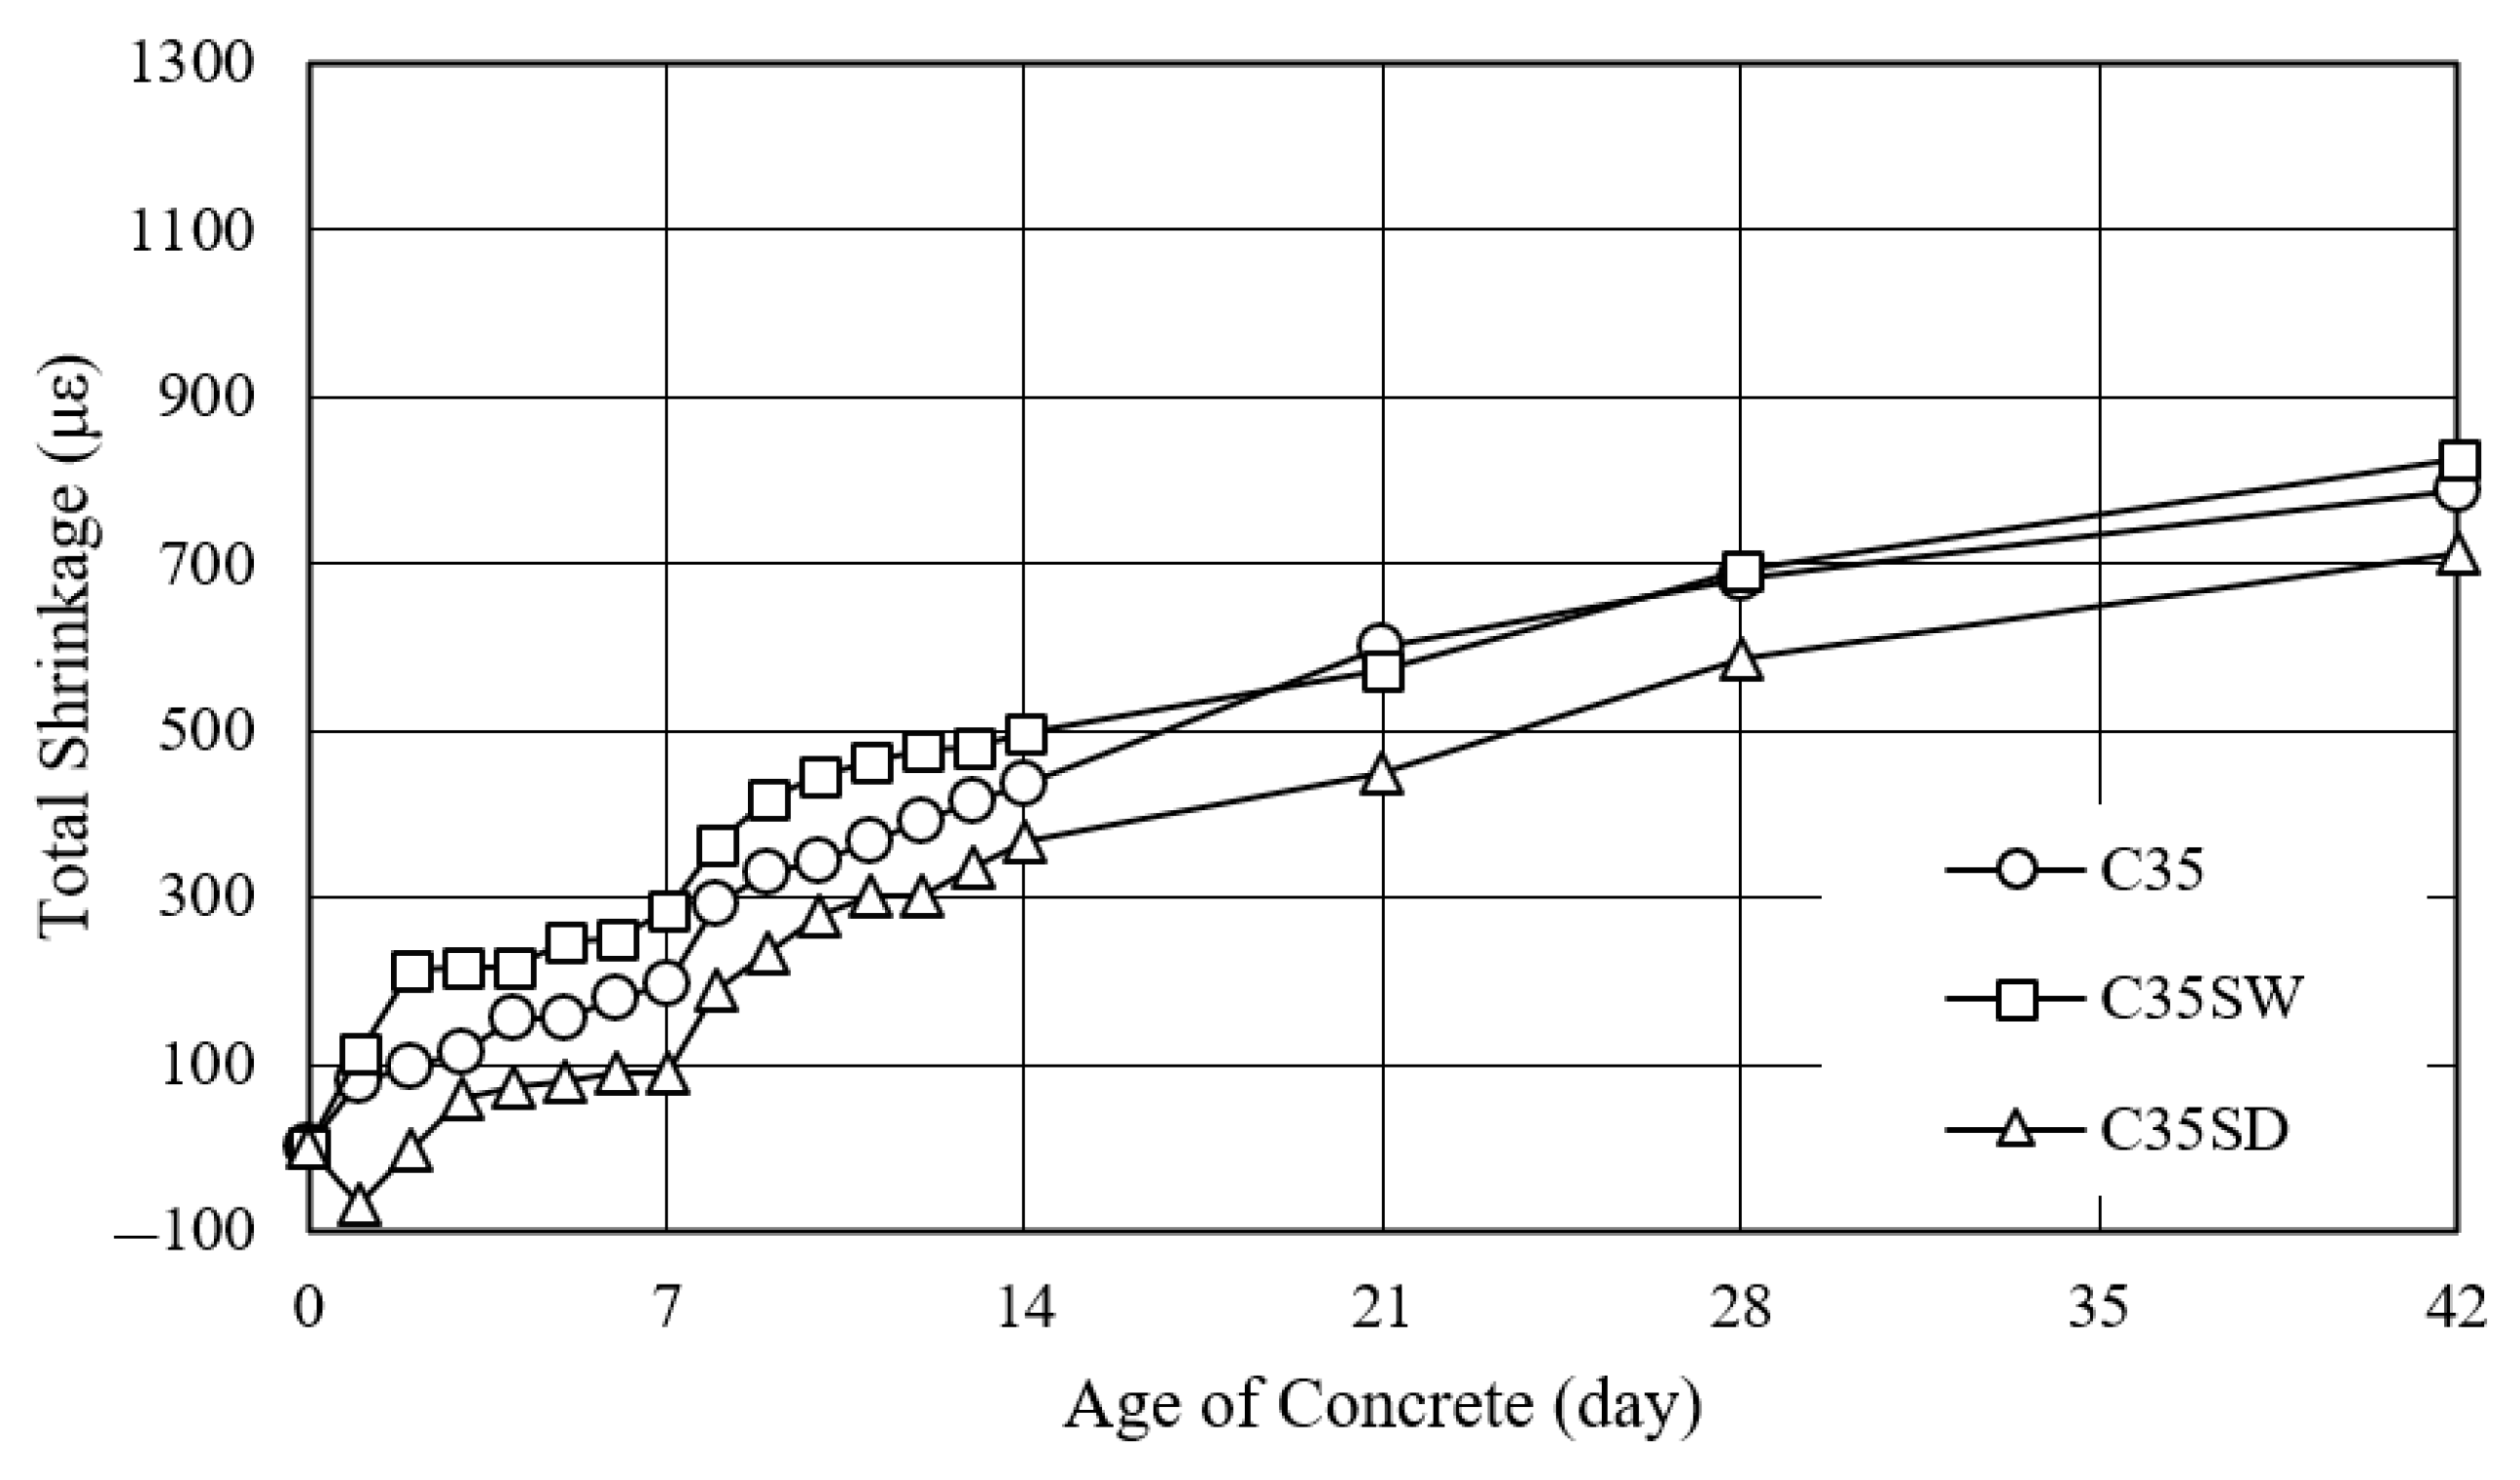
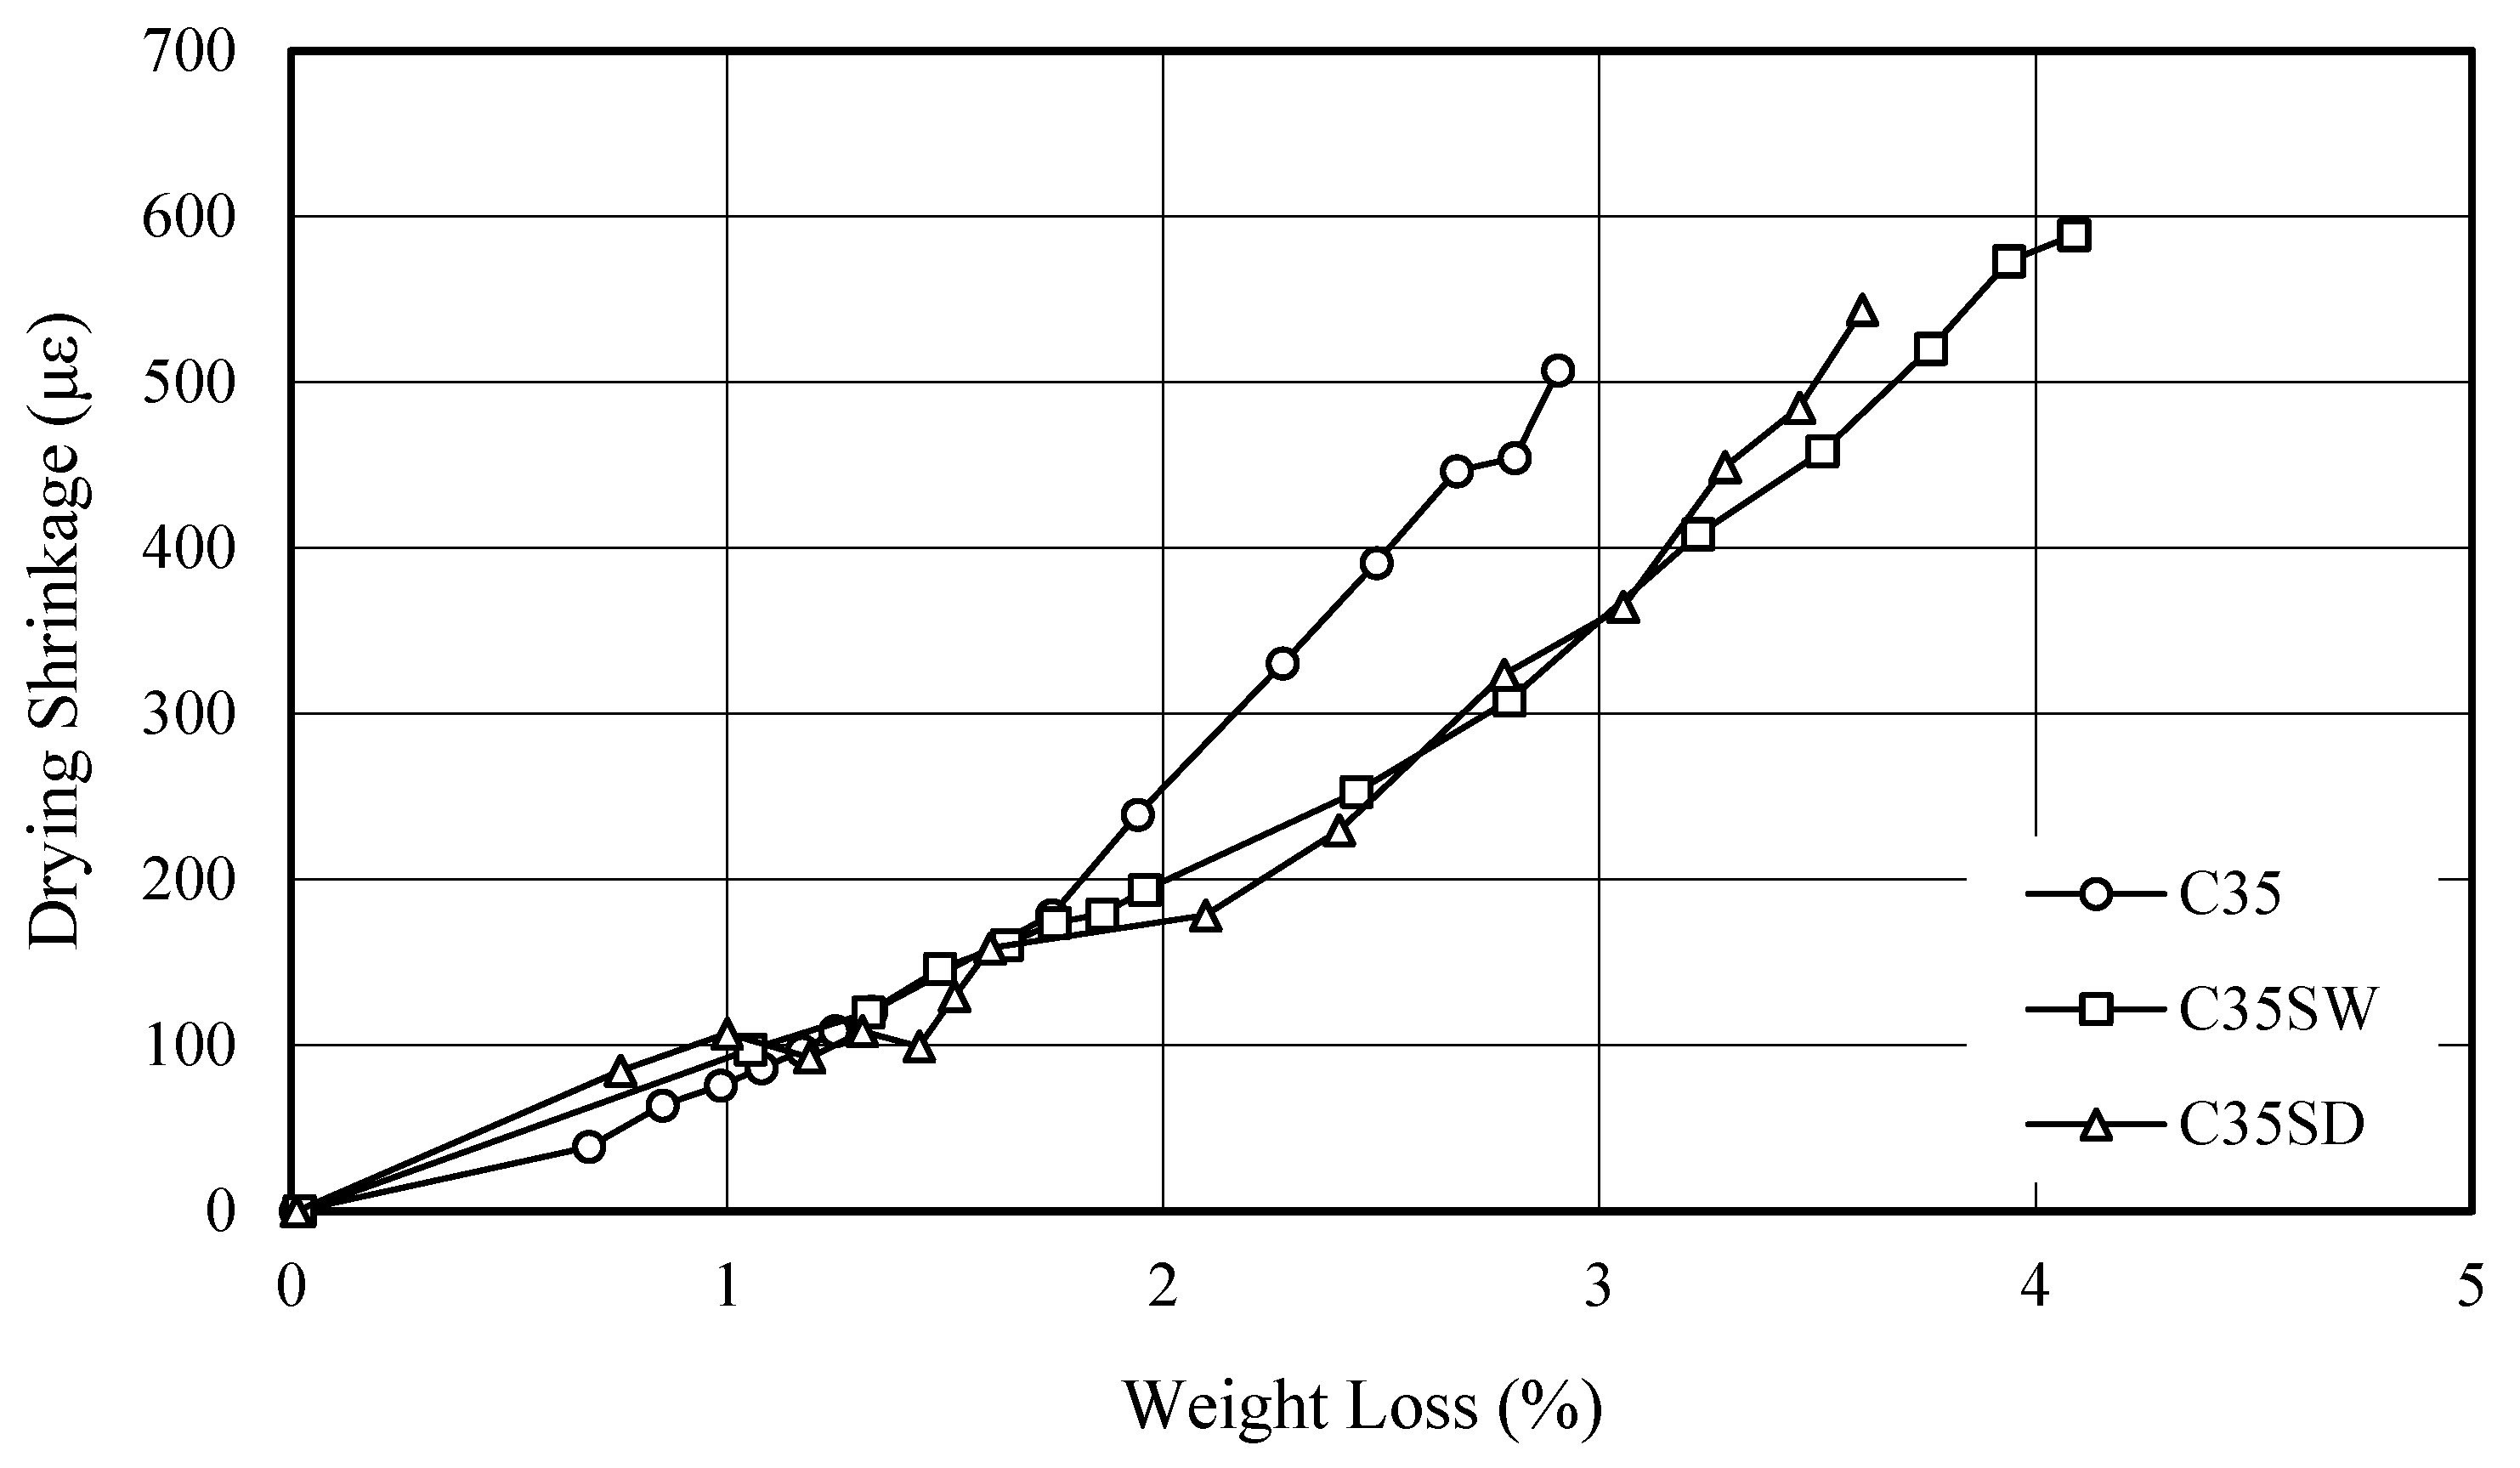
The dry SAP mixing method was more effective than the wet method in reducing drying shrinkage in both mortar and concrete mixtures. Fine SAP outperformed coarse SAP in decreasing shrinkage, although mixtures containing SAP exhibited higher drying shrinkage compared to those without SAP.
(4)
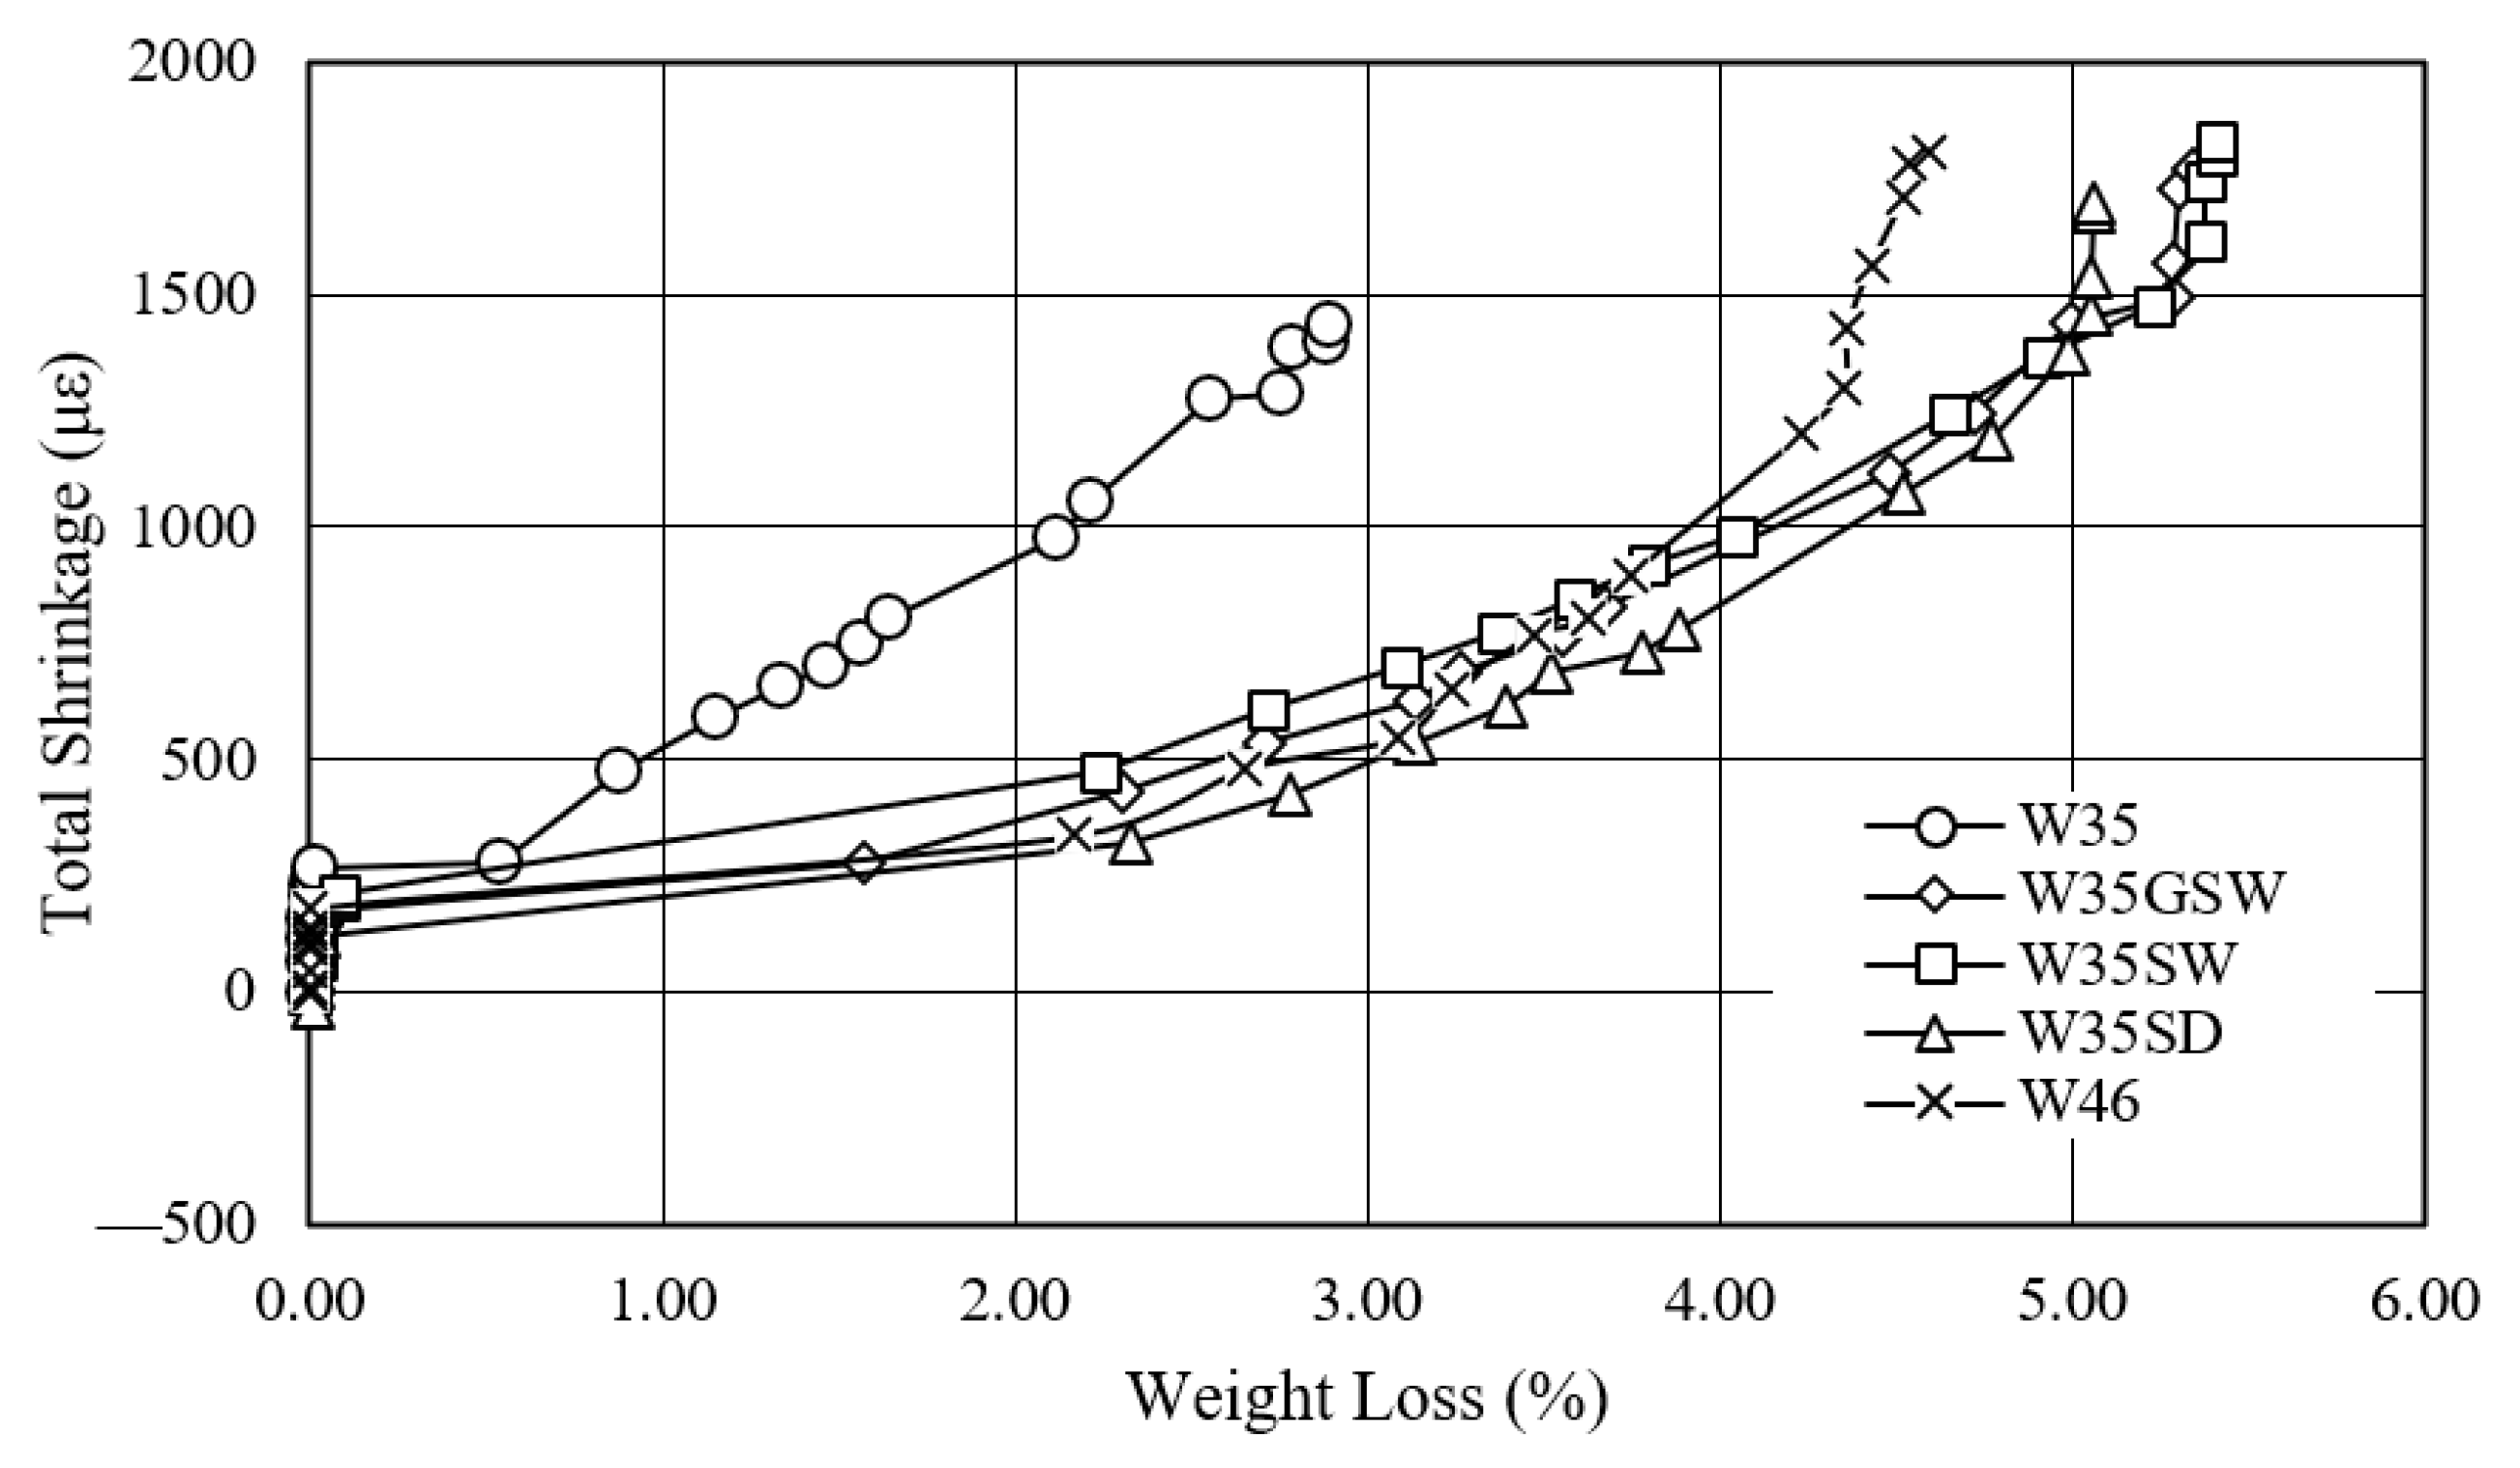
The mixtures with SAP had consistently lower drying shrinkages compared to W35 and W46 at all weight losses.
(5)
The compressive strength achieved through the dry SAP mixing method surpassed that of the wet SAP mixing method. Moreover, when subjected to water submersion, the mixtures containing SAP exhibited a decrease in compressive strength ranging from 20.01% to 35.83% compared to W35. Notably, fine SAP exhibited greater potential for enhancing compressive strength than coarse SAP.

Author Contributions

Conceptualization, W.A.; methodology, W.A.; formal analysis, W.A.; investigation, W.A.; data curation, W.A. and P.M.; writing—original draft preparation, W.A.; writing—review and editing, W.A., P.M. and R.S.; visualization, P.M.; supervision, R.S.; project administration, P.M. All authors have read and agreed to the published version of the manuscript.

Funding

This research received no external funding.

Institutional Review Board Statement

Not applicable.

Informed Consent Statement

Not applicable.

Data Availability Statement

Data are contained within the article.

Conflicts of Interest

The authors declare no conflicts of interest.

References

  1. Zhutovsky, S.; Kovler, K.; Bentur, A. Effect of hybrid curing on cracking potential of high-performance concrete. Cem. Concr. Res. 2013, 54, 36–42. [Google Scholar] [CrossRef]
  2. Shen, D.J.; Wang, T.; Chen, Y.; Wang, M.L.; Jiang, G.Q. Effect of internal curing with super absorbent polymers on the relative humidity of early-age concrete. Constr. Build. Mater. 2015, 99, 246–253. [Google Scholar] [CrossRef]
  3. Craeye, B.; Geirnaert, M.; Schutter, G.D. Super absorbing polymers as an internal curing agent for mitigation of early-age cracking of high-performance concrete bridge decks. Constr. Build. Mater. 2011, 25, 1–13. [Google Scholar] [CrossRef]
  4. Jensen, O.M.; Hansen, P.F. Water-entrained cement-based materials: I. Principles and theoretical background. Cem. Concr. Res. 2001, 31, 647–654. [Google Scholar] [CrossRef]
  5. Jensen, O.M.; Hansen, P.F. Water-entrained cement-based materials: II. Experimental observations. Cem. Concr. Res. 2002, 32, 973–978. [Google Scholar] [CrossRef]
  6. Shen, D.; Shi, H.; Tang, X.; Ji, Y.; Jiang, G. Effect of internal curing with super absorbent polymers on residual stress development and stress relaxation in restrained concrete ring specimens. Constr. Build. Mater. 2016, 120, 309–320. [Google Scholar] [CrossRef]
  7. Shen, D.J.; Wang, X.U.; Cheng, D.B.; Zhang, J.Y.; Jiang, G.Q. Effect of internal curing with super absorbent polymers on autogenous shrinkage of concrete at early age. Constr. Build. Mater. 2016, 106, 512–522. [Google Scholar] [CrossRef]
  8. Lee, H.X.D.; Wong, H.S.; Buenfeld, N.R. Self-sealing of cracks in concrete using superabsorbent polymers. Cem. Concr. Res. 2016, 79, 194–208. [Google Scholar] [CrossRef]
  9. Liu, J.M.; Ou, Z.W.; Mo, J.C.; Wang, Y.H.; Wu, H. The effect of SCMs and SAP on the autogenous shrinkage and hydration process of RPC. Constr. Build. Mater. 2017, 155, 239–249. [Google Scholar] [CrossRef]
  10. Shen, D.J.; Wang, M.L.; Chen, Y.; Wang, W.T.; Zhang, J.Y. Prediction of internal relative humidity in concrete modified with super absorbent polymers at early age. Constr. Build. Mater. 2017, 149, 543–552. [Google Scholar] [CrossRef]
  11. Shen, D.J.; Jiang, J.L.; Zhang, M.G.; Yao, P.P.; Jiang, G.Q. Tensile creep and cracking potential of high performance concrete internally cured with super absorbent polymers at early age. Constr. Build. Mater. 2018, 165, 451–461. [Google Scholar] [CrossRef]
  12. Riyazi, S.; Kevern, J.T.; Mulheron, M. Super absorbent polymers (SAPs) as physical air entrainment in cement mortars. Constr. Build. Mater. 2017, 147, 669–676. [Google Scholar] [CrossRef]
  13. Azarijafari, H.; Kazemian, A.; Rahimi, M.; Yahia, A. Effects of pre-soaked super absorbent polymers on fresh and hardened properties of self-consolidating lightweight concrete. Constr. Build. Mater. 2016, 113, 215–220. [Google Scholar] [CrossRef]
  14. ASTM C128-15; Standard Test Method for Relative Density (Specific Gravity) and Absorption of Fine Aggregate. ASTM International: West Conshohocken, PA, USA, 2015.
  15. Schröfl, C.; Mechtcherine, V.; Gorges, M. Relation between the molecular structure and the efficiency of superabsorbent polymer (SAP) as concrete admixture to mitigate autogenous shrinkage. Cem. Concr. Res. 2012, 42, 865–873. [Google Scholar] [CrossRef]
  16. Schroefl, C.; Mechtcherine, V.; Vontobel, P.; Hovind, J.; Lehmann, E. Sorption kinetics of superabsorbent polymers (SAPs) in fresh Portland cement-based pastes visualized and quantified by neutron radiography and correlated to the progress of cement hydration. Cem. Concr. Res. 2015, 75, 1–13. [Google Scholar] [CrossRef]
  17. Mechtcherine, V.; Secrieru, E.; Schröfl, C. Effect of superabsorbent polymers (SAPs) on rheological properties of fresh cement-based mortars—Development of yield stress and plastic viscosity over time. Cem. Concr. Res. 2015, 67, 52–65. [Google Scholar] [CrossRef]
  18. ASTM C1761/C1761M-15; Standard Specification for Lightweight Aggregate for Internal Curing of Concrete. ASTM International: West Conshohocken, PA, USA, 2015.
  19. ASTM C230/C230M-14; Standard Specification for Flow Table for Use in Test of Hydraulic Cement. ASTM International: West Conshohocken, PA, USA, 2014.
  20. ASTM C807-13; Standard Test Method for Time of Setting of Hydraulic Cement Mortar by Modified Vicat Needle. ASTM International: West Conshohocken, PA, USA, 2013.
  21. ASTM C109/C109M-13; Standard Test Method for Compressive Strength of Hydraulic Cement Mortar (Using 2-in. or [50-mm] Cube Specimens). ASTM International: West Conshohocken, PA, USA, 2013.
  22. Liu, J.; Shi, C.; Ma, X.; Khayat, K.H.; Zhang, J.; Wang, D. An overview on the effect of internal curing on shrinkage of high performance cement-based materials. Constr. Build. Mater. 2017, 146, 702–712. [Google Scholar] [CrossRef]
  23. Aghaee, K.; Sposito, R.; Thienel, K.C.; Khayat, K.H. Effect of additional water or superplasticizer on key characteristics of cement paste made with superabsorbent polymer and other shrinkage mitigating materials. Cem. Concr. Compos. 2023, 136, 104893. [Google Scholar] [CrossRef]
  24. Hasholt, M.T.; Jensen, O.M.; Kovler, K.; Zhutovsky, S. Can superabsorent polymers mitigate autogenous shrinkage of internally cured concrete without compromising the strength? Constr. Build. Mater. 2012, 31, 226–230. [Google Scholar] [CrossRef]
Figure 1. Particle size of SAP used in this study: (a) dry SAP; (b) wet SAP.
Sustainability 16 02158 g001
Figure 2. Gradation of dry SAP.
Sustainability 16 02158 g002
Figure 3. Particle size of SAP used in this study: (a) original dry SAP; (b) ground wet SAP.
Sustainability 16 02158 g003
Figure 4. Absorption capacity of original dry SAP.
Sustainability 16 02158 g004
Figure 5. Desorption capacity of SAP.
Sustainability 16 02158 g005
Figure 6. Mixing steps for mortar with SAP.
Sustainability 16 02158 g006
Figure 7. Mixing steps for concrete with SAP.
Sustainability 16 02158 g007
Figure 8. Specimens for autogenous shrinkage and total shrinkage testing.
Sustainability 16 02158 g008
Figure 9. Setting time for mortar.
Sustainability 16 02158 g009
Figure 10. Flow rate of mortar.
Sustainability 16 02158 g010
Figure 11. Autogenous shrinkage of mortar.
Sustainability 16 02158 g011
Figure 12. Total shrinkage of mortar.
Sustainability 16 02158 g012
Figure 13. Drying shrinkage of mortar.
Sustainability 16 02158 g013
Figure 14. Relationship between the drying shrinkage and weight loss of mortar.
Sustainability 16 02158 g014
Figure 15. Relationship between the total shrinkage and weight loss of mortar.
Sustainability 16 02158 g015
Figure 16. Autogenous shrinkage of concrete.
Sustainability 16 02158 g016
Figure 17. Total shrinkage of concrete.
Sustainability 16 02158 g017
Figure 18. Drying shrinkage of concrete.
Sustainability 16 02158 g018
Figure 19. Relationship between the drying shrinkage and weight loss of concrete.
Sustainability 16 02158 g019
Figure 20. Relationship between the total shrinkage and weight loss of concrete.
Sustainability 16 02158 g020
Figure 21. (A) Compressive strength of mortar at 7 days. (B) Compressive strength of mortar at 28 days.
Sustainability 16 02158 g021
Figure 22. (A) CSI of air-cured mortar. (B) CSI of plastic-cured mortar.
Sustainability 16 02158 g022
Table 1. Chemical properties of cement.
Chemical Composition (%)Portland Cement Type I
SiO220.90
Al2O34.80
Fe2O33.40
CaO65.40
K2O0.45
TiO20.26
Others4.79
Table 2. Mix proportions of mortar.
SampleMix Proportion (kg/m3)Type of SAPMixing Method
CementSandWaterSAPInternal Curing Water
W358991052315----
W35SD89910523150.996DDry
W35SW89910523150.996WWet
W35GSW89910523150.996GWWet
W468991052411----
Remake: D is original dry SAP. W is original wet SAP. GW is ground wet SAP.
Table 3. Mix proportions of concrete.
SampleMix Proportion (kg/m3)Type of SAPMixing Method
CementSandCrushed LimestoneWaterSAPInternal Curing Water
C35899473574315----
C35SD8994735743150.557DDry
C35SW8994735743150.557WWet
Remake: D is dry SAP. W is wet SAP.
Disclaimer/Publisher’s Note: The statements, opinions and data contained in all publications are solely those of the individual author(s) and contributor(s) and not of MDPI and/or the editor(s). MDPI and/or the editor(s) disclaim responsibility for any injury to people or property resulting from any ideas, methods, instructions or products referred to in the content.

