Article

Correlations of Spatial Form Characteristics on Wind–Thermal Environment in Hill-Neighboring Blocks

School of Architecture and Urban Planning, Shandong Jianzhu University, Jinan 250100, China
*
Author to whom correspondence should be addressed.
These authors contributed equally to this work.
Sustainability 2024, 16(5), 2203; https://doi.org/10.3390/su16052203
Submission received: 7 January 2024 / Revised: 29 February 2024 / Accepted: 4 March 2024 / Published: 6 March 2024

Abstract

:
The spatial forms of hill-neighboring blocks and the wind–thermal environment are crucial components of urban planning and urban ecology. Understanding their correlation is significant for creating a healthy community and enhancing the sustainable level of buildings and their systems. Therefore, Jinan, a multi-mountainous city in China, is taken as the research area, and the ideal model of hill-neighboring blocks is built based on categories of all these block types by aerial imagery and a semantic segmentation algorithm. Then, we use the CFD simulation software PHOENICS and the evaluation system weighted by random forest to simulate and assess the wind–thermal environment. Ultimately, the correlations and specific mathematical equations between the spatial form indicators and wind–thermal environment are obtained by a parametric method. The results demonstrate that the interface density on the near-hill side and hill surface roughness are the most related indicators to the overall wind–thermal environment. The variation in block spatial form has the most distinct influence on the proportion of breeze area and PMV. The relationship determined herein can provide strategic recommendations for decision makers for optimizing the outdoor air flow of blocks and enhancing the thermal comfort of pedestrians, which helps to create a healthy and comfortable outdoor environment in multi-mountainous cities.

1. Introduction

The world is becoming more and more urbanized, and this trend will continue for the foreseeable future; with only 2% of the world’s population living in urban areas in 1800 [1], it is expected that by 2050, the world’s population will reach 70% urbanization and 100% by 2092 [2]. As the country with the fastest urbanization rate in the past 30 years, China’s urban areas have grown at an average annual rate of 7.9%, which is 2.14% higher than the world average. It is still likely to be the world’s fastest-growing country in the future. Rapid urbanization will severely change the earth’s surface. And artificial surfaces will release and absorb more heat energy than natural surfaces, significantly changing the thermal environment at the surface [3]. As essential components of the urban environment, the urban thermal environment and wind environment are closely related and are often considered simultaneously in urban design and other fields. The deterioration of the wind–thermal environment will exacerbate the urban heat island effect and air pollution and increase the energy consumption of indoor cooling and mechanical ventilation. This will lead to heat-related diseases and even death, seriously affecting human health [4].
Urban form may affect the wind–thermal environment in a variety of ways, and many scholars have concentrated on urban design and related guidance under the influence of the wind–thermal factor. The relevant research can be roughly divided into five categories: The first is the management and control method [5,6]. Relevant policies, planning management [7,8], control modes, control indicators, and the framework of urban design [9,10] that are conducive to improving the urban wind–thermal environment are explored through the perspective of urban planning and urban design. This kind of research mainly solves macroscopic problems, and its practicability and actual improvement of the wind–thermal environment are slight now. The second is the optimization strategy, which relies on relevant numerical simulation [11], spatial analysis [12] and other methods to propose spatial optimization and update strategies for specific areas under different proposals. The matters solved by this kind of research are not highly reproducible and are limited to specific districts. The third is scheme selection, which chooses the optimal solution such as site selection and layout and urban design from the perspective of wind and thermal environments [13,14,15,16], limited to settle problems under specific districts and proposals, too. The fourth is the evaluation system, which establishes appropriate measurements for specific research objects [17,18], mostly involving the climate comfort degree [19]. And there is a low reference value for other aspects. The fifth is correlation exploration, which explores the relevance between typical urban spatial elements. Some scholars take streets as research objects to explore the impact of street spatial form on the wind environment and air quality [20,21,22]. Some other scholars also focus on the shape of a newly built area or the whole city, and explore the relationship between it and the wind environment from a more macro perspective [23,24]. In addition, some scholars explore the relationship between the urban thermal environment, landscape, architecture, street and other comprehensive perspectives [25,26,27]. This kind of research has a comparative reference value, but the indicators selected by the existing research are on an urban and architectural scale [28,29,30], and the factors selected on a block scale are not comprehensive and systematic enough [31,32]. The research is not deep enough, either. In addition, there is a great lack of relevant research on special landforms, such as mountain cities, basin cities, coastal cities, and so on. As a country rich in natural landform characteristics, there are a wide variety of block types, especially mountainous cities. Hills have been integrated into urban construction, and the existence of hills not only affects the texture of the city, but changes the type of surrounding microclimate, affecting the urban wind–thermal environment. In addition, the determinants of the wind–thermal environment vary at different scales, and the cost of calculation and design in actual studies is also diverse. As the basic unit of urban structure, the correlation between blocks’ spatial form and the wind–thermal environment provides a reference value for enhancing the city health index. So, the specific correlation between the spatial forms and the wind–thermal environments of the urban block adjacent to the natural hill (hill-neighboring block) is worthy of further research.
As one of the typical representatives of hill-neighboring cities in northern China, Jinan has a large-scale hill in the south, which is a natural ecological barrier of the city, and a small hill scale in the downtown area, which is integrated into the city block to form a rich form of hill-neighboring block. There are 72 hills closely adjacent to urban blocks within the Jinan Ring Expressway encircled area, including Qianfo Mountain, Fohui Mountain, Jinji Mountain, Xiaogui Mountain, etc., with adequate samples. We used DJI Mavic 3 Classic UAV (unmanned aerial vehicle, DJI Innovation, Shenzhen, China) to obtain aerial images of these hill-neighboring blocks, and carried out feature extraction and identification with the help of computer vision algorithms (Figure 1). Semantic segmentation technology combined with deep learning has been applied to many aspects in the field of computer vision now, which has a good effect on image semantic segmentation [33,34]. In this research, we used the Deeplav3+ model to train the model based on a set of 1000 relevant aerial urban images, including mountains, buildings and benchmark urban scenes. Using this model, we extracted the spatial form features related to the hill-neighboring blocks. On the basis of the semantic segmentation results, this study divides these hills into three categories and seven sub-categories of prototypes (Appendix A), which are the encirclement of the hill around the block, the tangent of the hill on the block, and the embedding of the hill into the block. The enclosure of the hill around the block refers to the enclosed relationship between the hill and the block, which can be subdivided into four types: round-shaped, L-shaped, U-shaped, and point-group shaped according to the different degree and direction of enclosure. The tangent of the hill on the block refers to the tangent relationship between the hill and the block, which can be subdivided into corner and linear on the basis of the different scale and the various tangency modes of the hill. The embedding of the hill into the block refers to the occlusal relationship between the hill and the block, which can be subdivided into a semi-embedded hill and block and a block along the hill according to the different orientation and occlusion degree of the hill. Most of the hills in the built-up area of Jinan are point-shaped hills, and the L-shaped enclosure in the hill and block enclosure is the main form of existence. This research takes this model as an example for variations in spatial form indicators and the latter wind–thermal environment numerical simulations. And it explores the correlation between the spatial form indicator and the wind–thermal environment of Jinan’s hill-neighboring blocks, so as to provide a reference for the optimization of the wind–thermal environment of similar types of blocks in Jinan and other similar northern cities in China.

2. Materials and Methods

2.1. Spatial Form of Hill-Neighboring Block

2.1.1. Selection of Spatial Form Indicators

In this research, the spatial form indicators of the hill-neighboring block are selected based on three criteria: “relating to the wind-thermal environment, characteristics of the hill-neighboring area highlighting, and CFD (Computational Fluid Dynamics) simulations valuing”. The indicators can be categorized into five categories (Table 1), namely hill-block relationship, hill scale, terrain undulation degree, interface density and block structure. Among them, the hill–block relationship parameter mainly refers to the hill–block distance (d). The distance between the hill and block has an impact on the “narrow pipe effect” (it refers to the effect of narrow terrain on air flow. When the air flows from the open area into the canyon formed by the terrain, because the air mass cannot accumulate in large quantities, it accelerates through the canyon, and the wind speed increases. As it flows out of the canyon, the air slows down again) that may occur between the hill and the block. The junction mode of the hill–block has different effects on the wind speed, temperature, and incoming flow angle due to the orientation of the hill, the degree of enclosure of the hill around the block, and the degree of the embedding. Hill scale parameters mainly include the height (h), slope (i), and surface roughness (Ra). The height of the hill may affect the temperature and pressure of the valley wind. The slope may affect its wind pressure, wind speed, and incoming flow angle. The surface roughness may also affect the wind speed and pressure. For the remaining three categories, this research selects the degree of terrain undulation (R), the interface density on the side of the hill (De) [35], and the angle between the direction of important streets and prevailing winds (θ) for in-depth investigation. Among these indicators, the changing degree of terrain undulation may affect the flow of vertical winds within the block. The interface density on the hill side may affect the wind force when valley wind enters the block, which is related to the “narrow tube effect” between the hill and block. The alignment of the main streets to prevailing winds has a strong relationship with the emergence of undesirable wind fields in the block and the improvement of the wind environment.

2.1.2. Setting of Spatial Form Indicator Variations

The simulation of the outdoor wind–thermal environment generally includes two types: the real block model and the ideal block model. The real block model is suitable for discussing the merits and demerits of wind–thermal environment under different design schemes, or assessing the wind–thermal environment of specific blocks. The ideal block model is more appropriate for investigating the impact of the change in a single spatial form indicator on the wind–thermal environment around the building group. Based on this, this study chooses to establish an ideal model to explore the correlation between the spatial form indicators of the hill-neighboring block and the wind–thermal environment. The ideal model is extracted from the results of semantic segmentation, which has investigated the shapes and junction patterns of these blocks. Firstly, a benchmark model is established. Through the field investigation of the wind–thermal environment in the earlier stage, it is known that the wind–thermal environment of the block where the height of the hill is in the range of 70–180 m is positively different from that of another block of the same type. And at this time, the association between the height of the hill and the wind–thermal environment has a certain value for research. In order to facilitate the later discussion of indicator variations, the height of the benchmark model is set at 120 m. And in this research, only the hill closest to the block is considered, other surrounding hills’ effect on the block is under no consideration. Referring to the formula associated with the hill terrain, the height-to-width ratio H/L1 (note: H is the height from the top of the slope to the ground, that is, the height of the hillside. L1 is the horizontal distance from a point on a hillside that is half the height of the top of the slope to the top of the slope, called the length of the half slope, and H/L1 is the aspect ratio) is used to describe the shape and size of the hill. And it takes the height and width ratio H/2L1 as the average slope [36]. In addition, for the built part of the block, given that most of the block adjacent to the hill in the built-up area is a medium-height to high-height residential district, the research follows the specific requirements of the standard for urban residential area planning and design for building height, building density, plot ratio, and minimum distance for sunlight of residential district, etc. [37]. The ideal model of the hill-neighboring block as the basic condition is set as shown in Figure 2. The block size is 300 × 300 m. The building unit size is 40 × 18 m, the building height is 27 m, the building north–south spacing is 36 m, the east–west spacing is 14 m, the building density is 0.2, the layout of building is the basic row–row type, and the building boundary is 30 m away from the plot boundary. The ideal model is used as a benchmark model for the analysis of the variables in the later stage, and in order to make the results of the study more focused, only Figure 2a has been chosen to be discussed here, and the other two types will be explored at a later stage (Figure 2).
The control variates method is adopted to set the variation of each indicator to investigate the influence of spatial form changes on the wind–thermal environment of the hill-neighboring block (Table 2); a corresponding physical model is established to reflect the variation. Indicator A series changes the spatial form of the hill-neighboring block by setting the distance between the hill and the block. Based on the benchmark model, the distance (d) between the hill and the block is changed, and the distance between the block and the green line of the hill is decreased and increased by 3 m, 6 m, and 9 m, respectively. Indicator B1 series sets the height of the hill (h) on the basis of its benchmark model by decreasing and increasing the height of the hill by 15 m, 30 m, and 45 m, separately. Indicator B2 series changes the average slope of the hill (i) by changing the height-to-width ratio of the hill on the basis of the benchmark model by setting the average slope to 0.3, 0.45, 0.6, 0.75, 0.9, and 1.05. Indicator B3 series changes the surface roughness (Ra) of the hill based on the benchmark model. They are set to 0.1, 0.15, 0.20, 0.25, 0.30, 0.35. Indicator C series sets the change in indicators by referring to the grading of the relevant slopes, limiting the slopes to those between slopes and steep slopes, i.e., 5–35°, which translates to a degree of undulation of about 8–55 m. Indicator C1 series sets the elevation of the hill side lower than that of the far hill side, and the difference in elevation is 9 m, 18 m, 27 m, 36 m, 45 m, and 54 m. Indicator C2 series sets the elevation of the hill side higher than that of the far hill side, and the difference in elevation is the same as that of C1. Indicator D series, under the premise of guaranteeing minimum distance for sunlight of buildings in block, changes the width of the projected surface of the hill side street by changing the depth of the building on the hill side, so as to change the interface density on the hill side (De). The depth of the buildings on the hill side is decreased and increased by 1 m, 2 m, and 3 m. Indicator E is based on the benchmark model, and the angle between the main street direction (east–west arrangement) and the prevailing wind direction is changed to 0°, 15°, 30°, 90°, 105°, and 120°, respectively. The settings for each working condition are shown in Table 2. The modeling software Sketchup (v2023) is suitable for multi-scale urban modeling, and can be exported or converted to a variety of formats at a later stage to be compatible with CAD (v2022), PHOENICS (v2022), and other software.

2.2. Wind–Thermal Environment of Hill-Neighboring Block

2.2.1. Wind–Thermal Environment Simulation

In this research, PHOENICS (v2022) is used to simulate the wind–thermal environment in the hill-neighboring blocks. It is an early commercial numerical simulation software, which has been widely used in the field of architecture design, and to simulate the wind–thermal environment at small and medium scales. It is fast and open, and the number of iterations and the simulation accuracy can be adjusted manually [38]. The simulation process is divided into three modules: pre-processing, calculation, and post-processing. The pre-processing module mainly includes the establishment of the model, the import, and the setting of boundary conditions. The calculation module is responsible for calculating the wind–thermal base value, and the process can detect the fluctuation in the residual value. When the obtained convergence is within the error tolerance, it can be confirmed that the experiment has a reference value, and otherwise, it will return to the pre-processing module for correction. The post-processing module is for the acquisition and visualization of data, which can obtain the specific wind–thermal data of each point, and export the wind speed, wind pressure, thermal environment, and other related diagrams.
When proceeding with the wind–thermal simulation, this research sets the meteorological parameters by referencing the annual standard meteorological data of Jinan in the China Meteorological Network (The related weather dataset can be adopted at https://data.cma.cn, accessed on 10 July 2023). It includes the dominant wind direction, wind speed, wind pressure, temperature, and solar radiation in summer. And model indicators such as the roughness of the subsurface, the material of the building surface, the corresponding radiance, and the thermal conductivity of the relevant materials are set with reference to the hill-neighboring block of Jinan. The computational domain is set according to the size of the model. The appropriate turbulence model, energy model, and number of iterations are selected according to the scale of the simulated block and the required accuracy of the results. The season is set to be summer, the simulated wind speed is set to be 2.8 m/s, prevailing winds direction is east–southeast, and the solar radiation at noon is taken to be 800 W/m2. The influence of the range of the wind field is limited, and it requires sufficient space to simulate the wind flow. So the computational domain is reserved to 5 times the length of the modeling area in the X-axis and Y-axis directions, and 3 times the maximum height of the model in the Z-direction. We choose the standard k-ε equation for the turbulence model to better simulate the wind flow at the block scale. It is a two-equation turbulence model proposed by Jones et al. in 1972, which can satisfy most engineering problems and has good numerical simulation results under most wind angles [39]. And the IMMERSOL model (Formula (3)) based on the basic formula of radiation heat transfer, namely Stephan-Polz law, is used as the radiation model [40,41]. Their formulas are as follows:
K equation:
( ρ k ) t + ρ U k = [ μ + k + P G ρ ε
ε equation:
( ρ ε ) t + ρ U ε = [ μ + μ t σ ε ε + C 1 ε k P G C 2 ρ ε 2 k
1 0.75 ( a + s + 1 L ) E 3 = a + s E 12 E 3
In the formula, u t is the viscosity coefficient of turbulence, μ t = C μ ρ K 2 ε . U represents the velocity vector of the fluid. E 3 is the comprehensive emissivity, representing the net amount of radiation energy gained or lost per unit volume; E 12 is the average radiant force on the surface of the first and binomial fluid; a is the absorption rate of the medium; s is the scattering coefficient of the medium; L is the distance between two solid radiating surfaces for calculation. The values of the empirical constants included in the governing equation are shown in the Table 3 below, where the first term on the left side of the equation is zero.
And by the numerical experiments and comparisons, it can be found that when the number of iterations is 2000, the residual value of the model will fall within the range of 1 × 10⁻⁴~1 × 10⁻⁵, which can be judged to be convergent. Therefore, 2000 times are selected as the reference iterations for the simulation. At the same time, the convergence result, the propriate boundary condition settings, and the real measured results are used to verify that the CFD simulation is reliable.

2.2.2. Selection and Assessment of Wind–Thermal Environment Indicator

The evaluation factors’ selection process of the wind–thermal environment is based on the consideration of three criteria: the ease of measurement, the convenience of comparing the changes they produce, and their appropriateness to the scale of the block. Most of the evaluations related to the wind environment are focus on the mechanical effects of wind on people. The relevant indicators are instantaneous value, average value, ratio, probability, inhomogeneity factor, ventilation potential coefficient of wind speed, and proportion of breeze area, etc. These indicators focus on wind comfort and wind safety at the height of pedestrians [42]. This research selects the average wind speed, average wind speed ratio, inhomogeneity factor of wind speed, and proportion of breeze area (Table 4). Among them, the average wind speed is the mean value of the instantaneous wind speed in a given time, which is certainly representative of the wind strength. The average wind speed ratio can be used to assess the comfort of the wind environment when meteorological statistics are absent. The inhomogeneity factor of wind speed can characterize the degree of wind speed distribution in a certain region; the higher the score, the lower the inhomogeneity. The proportion of breeze area refers to the ratio of the sum of the area in the breeze zone in the study to the total area of the study area, which has a large negative impact on the suitability of walking on the street. It can be used to characterize the safety and comfort of the regional wind environment.
The evaluation related to thermal environment is a multidimensional perception process, involving the combination of physiological, physical, psychological, and behavioral factors. These include skin temperature, perspiration rate, temperature, humidity, wind speed, solar radiation, specific thermal expectations of different populations, thermal acclimatization, and thermal sensing ability, etc. [43]. There are a number of indicators that combine these factors [44,45]. The most widely used ones are predicted mean vote (PMV), physiologically equivalent temperature (PET), thermal comfort vote (TCV), thermal sensation vote (TSV), and mean radiant temperature, etc. Among them, the predicted mean vote (PMV) refers to the average value of the hot and cold sensations of most people in the same environment, which integrates the physiological and physical factors of the human body and environmental variables, and is suitable for the evaluation of the comfort of the steady-state thermal environment. Additionally, the predicted mean vote (PMV) is an appropriate choice for block-scale thermal environment assessment.
In order to make an objective assessment of the changes in the wind–thermal environment under different circumstances, we adopt the random forest method to help build a wind–thermal evaluation system (Figure 3). The random forest is a machine learning method which includes multiple decision tree classifiers [46]. And the relative weight of each evaluation factor can be obtained when combined with the Gini index. In total, 70% of the data set is taken as training data and 30% as test data for random selection of samples. With the help of the machine learning analysis platform LIGHT Scholar (v2023), the value of mtry (max features) is adjusted according to the principle of minimum average error (Figure 4). And we use K-fold cross-validation with K = 10 to prevent overfitting. The accuracy, Kappa coefficient, and AUC values of the training set and test set are 0.760, 0.252, 0.9976, 0.753, 0.221, and 0.9875, respectively (Table 5). The results show that the model is reliable and can be used to calculate the weight of each evaluation factor (Figure 5).
In the specific scoring of the wind–thermal simulation results for each condition, the wind–thermal numerical score of the benchmark model is defined as 0, and the other simulated conditions are compared with it, with positive scores for better than the base condition and negative scores for worse than it. The optimization degrees of 0–10%, 10–20%, 20–30%, 30–40%… and 90–100% correspond to 1, 2, 3, 4…10 points, respectively. However, considering that some spatial form indicators have prominent impacts on the wind–thermal environment and the fluctuation range is more than 100%, they take a differential score on these metrics. For the inhomogeneity factor of wind speed (P3), when the variation is 100–150%, 150–200%, 200–250%, 250–300%…and 550–600%, it corresponds to 11, 12, 13, 14…20 points, respectively. For the proportion of breeze area (P4) indicator, 11, 12, 13, 14…20 points correspond to when the change is 100–120%, 120–140%, 140–160%, 160–180%, 180–200%… and 280–300%, respectively. For the PMV (P5), when the change is b 0–1%, 1–2%, 2–3%, 3–4%, 4–5%… and 9–10%, it corresponds to 1 point, 2 points, 3 points, 4 points…and 10 points. When the change is 10–20%, 20–30%, 30–40%…90–100%, and greater than 100%, it corresponds to 11 points, 12 points, 13 points, 14 points…and 20 points. Similarly, when the result is worse, all of the above receive negative scores (Table 6).

2.3. Correlation Analysis

In order to explore the correlation between the selected spatial form indicator and the wind–thermal environment and their specific laws, correlation analysis and regression analysis are chosen to analyze the relationships between the two variables. The correlation analysis adopts Pearson analysis and Spearman analysis. Pearson can determine the strength and direction of the linear relationship between the two variables, and Spearman can judge the nonlinear relationship. Employing these two methods can determine the linear and nonlinear correlation between the selected spatial form indicator and the wind–thermal environment. Regression analysis can derive mathematical formulas between two variables to help predict future trends. The coefficient of determination is used as the main index. The value of the coefficient of the determination ranges from [−1, +1]; the larger the absolute value of the coefficient, the stronger the correlation, and the higher the goodness of fit of the regression equation. If the two are linearly correlated, the coefficient is a positive number for positive correlation and a negative number for negative correlation, and if they are non-linearly correlated, they need to describe their changes with the help of specific regression equations.
This study visualizes and demonstrates the results obtained by means of correlation heatmaps and scatter plots. The correlation heat map can specifically show the linear correlation between two variables, which is the result of Pearson correlation analysis. A scatter plot can specifically show the linear correlation and nonlinear correlation of the variables and the regression curve, the higher the correlation, the closer the fitted curve is to the actual curve direction.

3. Results

3.1. Wind–Thermal Environment of Hill-Neighboring Block

3.1.1. Simulation of Wind–Thermal Environment

By importing the physical model corresponding to the change of each indicator into PHOENICS for simulation, the results of the wind–thermal environment under each working condition can be obtained, including wind speed cloud image, temperature cloud image, and PMV cloud image, etc., as shown in Figure 6. The color change in the figure corresponds to the change in the value. With the help of the legend on the left, the wind speed, temperature, and PMV values in the block can be more clearly and intuitively understood. In order to provide a more targeted assessment of the wind–thermal environment in the hill-neighboring block, this research does not consider the wind–thermal simulation results on the hill, and selects 12 typical testing sites in four categories inside the block, including the interface near the hill, the outermost side of the block, the typical public space surroundings, and the perimeter of the important ventilation corridors. The average value of the wind–thermal data of these 12 testing sites under each circumstance is used to represent the overall wind–thermal environment of the block (Appendix B). According to these basic wind–thermal data, the value of each indicator in the comprehensive evaluation system of the wind–thermal environment is calculated. It can be seen that the wind speed fluctuates between 1.5 m/s and 3.8 m/s, the average temperature between 33 °C and 42 °C, and the PMV value fluctuates between 2 and 2.9 under the variation of the setting of indicators A–E (Appendix B). The fluctuations of average wind speed under different indicators are different. And compared with the benchmark model, the enhancement of the average wind speed under the changes of each indicator is higher than the reduction, the average temperature shows a slight enhancement as a whole, and the PMV average value shows a reduction in general.

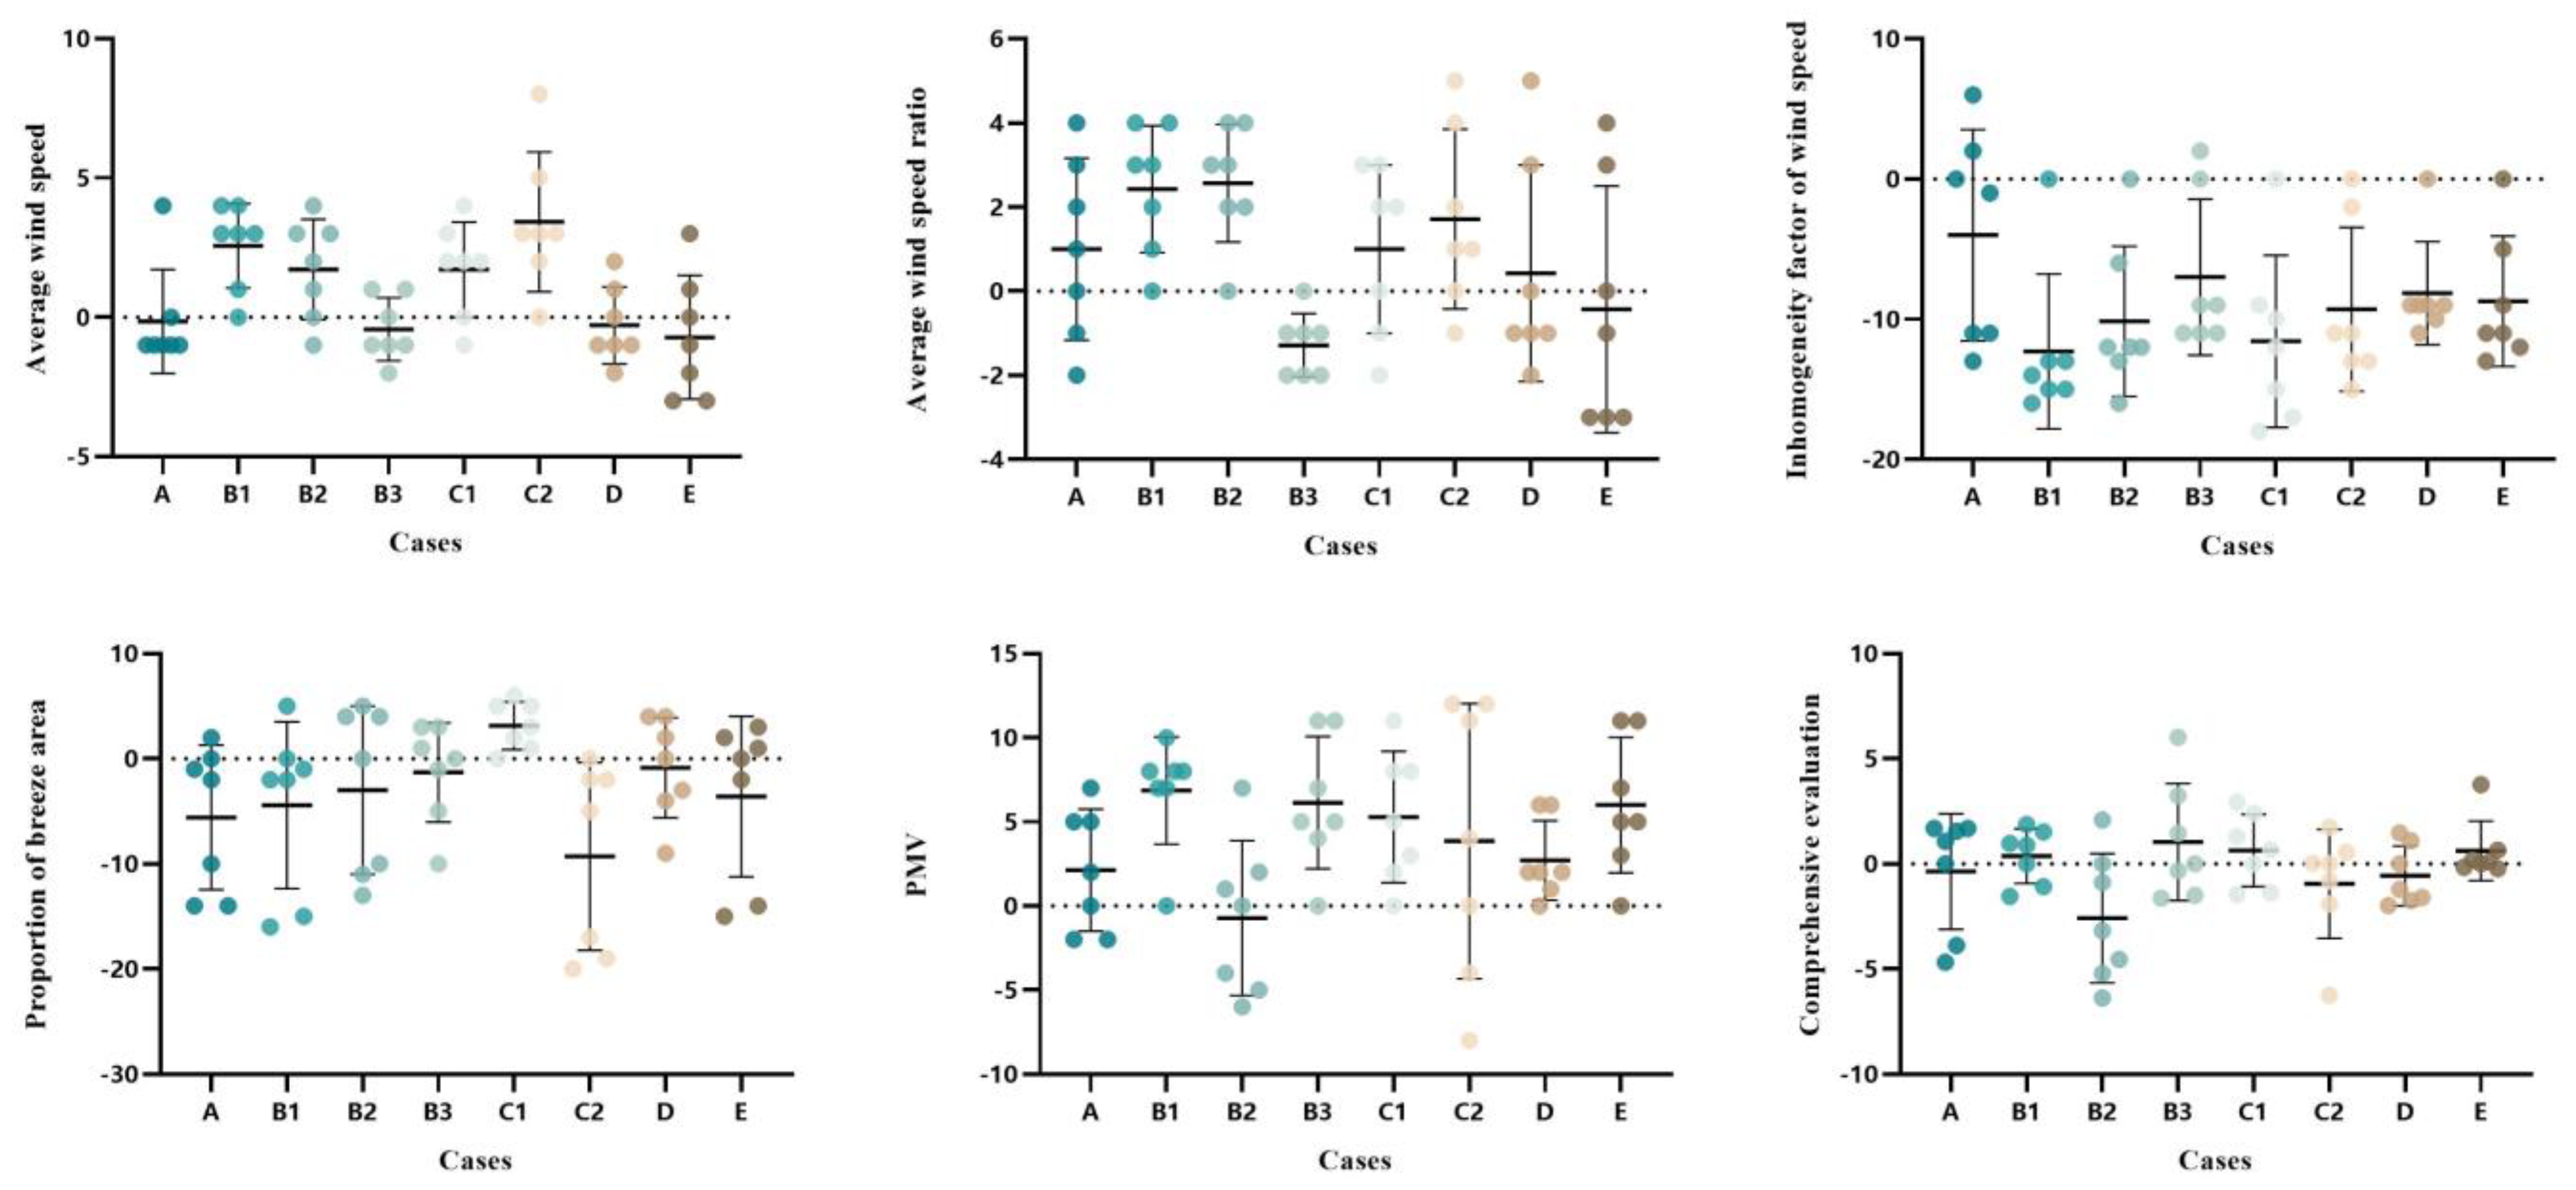
3.1.2. Assessment of the Wind–Thermal Environment

The wind–thermal environment simulation results under different circumstances are graded, and the overall scores under each circumstance are compared with the single-factor scores (Figure 7). It can be seen that there is little difference in the overall scores of the wind–thermal environment for the series of cases A–E. But there are obvious contrasts among the single-factor scores of the average wind speed, the inhomogeneity factor of wind speed, and PMV. It is presumed that the selected spatial form indicators have a comparative degree of influence on the overall wind–thermal environment of the block, but there is some variability in the influence on the single factors of the wind–thermal environment. In the comprehensive evaluation of the wind–thermal environment, the effect of hill surface roughness is more prominent, with a highest score of roughly six. The scores of average wind speed, average wind speed ratio, and PMV for each case are mostly positive numbers, and it is speculated that these spatial form indicators have a significant effect on the improvement of these wind–thermal factors. There are more negative scores of the inhomogeneity factor of wind speed and the proportion of breeze area, and it is possible that these spatial form indicators are prone to negatively affecting these two types of wind–thermal factors. The interface density on the side of the hill has the highest score under the average wind speed factor, with an average value of roughly three. The height of the hill and average slope of the hill have the highest scores under the average wind speed ratio factor, with an average value of about two. The distance between the hill and the block has the smallest negative effect on the inhomogeneity factor of wind speed, with an average value of about −1. The interface density on the side of the hill has the most positive effect on the proportion of breeze area, with an average value of about four. The hill height scores highest in the evaluation of the PMV factor, with an average value of about seven. The score can visualize and quantify the influence of spatial form indicators on the wind–thermal environment factor, but its specific correlation needs to be clarified by further correlation analysis.

3.2. Association between Spatial form and Wind–Thermal Environment

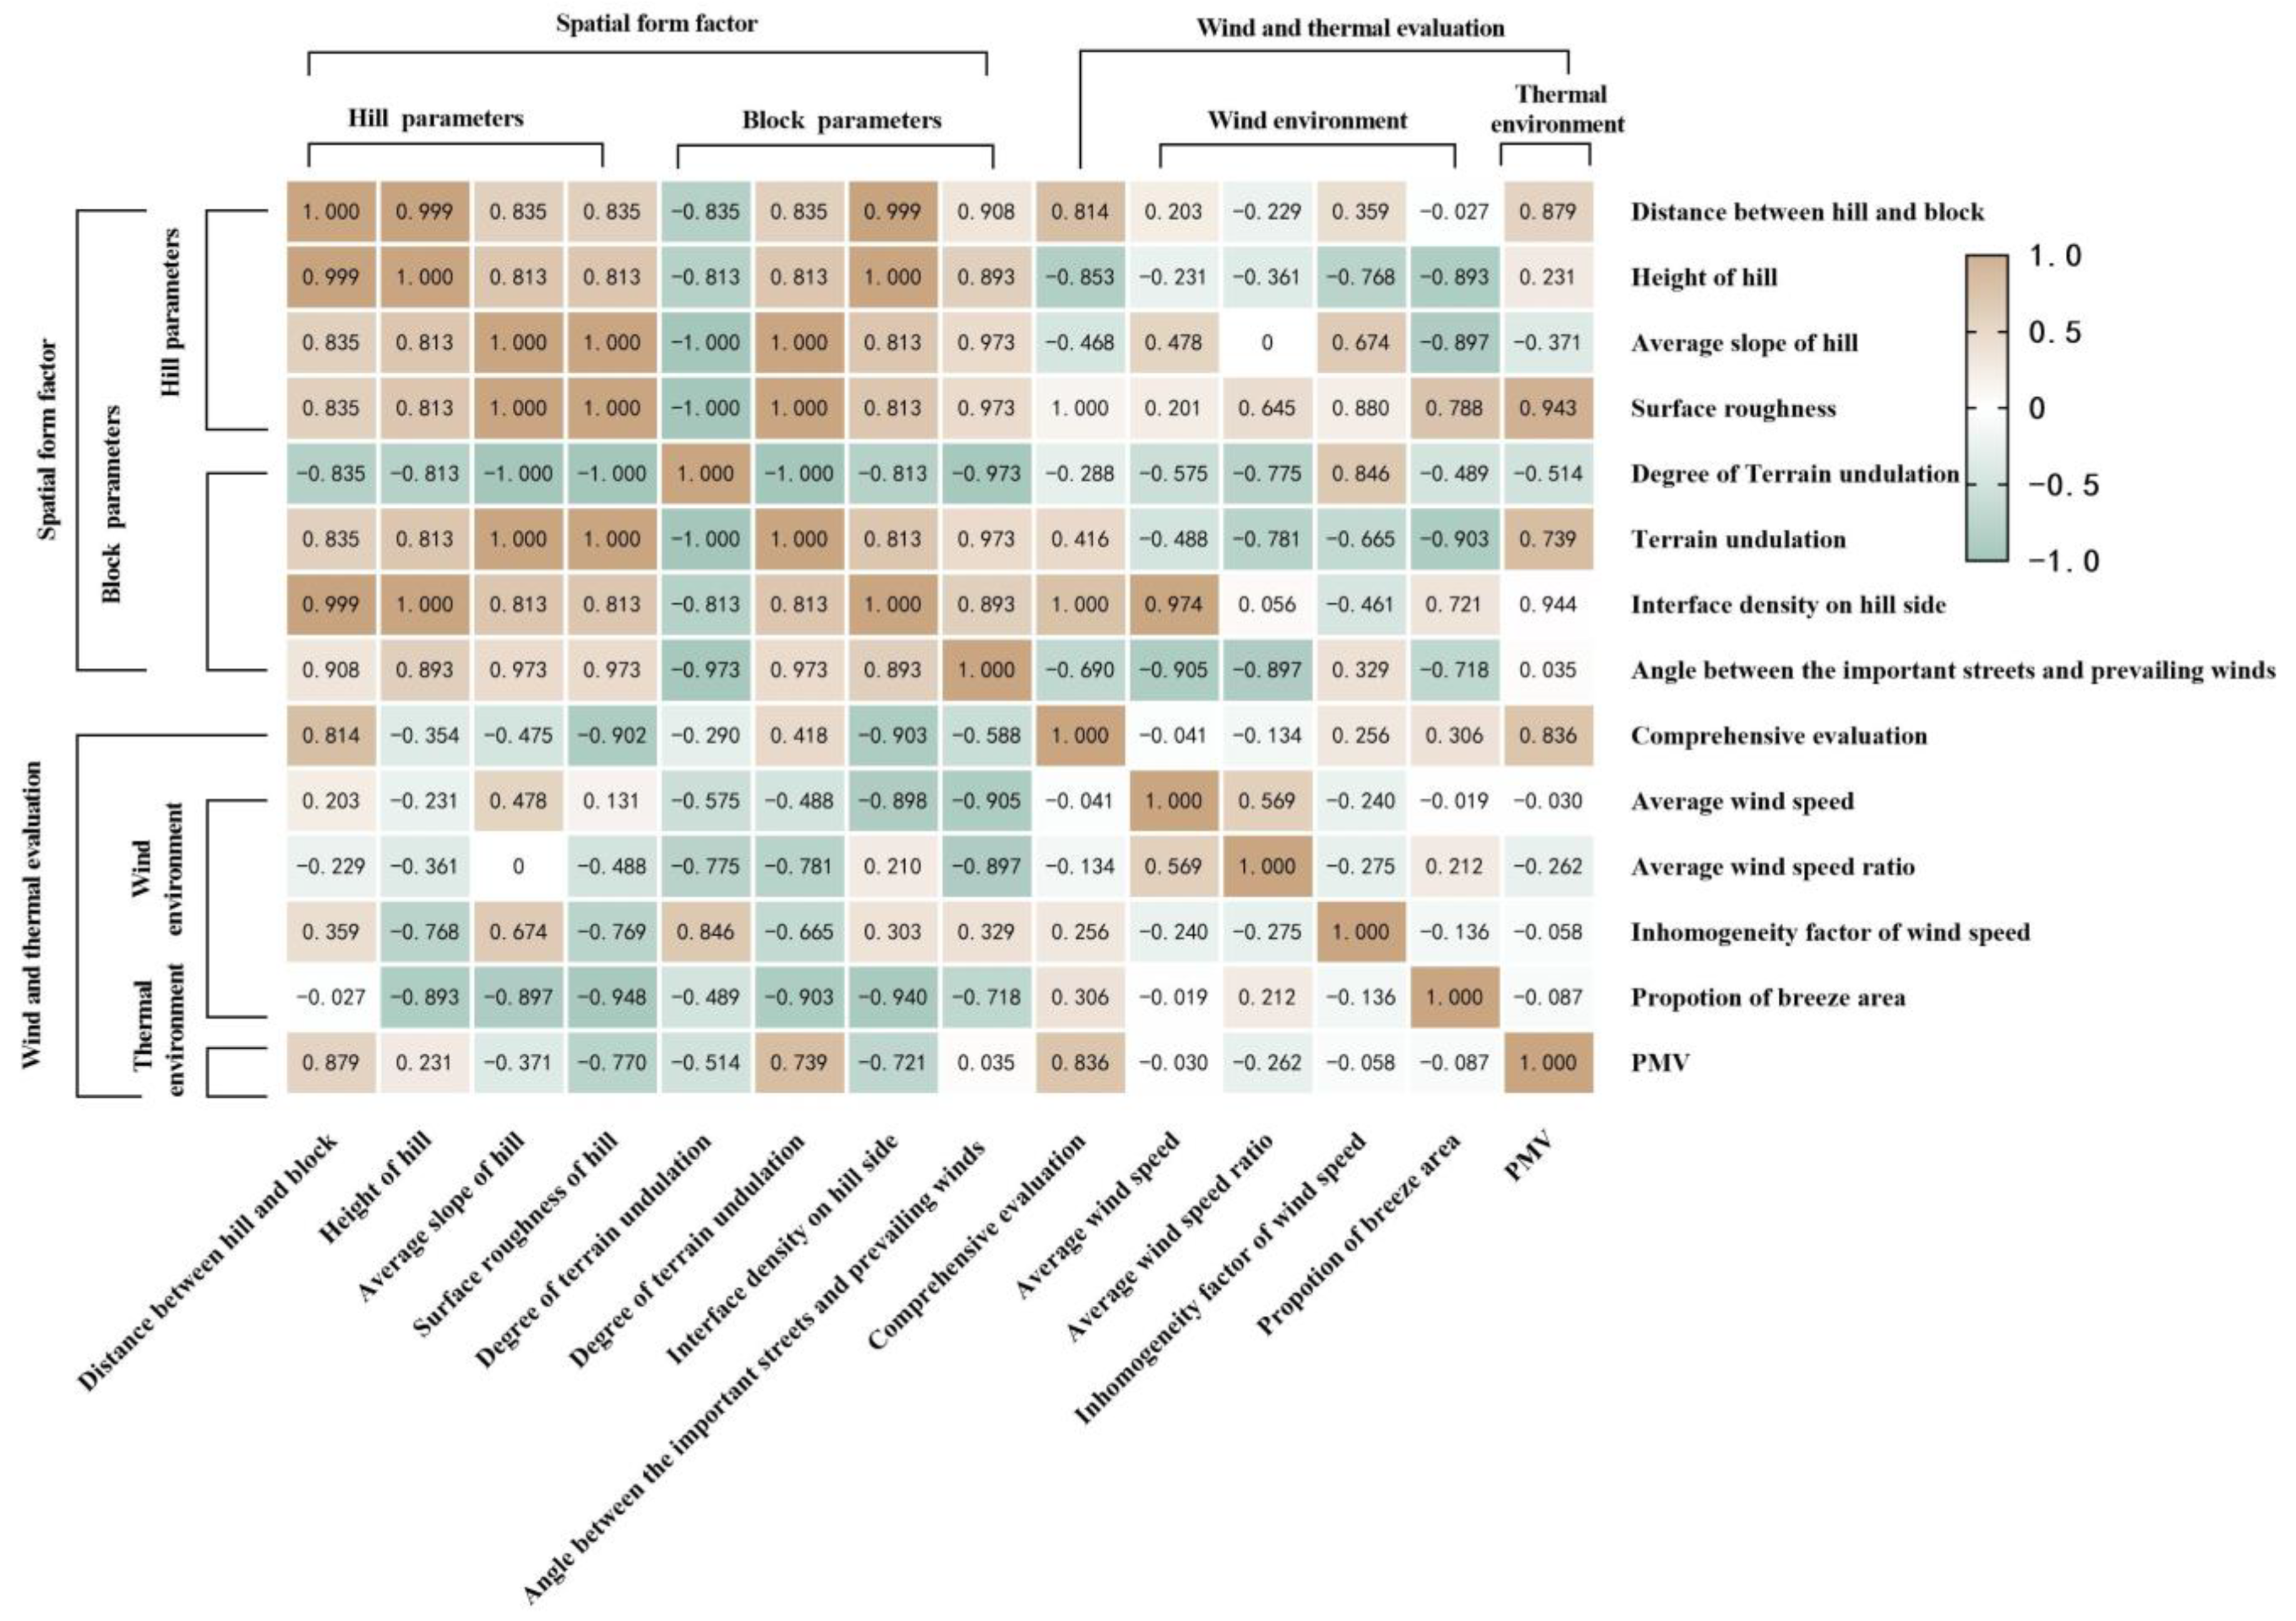
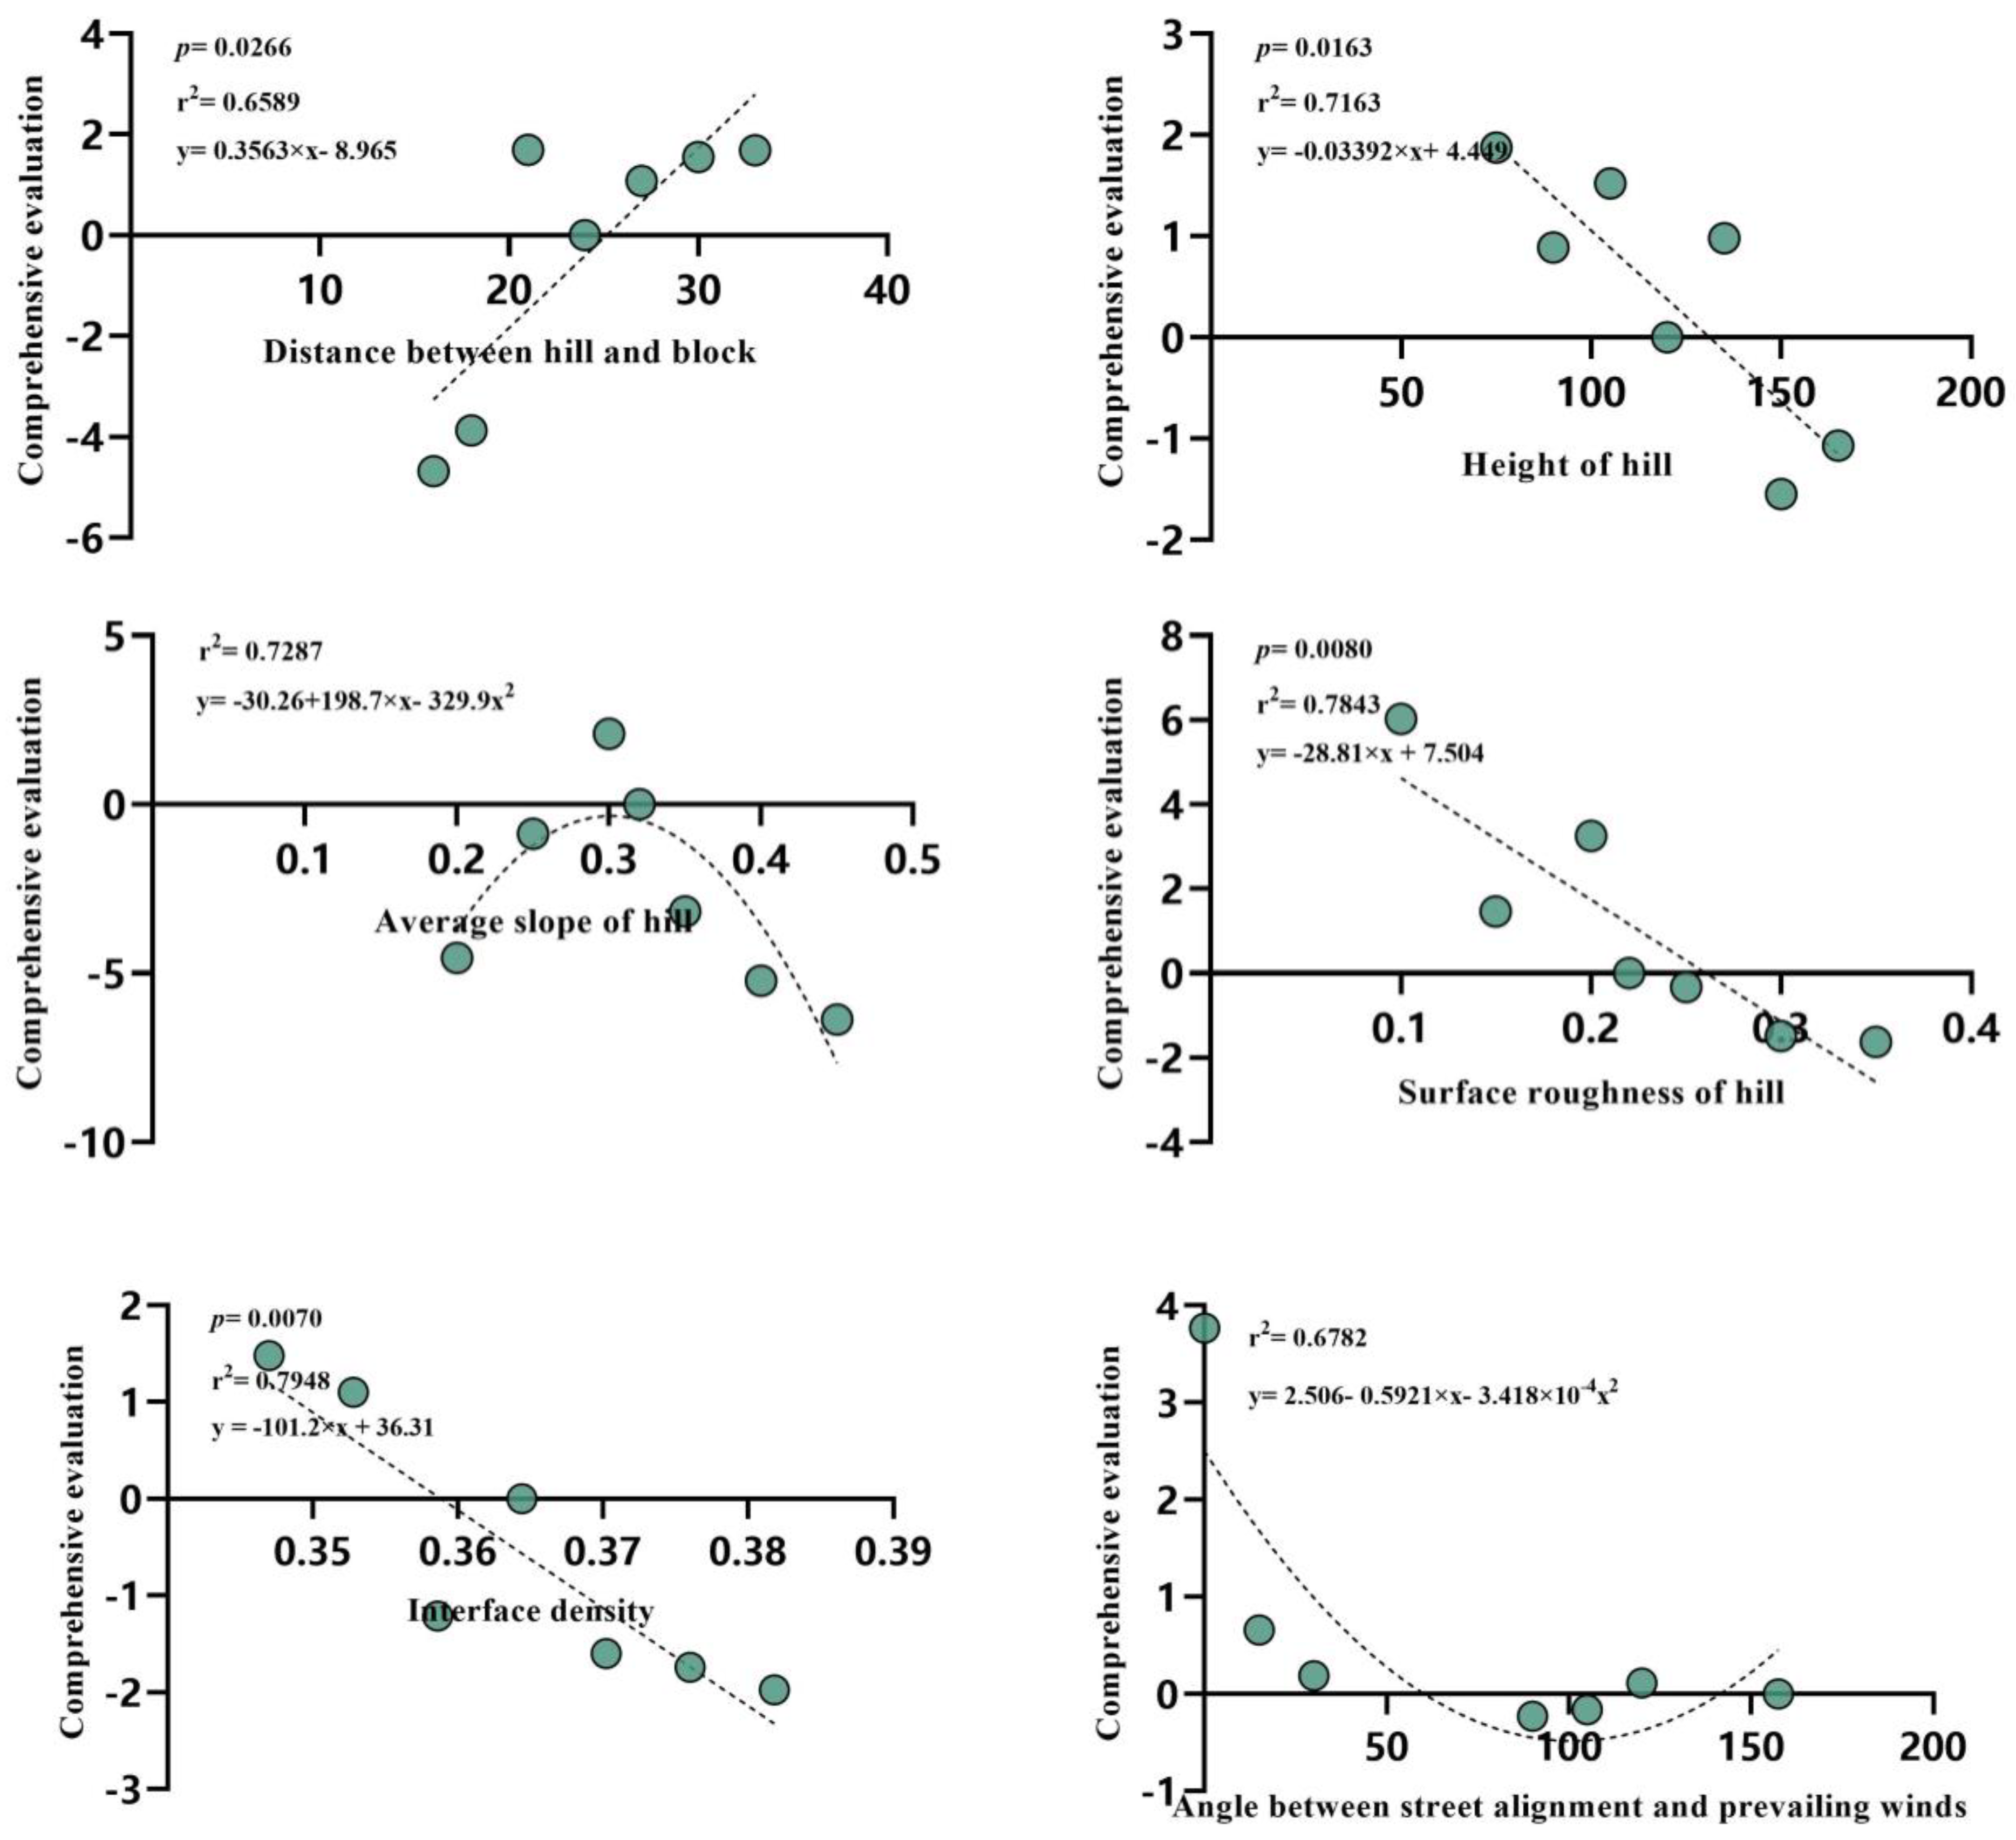
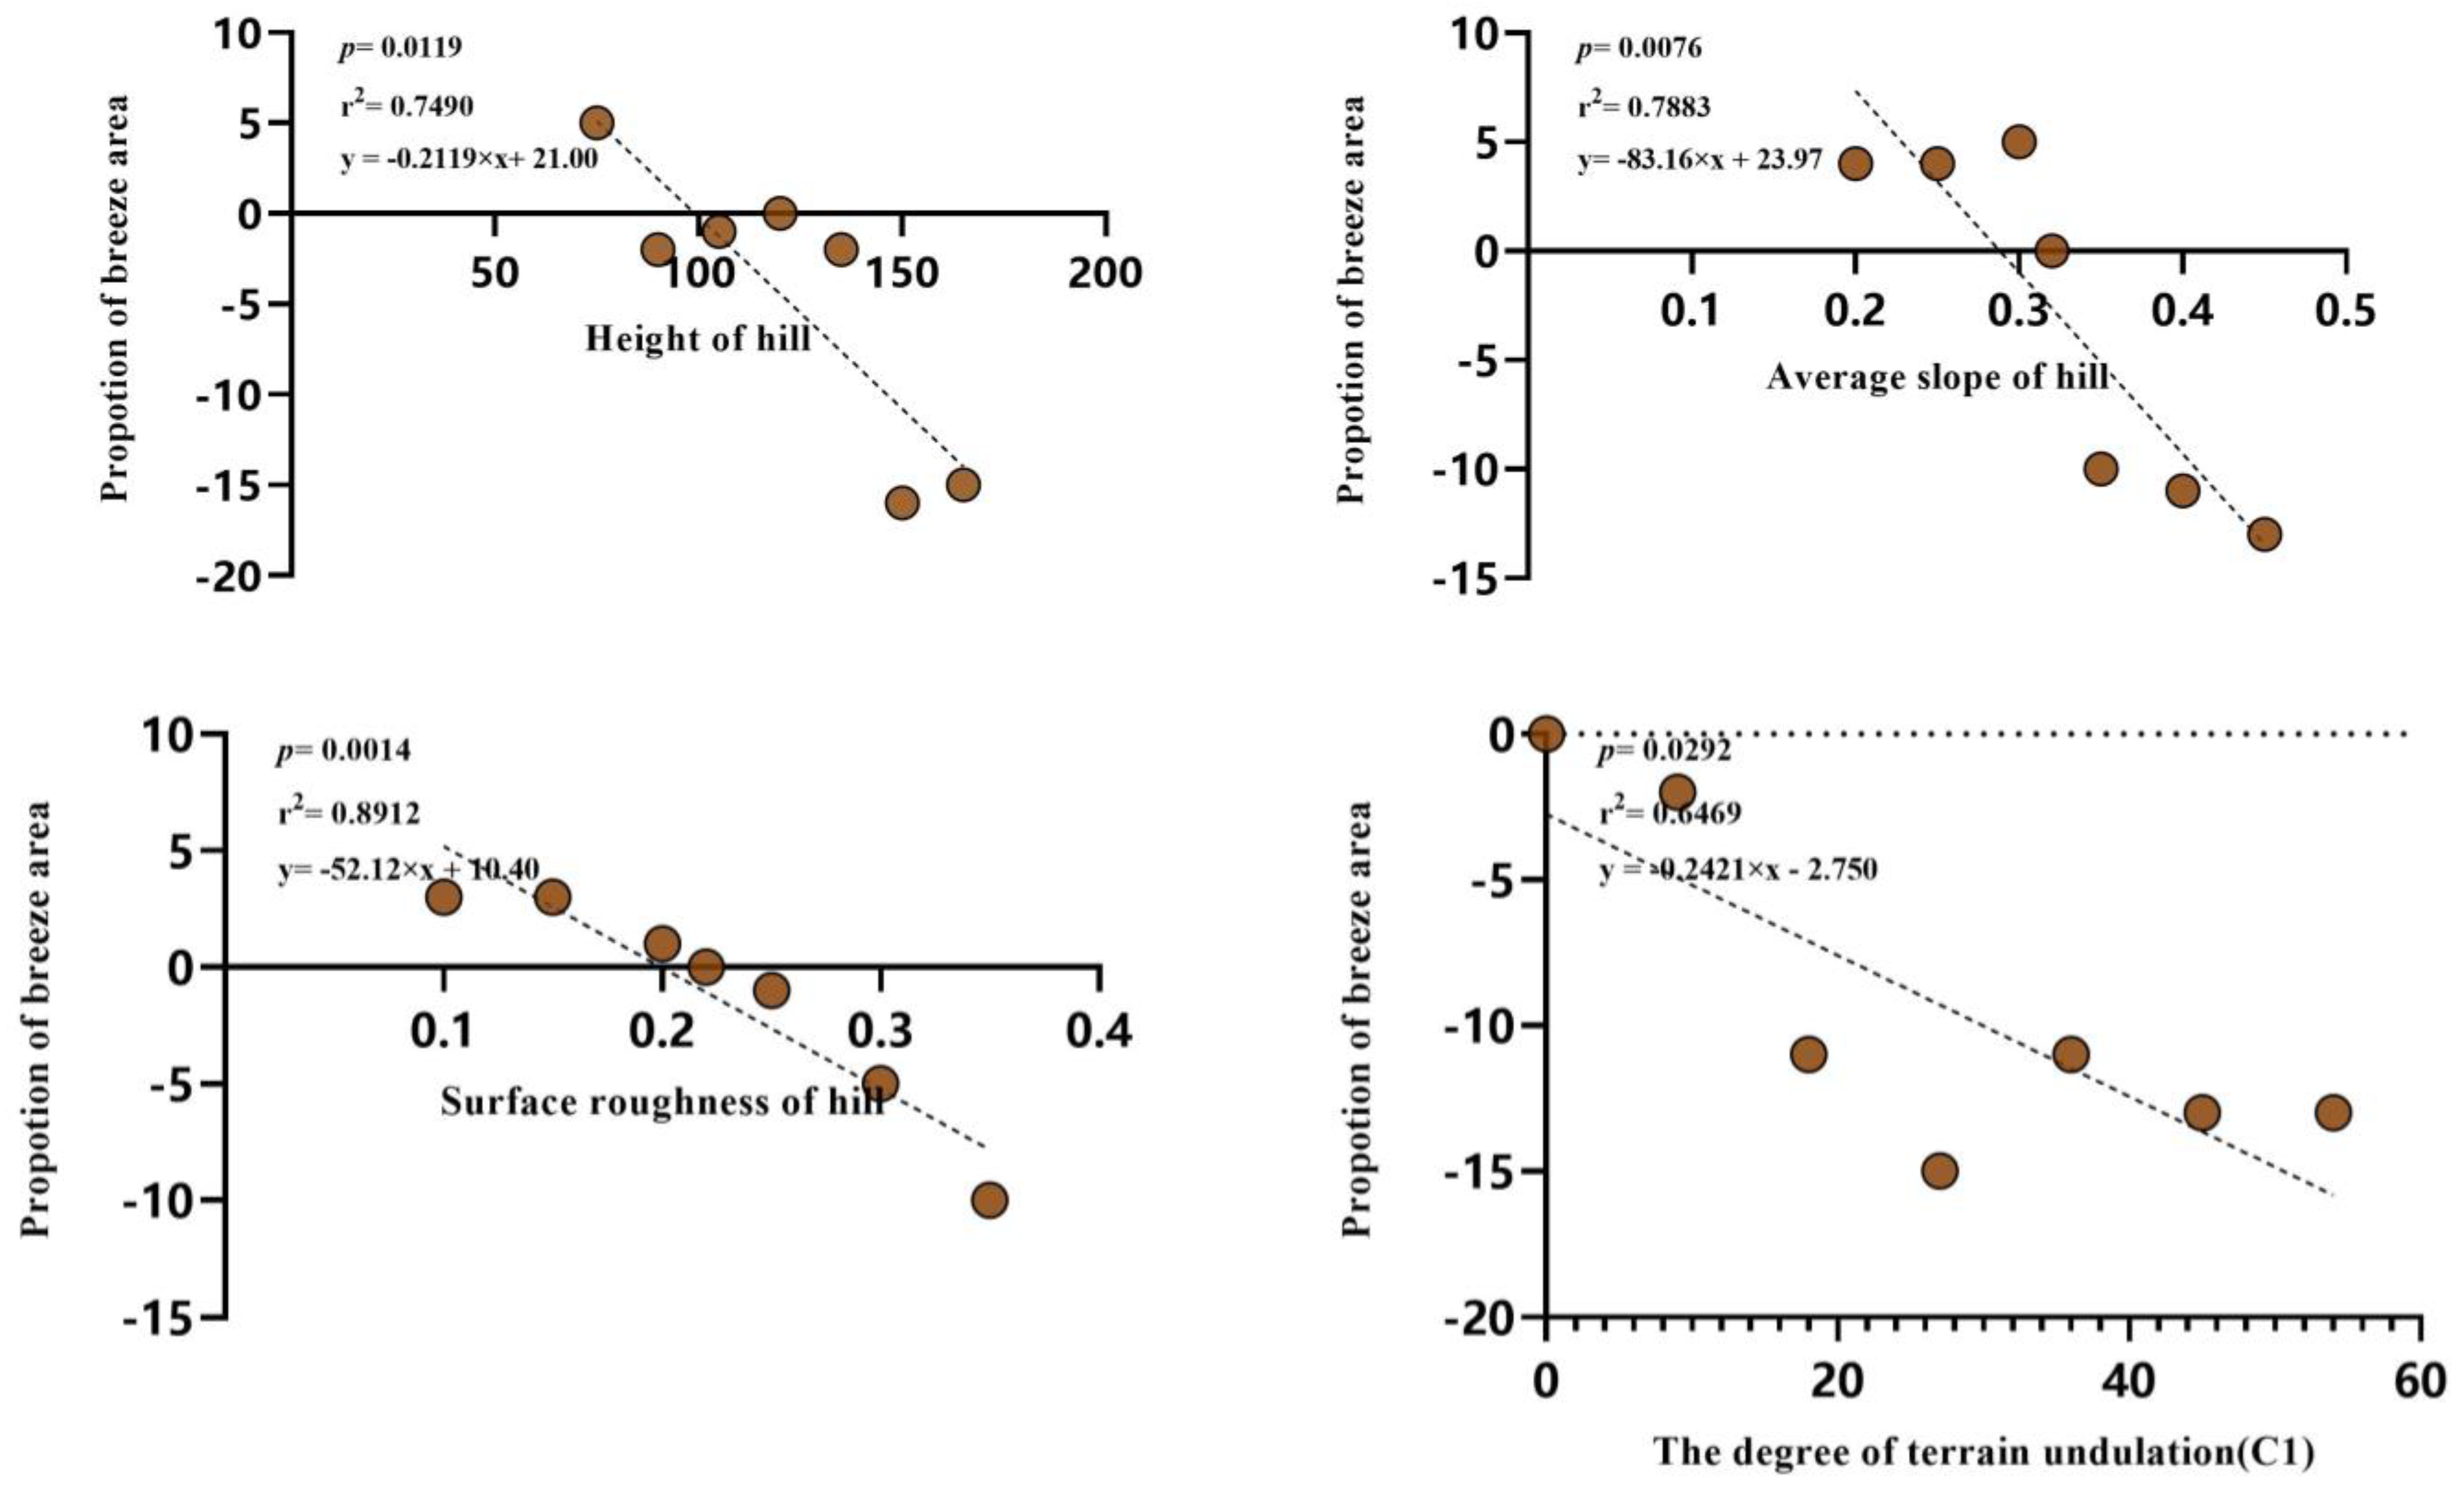
3.2.1. Correlation Determination

The pairwise Pearson correlation between the hill-neighboring block’s spatial form indicators and the wind–thermal environment evaluation factors is shown in Figure 8. The distance between the hill and the block and the height of the hill are strongly positively correlated with the overall wind–thermal environment; the surface roughness of the hill, and the angle between the main street direction and prevailing wind direction are obviously negatively correlated with the overall wind–thermal environment, whereas no significant correlation is found between the degree of terrain undulation of the block and the overall wind–thermal environment. In addition, the distance between the hill and block shows an obvious positive correlation with PMV. The interface density on the side of the hill shows a distinct negative correlation with the average wind speed and the inhomogeneity factor of wind speed. The height of the hill, average slope of the hill, surface roughness of the hill, and the degree of terrain undulation of the block all show clear negative correlations with the proportion of breeze area. The degree of terrain undulation of the block, the angle between the direction of the main street, and the prevailing wind direction showed remarkable negative correlations with PMV. The correlation between two single factors of the same type is not a valuable reference, so this paper does not discuss this in detail. In addition, non-linear correlations may exist, which need to be further investigated using non-linear regression analysis.
Through linear and nonlinear regression analyses of the relationship between the spatial form factors of the hill-neighboring block and the factors of the wind–thermal environment, the correlation results and rankings are obtained. Among the seven selected spatial form indicators, six of them, namely, the distance between the hill and block, height of the hill, average slope of the hill, surface roughness of the hill, hill-side interface density, and the angle between the main street direction and the prevailing wind direction, have clear correlations with the wind–thermal environment. And the correlation strengths of the above indicators are: hill-side interface density > surface roughness of the hill > average slope of the hill > height of the hill > angle between the main street direction and the prevailing wind direction > the distance between the hill and block (Figure 9), among which the interface density on the side of the hill is the indicator with the highest degree of fitness. Among the correlations between these seven spatial form indicators and the wind–thermal single factor, the five indicators related to the proportion of the breeze area are, in descending order of fitness: surface roughness of the hill > average slope of the hill > the degree of terrain undulation (C2) > height of the hill > degree of terrain undulation (C1). The fitting degree of the three indicators related to PMV is ranked from high to low as follows: the degree of terrain undulation (C2), the angle between the direction of the main street and the prevailing wind direction, distance between the hill and block.

3.2.2. Specific Regression Analysis

In the correlation analysis between the spatial form of the hill-neighboring block and the overall wind–thermal environment, the interface density of the hill-neighboring side and the surface roughness of the hill have distinct linear negative correlations, with correlation coefficients of −0.8915 and −0.8856, respectively. The distance between the hill and block and the height of the hill have significant linear positive correlations, with correlation coefficients of 0.8117 and 0.8463, respectively. The average slope of the hill, the angle between the direction of important streets and the prevailing wind direction, and the overall wind–thermal environment of the hill-neighboring block are nonlinearly correlated with each other, with correlation coefficients of 0.8536 and 0.8235, respectively. The average slope of the hill, the angle between the direction of important streets and the prevailing wind direction, and the overall wind–thermal environment of the hill-neighboring block are nonlinearly correlated with each other, with correlation coefficients of 0.8587 and 0.8436, respectively. The comprehensive scores of the wind–thermal environment of the former firstly increase and then decrease, and then reach a peak when the average slope is 0.3. In the latter case, the comprehensive score of the wind–thermal environment firstly decreases and then increases, and reaches a peak at the angle of 0°. Their specific regression equations are shown in Figure 10.
In the single-factor correlation analysis, four types of indicators, namely, the height of the hill, average slope of the hill, surface roughness of the hill, and degree of terrain undulation of the block, showed apparent linear negative correlations with the proportion of breeze area, with correlation coefficients of −0.8654, −0.8879, −0.9940, −0.8043, and −0.8805, respectively. With the increase in hill height and average slope, it is easy to form more breeze areas. An increase in the roughness of the hill surface would affect the ventilation performance of the block due to the change in the roughness of the underlying surface, resulting in the formation of more breeze areas. Both types of changes in the degree of terrain undulation of the block are clearly correlated with the score of the proportion of breeze area. Such as if the trend of the terrain is low on the near side and high on the far side of the hill, the change is distinctly negatively correlated, and the score decreases as the value of the elevation difference increases. If the trend of the terrain changes to high on the near side and low on the far side of the hill, then the proportion of breeze area increases with the increment of the value of the elevation difference, and there is a significant positive correlation. It is assumed that if the terrain on the far side of the hill is high, the “narrow tube effect” may be formed within a certain range in the hill-neighboring block, which reduces the proportion of breeze area. And if the terrain on the near side of the hill is high, it will be superimposed on the effect of the original hill, which will increase the wind shadow area of the block to a certain extent, and thus increase the proportion of breeze area. At the same time, the thermal comfort of the block is affected; in this case, the degree of terrain undulation of the block and the PMV show a significant linear negative correlation, with a correlation coefficient of −0.9149. The interface density of the hill-neighboring side with the average wind speed and the inhomogeneity factor of wind speed are both significantly linearly negatively correlated, with correlation coefficients of −0.8944 and −0.8799, respectively. The overall wind speed and the stability of the wind speed decreased with the increase in the interface density on the hill-neighboring side. The correlation between the distance between the hill and block, the angle between the important street and the prevailing wind direction, and PMV are linearly positive and negative, with correlation coefficients of 0.8514 and −0.9080, respectively, which shows that the thermal comfort of the block increases with the increment of the distance between the hill and block, and decreases with the increment of the angle between the important street and the prevailing wind direction within a certain range. The specific regression equations predicted for the wind–thermal single factor and the spatial form factor of the block are shown in Figure 11.

4. Discussion

4.1. Application to Urban Planning and Sustainable Development

Furthermore, as the smallest administrative unit in urban planning, blocks are conducive to urban planning departments and managers to execute relevant controls [27]. Therefore, based on our research results, suggestions for sustainable and green development of hill-neighboring blocks are put forward in the aspects of public space transformation, green plant planning and tree species matching, planning and controlling mode, building form, and layout optimization.
Firstly, among the six spatial form indicators with significant correlations with the overall wind–thermal environment, the three indicators of the height of the hill, the slope of the hill, and the surface roughness of the hill are all hill-related parameters, and it is difficult to intervene artificially with natural hills in most of the developed block, so planning should focus on how to impair the negative feedback they may generate and enhance their positive feedback. From the analysis of this research, it can be seen that they both have a distinct linear negative correlation with the score of the proportion of breeze area. Therefore, in the renewal construction of the block, the “corner space” and “enclosed space”, which may become breeze area, should be intervened and transformed, so as to reduce their negative impact on the wind–thermal environment in extreme cases. In addition, heat stress in cities can be reduced, and extreme summer temperatures can be ameliorated by the planning of greenery, such as choosing vegetation with a lower density of foliage for better wind cooling [47] and planting more trees and shrubs next to buildings. The near-surface wind–thermal environment can be improved by a mixture of planting various tree species and adding vertical greening.
Then, the distance between the hill and block, the interface density of the hill-neighboring side, and the angle between the important street direction and the prevailing wind direction belong to the parameters related to the hill–block relationship and block interface and structure, and should be planned in advance under the premise of considering economic development and intensive land utilization of the undeveloped block. With reference to prevailing wind direction, the road traffic engineering arrangement, red line, and building property line in municipal construction should be set, so that the positive feedback of the indicators on the wind–thermal environment of the block can be maximized within a reasonable range. For the developed block, in order to optimize the overall wind–thermal environment of the block, the spatial form of the block near the hill should be modulated through the addition of walking green paths along the hill, micro-alteration of the building form of the block, controlling the interface density, the skyline of the hill side, and linking the street with other important ventilated spaces.
Ultimately, there is no obvious correlation between the degree of terrain undulation of the block and its overall wind–thermal environment, and the reason may be related to the hill within the block. There is already special terrain such as hills in the hill-neighboring block, and the effect of changing the degree of terrain undulation of the block on the overall wind–thermal environment is relatively negligible. However, the correlation with the wind–thermal single-factor scores of the proportion of breeze area and PMV is significant, which still has an impact on the wind–thermal environment. This correlation can be used to create local micro-terrain in the block to reduce the generation of breeze area and increase the thermal comfort of the block, thus optimizing the overall wind–thermal environment of the block and enhancing the livability of the block.

4.2. Limitations and Prospects

Although the ideal benchmark model and the setting of relevant simulation parameters in this research are based on the city of Jinan, the correlation between the spatial form of the block and the wind–thermal environment as well as the specific mathematical laws obtained in this paper are still of high reference value for similar northern mountainous cities or southern cities with similar block types. And it has certain reference significance for optimizing the spatial form of blocks and improving the level of sustainable urban development.
However, the wind–thermal environment of a block is a multidimensional perception system, which is affected by different seasons, weather, location, diurnal variation, and other factors [48,49]. Deeper research for specific objects on other aspects is needed in the future. Otherwise, there are regional differences in the attributes of blocks in different cities in China and even worldwide, which shows a lack of systematic summarization. In the future, more comprehensive and interdisciplinary [50,51] research should be established based on building climate zoning combined with regional characteristics. And the results can be applied to the spatial analysis of urban design and block regeneration, which will provide more informative support for planning strategies.

5. Conclusions

Based on investigation, deep learning, CFD simulation and correlation analysis, the relationship between the spatial form of hill-neighboring blocks and the wind–thermal environment has been quantitatively analyzed. The following original conclusions are drawn:
(1) Interface density on hill side and the surface roughness of the hill are the most vital indicators, with correlation coefficients of −0.8915 and −0.8856. (2) The distance between the hill and block and the height of the hill are linearly positively correlated with the overall wind–thermal environment, while interface density on the hill side and the surface roughness of the hill are linearly negatively correlated with it. The relationships between the average slope hill and the angle between the important streets and the prevailing wind and the wind–thermal environment are nonlinear, and they reach the peak value when the average slope is 0.3 and the angle is 0°, respectively. (3) The proportion of breeze area is the most correlated factor; height, average slope, surface roughness of the hill, and the degree of terrain undulation are all correlated with it. The second is PMV, which is correlated with the distance between the hill and block, the degree of terrain undulation, and the angle between important streets and the prevailing wind. Therefore, in the renewal construction of blocks, we should focus on those factors that may affect the proportion of breeze area. The space that may become a “breeze zone” is interfered with by a method of urban design, so that the wind can flow as much as possible inside the block. And from the perspective of green planting planning, we should reduce the negative impact of the high PMV value of the hill-neighboring block. In addition, we should optimize the spatial form of the hill-neighboring block by controlling the building density and skyline of the near-hill side, or optimize the wind–thermal environment by creating local micro-topography within the block. These findings could provide references for urban planners and decision makers to enhance the spatial form and quality of the wind–thermal environment. Meanwhile, the systematic research process of investigation, physical modeling, numerical simulation, and mathematical analysis is reproducible for exploring the correlation between the urban form of other scales and dimensions and the natural environment.

Author Contributions

Conceptualization, Y.Z. and Z.F.; methodology, L.Z. and Y.Z.; software, Y.Z.; formal analysis, Y.Z.; investigation, Y.Z.; resources, L.Z. and Y.L.; data curation, Y.Z.; writing—original draft preparation, L.Z. and Y.Z.; writing—review and editing, Y.W. and Y.L.; visualization, Y.Z.; supervision, L.Z., Y.W., and Z.F.; project administration, L.Z. and Y.W.; funding acquisition, L.Z. and Y.W. All authors have read and agreed to the published version of the manuscript.

Funding

This research was funded by Natural Science Foundation of Shandong Province, grant number ZR2021ME237 and The APC was funded by Natural Science Foundation of Shandong Province.

Institutional Review Board Statement

Not applicable.

Informed Consent Statement

Not applicable.

Data Availability Statement

The data will be provided if needed and available.

Acknowledgments

The authors would like to thank the anonymous reviewers for their thorough review and valuable remarks that helped to improve the manuscript.

Conflicts of Interest

The authors declare that they have no known competing financial interests or personal relationships that could have appeared to influence the work reported in this paper.

Appendix A

Table A1. Introduction of hill-neighboring blocks prototypes.
CategoriesSub-CategoriesSpatial CharacteristicsType Schematic
The encirclementRound-shapedFacing the hills on all sides, the enclosure is round-shapedSustainability 16 02203 i009
L-shapedFacing the hills on two sides, the enclosure is L-shapedSustainability 16 02203 i010
U-shapedFacing the hills on three sides, the enclosure is U-shapedSustainability 16 02203 i011
Point groupFacing more than one hill, the enclosure is point-shapedSustainability 16 02203 i012
The tangentCornerTangent to the hill on both sides, which is a corner tangentSustainability 16 02203 i013
LinearTangent to the hill on one side, which is a linear tangent
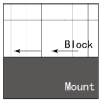
Sustainability 16 02203 i014
The embeddingSemi-embedded hill and blockThe hill and the block are mortise and tenon joints.
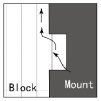
Sustainability 16 02203 i015
Block along the hillThe side near the hill is laid out along the hill shape, which is embedded with the hill.Sustainability 16 02203 i016

Appendix B

Table A2. Simulation results of wind–thermal under different cases.
IndicatorCaseAverage Speed
(m/s)
Average Temperature
(°C)
Average PMVIndicatorCaseAverage Speed (m/s)Average Temperature
(°C)
Average PMV
AA-02.1838.572.78C1C1-02.1838.572.78
A-12.8436.762.74C1-12.4336.812.65
A-22.3038.782.81C1-21.9739.342.73
A-32.2740.872.82C1-32.7135.522.58
A-41.8135.332.60C1-42.5837.132.42
A-52.0638.592.65C1-52.4433.812.01
A-62.6239.882.65C1-62.9835.822.49
B1B1-02.1838.572.78C2C2-02.1838.572.78
B1-12.2638.362.52C2-13.1042.742.86
B1-22.9639.182.59C2-22.6436.332.67
B1-33.0039.152.59C2-33.8140.792.97
B1-42.7839.192.57C2-42.7233.652.08
B1-52.7639.152.55C2-52.6535.242.49
B1-62.7839.252.57C2-62.5235.322.08
B2B2-02.1838.572.78DD-02.1838.572.78
B2-12.3938.892.88D-11.9739.852.77
B2-21.9739.342.73D-22.1839.912.62
B2-32.7038.522.58D-32.4241.452.61
B2-43.0940.122.77D-41.9938.532.73
B2-53.0540.362.94D-51.9639.662.72
B2-62.5639.682.89D-61.9540.032.72
B3B3-02.1838.572.78EE-02.1838.572.78
B3-12.0138.082.47E-12.7635.042.25
B3-21.8638.792.60E-22.3037.892.65
B3-32.1336.952.36E-32.2240.842.64
B3-42.1237.972.64E-41.5434.462.58
B3-52.0039.432.67E-51.7437.752.39
B3-62.2138.582.64E-61.6239.532.61

References

  1. Wu, J. Urban ecology and sustainability: The state-of-the-science and future directions. Landsc. Urban. Plan. 2014, 125, 209–221. [Google Scholar] [CrossRef]
  2. Batty, M. City 1.0, City 2.0, City n.0, …, City t. Environ. Plan. B Plan. Des. 2014, 41, 1–2. [Google Scholar] [CrossRef]
  3. Yu, W.; Shi, J.; Fang, Y.; Xiang, A.; Li, X.; Hu, C.; Ma, M. Exploration of urbanization characteristics and their effect on the urban thermal environment in Chengdu, China. Build. Environ. 2022, 219, 109150. [Google Scholar] [CrossRef]
  4. Du, S.; Zhang, X.; Jin, X.; Zhou, X.; Shi, X. A review of multi-scale modelling, assessment, and improvement methods of the urban thermal and wind environment. Build. Environ. 2022, 213, 108860. [Google Scholar] [CrossRef]
  5. Liu, Y.S.; Yigitcanlar, T.; Guaralda, M.; Degirmenci, K.; Liu, A.; Kane, M. Leveraging the Opportunities of Wind for Cities through Urban Planning and Design: A PRISMA Review. Sustainability 2022, 14, 11665. [Google Scholar] [CrossRef]
  6. Liu, D.; Zhou, S.; Wang, L.; Chi, Q.; Zhu, M.; Tang, W.; Zhao, X.; Xu, S.; Ye, S.; Lee, J.; et al. Research on the Planning of an Urban Ventilation Corridor Based on the Urban Underlying Surface Taking Kaifeng City as an Example. Land 2022, 11, 206. [Google Scholar] [CrossRef]
  7. Pallares-Barbera, M.; Gisbert, M.; Badia, A. Grid orientation and natural ventilation in Cerdà’s 1860 urban plan for Barcelona. Plan. Perspect. 2021, 36, 719–739. [Google Scholar] [CrossRef]
  8. Ren, C.; Yang, R.; Cheng, C.; Xing, P.; Fang, X.; Zhang, S.; Wang, H.; Shi, Y.; Zhang, X.; Kwok, Y.T.; et al. Creating breathing cities by adopting urban ventilation assessment and wind corridor plan–The implementation in Chinese cities. J. Wind. Eng. Ind. Aerodyn. 2018, 182, 170–188. [Google Scholar] [CrossRef]
  9. Palusci, O.; Monti, P.; Cecere, C.; Montazeri, H.; Blocken, B. Impact of morphological parameters on urban ventilation in compact cities: The case of the Tuscolano-Don Bosco district in Rome. Sci. Total Environ. 2022, 807, 150490. [Google Scholar] [CrossRef]
  10. He, B.-J.; Ding, L.; Prasad, D. Wind-sensitive urban planning and design: Precinct ventilation performance and its potential for local warming mitigation in an open midrise gridiron precinct. J. Build. Eng. 2020, 29, 101145. [Google Scholar] [CrossRef]
  11. Su, Y.; Zhao, Q.; Zhou, N. Improvement strategies for thermal comfort of a city block based on PET Simulation— A case study of Dalian, a cold-region city in China. Energy Build. 2022, 261, 111557. [Google Scholar] [CrossRef]
  12. Chengrong, L.; Tian, C. Evaluation and Optimization Strategy of Cold Source Quality to Alleviate Urban Thermal Environment. Econ. Geogr. 2023, 43, 42–51. [Google Scholar] [CrossRef]
  13. Peng, S.; Zou, Z.; Hong, L. Numerical simulation of wind and thermal environment in inner cities and strategies for partial renewal: A case study of dazhimen, wuhan. City Plan. Rev 2016, 40, 16–24. [Google Scholar]
  14. Ma, D.; Wang, Y.; Zhou, D.; Zhu, Z.; Yang, Y. The renew plans of urban thermal environment optimization for traditional districts in Xi’an, China. Environ. Sci. Pollut. Res. 2023, 30, 5700–5716. [Google Scholar] [CrossRef]
  15. Kwok, Y.T.; Schoetter, R.; Lau, K.K.; Hidalgo, J.; Ren, C.; Pigeon, G.; Masson, V. How well does the local climate zone scheme discern the thermal environment of Toulouse (France)? An analysis using numerical simulation data. Int. J. Climatol. 2019, 39, 5292–5315. [Google Scholar] [CrossRef]
  16. Peng, C.; Ming, T.; Cheng, J.; Wu, Y.; Peng, Z.-R. Modeling Thermal Comfort and Optimizing Local Renewal Strategies—A Case Study of Dazhimen Neighborhood in Wuhan City. Sustainability 2015, 7, 3109–3128. [Google Scholar] [CrossRef]
  17. Liang, H.Y.; Meng, Q.L.; Li, X.H. A study of a method for evaluating the wind environment in old city renewal planning in South China: A case study of renewal planning for Yuzhu Old City, Huangpu District, Guangzhou. South. Archit. 2018, 4, 34–39. [Google Scholar] [CrossRef]
  18. Gagliano, A.; Nocera, F.; Aneli, S. Computational Fluid Dynamics Analysis for Evaluating the Urban Heat Island Effects. Energy Procedia 2017, 134, 508–517. [Google Scholar] [CrossRef]
  19. Wang, Z.; Liu, T. Comfort Evaluation of the Wind Environment of the Historical Sites of Haisi Culture in Quanzhou. Chin. Landsc. Archit. 2021, 36, 89. [Google Scholar] [CrossRef]
  20. Miao, C.; He, X.; Gao, Z.; Chen, W.; He, B.J. Assessing the vertical synergies between outdoor thermal comfort and air quality in an urban street canyon based on field measurements. Build. Environ. 2023, 227, 109810. [Google Scholar] [CrossRef]
  21. Ying, X.; Kan, Q. The Influence of Street Spatial Layout Factors on Wind Environment in Hangzhou, Zhejiang. Sci. Geogr. Sin. 2018, 38, 2093–2099. [Google Scholar] [CrossRef]
  22. Bao, J.; Xu, L.; Shi, Y.; Ma, Q.; Lu, Z. The Influence of Street Morphology on Thermal Environment Based on ENVI-met Simulation: A Case Study of Hangzhou Core Area, China. ISPRS Int. J. Geoinf. 2023, 12, 303. [Google Scholar] [CrossRef]
  23. Hu, T.; Yoshie, R. Indices to evaluate ventilation efficiency in newly-built urban area at pedestrian level. J. Wind. Eng. Ind. Aerodyn. 2013, 112, 39–51. [Google Scholar] [CrossRef]
  24. Azizi, M.M.; Javanmardi, K. The Effects of Urban Block Forms on the Patterns of Wind and Natural Ventilation. Procedia Eng. 2017, 180, 541–549. [Google Scholar] [CrossRef]
  25. Yan, S.; Zhang, T.; Wu, Y.; Lv, C.; Qi, F.; Chen, Y.; Wu, X.; Shen, Y. Cooling Effect of Trees with Different Attributes and Layouts on the Surface Heat Island of Urban Street Canyons in Summer. Atmosphere 2023, 14, 857. [Google Scholar] [CrossRef]
  26. Kan, Q.; Setoguchi, T. The Correlation between Street Spatial Layout Factors and Wind Environment. In Нoвые Идеи Нoвoгo Века: Материалы Междунарoднoй Научнoй Кoнференции ФАД ТОГУ; ФГБОУ ВО: Moscow, Russia, 2021; pp. 156–161. [Google Scholar]
  27. Chen, X.; Wang, Z.; Bao, Y.; Luo, Q.; Wei, W. Combined impacts of buildings and urban remnant mountains on thermal environment in multi-mountainous city. Sustain. Cities Soc. 2022, 87, 104247. [Google Scholar] [CrossRef]
  28. Li, Y.; Chen, L. Study on the influence of voids on high-rise building on the wind environment. Build. Simul. 2020, 13, 419–438. [Google Scholar] [CrossRef]
  29. Ornelas, A.; Cordeiro, A.; Lameiras, J.M. Thermal Comfort Assessment in Urban Green Spaces: Contribution of Thermography to the Study of Thermal Variation between Tree Canopies and Air Temperature. Land 2023, 12, 1568. [Google Scholar] [CrossRef]
  30. Ji, H.; Li, Y.; Li, J.; Ding, W. A Novel Quantitative Approach to the Spatial Configuration of Urban Streets Based on Local Wind Environment. Land 2023, 12, 2102. [Google Scholar] [CrossRef]
  31. Du, Y.; Mak, C.M.; Tang, B. Effects of building height and porosity on pedestrian level wind comfort in a high-density urban built environment. Build. Simul. 2018, 11, 1215–1228. [Google Scholar] [CrossRef]
  32. Lin, J.; Brown, R. Integrating Microclimate into Landscape Architecture for Outdoor Thermal Comfort: A Systematic Review. Land 2021, 10, 196. [Google Scholar] [CrossRef]
  33. Ki, D.; Chen, Z.; Lee, S.; Lieu, S. A novel walkability index using google street view and deep learning. Sustain. Cities Soc. 2023, 99, 104896. [Google Scholar] [CrossRef]
  34. Zuo, C.; Liang, C.; Chen, J.; Xi, R.; Zhang, J. Machine Learning-Based Urban Renovation Design for Improving Wind Environment: A Case Study in Xi’an, China. Land 2023, 12, 739. [Google Scholar] [CrossRef]
  35. Zhou, Y. Quantitative Research on Street Interface Morphology: Comparison Between Chinese and Western Cities; Springer Nature: Berlin, Germany, 2022. [Google Scholar]
  36. Zhang, J.; Liu, Z.; Xu, Y.; Ma, S.; Xu, Q. An experimental and numerical study on the charring rate of timber beams exposed to three-side fire. Sci. China Technol. Sci. 2012, 55, 3434–3444. [Google Scholar] [CrossRef]
  37. China Academy of Urban Planning Design. Standard for Urban Residential Area Planning and Design; Ministry of Housing and Urban-Rural Development of the People’s Republic of China: Beijing, China, 2018. [Google Scholar]
  38. Buccolieri, R.; Santiago, J.L.; Martilli, A. CFD modelling: The most useful tool for developing mesoscale urban canopy parameterizations. Build. Simul. 2021, 14, 407–419. [Google Scholar] [CrossRef]
  39. Chen, P. Numerical Study of Terrain Influence on the Airflow over Hilly Land. Master’s Thesis, Zhejiang University, Hangzhou, China, 2007. Available online: https://kns-cnki-net-443.webvpn.sdjzu.edu.cn/kcms2/article/abstract?v=9w9hjx65dQT4xmT-sQZioCM0dIr2GsZQPMa8QTM0v7XLz0MWTRnGRu4zgXvZMWXS4wXS3HUinxgt46NUY4XrCEZZ6tyYGrQHauA1Pj5o7qqq0NvITnZ_z3gHHsjMcC89qDa_UPxSiiM9fa7rwh4HDw==&uniplatform=NZKPT&language=CHS (accessed on 6 July 2023).
  40. Markatos, N.C. The mathematical modelling of turbulent flows. Appl. Math. Model. 1986, 10, 190–220. [Google Scholar] [CrossRef]
  41. Rodi, W. Turbulence Models and Their Application in Hydraulics; Routledge: London, UK, 2017. [Google Scholar] [CrossRef]
  42. Du, Y.; Mak, C.M. Improving pedestrian level low wind velocity environment in high-density cities: A general framework and case study. Sustain. Cities Soc. 2018, 42, 314–324. [Google Scholar] [CrossRef]
  43. Coccolo, S.; Kämpf, J.; Scartezzini, J.L.; Pearlmutter, D. Outdoor human comfort and thermal stress: A comprehensive review on models and standards. Urban. Clim. 2016, 18, 33–57. [Google Scholar] [CrossRef]
  44. Rupp, R.F.; Vásquez, N.G.; Lamberts, R. A review of human thermal comfort in the built environment. Energy Build. 2015, 105, 178–205. [Google Scholar] [CrossRef]
  45. Zhu, Y. How to create a healthy and comfortable indoor thermal environment: Exploration on the relationship between the built environment and human comfort and health. World Archit. 2021, 3, 42–45. [Google Scholar]
  46. Ma, X.; Zhang, J.; Wang, P.; Zhou, L.; Sun, Y. Estimating the nonlinear response of landscape patterns to ecological resilience using a random forest algorithm: Evidence from the Yangtze River Delta. Ecol. Indic. 2023, 153, 110409. [Google Scholar] [CrossRef]
  47. Salata, F.; Golasi, I.; Vollaro, A.D.L.; Vollaro, R.D.L. How high albedo and traditional buildings’ materials and vegetation affect the quality of urban microclimate. A case study. Energy Build. 2015, 99, 32–49. [Google Scholar] [CrossRef]
  48. Moffett, K.B.; Makido, Y.; Shandas, V. Urban-Rural Surface Temperature Deviation and Intra-Urban Variations Contained by an Urban Growth Boundary. Remote Sens. 2019, 11, 2683. [Google Scholar] [CrossRef]
  49. Santamouris, M. Analyzing the heat island magnitude and characteristics in one hundred Asian and Australian cities and regions. Sci. Total Environ. 2015, 512–513, 582–598. [Google Scholar] [CrossRef]
  50. Mortezazadeh, M.; Zou, J.; Hosseini, M.; Yang, S.; Wang, L. Estimating Urban Wind Speeds and Wind Power Potentials Based on Machine Learning with City Fast Fluid Dynamics Training Data. Atmosphere 2022, 13, 214. [Google Scholar] [CrossRef]
  51. Yao, Y.; Chang, C.; Ndayisaba, F.; Wang, S. A New Approach for Surface Urban Heat Island Monitoring Based on Machine Learning Algorithm and Spatiotemporal Fusion Model. IEEE Access 2020, 8, 164268–164281. [Google Scholar] [CrossRef]
Figure 1. Example of semantic segmentation (Taking Xiaogui mountain, Muniu mountain, Ganniu mountain, Kuang mountain as examples).
Sustainability 16 02203 g001
Figure 2. Benchmark models of three types of hill-neighboring blocks extracted from real blocks: (a) the encirclement; (b) the tangent; (c) the embedding.
Sustainability 16 02203 g002
Figure 3. Comprehensive evaluation system of wind–thermal environment.
Sustainability 16 02203 g003
Figure 4. Oob Error Distribution under different random eigenvalues and the ROC curve of random forest: (a) Oob Error Distribution under different random eigenvalues; (b) ROC curve of random forest.
Sustainability 16 02203 g004
Figure 5. Results of weight calculation.
Sustainability 16 02203 g005
Figure 6. Visualization results of wind–thermal simulation (take CaseA-1 for example): (a) wind nephogram; (b) temperature nephogram; (c) PMV nephogram.
Sustainability 16 02203 g006
Figure 7. Comparison of evaluation results of each case of wind–thermal environment.
Sustainability 16 02203 g007
Figure 8. Pearson correlation statistics of spatial form indicators and wind–thermal environment factors of hill-neighboring blocks.
Sustainability 16 02203 g008
Figure 9. Results of correlation between spatial form factors and wind–thermal environment factors of hill-neighboring blocks (ns means that the correlation is not significant, * means that the p value is <0.1, ** means that the p value is <0.01, ^ means that the correlation is non-linear).
Sustainability 16 02203 g009
Figure 10. Regression analysis of spatial form and comprehensive wind–thermal environment of hill-neighboring block.
Sustainability 16 02203 g010
Figure 11. Single-factor regression analysis of spatial form and wind–thermal environment evaluation of hill-neighboring block.
Sustainability 16 02203 g011aSustainability 16 02203 g011b
Table 1. Spatial form indicators of hill-neighboring block.
CategoriesIndicatorsSpecific Illustrations
Relationship between hill and blockDistance between hill and block (d)The distance between the building property line of the block and the green line of the hill (the control line of the no-construction zone).
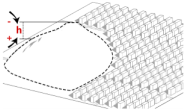
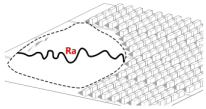
Hill scaleHeight of hill (h), slope of hill (i)The average slope of the hill is used to refer to the slope of the hill.
Surface roughness of hill (Ra)
Terrain undulationDegree of terrain undulation (R)R = HmaxHmin (Hmax and Hmin
They are the maximum and minimum elevations in the block, respectively.)
Interface densityInterface density of near-hill side (De) D e = i = 1 n W i L (where Wi represents the width of the projected surface of the building along the street in section i)
Block structureAngel between the direction of important streets and prevailing winds (θ)
Table 2. Setting of variations in each spatial form indicator.
Indicator A series: setting of distance between hill and block variationIndicator B1 series: setting of the height of hill variation
Sustainability 16 02203 i001Sustainability 16 02203 i002
Case A-1~A-6: distance reduced and increased by 3 m, 6 m, and 9 m, respectively.Case B1-1~B1-6: height reduced and increased by 15 m, 30 m, and 45 m, respectively.
Indicator B2 series: setting of the average slope of hill variationIndicator B3 series: setting of the surface roughness of hill variation
Sustainability 16 02203 i003Sustainability 16 02203 i004
Case B2-1~B2-6: average slope is 0.20, 0.25, 0.30, 0.40, and 0.45, respectively.Case B3-1~B3-6: surface roughness is 0.1, 0.15, 0.20, 0.25, 0.30, and 0.35, respectively.
Indicator C1 series: setting of the degree of terrain undulation variationIndicator C2 series: setting of the degree of terrain undulation variation
Sustainability 16 02203 i005Sustainability 16 02203 i006
Case C1-1~C1-6: the elevation difference between the adjacent hill and far hill is −9 m, −18 m, −27 m, −36 m, −45 m, and −54 m, respectively.Case C2-1~C2-6: the elevation difference between the adjacent hill and far hill is 9 m, 18 m, 27 m, 36 m, 45 m, and 54 m, respectively.
Indicator D series: setting of the interface density on near-hill side variationIndicator E series: setting of the angle between the direction of important streets and prevailing winds variation
Sustainability 16 02203 i007Sustainability 16 02203 i008
Case D-1~D-6: the building depth near the hill is reduced and increased by 1 m, 2 m, and 3 m, respectively.Case E-1~E-6: the angle between the important street direction and prevailing winds is 0°, 15°, 30°, 90°, 105°, the 120°, respectively.
Table 3. Empirical constant of model.
Constant C μ C 1 C 2 σ T σ k σ ε
Value0.091.441.920.9–1.01.01.3
Table 4. Selected results of evaluation indicators of wind–thermal environment.
CategoriesIndicatorsSpecific Illustration
Wind environment
entry 2
Average speedThe accuracy of the description of real-time wind speed is controlled according to the time interval. The larger the time interval, the rougher the description.
Average speed ratioR = Vr/V0 (Vr represents the average wind speed at the testing point, and V0 represents the average wind speed at 10 m height of the local standard landform.)
Inhomogeneity factor of wind speed u i = u i u N ( i = 1,2 , 3 , , n )
σ = i = 1 n ( u i u N ) 2 n 1
Inhomogeneity factor of wind speed (horizontal) K u = σ u u N
Proportion of breeze areaGenerally, the wind speed is 0~0.2 m/s, and the average wind speed at a height of 10 m from the ground is less than 0.2 m/s, that is, zero-level wind.
Thermal environmentPMVIn a steady-state thermal environment, the greater the thermal load, the farther away from the thermal comfort state.
PMV = [ 0.303 exp 0.036 M + 0.0275 ] T L
Table 5. Performance of random forest.
Performance MetricAccuracyKappaAUC
Training set0.7600.2520.9976
Testing set0.7530.2210.9875
Table 6. Differential scoring reference to part of the wind–thermal environment.
Variation100–150%150–200%200–250%250–300%300–350%350–400%400–450%450–500%500–550%
Categories
Inhomogeneity factor of wind speed111213141516171819
Variation100–120%120–140%140–160%160–180%180–200%200–220%220–240%240–260%260–280%
Categories
Proportion of breeze area111213141516171819
Variation10–20%20–30%30–40%40–50%50–60%60–70%70–80%80–90%90–100%
Categories
PMV111213141516171819
Disclaimer/Publisher’s Note: The statements, opinions and data contained in all publications are solely those of the individual author(s) and contributor(s) and not of MDPI and/or the editor(s). MDPI and/or the editor(s) disclaim responsibility for any injury to people or property resulting from any ideas, methods, instructions or products referred to in the content.

