Article

G20 Tourism Carbon Footprint and COVID-19 Impact

1
Graduate School of Environmental and Information Studies, Tokyo City University, Yokohama 224-0015, Japan
2
Institute of Environment and Resources Circulation, Sustainable Energy & Environmental Society Open Innovation Research Organization, Waseda University, Tokyo 162-0041, Japan
3
Department of Resources and Environment Engineering, School of Creative Science and Engineering, Waseda University, Okubo Shinjuku-Ku, Tokyo 169-8555, Japan
*
Author to whom correspondence should be addressed.
Sustainability 2024, 16(5), 2222; https://doi.org/10.3390/su16052222
Submission received: 31 January 2024 / Revised: 27 February 2024 / Accepted: 1 March 2024 / Published: 6 March 2024
(This article belongs to the Special Issue Impacts of COVID-19 on Tourism)

Abstract

:
The Glasgow Declaration called for scientifically based measurements of CO2 emissions in the tourism industry to monitor progress toward the achievement of the goals of the Paris Agreement. Despite the economic and employment downturn caused by COVID-19, there are limited cases of environmental assessments related to tourism. In this study, we estimated the CFP of the tourism industry in the G20 countries before and after COVID-19. By combining the MRIO and Tourism Satellite Accounts, we clarified the different impacts on the markets for domestic tourism and inbound tourism, aiming to provide a quantitative basis for setting scientifically grounded goals towards the transition to sustainable tourism. The GHG emissions from tourism mainly stem from transportation, but souvenirs, accommodations, and food and beverages also result in significant differences among countries. The pandemic has greatly impacted the tourism industry. In 2020, the GHG emissions from both domestic and inbound tourism significantly decreased due to the decrease in the number of tourists. In some countries, measures against COVID-19 influenced these figures, and although signs of recovery were observed in 2021, the degree of reduction varied by country. These emission reductions should be the goals pursued by the tourism industry in the post-COVID-19 era, and efforts should be made to achieve sustainable tourism.

1. Introduction

In 2015, at the 21st Conference of the Parties (COP21) to the United Nations Framework Convention on Climate Change, the Paris Agreement was agreed upon by 196 contracting countries [1]. This agreement set a goal to “keep the global average temperature well below 2 °C above pre-industrial levels and to pursue efforts to limit the temperature increase to 1.5 °C”. However, according to the Emission Gap Report 2023 [2] published by the United Nations Environment Programme (UNEP), the policies aimed at achieving the Nationally Determined Contribution (NDC) targets of the G20 member countries are insufficient. To reach the targets by 2030, a reduction of 28% is necessary, and for the 1.5 °C goal, a 42% reduction is required. The global average temperature is projected to rise by 2.5–2.9 °C by around 2100, and a significant deviation from the 1.5 °C target has been reported.
It has been reported that GHG emissions from the global tourism industry account for about 8% of total emissions [3]. This includes emissions related to services provided in connection with tourism activities, accommodations, and methods of transportation such as airplanes and cars. Transportation, in particular, is a major source of GHG emissions in the tourism industry, with air travel accounting for a significant proportion [4]. Under the current business-as-usual scenario, CO2 emissions from tourism-related transportation are projected to increase by 25% from the 2016 levels by 2030 [5]. Moreover, emissions from transportation in international tourism are expected to increase by 45%, with those from domestic tourism projected to increase by 21%.
While the tourism industry is vital for economic growth and development, it is also faced with the need to address its environmental impacts and climate change [6]. At COP26, the “Glasgow Declaration” for climate action in the tourism sector was announced in Glasgow, Scotland, UK. This declaration set a goal to halve CO2 emissions from the tourism industry by 2030 and achieve net-zero emissions by 2050 [7]. Signatories were required to develop a plan based on the commitments of the declaration within 12 months and implement specific measures to combat climate change. In particular, under the “Measure” section, the United Nations World Tourism Organization (UNWTO) has emphasized that for the tourism industry to contribute to the implementation of the Nationally Determined Contributions (NDCs) of the Paris Agreement, it is necessary to enhance the measurement and disclosure of GHG emissions from tourism and introduce goals based on scientific evidence [8]. At COP28 in December 2023, it was reported that 70% of the action plan submitters designed methods for measuring GHG emissions. However, the need for a consensus on the calculation methods and the scope of the investigation was highlighted [9]. According to the report, the scopes of the calculation varied from part to the entirety of tourism operations, but it was reported that emissions from Scope 3 activities, such as transportation, accommodations, and food services, accounted for over 75% of the total emissions [10].
Based on ISO 14040 [11] and ISO 14044 [12], LCA is a methodology for analyzing and improving the environmental impact of products and services and is applied within the tourism industry, including lodging and transportation sectors. However, a specialized assessment method tailored for the entire tourism industry is still under development, and evaluations have not been standardized internationally. The development of standardized measurement techniques in the tourism industry is crucial for contributing to climate change mitigation and setting science-based goals.
The UNWTO defines sustainable tourism as “tourism that takes full account of its current and future economic, social, and environmental impacts, addressing the needs of visitors, the industry, the environment, and host communities” [13]. This “sustainable” approach aims to balance the three aspects of economic development, social development, and environmental protection. It seeks to maintain economic activity while pursuing long-term growth, a principle that is also applied in the tourism sector [14]. The UNWTO has indicated the role the tourism industry should play in achieving the Sustainable Development Goals (SDGs) [15]. Kitamura et al. (2021) [16] identified items that are specifically oriented toward the tourism industry and organized the goals and targets of the SDGs that the tourism industry should use as guidelines. Goals 7, 9, 12, and 13, in particular, are strongly related to climate change, demonstrating the need to calculate GHG emissions through CFP or Scope 3 from a lifecycle perspective. Bernardo (2023) [17] investigated research trends focusing on souvenirs in the tourism industry. The pursuit of ecological and sustainability values highlights the importance of understanding the attributes of souvenirs, calling for corporate efforts. Future research is expected to focus on low-carbon-emission products and services from the perspective of their environmental impact.
Tourism activities within a country are primarily supported by inbound tourism and domestic tourism, with each playing a unique role. Inbound tourism, involving foreign travelers visiting the country, brings significant economic benefits to the host nation [18]. The expenditure of foreign tourists on accommodations, transportation, food and beverages, and activities contributes to the local economy, creating employment and business opportunities and stimulating the growth of local industries. Domestic tourism refers to the travel within the country by residents, driven by vacation periods or seasonal events, contributing to the national tourism industry and economy [19]. These forms of tourism are vital industries that generate economic benefits through cultural exchange, both domestically and internationally. Understanding the different market impacts and the preferences and demands of the different types of travelers is crucial for each travel form.
According to the UNWTO, the tourism sector is one of the most affected by the COVID-19 pandemic [20]. The impact of COVID-19 on international tourist numbers was significant, with a 72% decrease in 2020, 69% in 2021, and 37% in 2022 compared to 2019, indicating a severe global impact [21]. The total loss in international tourism revenue from 2020 to 2022 is estimated at USD 2.6 trillion, largely due to the global lockdowns caused by the pandemic [22]. Furthermore, there are reports that out of the 144 million workers in the tourism sector worldwide, over 100 million were pushed to the brink of employment crisis. Thus, the pandemic has had substantial economic and employment impacts on the sector [23]. Lang et al. (2023) [24] focused on the impact of COVID-19 on the world’s ports and their corresponding resilience and recovery. The results revealed that the impact of COVID-19 was temporary, and port resilience significantly improved towards the end of 2021, with most ports recovering from the effects of the pandemic and showing positive trends in 2022. It was also demonstrated that the spread of COVID-19 significantly influenced the instability of the Baltic Dry Index (BDI) [25].
Life-Cycle Assessment (LCA) is a method that comprehensively evaluates the environmental impact of products and services. In the tourism industry, which involves various sectors, it is considered a method capable of identifying the industry’s potential environmental impacts. According to Filimonau (2016) [26], current research trends have particularly examined the impact of tourism on climate change, utilizing two methods: Input–Output LCA and Process-Based LCA. Assessments using Input–Output LCA have been employed to evaluate the entire industry, such as regional tourism or national tourism industries. On the other hand, Process-Based LCA has been used to evaluate specific services, such as vacation travel or tourist accommodations (see Appendix A, Table A1).
Lenzen et al. (2018) [3] used a Multi-Regional Input–Output (MRIO) model to estimate the carbon footprint (CFP) of the global tourism industry, highlighting that the GHG emissions related to tourism have not been sufficiently quantified. They reported that the global CFP associated with tourism is increasing by 4% annually, rising from 3.9 GtCO2e to 4.5 GtCO2e between 2009 and 2013, accounting for about 8% of the world’s GHG emissions. Transportation, shopping, and dining were identified as the main contributors. This methodology has been applied in case studies in various countries, including Australia [27], China [28,29], Iceland [30], Japan [31], New Zealand [32,33], Spain [34], the United Kingdom [35], and the United States [36]. Recent studies have also included evaluations considering the impact of COVID-19, with assessments conducted in countries like Japan [37] and Spain [38]. Input–Output LCA is mainly used for national-scale evaluations, but these typically focus on a single country or the entire world. Comparative and analytical studies on the differences in the tourism industry between countries are limited.
In this study, we targeted the G20 and applied a lifecycle approach using Tourism Satellite Accounts and the Multi-Regional Input–Output (MRIO) model to estimate the Carbon Footprint (CFP) of the tourism industry in each country before and after the onset of the COVID-19 pandemic. This research aims to deepen the quantitative understanding of the impact of the tourism industry on climate change and propose concrete measures for promoting sustainable tourism. In particular, it focuses on the environmental issues experienced during the recovery from the COVID-19 pandemic as well as their impact, aiming to provide new to ensure a sustainable future for the tourism industry. This will offer valuable information to policymakers and industry stakeholders to reduce the environmental impact of the tourism sector and promote long-term growth.

2. Materials and Methods

The tourism industry is predominantly service-based, making it challenging to assess using Process-based LCA. Therefore, Input–Output LCA is an effective method for evaluating environmental impacts. This method allows for a comprehensive assessment of the economic impacts, including service provision and indirect effects, enabling a holistic understanding of the sustainability of the tourism industry.

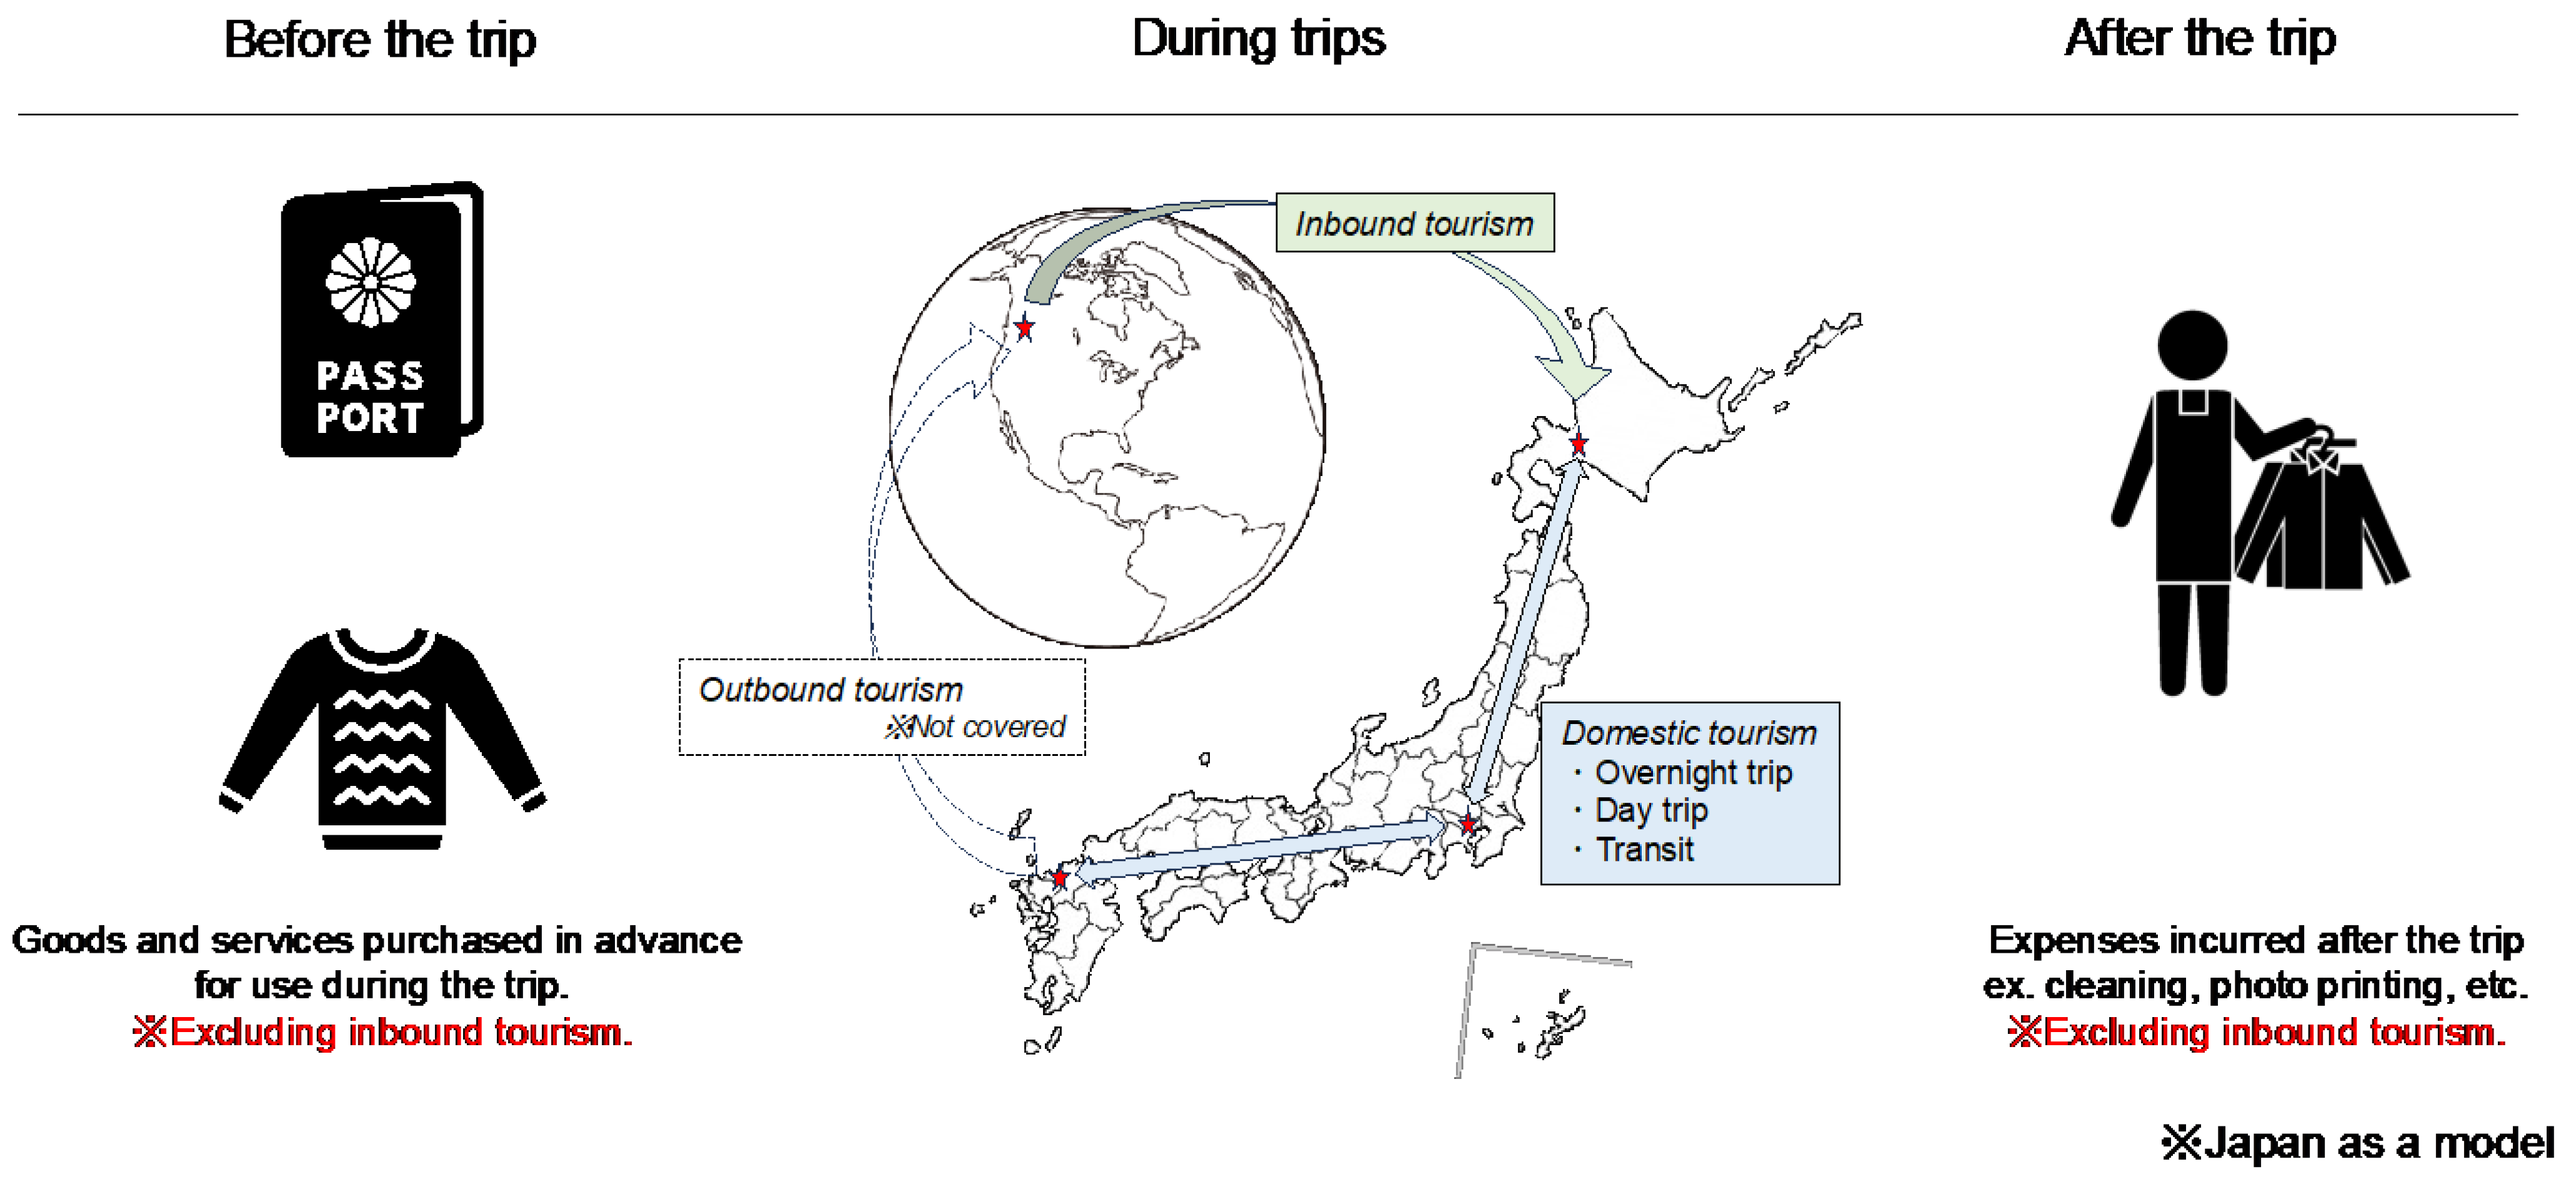
2.1. System Boundaries

Figure 1 shows the system boundaries in this study. The assessment scope follows the traditional approach adopted in tourism evaluation, encompassing expenditures occurring before and after tourism activities. Pre-tourism expenditures include goods and services purchased in advance for use during travel. For example, this scope includes costs such as passport issuance and procurement of clothing for use during the trip. Administrative work in government offices for passport acquisition, postal services, photography, etc., all involve energy consumption and GHG emissions. The procurement of clothing for use during travel also leads to GHG emissions throughout the production, transportation, and sales processes. To evaluate the environmental impact of the tourism industry as a whole, it is necessary to comprehensively consider the emissions that result from these activities. This allows for the provision of more comprehensive and accurate data in the formulation of sustainable tourism policies and the setting of country-specific contribution targets (NDCs) under the Paris Agreement. However, inbound tourism is not considered. This study focuses on tourism activities within a country, targeting consumption within the country. Similarly, post-travel expenditures, such as cleaning and photo printing, are included, but as the scope is within a country, inbound tourism is not considered.

2.2. Object of Evaluation

In this study, we calculated the CFP of the tourism industry for the G20 countries. We targeted 22 countries, as shown in Table 1, focusing on the years 2019 to 2021. The TSA shown in Table 1 represents the Tourism Satellite Account, and OECD refers to the data from the “OECD Tourism Trends and Policies [39]” published by the Organization for Economic Co-operation and Development (OECD). It is important to note that the years of creation for each country’s TSA and OECD data vary, and the data publication typically lags by one to two years from the current year. The data used prioritized TSAs produced by each country, and where detailed data were unavailable, OECD data were used as the activity measure. It is crucial to note that the published years differ for each country. In this study, a comparison was made between two travel forms: inbound tourism and domestic tourism.
The scope of calculation in this study is based on the coverage of the assessment data by Kitamura et al. (2020) [31], encompassing six components: transport; souvenirs; accommodation; food and beverage; activities; and travel agencies, tour operators, and guides (see Table 2). The calculation items are based on the ISIC (International Standard Industrial Classification of All Economic Activities, Rev. 4 [40]), and the visualization of the current item status reflects the differences in data usage and TSA systems across countries. There is variation in the level of detail for these items by country, with some countries presenting them as aggregate values. Appendix A, Table A2 details information for each country. This research focuses on countries for which detailed data on these specific items are accessible.

2.3. Input–Output Analysis

In this study, we utilized the MRIO Eora model. This methodology is based on Leontief (1970) [41] and is widely used in the field of Life-Cycle Assessment (LCA) research. The formula used is as follows:
Environmental   loads = d I A 1 f k
where d is the direct environmental impact and (I − A)−1 is the Leontief inverse matrix.

2.4. Method for Calculation of CFP

In this study, the CFP was calculated using input–output analysis. The formula for this calculation is presented below.
CFP country, year = dc,y (I − Ay)−1 fc,y + DEc,y,i (i = 1, …, n)
DEc,y = Fuel Purchases for Tourism Purposes (USD) ÷ USD/L (Liter per Price) × 35 (The calorific value of 1 L gasoline is 35 MJ) × Carbon Intensity
In this study, we adopted the calculation model of Kitamura et al. (2020) [37]. Here, dc,y represents the direct GHG emissions related to each sector in the MRIO Eora model for each target country and year, and A denotes the input coefficient matrix. I is the identity matrix, (I − A)−1 is the Leontief inverse matrix, and fc,y is the tourism consumption amount for each country in the target year, which was obtained from the Tourism Satellite Account (TSA) or OECD data [39]. Moreover, DEc,y,i in Equation (2) indicates the direct emissions from fuel combustion. For calculating direct emissions, the IEA End-Use Prices Data Explorer [42] was used to convert gasoline costs into liters, and IDEAv3.3 was used for the Carbon Intensity. These values represent the calorific content during fuel combustion. This equation extends the entire life cycle, calculating the environmental impacts from cradle to grave. Note that while all MRIO data are denominated in USD, the TSAs used for each country in this study are denominated in the local currency. To integrate this with the MRIO, the average annual exchange rates published by the World Bank [43] were used for USD conversion.
The TSA is a statistical data tool for estimating the direct economic and employment effects in the tourism industry that was developed by UNWTO, OECD, Eurostat, and the United Nations Statistics Division. The UNWTO has provided the international standard “TSA Recommended Methodological Framework 2008” (TSA: RMF08) [44]. The definition of a tourist in the TSA is “A visitor is a traveler taking a trip to a main destination outside his/her usual environment for less than a year and for any main purpose (business, leisure or other personal purpose) other than to be employed by a resident entity in the country or place visited (IRTS 2008) [45]”. This includes data for medium- and long-term trips, including business travel, which are reported to be important data for future measurements of emissions in the tourism industry [46]. The year of TSA production varies by country, and the data publication typically lags by one to two years from the current year.
In this study, we conducted separate analyses for domestic tourism and inbound tourism. The definitions of each are as follows. Domestic tourism refers to tourism activities occurring within a country. It consists of activities of travelers residing in the target country, either as part of domestic travel or as part of travel abroad. Inbound tourism refers to tourism activities conducted by non-resident travelers in a non-resident country. This includes foreign tourists’ actions using tourist sites, accommodations, and local services at the destination. Travel from the place of origin to the destination is not included, and the focus is on consumption at the destination.

3. Results

In this session, the results are divided into two sections: before COVID-19 and after COVID-19. An analysis was also conducted for countries with detailed TSA.

3.1. Pre-COVID-19

This section focuses on the relationship between the number of tourists, Gross Domestic Product (GDP), and GHG emissions for the year 2019. The analysis is conducted across three different segments: the total of domestic tourism and inbound tourism, domestic tourism only, and inbound tourism only. By setting GDP on the X-axis and the number of tourists on the Y-axis and representing GHG emissions (in Mt-CO2e) according to bubble size, we aim to visually analyze and deepen the understanding of the correlation between economic growth and tourism activities and their impact on the environment.

3.1.1. All Tourism (Domestic + Inbound)

Figure 2a shows the relationship between the GDP, the number of tourists, and GHG emissions in both domestic tourism and inbound tourism combined. There is a tendency for countries with higher tourist numbers and GDP values to have higher GHG emissions from tourism. Notably, the United States had the highest GHG emissions, approximately 874 Mt-CO2e, accounting for about 53% of the total. While the GHG emissions were also substantial in EU countries, some, like the United Kingdom, had lower emissions relative to their GDP and tourist numbers. On the other hand, the GHG emissions from tourism in developing countries were significantly lower, about three orders of magnitude smaller than in the United States. South Africa, despite having a lower GDP than the G7 countries, showed a tendency for higher GHG emissions.

3.1.2. Domestic Tourism

Figure 2b shows the relationship between GDP, the number of tourists, and GHG emissions in domestic tourism. It was found that the GHG emissions from domestic tourism account for about 80% of the total, significantly influencing the overall trend. The United States recorded the highest GHG emissions in this category, approximately 726 Mt-CO2e, accounting for about 63% of the total. This is followed by Germany with approximately 98 Mt-CO2e and Japan with 87 Mt-CO2e, with the G7 countries accounting for a major portion of the emissions. The total emissions from the G7 countries comprised about 80% of the combined emissions from domestic and inbound tourism. On the other hand, the country with the lowest emissions was Croatia, with about 0.04 Mt-CO2e, which is significantly lower than the United States by four orders of magnitude. The United States differs greatly from Croatia, with approximately 82 times the GDP and 56 times the number of domestic tourists.
Countries like South Africa and Indonesia, despite having fewer tourists than the G7, tend to have higher GHG emissions. In terms of emissions per domestic tourist, the United States had the highest emissions with about 0.3 t-CO2e/tourist, followed by South Africa with 0.2 t-CO2e/tourist. On the other hand, the United Kingdom, despite having a high number of tourists, tended to have lower GHG emissions. The emission per domestic tourist was about 0.02 t-CO2e/tourist, which is on par with countries like Lithuania and Hungary.

3.1.3. Inbound Tourism

Figure 2c shows the relationship between GDP, the number of tourists, and GHG emissions in inbound tourism. The United States again had the highest GHG emissions in this category, approximately 147 Mt-CO2e, accounting for about 47% of the total. This is similar to the trend observed in domestic tourism, indicating that the United States is a global leader in tourism-related emissions. In the EU, countries like Spain (about 22 Mt-CO2e) and France (about 19 Mt-CO2e) had notable emissions, contributing significantly to the GHG emissions from inbound tourism. In particular, in Spain, Portugal, Hungary, and Croatia, over 70% of their GHG emissions are attributed to inbound tourism, indicating the substantial impact of foreign tourists on their emissions.
Inbound tourists are fewer in number and show a different trend compared to domestic tourists. In particular, South Africa and Indonesia, despite having fewer tourists than the G7 countries, tended to have very high GHG emissions (approximately 18 Mt-CO2e), ranking fourth and fifth in emissions from inbound tourism, respectively. This is supported by the very high emissions per tourist, which were about 1.2 t-CO2e/tourist in South Africa and about 1.1 t-CO2e/tourist in Indonesia, suggesting that tourism in these countries has a particularly large environmental impact. On the other hand, Spain and France were among the countries with the highest number of inbound tourists, and it is believed that this number is impacting their GHG emissions.

3.1.4. Domestic Tourism

Figure 3a shows the proportion of emissions by life cycle from domestic tourism for each country. In the breakdown of the lifecycle-specific CFP in 21 countries, transportation accounted for about 60% (including 36.7% from direct emissions due to gasoline combustion, 10.8% from aircrafts, 3.6% from gasoline, etc.), while souvenirs, accommodations, and food and beverages each contributed about 10%. The contributions from activities and travel agencies, tour operators, and guides were small. Transportation, especially direct emissions from gasoline combustion in passenger cars, was a major contributor, accounting for more than half of the emissions.
Countries where transportation accounts for more than half of the emissions included Canada, the United States, Finland, France, and Germany. In some EU countries, the impact of transportation was lower, and souvenirs, accommodations, and food and beverages had larger contributions. The highest contributions from souvenirs were seen in Croatia, the Czech Republic, Hungary, Lithuania, and the United Kingdom, i.e., mostly in the EU. For accommodations, Italy and Sweden stood out, while for food and beverages, it was Indonesia, South Korea, Romania, and Spain.
Indonesia and South Africa tended to have fewer tourists but higher GHG emissions. The main source of emissions in Indonesia was from food and beverages, accounting for about 42%. In Indonesia, land expansion for food production and high food waste and loss have been reported [49]. Within this context, the largest source of GHG emissions in the agriculture sector is rice cultivation, accounting for 39%. In South Africa, the impact of transportation was the highest. Land transportation contributed significantly to this. The transportation sector is the fastest-growing source of GHG emissions in South Africa, accounting for about 10.8% of total emissions. Within this sector, road transportation is responsible for 91.2% [50]. There is a call for a transition to environmentally friendly transportation systems, with initiatives like promoting the use of electric vehicles, strengthening public transport, and improving energy efficiency and emission management. These efforts aim to contribute to climate change mitigation, raise awareness for sustainable mobility, and transition to a more climate-resilient transportation system.
The United Kingdom has the characteristic of having lower GHG emissions relative to its number of tourists. Transportation in the U.K. contributed approximately 40% less than the average of all countries. The GHG emissions associated with domestic travel in the U.K. have been decreasing since 1990, with a reported reduction of about 5% in 2019 compared to 1990. The decrease in emissions can be attributed to factors such as improved fuel efficiency, changes in transport policies, and a shift to low-emission vehicles. In 2018, there was a 20% increase compared to the previous year in the registration of ultra-low emission vehicles (ULEVs), totaling 64,000 new registrations [51]. Additionally, the reduction in diesel fuel taxes encouraged a transition to vehicles with lower CO2 emissions. These factors, combined, have contributed to the reduction in GHG emissions associated with domestic travel in the U.K., marking a progression towards sustainable practices across the entire transportation sector.

3.1.5. Inbound Tourism

Figure 3b shows the proportion of emissions by life cycle from inbound tourism for each country. In the breakdown of the lifecycle-specific CFP in 21 countries, transportation accounted for about 50% (including 31% from direct emissions due to gasoline combustion, 9.6% from aircrafts, 2.8% from gasoline, etc.), souvenirs and accommodations accounted for about 17% each, and food and beverages about 11%, with smaller contributions from activities, travel agencies, tour operators, and guides. Although the emissions from transportation in inbound tourism were high, they were about 10% lower compared to domestic tourism, while the impacts from accommodations and souvenirs were, respectively, about 7% and 8% higher.
In particular, within the G7, when considering Japan and the United Kingdom as examples, the major emission contributors in the life cycle of inbound tourism were accommodations and souvenirs (30% and 27% for Japan and 22% and 40% for the United Kingdom, respectively). The longer average length of stay, with Japan at 8.8 nights [52] and the U.K. at 7.1 nights [53], contributed to the higher emissions from accommodations.
Countries where contributions from souvenirs were the highest included South Korea, South Africa, Mexico, Hungary, Italy, Lithuania, Sweden, and the United Kingdom. For accommodations, the leading countries were Japan, Croatia, and Romania, while Indonesia was noted for food and beverages and Australia for activities.
Spain and France had a high number of inbound tourists, and consequently, they exhibited high GHG emissions. In Spain, over 50% of the impact was due to souvenirs and accommodations. In France, the transportation sector had a high contribution, about 10% more than the average [54]. The majority of GHG emissions from transportation in France came from road transport. Within the transportation sector, road transport accounted for 93.8% and was responsible for most of the sector’s increase in emissions. In particular, emissions from heavy goods vehicles, utility vehicles, and personal vehicles are increasing. Although there are goals and incentives to support the transition to electric and plug-in hybrid vehicles, a significant increase is needed to achieve the widespread adoption of electric vehicles and the establishment of charging infrastructure targets.
Lenzen et al. (2018) [3] calculated emissions for inbound, domestic, and outbound tourism. They reported the composition of GHG emissions as transportation 49.1%, souvenirs 12%, accommodations 6.4%, food and beverages 5.1%, and services 7.9%. “Services” in their study correspond to “Activities” in this study. Kitamura et al. (2020) [31] included the same three travel forms in their study of Japan’s tourism industry, reporting emissions as transportation 56.3%, souvenirs 23.2%, accommodations 9.8%, food and beverages 7.5%, and activities 3%. The impact of transportation was reported to be significant even compared to the global average. When focusing solely on Japan, the proportion of transportation and souvenirs was lower, indicating differences. The consumption of goods and the provision of experiential services vary by country, leading to differences at the national level.
The total emissions from tourism were primarily due to domestic tourism, and the number of domestic tourists and GHG emissions were higher than those of inbound tourism. However, for inbound tourism, the GHG emissions per tourist tended to be higher than for domestic tourists. In particular, in the United States and Indonesia, the emissions per inbound tourist were about 10 times higher than those per domestic tourist. This trend indicates that while domestic tourism has a significant impact on GHG emissions, tourists from abroad tend to have relatively higher emissions. It has become evident that in both domestic and inbound tourism, the majority of GHG emissions come from transportation, especially direct emissions from gasoline combustion. Additionally, in some countries, souvenirs, accommodations, and food and beverages significantly contribute to GHG emissions.

3.2. After COVID-19

In this section, we focus on the relationship between the number of tourists, Gross Domestic Product (GDP), and GHG emissions from the years 2019 to 2021 during the COVID-19 pandemic. The changes in domestic tourism and inbound tourism caused by the effects of the pandemic are visualized. GDP is set on the X-axis, the number of tourists is set on the Y-axis, and GHG emissions (in Mt-CO2e) are represented according to bubble size. This analysis aims to quantitatively assess the economic and environmental impacts on the tourism industry due to COVID-19, as well as to suggest directions for sustainable tourism development after the pandemic.

3.2.1. Domestic Tourism

Figure 4a shows the relationship between GDP, the number of tourists, and GHG emissions in domestic tourism for the years 2019 to 2021.
In 2020, compared to 2019, the GHG emissions from domestic tourism decreased by an average of about 38%. The United Kingdom saw a reduction of about 60%, and Indonesia about 58%, making them the countries with the most significant decreases. In contrast, Australia had a reduction of 11.7% and Finland 13.5%, comparatively lower decreases. In the EU countries, the change in emissions varied by country, with significant decreases in some countries while others remained relatively stable.
The number of tourists decreased by about 18% on average in 2020 compared to 2019. In the U.K., domestic travel restrictions implemented on 21 March 2020 contributed to this decrease. Indonesia imposed similar restrictions around the same time. Finland, after temporary restrictions, saw the domestic tourism demand approach 2019 levels during the summer but declined again after September due to stricter measures [55,56]. Despite Australia imposing domestic travel restrictions at the end of March, the decrease in domestic tourists was about 35%, which is relatively low. This is attributed to state-level measures, such as in Western Australia, where there were fewer travel restrictions and state borders were closed, leading to Western Australians holidaying within their state, resulting in minimal disruption to the tourism industry [57]. Additionally, in 2020, there was a significant increase in caravan and camper registrations in states like New South Wales, Australia, indicating a rise in demand for new forms of travel during restrictions [58].
In 2021, the GHG emissions from tourism were about 15% lower than in 2019, with many countries showing a recovery trend. Australia and Spain saw only about a 2% decrease, returning to pre-COVID-19 levels, while Japan continued to decrease by about 50% in 2020 and about 55% in 2021. Lithuania saw an increase beyond the 2019 emissions levels.
The average decrease in tourist numbers in 2021 was 12% compared to 2019. In Japan, domestic travel restrictions were implemented due to emergency declarations and focused measures over these two years. Sweden reported a near doubling of tourist numbers in 2020 and 2021 compared to 2019 and was the only country not to see a decrease during the pandemic. Sweden did not implement travel restrictions from 2020 to 2021, keeping policies at a recommended level [59]. Compared to many other countries, Sweden’s response to COVID-19 was not as stringent, avoiding lockdowns, keeping bars and restaurants open, encouraging remote work, and minimizing travel [60].
Appendix A, Table A4 compiles the annual data based on the average monthly data from the Oxford COVID-19 Government Response Tracker (OxCGRT) [59] on restrictions on internal movement. The level of measures for internal movement varied by country, but starting from April 2020, most countries implemented recommendations or measures for travel restrictions across regions/cities. In particular, in Australia, the U.S.A., and Mexico, travel restrictions were in place starting in April and lasting throughout the year. On the other hand, some EU countries, except the U.K. and Spain, had less stringent measures, with recommendations or no measures for travel restrictions.

3.2.2. Inbound Tourism

Figure 4b shows the relationship between GDP, the number of tourists, and GHG emissions in inbound tourism. In 2020, compared to 2019, the GHG emissions from inbound tourism decreased by about 72%, a more significant reduction than in domestic tourism. The countries with the largest decrease in GHG emissions were Australia (about 97%) and the United States (about 84%), while France had the lowest reduction rate at about 43%. Some EU countries like Lithuania and Sweden saw a moderate decrease of about 54%.
The average reduction rate in the number of tourists was about 69% in 2020 compared to 2019. In Australia, the early implementation of border closure measures starting in February 2020 was a factor. The Australian government imposed extensive international travel restrictions from mid-March 2020, including cruise ship docking restrictions, entry restrictions, and mandatory quarantines. These restrictions impacted individuals and businesses across various sectors, including international tourism, travel, aviation, and education [61]. The United States did not impose a full lockdown in 2020 but set entry restrictions for tourists from specific European countries, China, and Iran. Starting in March 2020, 27 states and Washington D.C. enacted travel restrictions during the pandemic [62].
In 2021, the GHG emissions from inbound tourism were about 59% lower than in 2019. The average reduction in tourist numbers was 68% in 2020 compared to 2019. However, Japan saw further decreases, with about 77% in 2020 and about 90% in 2021. Japan implemented measures such as banning entry from certain regions from 1 February 2020, and imposed stricter measures from 28 December 2020, to 31 December 2021, banning entry from all regions.
The average reduction rate in tourist numbers was 68% in both 2020 and 2021 compared to 2019. Japan and Australia continued to see a further decline in tourist numbers. Compared to 2019, numbers for Japan decreased by 87% in 2020 and 99% in 2021, while those for Australia decreased by 81% in 2020 and 97% in 2021. Both Japan and Australia continued border closure measures for about two years from 20 March 2020, to 31 October 2021. This strict response was unique to Japan and Australia, while other countries imposed partial entry bans or relaxed regulations.
Appendix A, Table A5 compiles the annual data based on the average monthly data from the Oxford COVID-19 Government Response Tracker (OxCGRT) [59] on international travel controls. Unlike domestic movement restrictions, border control measures were implemented early in various countries. In particular, strict measures were taken in Australia, with most countries imposing entry bans from certain regions beginning in April 2020. In 2021, Japan implemented stricter border control measures than the previous year, while Australia continued its policies.

3.2.3. Domestic Tourism

Figure 5a shows the changes in the CFP for each country from domestic tourism for 2020 and 2021, using 2019 as a baseline. In 2020, a decrease in GHG emissions from tourism was observed around the world. On average, GHG emissions decreased by about 38%, with the transport sector showing a 14% reduction, while other categories had a decrease of only a few percentage points. The highest reductions in the transport sector were in Japan, the United States, Mexico, the Czech Republic, France, and Lithuania. Sweden saw the greatest reduction in accommodations, Spain saw the greatest reduction in food and beverages, and Australia saw the greatest reduction in activities. Australia was the only country where souvenirs, accommodations, and food and beverages increased by about 0.4%.
In 2021, most countries, except Japan, showed recovery trends in all categories. The United States, the Czech Republic, Lithuania, and Spain had increased GHG emissions in some categories. The United States saw about a 2% recovery in souvenirs and food and beverages, while accommodations in the Czech Republic increased by about 2% and in Spain by 7%. Lithuania was the only country to exceed its 2019 GHG emissions by about 10%, particularly with about a 23% recovery in souvenirs, accommodations, and food and beverages. In 2021, there were 3.1 million domestic tourist stays recorded, a 26.7% increase compared to 2020, exceeding the pre-pandemic levels by 9.3% [39].

3.2.4. Inbound Tourism

Figure 5b shows the changes in the carbon footprint (CFP) for each country from inbound tourism for 2020 and 2021, using 2019 as a baseline. In 2020, a decrease in GHG emissions from tourism was confirmed in all countries. The average reduction was about 71%, with transport at about 17%, souvenirs at around 18%, accommodations at approximately 16%, food and beverages at around 12%, and a few percent decrease in other categories. This affected the various categories more than domestic tourism. The highest reductions in transport were in the United States, the Czech Republic, and France. The largest decreases were in souvenirs for Mexico and Sweden, accommodations for Japan and Spain, and activities for Australia. Australia had the highest decrease at about 97%, with activities contributing around 26% and souvenirs about 25% to the overall reduction.
In 2021, there was a recovery in all categories in all countries except Japan and South Africa, which continued to show a decrease in all categories. Mexico showed the strongest recovery trend, particularly in accommodations and souvenirs. Mexico’s overnight visitors in 2021 numbered about 1.3 times those in 2020. The top market, the United States (accounting for 32% of the market), almost returned to pre-COVID-19 levels but was still 29.2% below 2019’s tourist numbers [39]. Additionally, Lithuania was the only country to see an approximate 2% increase in GHG emissions from food and beverages.

3.3. Differences between Developed and Developing Countries

In this section, a detailed analysis covering the periods before and after the COVID-19 pandemic was conducted on two high-income countries (Japan and the United States) and two middle-income countries (Mexico and South Africa) using detailed Tourism Satellite Accounts (TSA). The classification of each country’s level of income was based on data from the World Bank [63].

3.3.1. Japan

Figure 6 shows the GHG emissions and contribution rates of products and services of domestic tourism and inbound tourism in Japan for the year 2019. The GHG emission from domestic tourism was 88 Mt-CO2e. The contributions of each category were as follows: transportation, 47.5%; souvenirs, 15.6%; accommodations, 14%; food and beverages, 11.2%; activities, 10.7%; and travel agencies, 1.1%. The impact of transportation was the highest, particularly the direct emissions from gasoline combustion in passenger cars. The GHG emission from inbound tourism was 14 Mt-CO2e. The contributions of each category were as follows: accommodations, 29.6%; souvenirs, 26.6%; food and beverages, 25.1%; activities, 2.7%; and travel agencies, 0.4%. This is a different trend from domestic tourism, with accommodations, souvenirs, and food and beverages accounting for 80% of the total impact.
Table 3 shows the top five GHG emission contributors in domestic tourism and inbound tourism. In domestic tourism, gasoline (direct emissions), lodgings, food and beverages, “Shinkansen, Railroad, Monorail”, and air travel (domestic and local) account for 60% of the total emissions. In particular, the GHG emissions related to transportation had a significant contribution. In inbound tourism, lodgings, food and beverages, cosmetics, air travel (international), and confectionery made up 80% of the total emissions. In particular, the GHG emissions related to souvenirs had a significant contribution.
Table 4 shows the five categories with the greatest reductions in GHG emissions in domestic tourism and inbound tourism in 2020 and 2021, compared to 2019. Japan is the only country where the GHG emissions continued to decrease in 2021.
In domestic tourism in 2020, the largest decreases were in sports games (87%), passport application fees (84%), stage/music viewing (78%), travel insurance/credit card enrollment fees (76%), and buses (74%). In 2021, the highest reductions were in air travel (international) (93%), exhibition/convention participation (91%), travel agency revenue (86%), travel insurance/credit card enrollment (85%), and buses (83%). The decrease in 2020 was mainly in event-related emissions, while in 2021, it was in transportation-related emissions.
In inbound tourism for 2020, the largest decreases were in theme parks/amusement parks (87%), cosmetics, pharmaceuticals, photographic films, etc. (85%), travel agency revenue (84%), other transportation expenses (83%), and electrical products (82%). In 2021, following the previous year, there was a large reduction in the leisure/amusement and cosmetics sectors.
Table 5 shows the sustainability assessment (environmental, economic, and social evaluation) for Japan in 2020 and 2021, compared to 2019, in terms of changes in GHG emissions, tourism consumption, and employment numbers.
Japan had the smallest decrease in employment numbers. The decline was particularly noted in the lodging sector. In April 2020, an employment adjustment subsidy was introduced for the lodging industry, aiming to retain employees. However, due to the challenging work environment even before COVID-19, employee anxiety increased, leading to a rise in resignations from the latter half of 2020 to the first half of 2021 [64]. This resulted in a 9% decrease in employment in 2020 and an 18% decrease in 2021. In the transportation sector, airlines such as ANA and JAL announced the suspension of hiring new graduates in 2021. A notable decrease in employees was also observed in road passenger transportation. According to the Ministry of Land, Infrastructure, Transport, and Tourism [65], the number of private taxis decreased by about 8.5%, and both private and public charter buses decreased in number by about 10% and 20%, respectively, in 2021 compared to 2019. The entertainment industry saw a 5% increase (compared to 2019) in 2021, which was confirmed by the Ministry of Health, Labour and Welfare’s “2020 Employment Trends Survey” [66]. Although cinemas and theaters were closed, the increase in demand for online streaming and gaming led to a rise in employment in the entertainment sector. It should be noted that employment in travel agency services is included only in the souvenirs category in the results. In Japan’s Tourism Satellite Account employment data, these are categorized under “other industries”, which may include retail and agency services. According to the Japan Association of Travel Agents Tourism Statistics 2023 [67], first-class travel agents like JTB and HIS saw a gradual decrease of 1% in 2020 and 3% in 2021 compared to 2019.

3.3.2. United States

Figure 7 shows the GHG emissions and the contribution rates of products and services of domestic tourism and inbound tourism in the United States for the year 2019.
The GHG emission from domestic tourism was 726 Mt-CO2e. The contributions for each category were as follows: transportation, 75.5%; accommodations, 6.6%; food and beverages, 5.8%; activities, 5.3%; souvenirs, 4.2%; and travel agencies, 2.5%. The impact of transportation was the highest, particularly the direct emissions from gasoline combustion in passenger cars. The GHG emission from inbound tourism was 147 Mt-CO2e. The contributions for each category were as follows: transportation, 77.3%; souvenirs, 7.5%; accommodations, 6.9%; food and beverages, 5%; activities, 3.2%; and travel agencies, 0.1%. The emissions in both inbound and domestic tourism were primarily influenced by transportation, especially direct emissions from gasoline combustion in cars, aircraft, and gasoline purchases. Following transportation, the greatest impact from domestic tourism came from accommodations and food and beverages, while from inbound tourism, it was from souvenirs and accommodations, showing different trends in the categories based on the travel form.
Table 6 shows the top five GHG emission contributors from domestic and inbound tourism. In domestic tourism, the major contributors were direct emissions, domestic passenger air transportation services, traveler accommodations, food and beverage services, and gasoline. In inbound tourism, the significant contributors were direct emissions, international passenger air transportation services, shopping, traveler accommodations, and food and beverage services.
While Japan showed different trends between domestic tourism and inbound tourism, the United States featured similar emission patterns in both travel forms.
Table 7 shows the top five categories with the largest GHG emission reductions in domestic and inbound tourism in 2020 and 2021 compared to 2019.
Domestic tourism included travel by U.S. residents abroad at 78%, local bus and other transportation services at 77%, and passenger rail transportation services at 77%. In 2021, there was a recovery trend, but the decline in transportation-related services was more noticeable.
Inbound tourism decreased by 97% in all other recreation and entertainment activities, 94% in local bus and other transportation services, and 94% in domestic passenger air transportation. The recovery rate was lower than that of domestic tourism, with a noticeable decline in entertainment-related services.
Table 8 shows the sustainability assessment (environmental, economic, and social evaluation) for the United States in 2020 and 2021, compared to 2019, in terms of changes in GHG emissions, tourism consumption, and employment numbers.
In 2020, the United States, compared to other countries, saw a decrease in employment numbers corresponding to the reduction in consumption. Looking at the results for 2021, the changes in employment numbers and consumption in the United States were similar. In particular, changes in souvenirs, food and beverages, and activities were similar. The decrease in employment in activities, especially in casinos, was very significant, as reported in the following case. According to the U.S. Bureau of Labor Statistics, Nevada had the highest unemployment rate among all the states in 2020 [68]. Nevada, a popular tourist destination known for its casinos in Las Vegas, faced a forced closure of all casinos from 18 March to 4 June 2020 by the Governor’s order, resulting in the immediate dismissal of most casino hotel employees. Additionally, bars, cinemas, gyms, and restaurants were also closed, only offering takeout or delivery services, which directly contributed to the high unemployment rate.

3.3.3. Mexico

Figure 8 shows the GHG emissions and the contribution rates of products and services for domestic tourism and inbound tourism in Mexico for the year 2019.
The GHG emissions from domestic tourism were 61 Mt-CO2e. The contributions for each category were as follows: transportation, 35.7%; accommodations, 24.8%; souvenirs, 22.6%; food and beverages, 9.3%; activities, 6.2%; and travel agencies, 1.5%. Transportation, and road transportation, in particular, had the highest impact. The GHG emissions from inbound tourism were 13 Mt-CO2e. The contributions for each category were as follows: souvenirs, 32.9%; accommodations, 32.3%; transportation, 17.3%; activities, 13.2%; food and beverages, 4.1%; and travel agencies, 0.2%. The impact of GHGs resulting from souvenirs and food and beverages is significant.
It is evident that both domestic and inbound travel have a significant environmental impact resulting from the effects of accommodations and souvenirs. Notably, souvenirs, food and beverages, and handicrafts stand out as having the most significant impact. The interest in handicrafts, domestic or international, is likely due to the high appreciation for traditional Mexican crafts.
Table 9 shows the top-five GHG emission contributors in domestic tourism and inbound tourism. For domestic tourism, it is road transportation, lodging with family and friends (imputation), air transportation, lodging in traditional facilities, and restaurants, bars and nightclubs, which account for 64% of the total emissions. The GHG emissions related to transportation, in particular, represented a significant contribution. For inbound tourism, it is food and beverages, lodging in traditional facilities, lodging in villa-owned accommodations, handicrafts, and air transportation, which made up 69% of the total emissions. The GHG emissions related to accommodation and souvenirs, in particular, represented a significant contribution.
Table 10 shows the five categories with the greatest reductions in GHG emissions in domestic tourism and inbound tourism in 2020 and 2021 compared to 2019.
For domestic tourism in 2020, the largest decreases were observed in information services (82%), air transportation (67%), travel agencies and other reservations (67%), sports and recreation services (65%), and support services (64%). In 2021, the highest reductions were observed in information services (69%), books, newspapers, and magazines (65%), sports and recreation services (58%), cultural services (56%), and photographic film and equipment (51%). A notable decrease in information services for two consecutive years highlights the stagnation of tourism-related information provision services.
For inbound tourism for 2020, the largest decreases were observed in air transportation (73%), professional services (66%), transportation-related services (66%), lodging in traditional facilities (66%), and regional transportation (64%). In 2021, the largest decreases were observed in travel agencies and other reservations (49%), health services (45%), air transportation (43%), road transportation (35%), and restaurants, bars, and nightclubs (31%). In 2020, transportation-related sectors saw significant declines, while in 2021, high reduction rates were observed across various sectors.
Table 11 shows the sustainability assessments (environmental, economic, and social evaluation) for Mexico in 2020 and 2021 compared to 2019 in terms of changes in GHG emissions, tourism consumption, and employment numbers. Employment data for 2021 are not disclosed and are thus not included in the results.
In 2020, there was a significant decrease in GHG emissions and expenditure on transportation, travel agencies, tour operators, and guides. On the employment front, while there was a significant decrease in activity-related sectors, there was an increase in employees working in accommodations. This can be attributed to the Mexican Ministry of Tourism developing a sustainable tourism strategy from 2020 to 2030, which emphasized sustainable and resilient development in the tourism sector [39]. This strategy promoted the diversification of the tourism market and improvement in the quality of tourism services. As a result, employment in accommodation facilities increased, possibly due to the demand for innovative tourism products. According to the OECD, the number of domestic overnight travelers decreased by 52.7%, from a record high of 110.7 million in 2019 to 48 million in 2020, and the number of nights spent in hotels or similar establishments decreased by 52.4% to 83.1 million nights.
In 2021, a recovery trend in GHG emissions and expenditure is noted. The recovery in inbound travel is largely due to the United States, Mexico’s top market, almost returning to pre-pandemic levels. However, the decrease in travel agencies, tour operators, and guides remains significant.

3.3.4. South Africa

Figure 9 shows the GHG emissions and the contribution rates of products and services in domestic tourism and inbound tourism in South Africa for the year 2019. The GHG emissions resulting from domestic tourism were 49 Mt-CO2e. The contributions for each category were as follows: transportation, 36.6%; souvenirs, 31.6%; food and beverages, 14.4%; activities, 6.4%; accommodations, 6.3%; and travel agencies, 4.7%. The impact of transportation, particularly road and air transportation, was the highest. The GHG emissions from inbound tourism were 18 Mt-CO2e. The contributions for each category were as follows: souvenirs, 32%; transportation, 24.8%; accommodations, 14.2%; food and beverages, 11.9%; activities, 11.5%; and travel agencies, 5.5%.
GHG emissions from transportation and souvenirs were found to constitute a large proportion of those from both domestic and inbound travel, indicating that these emission sources are consistent regardless of the type of travel.
Table 12 shows the top five GHG emission contributors in domestic tourism and inbound tourism. In domestic tourism, non-specific products, road transportation, food and beverages, air transportation, and accommodation account for 75% of the total emissions. In inbound tourism, non-specific products, accommodation, road transportation, food and beverages, and food, beverages, and tobacco made up 65% of the total emissions. Both forms of travel contribute to GHG emissions across various categories.
Table 13 shows the five categories with the greatest reductions in GHG emissions in domestic tourism and inbound tourism in 2020 and 2021 compared to 2019.
For domestic tourism in 2020, the largest decreases were observed in air transportation (67%), cultural services (66%), automotive fuel (54%), food, beverages, and tobacco (50%), and textiles, clothing, footwear, and leather goods (47%). In 2021, the highest reductions were observed in non-specific products (40%), automotive fuel (37%), cultural services (25%), food, beverages, and tobacco (23%), and direct emissions (22%).
For inbound tourism in 2020, the largest decreases were observed in non-specific products (99%), air transportation (86%), textiles, clothing, footwear, and leather goods (84%), household furniture, appliances, articles, and equipment (82%), and road transportation (79%). In 2021, the largest decreases were observed in non-specific products (94%), air transportation (94%), household furniture, appliances, articles, and equipment (89%), road transportation (85%), and textiles, clothing, footwear, and leather goods (84%).
Domestic tourism is on a recovery trend, but inbound travel continues to decline, similar to Japan. For inbound travel in particular, there is an ongoing decrease in transportation and souvenir-related activities.
Table 14 shows the sustainability assessment (environmental, economic, and social evaluation) for South Africa in 2020 and 2021 compared to 2019 in terms of changes in GHG emissions, tourism consumption, and employment numbers. Employment data for 2021 are not disclosed and are thus not included in the results.
Between 2020 and 2021, GHG emissions and expenditure showed a decreasing trend, with employment continuing to decline in some sectors. In 2020, GHG emissions and expenditure related to souvenirs saw the most significant decrease, while reductions in employment were the lowest. In 2021, the rate of decrease in GHG emissions and expenditure demonstrated a recovery trend, but employment in sectors other than activities continued to decline, following the 2020 trend. South Africa is a country where both domestic and inbound tourists continue to decrease. Domestic tourism in South Africa was significantly impacted in 2021. The number of domestic tourists was 14.8 million, 47.9% below the 2019 levels, and day visitors were even more affected, with the 2021 Figure 70.9% below that for 2019, at 68.8 million. The number of foreign tourists in 2020 decreased to 2.8 million, a 72.6% reduction. The number of international arrivals further decreased to 2.3 million in 2021, which was reported to be influenced by the discovery of the COVID-19 Omicron variant and the resulting suppressed demand [39].
The changes in GHG emissions, tourism consumption, and employment for countries other than the four mentioned are shown in Appendix A, Table A12.

4. Discussion

According to Lenzen et al. (2018) [3], the majority of the tourism industry’s carbon footprint is emitted by high-income countries, accounting for about 8% of the world’s total GHG emissions as of 2013. In this study, it was noted that the GHG emissions from the tourism industry in some major countries accounted for 12.5% in 2019, an increase of approximately 4% (Table 15).
However, due to the impact of COVID-19, the proportion of GHG emissions from the tourism industry decreased to 6.2% in 2020, a reduction of about 6% compared to 2019, and fell below the average of the 2013 statistics. The decrease was also pronounced in some major countries, confirming the industry’s vulnerability to external factors.
Table 16 compares the results of this study with the existing research. Osorio et al. (2023) [38] reported that the GHG emission from internal tourism in Spain was 48 Mt-CO2e in 2019 and 18 Mt-CO2e in 2020. In contrast, this study found that the GHG emissions from Spain’s Internal tourism for the same period were 37 Mt-CO2e and 12 Mt-CO2e, respectively, indicating a decrease of 63%.
The difference in results can be attributed to Osorio et al.’s methodology, which used the MRIO’s Exiobase input–output tables to determine the calculation items and applied environmental impact coefficients. The variation in calculation methods and the data used likely influenced the outcomes. The approach by Osorio et al. might lead to differences in emissions for similar items, which could explain the discrepancy in results.
Kitamura et al. (2020) [37] estimated the losses and reductions in tourism consumption, GHG emissions, and employment numbers in Japan’s tourism sector as a measure of sustainable tourism. They predicted a worst-case scenario of a 65.1% decrease in tourism consumption, a 64.2% reduction in GHG emissions, and a 64.2% decrease in employment. The results of this study showed that Japan experienced a decrease of about 58% in tourism consumption, approximately 54% in GHG emissions, and 0.5% in employment. Although the decreases in tourism consumption and GHG emissions were not as severe as the worst-case scenario, they were still considerably high. The decrease in employment numbers was less dramatic, largely due to government policies.
As shown in previous studies and this research, the main environmental impact in the tourism industry is from transportation. The International Air Transport Association (IATA) has committed to achieving net-zero emissions by 2050 through improvements in aircraft technology, energy infrastructure, operations, finance, and policy [69]. This includes the use of Sustainable Aviation Fuel (SAF). To achieve a substantial emission reduction by 2050, SAF needs to make up 80–90% of aviation fuel. Japan Airlines (JAL)’s plan to replace 1% of all fuel loaded at Los Angeles International Airport with SAF starting in 2025 is expected to reduce over 47,000 tons of emissions annually [70]. France, as part of its efforts to reduce emissions, implemented a policy in late May 2023 that bans short-distance domestic flights [71]. This policy entails a complete ban on air travel to destinations that can be reached by train in two and a half hours or less. As a result of this action, it is expected that domestic travel within France will gradually decrease in the future. Besides transportation, souvenirs, accommodations, and food and beverages are also significant categories contributing to the environmental burden. Measures to encourage green purchasing and ethical consumption among tourists are needed for souvenirs and food and beverages. Providers also need to offer products using sustainable packaging. For accommodations, promoting eco-hotels to travelers and certification efforts by providers are necessary, as both consumer and provider behavior changes contribute to reducing the environmental impacts.
Recent advancements in digitalization have led to the development of virtual tourism as a new form of tourism. Virtual tourism refers to exploring and experiencing tourist sites and cultural heritage remotely using digital technology [72]. This technology offers an immersive and interactive experience, simulating the feeling of being at a tourist spot or specific location. It contributes to building a more sustainable economic model [73]. NUNO et al. (2022) [74] emphasized the potential of VR to enhance tourists’ experiences and destination marketing while also pointing out the lack of empirical evidence on its impacts and applications. This indicates that VR is underutilized in tourism promotion efforts, with most research focusing on VR software proposals or technical concept reviews rather than addressing empirical impacts. In terms of environmental impact, it is believed that transportation emissions can be reduced by shortening the distance traveled. However, the economy and environment are closely intertwined, and concerns about a decrease in tourists due to the introduction of virtual tourism have been raised. M. De-la-Cruz-Diaz et al. (2022) [75] discussed virtual tourism and its carbon footprint, stating that careful consideration is needed for its implementation. The tourism industry is crucial for economic growth, and countries dependent on tourism may suffer significant losses from virtual tourism. There are also concerns about the loss of some elements of traditional travel and the reduction in the experience and excitement of visiting new places. Virtual tourism should be recognized as a new way for people with limited budgets to enjoy cultural experiences, promoting behavioral changes in travelers and reducing emissions while balancing economic and environmental considerations. Contreras-Taica, A. et al. (2022) [76] discussed virtual education and its carbon footprint, noting that virtual education brings many environmental benefits, such as significantly reducing carbon footprint emissions. Although the use of transportation is reduced due to remote education, energy consumption increases, leading to a rebound effect. Therefore, while virtual tourism can reduce transportation emissions, a comparative analysis of energy use in tool utilization is necessary. However, discussions on the relationship between the tourism industry and VR often lack content considering environmental aspects.
The methods and scopes for calculating the carbon footprint (CFP) in the tourism industry remain unclear. “Climate Action in the Tourism Sector—An overview of methodologies and tools to measure greenhouse gas emissions [46]” focuses on the calculation status for each sector of the tourism industry. Currently, in the accommodation sector, the Hotel Carbon Measurement Initiative (HCMI) [77] has been published and is available for free use. Although various accommodation calculation tools exist, HCMI, which covers Scopes 1, 2, and some of Scope 3, is considered the optimal tool in compliance with the GHG Protocol and could become a benchmark for the future. In Japan, the Carbon Footprint Communication Program (CFP Program) was introduced in 2014, and Product Category Rules (PCRs) for travel goods were accredited. The life-cycle flow consists of “outbound travel”, “meals”, “entertainment (optional calculation)”, “accommodation”, and “return travel”, which is also the calculation scope applied in this study. However, in the PCRs, the product purchasing process is not considered, which may lead to an underestimation. According to Filimonau (2016) [26], the tourism industry can primarily be divided into three major categories: transportation, accommodations, and activities. Each of these categories has multiple subcategories, showing a complex structure. While these categories stand alone as products and services, there are also composite forms, such as package tours, combining multiple products and services. The complexity of providing tourism products and services is acknowledged, pointing out that comprehensive environmental impact assessment projects and tool introductions are still limited. To conduct a reliable environmental impact assessment, it is necessary to accurately identify these elements.

5. Conclusions

This study calculated the CFP in the tourism industry of major countries by combining Input–Output Analysis with Tourism Satellite Accounts (TSA). It categorized GHG emissions in the tourism industry of each country into those resulting from both domestic and inbound tourism, clarifying the emission characteristics of each. Furthermore, it assessed and analyzed the changes in the GHG emissions from the tourism industry before and after the COVID-19 pandemic.
Country-specific GHG emissions derived from tourism were notably high, especially in developed countries such as the United States, and they were found to be lower in developing countries or in countries with a lower GDP. It was found that domestic tourism tends to have higher GHG emissions compared to inbound tourism, whereas in EU countries like Spain, Portugal, Hungary, and Croatia, there were more emissions from inbound tourism. Transportation was a major component of GHG emissions in tourism, particularly the combustion of gasoline in passenger cars. Consumption resulting from souvenirs, accommodations, and food and beverages also contributed to GHG emissions, especially in South Africa and Indonesia, where emissions were found to be higher compared to other countries. These results provide useful information for designing measures for countries to improve the sustainability of their tourism industry.
The COVID-19 pandemic significantly reduced GHG emissions from the tourism sector due to the decrease in both domestic and international tourists, with emissions from inbound tourism reduced by more than 70%. This is significant compared to the global emission reduction of about 6%, highlighting the substantial impact of the COVID-19 pandemic on the tourism industry.
This study demonstrated changes in GHG emissions, tourism expenditure, and direct employment numbers in four countries as examples of sustainable tourism. This evaluation allows for indicators and guidelines for sustainable tourism development to be proposed by considering the impacts of tourism activities on local communities, the natural environment, and the economy.
However, this approach has several limitations. Particularly, emissions resulting from gasoline usage were only calculated for countries with available TSA items, and not all countries were accounted for. The TSA and OECD databases used in this work have varying levels of data granularity between countries, potentially affecting the accuracy of this analysis. Moreover, the MRIO Eora database, which uses USD denomination, and TSA, which often uses a local currency, necessitates currency conversion. This study used the World Bank’s average exchange rates, which are annual averages and may not fully reflect actual currency fluctuations.
Given these challenges, future research should aim to develop a more comprehensive approach that combines Input–Output LCA and Process-based LCA, improves the accuracy of TSA data, and finds ways to reflect exchange rate fluctuations more accurately. A detailed analysis by region may also be necessary, leading to more accurate estimations of GHG emissions in the tourism industry and contributing to sustainable tourism.

Author Contributions

Conceptualization, A.T. and N.I.; methodology, Y.K. and N.I.; writing—original draft preparation, A.T.; supervision, N.I. and R.F. All authors have read and agreed to the published version of the manuscript.

Funding

This research received no external funding.

Institutional Review Board Statement

Not applicable.

Informed Consent Statement

Not applicable.

Data Availability Statement

Publicly available datasets were analyzed in this study. This data can be found here: [https://www.oecd-ilibrary.org/industry-and-services/oecd-tourism-trends-and-policies_20767773 (accessed on 5 January 2024)]. Or obtained from the websites of tourism agencies of various countries.

Conflicts of Interest

The authors declare no conflicts of interest.

Appendix A

Table A1. Existing case studies and papers. The following table was added by the authors based on V. Filimonau et al. 2016 [26] and Kitamura et al. 2020 [31].
StudyObject of AnalysisPrimary Environmental Impacts AssessedGeographical Scope
Process-based LCA (before COVID-19)
Castellani and Sala (2012) [78]Holiday travel, including accommodationA range of impactsItaly
Filimonau et al. (2011a) [79]Climate changeUK
Filimonau et al. (2014) [80]UK and France
El Hanandeh (2013) [81]Religious travel, including accommodationSaudi Arabia
Pereira et al. (2015) [82]Holiday travel, excluding accommodationBrazil
Filimonau et al. (2013) [83]Holiday packageUK and Portugal
Kuo et al. (2005) [84]Tourist cateringA range of impactsTaiwan
Michailidou et al. (2015) [85]Tourist accommodationGreece
König et al. (2007) [86]Portugal
Sára et al. (2004) [87]Italy
De Camillis et al. (2008) [88]
Cerutti et al. (2014) [89]
Filimonau et al. (2011b) [90]Climate changeUK
Rosselló-Batle et al. (2010) [91]Spain
Li et al. (2010) [92]China
Process-based LCA (after COVID-19)
Yi Yang et al.(2024) [93]transportation, accommodation, catering, and recreational activitiesClimate changeChina (Xi’an)
Rui Cao et al.(2023) [94]transportation, accommodation, activities, and cateringClimate changeChina (Guilin)
Input–output LCA (before COVID-19)
Scheepens et al. (2015) [95]Sector of regional tourismClimate changeThe Netherlands
Berners-Lee et al. (2011) [35]Large tourism businessUK
Patterson and McDonald (2004) [32]National tourism industryNew Zealand
Cadarso et al. (2015) [34]Spain
Zhong et al. (2015) [96]China
Qin et al. (2015) [97]Tourist destination
Manfred Lenzen (2018) [3]Global tourism160 countries
Kitamura et al.(2020) [31]National tourism industryJapan
Kitamura et al.(2020) [98]MICEJapan
Rosenblum et al. (2000) [36]National hotel industryA range of impactsUSA
Input–output LCA (after COVID-19)
Kitamura et al.(2020) [37]National tourism industryClimate changeJapan
Pilar Osorio et al.(2023) [38]Spain
Table A2. Evaluation coverage.
GBRSWEESPROUPRT *LTUITAHUNDEU *FRA *FINCZEHRVMEXUSA *CAN *AUSZAF *KORJPN *IDN
Rail
Road
Water
PTS
Ter
Air
Gas
DE
SGOP
Lodging
F&B
Cultural
S&R
Others
Passenger Agency
Rail: railroad passenger transportation; road: road passenger transportation; water: water passenger transportation; PTS: passenger transportation support; Ter: transportation equipment rental; air: air passenger; gas: gasoline; DE: direct emissions in gasoline; SGOP: sightseeing goods and other products; lodging: lodging (lodging and real estate); F&B: food and beverage provisioning services; cultural: cultural services (museums, art galleries, etc.); S&R: sports and recreation services (amusement-related); passenger agency: passenger agency services and other reservation services. The asterisk (*) indicates consideration of direct emissions from gasoline combustion. ◯ indicates the data used.
Table A3. List of values for each indicator.
All TourismDomestic TourismInbound Tourism
CountryGDP
(USD million)
Tourist
(Thousand)
GHG
(Mt-CO2e)
Tourist
(Thousand)
GHG
(Mt-CO2e)
Tourist
(Thousand)
GHG
(Mt-CO2e)
IDN1.12 × 1067.38 × 1059.38 × 1017.22 × 1057.63 × 1011.61 × 1041.75 × 101
JPN *5.12 × 1066.19 × 1051.02 × 1025.87 × 1058.77 × 1013.19 × 1041.43 × 101
KOR1.65 × 1063.62 × 1054.38 × 1013.45 × 1052.78 × 1011.75 × 1041.31 × 101
ZAF *3.89 × 1052.80 × 1056.70 × 1012.65 × 1054.95 × 1011.48 × 1041.76 × 101
AUS1.39 × 1063.75 × 1054.65 × 1013.66 × 1052.34 × 1019.47 × 1037.14 × 100
CAN1.74 × 1063.08 × 1054.99 × 1012.75 × 1053.67 × 1013.24 × 1041.32 × 101
USA *2.14 × 1072.49 × 1069.10 × 1022.33 × 1067.26 × 1021.65 × 1051.47 × 102
MEX1.74 × 106-7.46 × 101-6.06 × 1019.74 × 1041.41 × 101
HRV6.23 × 1047.05 × 1043.45 × 10−11.04 × 1044.16 × 10−26.00 × 1043.03 × 10−1
CZE2.53 × 105-1.67 × 100-7.05 × 10−13.72 × 1049.62 × 10−1
FIN *2.69 × 105-5.58 × 100-4.08 × 100-1.50 × 100
FRA *2.73 × 1064.78 × 1056.07 × 1012.61 × 1054.13 × 1012.18 × 1051.95 × 101
DEU *3.89 × 106-1.11 × 10²-9.82 × 101-1.32 × 101
HUN1.64 × 1051.09 × 1053.60 × 1004.79 × 1041.02 × 1006.14 × 1042.58 × 100
ITA2.01 × 1062.28 × 1053.40 × 1011.33 × 1052.07 × 1019.54 × 1041.40 × 101
LTU5.48 × 1042.09 × 1047.61 × 10−11.48 × 1043.13 × 10−16.15 × 1034.48 × 10−1
PRT *2.40 × 105-1.16 × 101-3.33 × 100-8.26 × 100
ROU2.51 × 1056.57 × 1044.99 × 1005.29 × 1044.29 × 1001.28 × 1047.07 × 10−1
ESP1.39 × 1065.50 × 1052.88 × 1014.24 × 1051.51 × 1011.26 × 1052.18 × 101
SWE5.34 × 105-2.75 × 1005.62 × 1041.88 × 100-8.75 × 10⁻¹
GBR2.86 × 1061.82 × 1063.71 × 1011.78 × 1063.02 × 1014.09 × 1046.95 × 100
“-” refers to the part of the data acquisition that could not be carried out. The asterisk (*) indicates consideration of direct emissions from gasoline combustion.
Table A4. List of values for each indicator for domestic tourism from 2019 to 2021.
GDP (USD Million)Tourist (Thousand)GHG (Mt-CO2e)
Country201920202021201920202021201920202021
IDN1.12 × 1061.06 × 106 7.22 × 1055.19 × 105 7.63 × 1013.18 × 101
JPN *5.12 × 1065.04 × 1065.01 × 1065.87 × 1052.93 × 1052.68 × 1058.77 × 1014.38 × 1013.91 × 101
KOR1.65 × 106 3.45 × 10⁵ 2.78 × 101
ZAF *3.89 × 1053.38 × 1054.20 × 1052.65 × 1051.25 × 1058.36 × 1044.95 × 1012.83 × 1014.03 × 101
SAU 7.34 × 10⁵ 4.84 × 10⁴ 6.99 × 100
AUS1.39 × 1061.33 × 1061.56 × 1063.66 × 1052.37 × 1052.43 × 1052.34 × 1011.93 × 1012.30 × 101
CAN *1.74 × 106 2.75 × 10⁵ 3.67 × 101
USA *2.14 × 1072.11 × 1072.33 × 1072.33 × 1061.58 × 1062.02 × 1067.26 × 1023.56 × 1025.75 × 102
MEX1.27 × 1061.09 × 1061.31 × 106 --6.06 × 1013.53 × 1014.72 × 101
HRV6.23 × 104 1.04 × 10⁴ 4.16 × 10⁻²
CZE2.53 × 1052.46 × 1052.82 × 105---7.05 × 10−14.46 × 10−16.09 × 10−1
FIN *2.69 × 1052.72 × 105 -- 4.08 × 1003.53 × 100
FRA *2.73 × 1062.64 × 1062.96 × 1062.61 × 1052.12 × 1052.52 × 1054.13 × 1013.04 × 1013.57 × 101
DEU *3.89 × 106 - 9.82 × 101
HUN1.64 × 105 4.79 × 10⁴ 1.02 × 100
ITA2.01 × 106 1.33 × 10⁵ 2.07 × 101
LTU5.48 × 1045.68 × 1046.68 × 1041.48 × 1041.14 × 1041.16 × 1043.13 × 10−12.54 × 10−13.44 × 10−1
PRT *2.40 × 105 - 3.33 × 100
ROU2.51 × 1052.51 × 105 5.29 × 1043.76 × 104 4.29 × 1002.84 × 100
ESP1.39 × 1061.28 × 1061.45 × 1064.24 × 1052.50 × 1053.41 × 1051.51 × 1016.86 × 1001.48 × 101
SWE5.34 × 1055.47 × 1056.40 × 1055.62 × 1041.29 × 1051.23 × 1051.88 × 1001.45 × 1001.73 × 100
GBR2.86 × 1062.70 × 106 1.78 × 10⁶- 3.02 × 1011.21 × 101
“-” refers to the part of the data acquisition that could not be carried out. The asterisk (*) indicates consideration of direct emissions from gasoline combustion.
Table A5. List of values for each indicator for inbound tourism from 2019 to 2021.
GDP (USD Million)Tourist (Thousand)GHG (Mt-CO2e)
Country201920202021201920202021201920202021
IDN1.12 × 1061.06 × 106 1.61 × 1044.05 × 103 1.75 × 1013.94 × 100
JPN *5.12 × 1065.04 × 1065.01 × 1063.19 × 1044.12 × 1032.46 × 1021.43 × 1013.31 × 1001.52 × 100
KOR1.65 × 106 1.75 × 10⁴ 1.31 × 101
ZAF *3.89 × 1053.38 × 1054.20 × 1051.48 × 1043.89 × 1032.66 × 1031.76 × 1014.41 × 1003.34 × 100
SAU-7.34 × 10⁵ 4.88 × 10³ 2.28 × 100
AUS1.39 × 1061.33 × 1061.56 × 1069.47 × 1031.83 × 1032.46 × 1027.14 × 1001.87 × 10−11.58 × 100
CAN1.74 × 106 3.24 × 10⁴ 1.32 × 101
USA *2.14 × 1072.11 × 1072.33 × 1071.65 × 1054.48 × 1046.66 × 1041.47 × 1022.38 × 1013.73 × 101
MEX1.27 × 1061.09 × 1061.31 × 1069.74 × 1045.11 × 1045.53 × 1041.41 × 1015.33 × 1001.04 × 101
HRV6.23 × 104 6.00 × 10⁴ 3.03 × 10⁻¹
CZE2.53 × 1052.46 × 1052.82 × 1053.72 × 1041.03 × 1041.00 × 1049.62 × 10−12.55 × 10−12.93 × 10−1
FIN *2.69 × 1052.72 × 105 -- 1.50 × 1003.87 × 10−1
FRA *2.73 × 1062.64 × 1062.96 × 1062.18 × 1051.17 × 1051.41 × 1051.95 × 1011.12 × 1011.37 × 101
DEU *3.89 × 106 - 1.32 × 101
HUN1.64 × 105 6.14 × 10⁴ 2.58 × 100
ITA2.01 × 106 9.54 × 10⁴ 1.40 × 101
LTU5.48 × 1045.68 × 1046.68 × 1046.15 × 1032.28 × 1032.10 × 1034.48 × 10−12.08 × 10−12.70 × 10−1
PRT *2.40 × 105 - 8.26 × 100
ROU2.51 × 1052.51 × 105 1.28 × 1045.02 × 103 7.07 × 10−11.50 × 10−1
ESP1.39 × 1061.28 × 1061.45 × 1061.26 × 1053.64 × 1045.16 × 1042.18 × 1015.00 × 1009.08 × 100
SWE5.34 × 1055.47 × 1056.40 × 105---8.75 × 10−14.03 × 10−14.89 × 10⁻¹
GBR2.86 × 1062.70 × 106 4.09 × 1041.11 × 104 6.95 × 1001.31 × 100
“-” refers to the part of the data acquisition that could not be carried out. The asterisk (*) indicates consideration of direct emissions from gasoline combustion.
Table A6. Restrictions on internal movement.
IDNJPNZAFAUSUSAMEXCZEFINFRALTUROUESPSWEGBR
Jan (2020)0.00.00.00.00.00.00.00.00.00.00.00.00.00.0
Feb (2020)0.00.20.00.00.00.00.00.00.00.00.00.00.00.0
Mar (2020)0.11.00.70.81.00.31.00.71.10.50.40.70.40.6
Apr (2020)1.21.02.02.02.02.00.11.42.01.12.01.01.02.0
May (2020)1.11.02.02.02.02.00.00.92.01.02.01.01.02.0
Jun (2020)1.00.72.02.02.02.00.00.01.70.50.00.70.42.0
Jul (2020)2.01.01.62.01.32.00.00.00.00.00.00.00.50.0
Aug (2020)1.01.01.52.02.02.01.00.01.00.00.02.00.02.0
Sep (2020)1.61.01.02.02.02.01.00.01.00.00.02.00.02.0
Oct (2020)1.41.01.02.02.02.01.30.00.40.10.02.00.01.6
Nov (2020)1.41.00.02.02.02.02.00.02.01.01.02.00.71.5
Dec (2020)2.01.00.02.02.02.02.00.00.91.52.02.01.02.0
Jan (2021) 1.00.02.02.02.02.0 0.02.0 2.01.0
Feb (2021) 1.00.02.02.02.02.0 0.22.0 2.01.0
Mar (2021) 1.00.70.81.00.31.0 1.10.5 0.70.4
Apr (2021) 1.02.02.02.02.00.1 2.01.1 1.01.0
May (2021) 1.00.01.51.72.00.0 0.10.1 2.01.0
Jun (2021) 1.00.22.01.92.00.0 0.00.0 0.51.0
Jul (2021) 1.01.62.01.32.00.0 0.00.0 0.00.5
Aug (2021) 1.00.02.01.02.00.0 0.00.0 0.00.0
Sep (2021) 1.00.02.00.02.00.0 0.00.0 0.00.0
Oct (2021) 1.00.02.00.02.00.0 0.00.0 0.00.0
Nov (2021) 1.00.02.00.52.00.0 0.00.0 0.00.0
Dec (2021) 1.00.02.01.01.80.0 0.00.0 0.00.0
Restriction LevelRestriction Contents
0∼0.9No action
1∼1.9Recommended not to move across regions/cities
2Introduced restrictions on domestic movement
Table A7. International travel controls.
IDNJPNZAFAUSUSAMEXCZEFINFRALTUROUESPSWEGBR
Jan (2020)0.50.80.30.00.00.00.30.00.30.00.20.00.00.0
Feb (2020)2.73.01.03.02.60.13.02.51.00.02.00.00.00.0
Mar (2020)3.42.32.13.43.01.73.53.52.02.33.12.62.90.0
Apr (2020)4.02.94.04.03.03.02.94.03.04.04.04.03.00.0
May (2020)4.03.04.04.03.03.02.03.43.03.34.04.03.00.0
Jun (2020)4.03.04.04.03.03.02.03.03.02.93.53.73.01.5
Jul (2020)2.24.01.04.03.01.03.03.01.51.01.02.61.03.0
Aug (2020)3.33.04.04.03.03.03.03.03.02.02.03.03.02.0
Sep (2020)3.03.04.04.03.02.13.03.03.02.02.03.03.02.0
Oct (2020)3.03.02.64.03.01.03.03.03.02.02.73.03.02.0
Nov (2020)3.03.01.34.03.01.03.03.03.02.03.03.03.02.0
Dec (2020)2.13.11.04.03.01.03.03.03.02.43.03.03.02.3
Jan (2021) 4.02.34.03.01.03.0 3.02.0 3.03.0
Feb (2021) 4.02.54.03.01.03.0 3.02.0 3.01.4
Mar (2021) 2.32.13.43.01.73.5 2.02.3 2.62.9
Apr (2021) 2.94.04.03.03.02.9 3.04.0 4.03.0
May (2021) 4.01.04.03.01.03.0 3.02.4 3.01.0
Jun (2021) 4.01.04.03.01.03.0 2.31.0 3.01.0
Jul (2021) 4.01.04.03.01.03.0 1.51.0 2.61.0
Aug (2021) 4.01.04.03.01.02.5 1.01.0 2.01.0
Sep (2021) 4.01.04.03.01.02.0 1.01.0 2.01.0
Oct (2021) 4.01.04.03.01.02.2 1.01.0 2.01.0
Nov (2021) 4.01.02.11.71.01.0 1.01.0 2.11.0
Dec (2021) 4.01.02.52.91.01.0 1.91.0 1.71.0
Restriction LevelRestriction Contents
0∼0.9No action
1∼1.9Screening upon entry into the country
2∼2.9Segregation of entrants from some or all areas
3∼3.9Ban on entry from some areas
4Ban on entry from all regions or total closure of borders
Figure A1. Percentage reduction in emissions by life cycle (compared to 2019). (a) domestic tourism, (b) inbound tourism. The asterisk (*) indicates consideration of direct emissions from gasoline combustion.
Sustainability 16 02222 g0a1
Table A8. GHG emissions by category for Japan.
Domestic TourismInbound Tourism
ItemMt-CO2e%Mt-CO2e%
Air travel (domestic and local)4.81 × 1005.5%5.39 × 10−20.4%
Air travel (international)2.40 × 1002.7%1.03 × 1007.1%
Shinkansen, railroad, monorail5.55 × 1006.3%7.99 × 10−15.6%
Buses9.91 × 10−11.1%5.85 × 10−20.4%
Taxi/hired car2.94 × 10−10.3%1.04 × 10−10.7%
Ship (domestic, local)2.54 × 10−10.3%5.46 × 10−30.0%
Vessel (ocean-going)4.31 × 10−30.0%2.15 × 10−30.0%
Car Rental/car sharing8.97 × 10−11.0%1.70 × 10−11.2%
Gasoline3.89 × 1004.4%0.00 × 1000.0%
Direct emissions2.26 × 10125.7%0.00 × 1000.4%
Confectionery4.64 × 1005.3%8.06 × 10−15.6%
Agricultural6.27 × 10−10.7%4.71 × 10−20.3%
Fisheries2.81 × 10−10.3%0.00 × 1000.0%
Food items3.04 × 1003.5%5.21 × 10−13.6%
Textile products1.42 × 1001.6%3.71 × 10−12.6%
Leather products3.86 × 10−10.4%2.40 × 10−11.7%
Cosmetics2.61 × 10−10.3%1.40 × 1009.8%
Ceramics and glass4.86 × 10−20.1%0.00 × 1000.0%
Publication6.51 × 10−20.1%1.33 × 10−20.1%
Electrical products8.08 × 10−20.1%6.04 × 10−20.4%
Jewelry and precious metals0.00 × 1000.0%2.19 × 10−20.2%
Other shopping2.79 × 1003.2%3.32 × 10−12.3%
Lodging1.13 × 10112.9%4.24 × 10029.5%
Attributable rent of vacation home9.35 × 10−11.1%0.00 × 1000.0%
Food and beverages9.80 × 10011.2%3.59 × 10025.0%
Other transportation3.59 × 1004.1%1.91 × 10−20.1%
Hot springs, bathing facilities, esthetic clinics, relaxation5.78 × 10−10.7%2.53 × 10−20.2%
Theme parks/amusement parks8.69 × 10−11.0%1.10 × 10−10.8%
Art galleries, museums, archives, zoos and botanical gardens, aquariums, etc.2.87 × 10−10.3%6.08 × 10−20.4%
Ski lifts9.85 × 10−20.1%3.49 × 10−20.2%
Sports facility usage4.67 × 10−10.5%6.35 × 10−30.0%
Sports games8.47 × 10−20.1%4.23 × 10−20.3%
Stage/music viewing4.23 × 10−10.5%1.97 × 10−20.1%
Exhibition/convention participation1.02 × 10−10.1%6.35 × 10−30.0%
Rental3.02 × 10−10.3%6.35 × 10−30.0%
Massage and medical0.00 × 1000.0%1.59 × 10−20.1%
Other entertainment and services2.52 × 10−10.3%3.73 × 10−20.3%
Travel insurance/credit card enrollment1.89 × 10−10.2%0.00 × 1000.0%
Passport application1.09 × 10−10.1%0.00 × 1000.0%
Visa application0.00 × 1000.0%0.00 × 1000.0%
Beauty salon/barber shop4.78 × 10−10.5%0.00 × 1000.0%
Photo printing/developing7.97 × 10−20.1%0.00 × 1000.0%
Clothes cleaning1.05 × 10−10.1%0.00 × 1000.0%
Other1.36 × 1001.6%6.35 × 10−30.0%
Travel agency revenue9.27 × 10−11.1%6.32 × 10−20.4%
Table A9. GHG emissions by category for the United States.
DomesticInbound
ItemMt-CO2e%Mt-CO2e%
Domestic air transportation6.39 × 1018.8%1.04 × 10−29.6%
International air transportation2.50 × 1013.4%1.41 × 1010.0%
Rail transportation7.08 × 10−10.1%0.00 × 1000.1%
Water transportation6.69 × 1000.9%1.79 × 10−10.0%
Bus5.14 × 10−10.1%0.00 × 1000.0%
Charter bus9.60 × 10−10.1%3.34 × 10−40.2%
Local bus and other transportation3.57 × 1000.5%2.67 × 10−10.1%
Taxicab1.90 × 1000.3%1.32 × 10−10.0%
Scenic and sightseeing transportation1.13 × 1000.2%2.99 × 10−40.2%
Automotive rental and leasing1.24 × 1011.7%2.80 × 10−10.1%
Other vehicle rental and leasing1.15 × 10−10.0%1.03 × 10−15.3%
Gasoline3.38 × 1014.7%7.76 × 10061.8%
Direct emission3.97 × 10254.7%9.11 × 1017.5%
Shopping3.08 × 1014.2%1.10 × 1010.0%
All other commodities0.00 × 1000.0%0.00 × 1006.9%
Accommodations4.79 × 1016.6%1.02 × 1015.0%
Food and beverage4.20 × 1015.8%7.34 × 1000.0%
Automotive repair3.83 × 1000.5%5.74 × 10−40.0%
Parking6.81 × 10−10.1%6.76 × 10−20.0%
Highway tolls5.31 × 10−10.1%0.00 × 1001.2%
Motion pictures and performing arts5.42 × 1000.7%1.77 × 1000.5%
Spectator sports1.23 × 1000.2%7.26 × 10−10.8%
Participant sports6.00 × 1000.8%1.22 × 1000.0%
Gambling1.86 × 1012.6%2.06 × 10−20.7%
All other recreation and entertainment2.33 × 1000.3%9.84 × 10−10.1%
Travel arrangement and reservation1.84 × 1012.5%2.10 × 10−10.0%
Table A10. GHG emissions by category for Mexico.
DomesticInbound
ItemMt-CO2e%Mt-CO2e%
Tents, beachwear, etc.7.01 × 10−20.1%0.00 × 1000.0%
Baggage and other7.10 × 10−20.1%0.00 × 1000.0%
Maps, guidebooks, tourist magazines−6.02 × 10⁻²⁰%0.00 × 1000.0%
Passenger air transportation services6.82 × 10011.3%1.27 × 1009.0%
Passenger transportation services by rail2.12 × 10−10.3%0.00 × 1000.0%
Passenger water transportation services1.00 × 10−10.2%0.00 × 1000.0%
Passenger transportation services by road1.33 × 10122.0%1.17 × 1008.3%
Transportation-related services8.11 × 10−11.3%3.68 × 10−30.0%
Transportation equipment rental services3.52 × 10−10.6%0.00 × 1000.0%
Travel agency and other reservation services7.83 × 10−11.3%2.44 × 10−20.2%
Support services1.18 × 10−10.2%0.00 × 1000.0%
Lodging in traditional facilities5.66 × 1009.4%2.60 × 10018.5%
Lodging in villa-owned accommodations2.21 × 1003.6%1.93 × 10013.7%
Lodging with family and friends (imputation)7.14 × 10011.8%0.00 × 1000.0%
Handicrafts5.22 × 1008.6%1.34 × 1009.6%
Food and beverages5.22 × 1008.6%2.62 × 10018.6%
Clothing and footwear3.15 × 10−10.5%1.26 × 10−10.9%
Books, newspapers and magazines2.93 × 10−20.0%5.21 × 10−20.4%
Pharmaceuticals and personal care products1.39 × 10−10.2%2.13 × 10−11.5%
Photographic film and equipment8.51 × 10−40.0%0.00 × 1000.0%
Other2.75 × 1004.5%2.75 × 10−12.0%
Tourism trade0.00 × 1000.0%0.00 × 1000.0%
Regional transportation3.07 × 10−10.5%1.97 × 10−20.1%
Information services6.36 × 10−11.1%0.00 × 1000.0%
Financial services1.10 × 10−10.2%0.00 × 1000.0%
Real estate and rental services5.04 × 10−10.8%0.00 × 1000.0%
Professional services8.81 × 10−20.1%2.01 × 10−30.0%
Health services1.59 × 1002.6%2.46 × 10−20.2%
Cultural services1.53 × 10−10.3%5.93 × 10−14.2%
Sports and recreation services2.31 × 10−10.4%1.22 × 1008.7%
Restaurants, bars and nightclubs5.61 × 1009.3%5.76 × 10−14.1%
The values in red indicating a minus are considered as no emissions.
Table A11. GHG emissions by category in South Africa.
DomesticInbound
ItemMt-CO2e%Mt-CO2e%
Accommodation3.14 × 1006.3%2.50 × 10014.2%
Food and beverages7.13 × 10014.4%2.09 × 10011.9%
Railway transportation7.14 × 10−20.1%3.26 × 10−20.2%
Road transportation7.17 × 10014.5%2.29 × 10013.0%
Water transportation3.18 × 10−10.6%6.34 × 10−20.4%
Air transportation7.00 × 10014.2%1.37 × 1007.8%
Transport equipment rental services2.03 × 1004.1%3.84 × 10−20.2%
Travel agencies and other reservation2.32 × 1004.7%9.74 × 10−15.5%
Cultural services7.83 × 10−11.6%5.75 × 10−13.3%
Sports and recreational services2.36 × 1004.8%1.44 × 1008.2%
Retail sales of food, beverages and tobacco2.30 × 1004.6%1.65 × 1009.4%
Retail sales of textiles, clothing, footwear and leather goods3.33 × 10−10.7%7.80 × 10−14.4%
Retail sales of pharmaceutical and medical goods, cosmetic and toiletry articles3.54 × 10−20.1%4.32 × 10−20.2%
Retail sales of household furniture, appliances, articles and equipment1.05 × 10−10.2%2.64 × 10−11.5%
Retail sales of automotive fuel6.07 × 10−11.2%2.28 × 10−11.3%
Non-specific products1.29 × 10126.0%2.89 × 10016.4%
Direct emissions9.09 × 10−11.8%3.41 × 10−11.9%
Table A12. Changes in GHG emissions, tourism consumption, and employment.
20202021
GHGConsumptionEmploymentGHGConsumptionEmployment
IDNTransport−61.10%−58.10%
Souvenirs−60.29%−57.01%
Accommodations−64.82%−61.22%
Food and Beverage−61.07%−56.97%
Activities−66.05%−63.38%
Travel agencies, tour operators, and guides−38.66%−33.84%
JPN *Transport−50.12%−62.62%0.63%−56.62%−71.02%−6.3%
Souvenirs−58.70%−59.70%−0.08%−65.26%−66.16%0.2%
Accommodations−53.10%−50.55%−9.09%−58.43%−56.45%−18.2%
Food and Beverage−58.88%−57.49%−6.39%−67.37%−66.71%−10.6%
Activities−53.96%−54.68%−1.37%−57.78%−58.91%5.5%
Travel agencies, tour operators, and guides−72.95%−72.03% −86.55%−86.26%
ZAF *Transport−52.04%−51.19%−6.44%−29.62%−28.07%−7.46%
Souvenirs−54.01%−52.80%−2.09%−49.53%−48.72%−9.70%
Accommodations−45.68%−43.75%−16.75%−23.95%−22.29%−24.04%
Food and Beverage−52.31%−51.06%−15.55%−30.20%−29.09%−17.06%
Activities−49.28%−47.73%−15.15%−20.60%−19.71%−9.24%
Travel agencies, tour operators, and guides−36.89%−35.29%−26.11%−30.89%−29.46%−27.91%
AUSTransport−40.78%−23.67%−7.55%−16.22%10.62%−38.12%
Souvenirs−23.78%−22.82%−13.88%−13.27%−8.54%−41.15%
Accommodations−26.42%−26.12%3.40%−13.44%−8.56%−36.23%
Food and Beverage−14.63%−13.55%−14.27%0.24%6.18%−29.62%
Activities−68.12%−72.61%−19.30%−50.90%−55.44%−55.59%
Travel agencies, tour operators, and guides−47.50%−46.38%−18.70%−20.56%−15.29%−39.09%
USA *Transport−58.4%−60.2%−37.0%−35.0%−33.0%−27.6%
Souvenirs−61.6%−58.2%−54.2%−4.0%0.4%−18.0%
Accommodations−45.2%−40.2%−36.1%−18.6%−14.7%−31.0%
Food and Beverage−57.3%−53.6%−54.8%−1.4%3.3%−17.1%
Activities−57.8%−53.7%−56.3%−36.5%−33.7%−32.5%
Travel agencies, tour operators, and guides−8.2%−0.1%−28.1%−3.2%1.3%−34.5%
MEXTransport−59.22%−51.60%−11.97%−34.93%−26.12%
Souvenirs−35.17%−30.62%−9.79%−11.21%−8.00%
Accommodations−37.06%−24.82%2.23%−15.08%−5.02%
Food and Beverage−43.19%−32.01%−17.43%−24.29%−15.02%
Activities−50.42%−39.46%−26.92%−30.00%−21.96%
Travel agencies, tour operators, and guides−66.26%−59.30%−15.35%−56.44%−50.48%
CZETransport−65.89%−65.52%−1.88%−54.80%−56.32%
Souvenirs−57.55%−56.70%−0.17%−45.22%−46.89%
Accommodations−48.13%−45.86%−14.79%−36.94%−37.64%
Food and Beverage−56.18%−55.47%−12.12%−44.96%−47.11%
Activities−53.76%−52.07%−4.26%−42.41%−43.41%
Travel agencies, tour operators, and guides−70.54%−69.96%−10.11%−42.41%−43.82%
FIN *Transport−25.23%−49.20%−23.82%
Souvenirs−24.79%−17.01%
Accommodations−43.15%−37.53%−30.07%
Food and Beverage−52.69%−48.23%−20.79%
Activities−31.03%−24.02%−11.20%
Travel agencies, tour operators, and guides−67.10%−63.83%−25.00%
FRA *Transport−26.79%−40.88%−8.45%−16.08%−21.98%
Souvenirs−32.16%−25.63% −11.83%−11.21%
Accommodations−43.81%−38.89%−17.09%−24.35%−23.95%
Food and Beverage−44.13%−39.23%−9.07%−25.91%−25.52%
Activities−43.88%−38.78%−9.97%−35.06%−34.69%
Travel agencies, tour operators, and guides−62.67%−59.19%−14.18%−51.43%−51.14%
LTUTransport−40.33%−41.74%−12.33%−7.22%−10.40%
Souvenirs−37.67%−39.14%6.32%−28.82%−30.77%
Accommodations−41.00%−42.82%0.66%−26.56%−28.78%
Food and Beverage−18.13%−20.66%5.74%32.17%28.17%
Activities−62.45%−63.55%5.51%−49.63%−51.02%
Travel agencies, tour operators, and guides−74.90%−75.64%−1.64%−77.44%−78.08%
ROUTransport−18.94%−17.78%−0.47%
Souvenirs−40.64%−39.31%
Accommodations−53.79%−52.99%1.80%
Food and Beverage−38.51%−37.45%−10.07%
Activities−25.60%−24.88%−1.85%
Travel agencies, tour operators, and guides−51.91%−51.12%−8.37%
ESPTransport−73.60%−69.63%−3.54%−50.94%−47.60%−5.30%
Souvenirs−61.32%−55.67% −38.19%−34.60%
Accommodations−75.33%−71.61%−22.53%−26.76%−22.34%−23.24%
Food and Beverage−60.10%−54.20%−14.85%−28.67%−24.52%−12.49%
Activities−75.06%−71.34%−8.88%−46.43%−43.16%−5.84%
Travel agencies, tour operators, and guides−62.34%−56.71%−9.98%−24.81%−19.88%−5.43%
SWETransport−38.49%−34.99%1.84%−34.17%−25.02%−29.00%
Souvenirs−31.30%−25.09% −19.36%−7.35%
Accommodations−26.97%−21.61%−18.39%−7.64%6.89%−13.06%
Food and Beverage−32.59%−27.63%−15.76%−11.55%2.36%−13.03%
Activities−12.21%−6.22%3.45%−1.53%14.08%−7.06%
Travel agencies, tour operators, and guides−54.79%−51.46%−2.19%−46.66%−38.11%−9.47%
GBRTransport−64.86%−61.49%−14.95%
Souvenirs−66.14%−63.04%−61.30%
Accommodations−63.62%−60.42%−51.21%
Food and Beverage−59.67%−56.12%−40.49%
Activities−58.53%−54.76%−42.58%
Travel agencies, tour operators, and guides−75.18%−72.97%−40.61%
The asterisk (*) indicates consideration of direct emissions from gasoline combustion.

References

  1. United Nations Framework Convention on Climate Change (UNFCCC). The Paris Agreement. Available online: https://unfccc.int/process-and-meetings/the-paris-agreement (accessed on 21 August 2023).
  2. United Nations Environment Programme (UNEP). Emissions Gap Report. 2023. Available online: https://www.unep.org/resources/emissions-gap-report-2023 (accessed on 27 December 2023).
  3. Lenzen, M.; Sun, Y.; Faturay, F.; Ting, Y.; Geschke, A.; Malik, A. The carbon footprint of global tourism. Nat. Clim. Chang. 2018, 8, 522–528. [Google Scholar] [CrossRef]
  4. Sustainable Travel International. Carbon Footprint of Tourism. Available online: https://sustainabletravel.org/issues/carbon-footprint-tourism/ (accessed on 27 December 2023).
  5. United Nations World Tourism Organization (UNWTO). Transport-Related CO2 Emissions from the Tourism Sector. Available online: https://www.unwto.org/sustainable-development/tourism-emissions-climate-change (accessed on 27 December 2023).
  6. United Nations World Tourism Organization (UNWTO). Climate Action: Transforming Tourism for Climate Action. Available online: https://www.unwto.org/sustainable-development/climate-action (accessed on 27 December 2023).
  7. United Nations World Tourism Organization (UNWTO). Tourism Unites Behind the Glasgow Declaration on Climate Action at COP26. Available online: https://www.unwto.org/news/tourism-unites-behind-the-glasgow-declaration-on-climate-action-at-cop26 (accessed on 21 August 2023).
  8. United Nations World Tourism Organization (UNWTO). One Planet Vision for a Responsible Recovery of the Tourism Sector. 2020. Available online: https://webunwto.s3.eu-west-1.amazonaws.com/s3fs-public/2020-12/en-brochure-one-planet-vision-responsible-recovery.pdf (accessed on 21 August 2023).
  9. United Nations World Tourism Organization (UNWTO). Tourism at COP28—Delivering on the Climate Action Commitments of the Glasgow Declaration. Available online: https://www.unwto.org/news/tourism-at-cop28-delivering-on-the-climate-action-commitments-of-the-glasgow-declaration (accessed on 21 August 2023).
  10. United Nations World Tourism Organization (UNWTO). Glasgow Declaration Implementation Report 2023—Advancing Climate Action. Available online: https://www.e-unwto.org/doi/epdf/10.18111/9789284425242 (accessed on 21 August 2023).
  11. ISO 14040:2006; Environmental management—Life cycle assessment—Principles and framework. Available online: https://www.iso.org/standard/37456.html (accessed on 27 December 2023).
  12. ISO 14044:2006; Environmental management—Life cycle assessment—Requirements and guidelines. Available online: https://www.iso.org/standard/38498.html (accessed on 27 December 2023).
  13. United Nations World Tourism Organization (UNWTO). Sustainable Tourism for Development Guidebook—Enhancing Capacities for Sustainable Tourism for Development in Developing Countries. Available online: https://www.e-unwto.org/doi/epdf/10.18111/9789284415496 (accessed on 23 August 2023).
  14. United Nations World Tourism Organization (UNWTO). Definition of Sustainable Tourism. Available online: https://unwto-ap.org/why/tourism-definition/ (accessed on 21 August 2023).
  15. United Nations World Tourism Organization (UNWTO). Join Us on the 2030 Journey. Available online: https://www.unwto.org/tourism4sdgs (accessed on 21 August 2023).
  16. Kitamura, Y.; Shibahara, N.; Inaba, A. Policy Trends and Direction of LCA Study on Sustainable Tourism. J. Life Cycle Assess. 2021, 17, 8–15. [Google Scholar]
  17. Bernardo, C.; Sousa, B.; Kastenholz, E. Souvenirs in tourism studies: A bibliometric retrospective and future research agenda. Tour. Hosp. Manag. 2023, 29, 249–264. [Google Scholar] [CrossRef]
  18. Kochar, D. The Economic Benefits of Inbound Tourism: Boosting Local Economies. J. Tour. Hosp. 2022, 11, 521. Available online: https://www.longdom.org/open-access/the-economic-benefits-of-inbound-tourism-boosting-local-economies-99108.html (accessed on 11 October 2023).
  19. Abbasi, I. What Is Domestic Tourism? Available online: https://iqbalfreetips.com/2023/03/what-is-domestic-tourism.html (accessed on 11 October 2023).
  20. United Nations World Tourism Organization (UNWTO). International Tourism and COVID-19. Available online: https://www.unwto.org/tourism-data/international-tourism-and-covid-19 (accessed on 11 October 2023).
  21. United Nations World Tourism Organization (UNWTO). Impact Assessment of the COVID-19 Outbreak on International Tourism. Available online: https://www.unwto.org/impact-assessment-of-the-covid-19-outbreak-on-international-tourism (accessed on 11 October 2023).
  22. United Nations World Tourism Organization (UNWTO). International Tourism Highlights—2023 Edition. Available online: https://static.poder360.com.br/2023/09/relatorio-Organizacao-Mundial-Turismo-ONU-2022.pdf (accessed on 23 August 2023).
  23. United Nations World Tourism Organization (UNWTO). Tourism and COVID-19—Unprecedented Economic Impacts. Available online: https://www.unwto.org/tourism-and-covid-19-unprecedented-economic-impacts (accessed on 23 August 2023).
  24. Xu, L.; Yang, Z.; Chen, J.; Zou, Z. Spatial-temporal heterogeneity of global ports resilience under Pandemic: A case study of COVID-19. Marit. Policy Manag. 2023. [Google Scholar] [CrossRef]
  25. Xu, L.; Yang, Z.; Chen, J.; Zou, Z. The influence of COVID-19 epidemic on BDI volatility: An evidence from GARCH-MIDAS model. Ocean Coast. Manag. 2022, 229, 106330. [Google Scholar] [CrossRef] [PubMed]
  26. Filimonau, V. Life Cycle Assessment (LCA) and Life Cycle Analysis in Tourism; Springer International Publishing: Cham, Switzerland, 2016. [Google Scholar]
  27. Dwyer, L.; Forsyth, P.; Spurr, R.; Hoque, S. Estimating the Carbon Footprint of Australian Tourism. J. Sustain. Tour. 2010, 18, 355–376. [Google Scholar] [CrossRef]
  28. Luo, F.; Moyle, B.D.; Moyle, C.J.; Zhong, Y.; Shi, S. Drivers of Carbon Emissions in China’s Tourism Industry. J. Sustain. Tour. 2020, 28, 747–770. [Google Scholar] [CrossRef]
  29. Meng, W.; Xu, L.; Hu, B.; Zhou, J.; Wang, Z. Quantifying Direct and Indirect Carbon Dioxide Emissions of the Chinese Tourism Industry. J. Clean. Prod. 2016, 126, 586–594. [Google Scholar] [CrossRef]
  30. Sharp, H.; Grundius, J.; Heinonen, J. Carbon Footprint of Inbound Tourism to Iceland: A Consumption-Based Life-Cycle Assessment including Direct and Indirect Emissions. Sustainability 2016, 8, 1147. [Google Scholar] [CrossRef]
  31. Kitamura, Y.; Ichisugi, Y.; Karkour, S.; Itsubo, N. Carbon Footprint Evaluation Based on Tourist Consumption toward Sustainable Tourism in Japan. Sustainability 2020, 12, 2219. [Google Scholar] [CrossRef]
  32. Patterson, M.G.; McDonald, G. How Clean and Green Is New Zealand Tourism? Lifecycle and Future Environmental Impacts; Manaaki Whenua Press: Lincoln, New Zealand, 2004. [Google Scholar]
  33. Sun, Y.-Y.; Higham, J. Overcoming Information Asymmetry in Tourism Carbon Management: The Application of a New Reporting Architecture to Aotearoa New Zealand. Tour. Manag. 2021, 83, 104231. [Google Scholar] [CrossRef] [PubMed]
  34. Cadarso, M.-Á.; Gómez, N.; López, L.-A.; Tobarra, M.-Á.; Zafrilla, J.-E. Quantifying Spanish Tourism’s Carbon Footprint: The Contributions of Residents and Visitors: A Longitudinal Study. J. Sustain. Tour. 2015, 23, 922–946. [Google Scholar] [CrossRef]
  35. Berners-Lee, M.; Howard, D.C.; Moss, J.; Kaivanto, K.; Scott, W.A. Greenhouse Gas Footprinting for Small Businesses—The Use of Input–Output Data. Sci. Total Environ. 2011, 409, 883–891. [Google Scholar] [CrossRef] [PubMed]
  36. Rosenblum, J.; Horvath, A.; Hendrickson, C. Environmental Implications of Service Industries. Environ. Sci. Technol. 2000, 34, 4669–4676. [Google Scholar] [CrossRef]
  37. Kitamura, Y.; Karkour, S.; Ichisugi, Y.; Itsubo, N. Evaluation of the Economic, Environmental, and Social Impacts of the COVID-19 Pandemic on the Japanese Tourism Industry. Sustainability 2020, 12, 10302. [Google Scholar] [CrossRef]
  38. Osorio, P.; Cadarso, M.-Á.; Tobarra, M.-Á.; García-Alaminos, Á. Carbon Footprint of Tourism in Spain: COVID-19 Impact and a Look Forward to Recovery. Struct. Chang. Econ. Dyn. 2023, 65, 303–318. [Google Scholar] [CrossRef]
  39. Organisation for Economic Co-operation and Development (OECD). OECD Tourism Trends and Policies 2022. Available online: https://www.oecd-ilibrary.org/industry-and-services/oecd-tourism-trends-and-policies_20767773 (accessed on 11 October 2023).
  40. United Nations. International Standard Industrial Classification of All Economic Activities (ISIC), Rev.4. August 2008. Available online: https://www.un-ilibrary.org/content/books/9789211561760 (accessed on 11 October 2023).
  41. Leontief, W.W. Input–Output Economics, 2nd ed.; Oxford University Press: New York, NY, USA, 1986. [Google Scholar]
  42. International Energy Agency (IEA). End-Use Prices Data Explorer. Last Updated 28 April 2023. Available online: https://www.iea.org/data-and-statistics/data-tools/end-use-prices-data-explorer (accessed on 22 August 2023).
  43. World Bank. World Development Indicators: Exchange Rates and Prices. Available online: https://data.worldbank.org/indicator/PA.NUS.FCRF (accessed on 22 August 2023).
  44. Organisation for Economic Co-operation and Development (OECD). Tourism Satellite Account. Available online: https://www.oecd.org/cfe/tourism/TSA_EN.pdf (accessed on 11 October 2023).
  45. United Nations, International Recommendations for Tourism Statistics. 2008. Available online: https://unstats.un.org/unsd/publication/seriesm/seriesm_83rev1e.pdf (accessed on 11 October 2023).
  46. United Nations World Tourism Organization (UNWTO). Climate Action in the Tourism Sector—An Overview of Methodologies and Tools to Measure Greenhouse Gas Emissions; UNWTO: Madrid, Spain, 2023. [Google Scholar]
  47. World Bank. GDP (Current US$). Available online: https://data.worldbank.org/indicator/NY.GDP.MKTP.CD (accessed on 22 August 2023).
  48. United Nations World Tourism Organization (UNWTO). Key Tourism Statistics. Available online: https://www.unwto.org/tourism-statistics/key-tourism-statistics (accessed on 11 October 2023).
  49. Institute of Southeast Asian Studies (ISEAS). Towards More Sustainable Agro-Food Systems in Indonesia. Available online: https://www.iseas.edu.sg/wp-content/uploads/2023/01/ISEAS_Perspective_2023_15.pdf (accessed on 11 October 2023).
  50. International Institute for Sustainable Development (IISD); SDG Knowledge Hub. South Africa Launches Green Transport Strategy. 2 July 2019. Available online: https://sdg.iisd.org/news/south-africa-launches-green-transport-strategy/ (accessed on 11 October 2023).
  51. Office for National Statistics (ONS). Road Transport and Air Emissions. 16 September 2019. Available online: https://www.ons.gov.uk/economy/environmentalaccounts/articles/roadtransportandairemissions/2019-09-16 (accessed on 11 October 2023).
  52. Ministry of Finance. Current Status and Future Prospects of Tourism in Japan. 2022. Available online: https://www.mof.go.jp/public_relations/finance/202110/202110j.pdf (accessed on 24 October 2023).
  53. VisitBritain. Inbound Visits and Spend—Annual UK. Available online: https://www.visitbritain.org/research-insights/inbound-visits-and-spend-annual-uk (accessed on 24 October 2023).
  54. Ministry for the Ecological Transition, France. GHG Emissions from Transportation in Climate Change Observations—December 2022 Edition. Available online: https://www.statistiques.developpement-durable.gouv.fr/edition-numerique/chiffres-cles-du-climat-decembre-2022/en/11-ghg-emissions-from-transportation (accessed on 24 October 2023).
  55. Tengvall-Unadike, U. Finland’s COVID-19 Policy Actions: Balancing Between Legal Boundaries, Human Rights and Controlling Viral Spread. Master’s Thesis, Faculty of Health Sciences, School of Medicine, Public Health and Clinical Nutrition, University of Eastern Finland, Kuopio, Finland, 22 June 2021. Available online: http://urn.fi/urn:nbn:fi:uef-20211039 (accessed on 11 November 2023).
  56. Finnish Government. Evaluation: Coronavirus Pandemic Reduced Tourist Spending by Over 40% in Finland in 2020. 22 February 2021. Available online: https://valtioneuvosto.fi/en/-/1410877/evaluation-coronavirus-pandemic-reduced-tourist-spending-by-over-40-in-finland-in-2020 (accessed on 11 November 2023).
  57. Bruno, A.; Davis, K.; Staib, A. The Recovery in the Australian Tourism Industry. Reserve Bank of Australia Bulletin—December 2022. Available online: https://www.rba.gov.au/publications/bulletin/2022/dec/the-recovery-in-the-australian-tourism-industry.html (accessed on 11 November 2023).
  58. Caravan Industry Association of Australia. 2020 Caravan and Campervan Data Report. December 2020. Available online: https://caravanstats.com.au/wp-content/uploads/2020/12/2020-Caravan-and-Campervan-Data-Report.pdf (accessed on 11 November 2023).
  59. Hale, T.; Angrist, N.; Goldszmidt, R.; Kira, B.; Petherick, A.; Phillips, T.; Webster, S.; Cameron-Blake, E.; Hallas, L.; Majumdar, S.; et al. A global panel database of pandemic policies (Oxford COVID-19 Government Response Tracker). Nat. Hum. Behav. 2021, 5, 529–538. [Google Scholar] [CrossRef]
  60. Ludvigsson, J.F. The first eight months of Sweden’s COVID-19 strategy and the key actions and actors that were involved. Acta Paediatr. 2020, 109, 2459–2471. [Google Scholar] [CrossRef]
  61. Australian National Audit Office (ANAO). Management of International Travel Restrictionsduring COVID-19 Across Entities. September 2022. Available online: https://www.anao.gov.au/sites/default/files/2022-09/Auditor-General_Report_2021-22_12.pdf (accessed on 5 January 2024).
  62. Ballotpedia. Travel Restrictions Issued by States in Response to the Coronavirus (COVID-19) Pandemic, 2020–2022. Available online: https://ballotpedia.org/Travel_restrictions_issued_by_states_in_response_to_the_coronavirus_(COVID-19)_pandemic,_2020-2022 (accessed on 5 January 2024).
  63. World Bank. World Development Indicators. Available online: https://data.worldbank.org/?locations=XM-XD-XP (accessed on 11 November 2023).
  64. Bank of Japan. Current State and Challenges of the Tourism Industry. September 2023. Available online: https://www.boj.or.jp/finsys/c_aft/data/aft230928a1.pdf (accessed on 15 November 2023).
  65. Ministry of Land, Infrastructure, Transport and Tourism, Japan. Automobiles in Numbers. Available online: https://www.mlit.go.jp/jidosha/jidosha_fr1_000084.html (accessed on 15 November 2023).
  66. Ministry of Health, Labour and Welfare, Japan. 2021 Employment Trend Survey. Available online: https://www.mhlw.go.jp/toukei/itiran/roudou/koyou/doukou/22-2/index.html (accessed on 15 November 2023).
  67. Japan Association of Travel Agents (JATA). The Numbers Tell the Story of the Travel Industry 2023. Available online: https://www.jata-net.or.jp/wp/wp-content/uploads/administrator/2023_sujryoko.pdf (accessed on 15 November 2023).
  68. Bureau of Labor Statistics (BLS). State Unemployment Rates by Rank. Available online: https://www.bls.gov/lau/lastrk20.html (accessed on 15 November 2023).
  69. International Air Transport Association (IATA). Executive Summary—Net Zero Roadmaps. Available online: https://www.iata.org/contentassets/8d19e716636a47c184e7221c77563c93/executive-summary---net-zero-roadmaps.pdf (accessed on 15 November 2023).
  70. Japan Airlines (JAL). JAL and Shell Aviation Sign Purchase Agreement to Replace Fuel Uplifted in Los Angeles with SAF. Available online: https://press.jal.co.jp/ja/release/202306/007455.html (accessed on 15 November 2023).
  71. Euronews. It’s Official: France Bans Short-Haul Domestic Flights in Favour of Train Travel. ; updated 23 May 2023. 2 December 2022. Available online: https://www.euronews.com/green/2022/12/02/is-france-banning-private-jets-everything-we-know-from-a-week-of-green-transport-proposals (accessed on 20 October 2023).
  72. MakeUseOf. What Is VR Tourism and Benefits? Available online: https://www.makeuseof.com/what-is-vr-tourism-and-benefits/ (accessed on 20 October 2023).
  73. World Economic Forum. How Virtual Reality is Taking Tourism to New Heights During the Pandemic. May 2021. Available online: https://www.weforum.org/agenda/2021/05/covid-19-travel-tourism-virtual-reality/ (accessed on 20 October 2023).
  74. Sousa, N.; Alén, E.; Losada, N.; Melo, M. Virtual Reality in tourism promotion: A bibliometric perspective on scientific literature. J. Tour. Dev. 2022, 39, 279–290. [Google Scholar]
  75. De-la-Cruz-Diaz, M.; Alvarez-Risco, A.; Jaramillo-Arévalo, M.; Lenti-Dulong, M.F.; Calle-Nole, M.; Anderson-Seminario, M.d.l.M.; Del-Aguila-Arcentales, S. Virtual Tourism, Carbon Footprint, and Circularity. In Environmental Footprints and Eco-Design of Products and Processes; Springer: Berlin, Germany, 2024; pp. 245–263. [Google Scholar]
  76. Contreras-Taica, A.; Alvarez-Risco, A.; Arias-Meza, M.; Campos-Dávalos, N.; Calle-Nole, M.; Almanza-Cruz, C.; Anderson-Seminario, M.d.l.M.; Del-Aguila-Arcentales, S. Virtual Education: Carbon Footprint and Circularity. In Environmental Footprints and Eco-Design of Products and Processes; Springer: Berlin, Germany, 2024; pp. 265–285. [Google Scholar]
  77. Sustainable Hospitality Alliance. Hotel Carbon Measurement Initiative (HCMI). Available online: https://sustainablehospitalityalliance.org/resource/hotel-carbon-measurement-initiative/ (accessed on 15 November 2023).
  78. Castellani, V.; Sala, S. Ecological Footprint and Life Cycle Assessment in the Sustainability Assessment of Tourism Activities. Ecol. Indic. 2012, 16, 135–147. [Google Scholar] [CrossRef]
  79. Filimonau, V.; Dickinson, J.; Robbins, D.; Reddy, M.V. A Critical Review of Methods for Tourism Climate Change Appraisal: Life Cycle Assessment as a New Approach. J. Sustain. Tour. 2011, 19, 301–324. [Google Scholar] [CrossRef]
  80. Filimonau, V.; Dickinson, J.; Robbins, D. The Carbon Impact of Short-Haul Tourism: A Case Study of UK Travel to Southern France Using Life Cycle Analysis. J. Clean. Prod. 2014, 64, 628–638. [Google Scholar] [CrossRef]
  81. El Hanandeh, A. Quantifying the Carbon Footprint of Religious Tourism: The Case of Hajj. J. Clean. Prod. 2013, 52, 53–60. [Google Scholar] [CrossRef]
  82. Pereira, R.P.T.; Glaydston, M.B.; Filimonau, V. The carbon implications of local visitor travel in Brazil: A case of the Rio de Janeiro and São Paolo itinerary. J. Clean. Prod. 2017, 141, 256–266. [Google Scholar] [CrossRef]
  83. Filimonau, V.; Dickinson, J.; Robbins, D.; Reddy, M.V. The role of ‘indirect’ greenhouse gas emissions in tourism: Assessing the hidden carbon impacts from a holiday package tour. Transp. Res. Part A 2013, 54, 78–91. [Google Scholar] [CrossRef]
  84. Kuo, N.W.; Hsiao, T.Y.; Lan, C.F. Tourism management and industrial ecology: A case study of food service in Taiwan. Tour. Manag. 2005, 26, 503–508. [Google Scholar] [CrossRef]
  85. Michailidou, A.V.; Vlachokostas, C.; Maleka, D.; Feleke, E.; Moussiopoulos, N. Life cycle impact approach to promote sustainable tourism: A case study from Greek hotels. In Proceedings of the 14th International Conference on Environmental Science and Technology, Rhodes, Greece, 3–5 September 2015. [Google Scholar]
  86. König, H.; Schmidberger, E.; de Cristofaro, L. Life cycle assessment of a tourism resort with renewable materials and traditional techniques. In Proceedings of the ‘Portugal SB07, Sustainable Construction, Materials and Practice—Challenge of the Industry for the New Millennium’ Conference, Lisbon, Portugal, 12–14 September 2007. [Google Scholar]
  87. Sára, B.; Raggi, A.; Petti, L.; Scimìa, E. Implementation of LCA to services: Case studies in the hospitality industry. In Proceedings of the 6th International Conference on EcoBalance, Tsukuba, Japan, 25–27 October 2004. [Google Scholar]
  88. De Camillis, C.; Petti, L.; Raggi, A. LCA: A key-tool for Sustainable Tourism? In Proceedings of the 8th International Conference on EcoBalance, Tokyo, Japan, 10–12 December 2008.
  89. Cerutti, A.K.; Beccaro, G.L.; Bruun, S.; Donno, D.; Bonvegna, L.; Bounous, G. Assessment methods for sustainable tourism declarations: The case of holiday farms. J. Clean. Prod. 2016, 111, 511–519. [Google Scholar] [CrossRef]
  90. Filimonau, V.; Dickinson, J.E.; Robbins, D.; Huijbregts, M.A.J. Reviewing the carbon footprint analysis of hotels: Life Cycle Energy Analysis (LCEA) as a holistic method for carbon impact appraisal of tourist accommodation. J. Clean. Prod. 2011, 19, 1917–1930. [Google Scholar] [CrossRef]
  91. Rosselló-Batle, B.; Moiá, A.; Cladera, A.; Martínez, V. Energy use, CO2 emissions and waste throughout the life cycle of a sample of hotels in the Balearic Islands’. Energy Build. 2010, 42, 547–558. [Google Scholar] [CrossRef]
  92. Li, P.; Huang, J.H.; Mo, Y.F.; Yang, G.H. Carbon footprint calculation and analysis of accommodation services in four-star hotels of Kunming. Tour. Trib. 2010, 25, 27–34. [Google Scholar]
  93. Yang, Y.; Guo, X. Characteristics and drivers of changes in the carbon footprint of urban tourism in the post-COVID-19 era: A case study of Xi’an. J. Clean. Prod. 2024, 434, 140015. [Google Scholar] [CrossRef]
  94. Cao, R.; Mo, Y.; Ma, J. Carbon Footprint Analysis of Tourism Life Cycle: The Case of Guilin from 2011 to 2022. Sustainability 2023, 15, 7124. [Google Scholar] [CrossRef]
  95. Scheepens, A.E.; Vogtländer, J.G.; Brezet, J.C. Two life cycle assessment (LCA) based methods to analyse and design complex (regional) circular economy systems. Case: Making water tourism more sustainable. J. Clean. Prod. 2016, 114, 257–268. [Google Scholar] [CrossRef]
  96. Zhong, Y.; Shi, S.; Li, S.; Luo, F. Empirical research on construction of a measurement framework for tourism carbon emission in China. Chin. J. Popul. Resour. Environ. 2015, 13, 240–249. [Google Scholar] [CrossRef]
  97. Qin, Y.; Li, X.; Rong, P. Urban tourism carbon accounting based on improved EIO-LCA model: A case study of Kaifeng City in Henan Province. Prog. Geogr. 2015, 34, 132–140. [Google Scholar]
  98. Kitamura, Y.; Karkour, S.; Ichisugi, Y.; Itsubo, N. Carbon Footprint Evaluation of the Business Event Sector in Japan. Sustainability 2020, 12, 5001. [Google Scholar] [CrossRef]
Figure 1. System boundaries.
Sustainability 16 02222 g001
Figure 2. Relationship between the number of tourists, GDP, and GHG emissions in 2019. (a) All tourism; (b) domestic tourism; (c) inbound tourism. X-axis: GDP [47]; y-axis: tourists [48]; bubble: GHG emissions (Mt-CO2e). The number of tourists is shown in Table A3 of Appendix A. The asterisk (*) indicates consideration of direct emissions from gasoline combustion. The blue circle represents a legend for GHG emissions.
Sustainability 16 02222 g002aSustainability 16 02222 g002bSustainability 16 02222 g002c
Figure 3. Percentage of emissions by life cycle in each country and average percentage of emissions by life cycle. (a) Domestic tourism; (b) inbound tourism. The asterisk (*) indicates consideration of direct emissions from gasoline combustion.
Sustainability 16 02222 g003aSustainability 16 02222 g003b
Figure 4. Relationship between the number of tourists, GDP, and GHG emissions from 2019 to 2021. (a) domestic tourism; (b) inbound tourism. X-axis: GDP; y-axis: number of tourists; bubble: GHG emissions (Mt-CO2e). The number of tourists is shown in Table A4 and Table A5 of Appendix A. The asterisk (*) indicates consideration of direct emissions from gasoline combustion. The orange circle represents a legend for GHG emissions.
Sustainability 16 02222 g004aSustainability 16 02222 g004b
Figure 5. Percentage reduction in emissions by life cycle (compared to 2019). (a) domestic tourism; (b) inbound tourism. The results for the year 2020 alone are shown in Appendix A, Figure A1. The asterisk (*) indicates consideration of direct emissions from gasoline combustion.
Sustainability 16 02222 g005aSustainability 16 02222 g005b
Figure 6. GHG emissions from Japan’s tourism industry and contribution by category. (a) domestic tourism; (b) inbound tourism. Appendix A, Table A8 shows the CFP calculation results for each product and service item.
Sustainability 16 02222 g006aSustainability 16 02222 g006b
Figure 7. GHG emissions from U.S.A.’s tourism industry and contribution by category. (a) domestic tourism; (b) inbound tourism. Appendix A, Table A9 shows the CFP calculation results for each product and service item.
Sustainability 16 02222 g007aSustainability 16 02222 g007b
Figure 8. GHG emissions from Mexico’s tourism industry and contribution by category. (a) domestic tourism; (b) inbound tourism. Appendix A, Table A10 shows the CFP calculation results for each product and service item.
Sustainability 16 02222 g008aSustainability 16 02222 g008b
Figure 9. GHG emissions from South Africa’s tourism industry and contributions by category. (a) Domestic tourism; (b) inbound tourism. Appendix A, Table A11 shows the CFP calculation results for each product and service item.
Sustainability 16 02222 g009aSustainability 16 02222 g009b
Table 1. Evaluation countries, data used, and data year.
CountryCODETSAOECD201920202021
AsiaIndonesiaIDN -
Japan *JPN
KoreaKOR --
AfricaSouth Africa *ZAF
Middle EastSaudi ArabiaSAU --
OceaniaAustraliaAUS
North AmericaCanada *CAN --
United States *USA
Latin AmericaMexicoMEX
EUCroatiaHRV --
Czech RepublicCZE
Finland *FIN -
France *FRA
Germany *DEU --
HungaryHUN --
ItalyITA --
LithuaniaLTU
Portugal *PRT --
RomaniaROU -
SpainESP
SwedenSWE
United KingdomGBR -
The asterisk (*) indicates consideration of direct emissions from gasoline combustion. ◯ indicates the data used.
Table 2. Scope of evaluation.
CategoryScope
TransportRailroad passenger transportation business
Road passenger transportation services
Water passenger transportation services
Passenger transportation support services
Transportation equipment rental services
Air passenger transport
Gasoline
Direct emissions from gasoline
SouvenirsSightseeing goods, other products
AccommodationLodging (lodging and real estate)
Food and BeverageFood and beverage provisioning services
ActivitiesCultural services (museums, art galleries, etc.)
Sports and recreation services (amusement-related)
Others
Travel agencies, tour operators, and guidesPassenger agency services and other reservation services
Table 3. Top five contributors to the tourism carbon footprint in Japan.
Domestic TourismInbound Tourism
1Gasoline (direct emissions)Lodgings
2LodgingsFood and beverages
3Food and beveragesCosmetics
4Shinkansen, railroad, monorailAir travel (international)
5Air travel (domestic and local)Confectionery
Table 4. Top 5 categories with largest tourism carbon footprint reductions in Japan.
Domestic TourismInbound Tourism
2020202120202021
1Sports games−87%Air travel (international)−93%Theme parks/
amusement parks
−87%Theme parks/
amusement parks
−94%
2Passport application−84%Exhibition/convention
participation
−91%Cosmetics−85%Cosmetics−93%
3Stage/music viewing−78%Travel agency revenue−86%Travel agency
revenue
−84%Electrical products−92%
4Travel insurance/credit card enrollment−76%Travel insurance/credit
card enrollment
−85%Other transportation expenses−83%Confectionery−91%
5Buses−74%Buses−83%Electrical products−82%Car rental/
car sharing
−91%
Table 5. Changes in GHG emissions, tourism consumption, and employment in Japan.
20202021
GHGConsumptionEmploymentGHGConsumptionEmployment
Transport−50.12%−62.62%0.63%−56.62%−71.02%−6.3%
Souvenirs−58.70%−59.70%−0.08%−65.26%−66.16%0.2%
Accommodation−53.10%−50.55%−9.09%−58.43%−56.45%−18.2%
Food and Beverage−58.88%−57.49%−6.39%−67.37%−66.71%−10.6%
Activities−53.96%−54.68%−1.37%−57.78%−58.91%5.5%
Travel agencies, tour operators guides−72.95%−72.03%-−86.55%−82.26%-
Table 6. Top five contributors to the carbon footprint in the U.S.A.
Domestic TourismInbound Tourism
1Direct emissionsDirect emissions
2Domestic air transportationInternational air transportation
3AccommodationsShopping
4Food and beveragesAccommodations
5GasolineFood and beverages
Table 7. Top 5 categories with largest carbon footprint reductions in the U.S.A.
Domestic TourismInbound Tourism
2020202120202021
1Local bus and other transportation−77%Water transportation−71%All other recreation and entertainment activities−97%All other recreation and entertainment activities−99%
2Rail transportation −77%Rail transportation−60%Local bus and
other transportation
−94%Water transportation−87%
3Gambling−73%Gambling−58%Domestic air
transportation
−94%Shopping−84%
4International air
transportation
−71%International air
transportation
−48%Gambling−93%Local bus and
other transportation
−83%
5Water transportation−67%Domestic
transportation
−35%Taxicab services−90%Motion pictures and performing arts−82%
Table 8. Change in GHG emissions, tourist consumption, and employment in the U.S.A.
20202021
GHGConsumptionEmploymentGHGConsumptionEmployment
Transport−58.39%−60.19%−37.04%−34.98%−33.05%−27.61%
Souvenirs−61.63%−58.20%−54.25%−3.97%0.44%−18.00%
Accommodation−45.17%−40.22%−36.06%−18.55%−14.70%−30.96%
Food and Beverage−57.29%−53.56%−54.77%−1.35%3.34%−17.12%
Activities−57.78%−53.73%−56.31%−36.49%−33.71%−32.50%
Travel agencies, tour operators guides−8.25%−0.07%−28.08%−3.17%1.28%−34.48%
Table 9. Top-five contributors Mexico’s tourism carbon footprint.
Domestic TourismInbound Tourism
1Road transportationFood and beverages
2Lodging with family and friends (imputation)Lodging in traditional facilities
3Air transportationLodging in villa-owned accommodations
4Lodging in traditional facilitiesHandicrafts
5Restaurants, Bars and NightclubsAir transportation
Table 10. Top-five tourism areas experiencing carbon footprint reductions in Mexico.
Domestic TourismInbound Tourism
2020202120202021
1Information services−82%Information services−69%Air transportation−73%Travel agencies and other reservation−49%
2Air transportation−67%Books, newspapers and magazines−65%Professional
services
−66%Health services−45%
3Travel agencies and other reservation −67%Sports and recreation services−58%Transportation-related services−66%Air transportation−43%
4Sports and recreation services−65%Cultural services−56%Lodging in traditional facilities−66%Road
transportation
−35%
5Support services−64%Photographic film and equipment−51%Regional
transportation
−64%Restaurants, bars and nightclubs−31%
Table 11. Change in GHG emissions, tourism consumption, and employment in Mexico.
20202021
GHGConsumptionEmploymentGHGConsumptionEmployment
Transport−59.22%−51.60%−11.97%−34.93%−26.12%-
Souvenirs−35.17%−30.62%−9.79%−11.21%−8.00%-
Accommodation−37.06%−24.82%2.23%−15.08%−5.02%-
Food and Beverage−43.19%−32.01%−17.43%−24.29%−15.02%-
Activities−50.42%−39.46%−26.92%−30.00%−21.96%-
Travel agencies, tour operators guides−66.26%−59.30%−15.35%−56.44%−50.48%-
Table 12. Top-five contributors to the tourism carbon footprint in South Africa.
Domestic TourismInbound Tourism
1Non-specific productsNon-specific products
2Road transportationAccommodation
3Food and beveragesRoad transportation
4Air transportationFood and beverages
5AccommodationFood, beverages and tobacco
Table 13. Top-5 tourism carbon footprint reductions in South Africa.
Domestic TourismInbound Tourism
2020202120202021
1Air transportation−67%Non-specific products−40%Non-specific
products
−99%Non-specific
products
−94%
2Cultural services−66%Automotive fuel−37%Air transportation−86%Air transportation−94%
3Automotive fuel−54%Cultural services−25%Textiles, clothing, footwear and leather goods−84%Household furniture, appliances, articles and equipment−89%
4Food, beverages and tobacco−50%Food, beverages and tobacco−23%Household furniture, appliances, articles and equipment−82%Road
transportation
−85%
5Textiles, clothing, footwear and
leather goods
−47%Direct emissions−22%Road transportation−79%Textiles, clothing, footwear and leather goods−84%
Table 14. Changes in GHG emissions, tourism consumption, and employment in South Africa.
20202021
GHGConsumptionEmploymentGHGConsumptionEmployment
Transport−52.04%−51.19%−6.44%−29.62%−28.07%−7.46%
Souvenirs−54.01%−52.80%−2.09%−49.53%−48.72%−9.70%
Accommodation−45.68%−43.75%−16.75%−23.95%−22.29%−24.04%
Food and Beverage−52.31%−51.06%−15.55%−30.20%−29.09%−17.06%
Activities−49.28%−47.73%−15.15%−20.60%−19.71%−9.24%
Travel agencies, tour operators guides−36.89%−35.29%−26.11%−30.89%−29.46%−27.91%
Table 15. Changes in tourism emission contributions.
LenzenThis Study
Year2013201920202021
Object160 countries20 countries15 countries10 countries
Emission contribution rate (%)8%12.5%6.2%9%
Table 16. CFP comparison with previous literature.
20192020Rate of Decrease
Osorio et al.
(Mt-CO2e)
4818−63%
This study
(Mt-CO2e)
3712−68%
Disclaimer/Publisher’s Note: The statements, opinions and data contained in all publications are solely those of the individual author(s) and contributor(s) and not of MDPI and/or the editor(s). MDPI and/or the editor(s) disclaim responsibility for any injury to people or property resulting from any ideas, methods, instructions or products referred to in the content.

