Abstract
Setting an acceptable pricing strategy to attract prosumers to participate in demand response and orderly configure energy storage is a critical topic for virtual power plants (VPPs) in improving sustainable development. Based on this, this paper proposes a two-layer iterative optimization to develop a customized pricing-based demand response for energy storage with uncertain photovoltaic (PV) for prosumers. In the upper layer, the VPP formulates a customized price consisting of a two-part electricity price, on-grid electricity price and auxiliary service price according to the load characteristics of prosumers, so as to make the power supply and demand of prosumers more controllable. In the lower layer, prosumers adjust their energy storage configurations and energy consumption behavior according to the price signal, considering the uncertainty of PV. The research shows that the proposed optimization approach can encourages prosumers to configure energy storage, and explore user-side flexibility resources. The full utilization of energy storage has increased the PV output of the prosumers by 10%, and its benefits have also increased by 7%.
1. Introduction
With the acceleration of the construction of new power systems, the energy supply and demand balance model is undergoing profound changes in source–load interactions. More and more distributed resources are connected to the user side, making users increasingly transform into prosumers. The increase in the scale of photovoltaic and energy storage not only reduces the user’s electricity purchase demand and reduces the peak load, but also plays a good role in promoting low-carbon sustainable development. However, the randomness, intermittence and uncertainty of renewable energy increase the asynchrony of energy production and utilization, reduce the efficiency of energy utilization and put forward higher requirements for the flexibility of the power system [1]. Virtual power plants (VPPs) can aggregate and manage a variety of distributed energy resources, which is one of the essential ways to address this issue. They can greatly improve the comprehensive regulation ability of a power system, alleviate the tension between power supply and demand and have a broad market prospect [2].
In the VPP, it is crucial to guide prosumers to change their energy consumption behavior by designing a cost-effective demand response mechanism to accommodate renewable energy locally and a smooth load curve. Recently, the price-based demand response has attracted wide attention in peak-shaving and valley-filling [3,4,5]. The existing electricity pricing strategies mainly include time-of-use (TOU) electricity price [6], real-time electricity price [7], peak–valley electricity price [8], demand electricity price [9], on-grid electricity price [10], etc. In [11], authors considered the pricing strategy of a VPP and established a non-cooperative pricing game model of competitive behavior between two VPPs. Reference [12] used a deep deterministic policy gradient algorithm to formulate real-time electricity prices, which proved that it can smooth its power fluctuations and reduce users’ power costs. In fact, a VPP commonly contains commercial users, industrial users and ordinary household users, and their abilities to participate in demand are different. The traditional unified pricing method does not fully explore the characteristics of users’ electricity consumption and response characteristics, which will lead to the lack of active interaction between users and VPP. Therefore, as an innovative price demand response, customized pricing may become a future trend in the reform of the electricity market environment.
For the user side, effectively managing the uncertainty of renewable energy power generation is crucial for lowering electricity costs. The optimization methods to address the uncertainty of renewable energy output mainly include stochastic optimization [13], fuzzy optimization [14], robust optimization [15] and interval optimization [16]. Among them, the scheduling solution obtained by fuzzy optimization can effectively capture the attitude of the dispatcher, but the solution obtained by the model has a high degree of subjectivity. Robust optimization does not require a distribution model or fuzzy membership function for uncertain parameters. However, it is a semi-infinite optimization problem that can be tough to solve directly. Interval optimization can locate all of the problem’s minimal points within a specified precision, simplifying the optimization procedure and saving storage space. However, because its iterative approach does not take into account variable correlation, it is inefficient. Stochastic optimization is an effective method to solve uncertainty and randomness through random sampling technology or probability risk level. Common stochastic optimization methods include chance-constrained optimization, mean variance optimization and conditional value at risk [17]. This kind of method considers the constraints of random variables and the decision before execution when solving the optimization problem, and can effectively evaluate the decision risk of the photovoltaic (PV) prosumer.
In addition, the profitability of PV systems in mature markets also depends on the coordination between the energy needed and the energy produced [18]. On the demand side, prosumers can improve the renewable energy consumption rate and reduce the peak load by configuring energy storage and exerting its time shift characteristics. In [19], the author proposed a peaking potential evaluation model for the adjustable user load in VPP. The model can well describe the characteristics of users in VPP and obtain better economic benefits. In [20], a price-based energy storage leasing mechanism considering market price and battery degradation was proposed to provide VPP with short-term access to energy storage in a new model. In addition, the effective management and integration of energy storage systems can mitigate the uncertainty associated with renewable energy. Reference [21] proposed a novel scale optimization method for off-grid renewable energy systems, providing an accurate analysis of the distribution of exchange energy among storage elements, thereby enhancing the reliability of energy storage devices and the utilization of renewable energy. Reference [22] enhanced energy storage integration by supporting primary renewable green energy, employing a virus colony search algorithm, and demonstrating its reliability at minimal power costs. Furthermore, in [23], the authors comprehensively summarized energy storage management methods and highlighted the significant benefits of integrating energy storage into renewable energy systems. Additionally, in [24], the authors introduced a home energy management system that considers both electricity utilization and sales to the main grid, resulting in substantial reductions in household energy costs.
However, due to the high investment cost and low utilization rate of energy storage, the user’s investment willingness is not high, which seriously hinders the development of user-side energy storage. How to improve the use value of energy storage while maximizing return on investment is an extensively studied subject among local and international experts. Reference [25] evaluated the economic efficiency of the VPP model based on energy storage, and proved that the model is affected by several factors such as energy price and energy production. In [26], a new mathematical strategy was proposed to identify different types of transactions considering the VPP effect in the electricity market, and ultimately maximize the benefits. In addition, the author also emphasized the impact of ancillary services on VPP transactions. Reference [27] analyzed the technology and economy of the energy storage system in VPP, and discussed its ability to reduce the peak cost.
In order to delineate the limitations of existing methodologies more distinctly, Table 1 provides a comprehensive overview of the literature pertaining to optimal electricity pricing, along with corresponding comparisons. A careful examination of the existing literature reveals the following observations:
- (1)
- The majority of the existing literature on two-layer optimal electricity pricing focuses on consumer behavior. However, with the rapid advancement of renewable energy technologies, the imbalance between energy supply and demand has intensified. The integration of PV power generation and energy storage will wield considerable influence over the formulation of electricity pricing. Likewise, these pricing frameworks will also impact the deployment strategies for PV systems and energy storage solutions.
- (2)
- Prevailing two-layer electricity price optimization predominantly concentrates on TOU or real-time electricity pricing, neglecting a comprehensive examination of diverse pricing models such as auxiliary service subsidy rates and on-grid electricity price. Nevertheless, the establishment of these varied electricity pricing schemes plays a pivotal role in fostering the assimilation of new energy technologies and expanding the capacity of energy storage facilities at the consumer level. For instance, the implementation of auxiliary service subsidies serves as an effective strategy for mitigating the substantial initial investment costs associated with energy storage solutions.
- (3)
- The existing literature on electricity pricing often overlooks the load characteristics of prosumers, resulting in a lack of specificity in pricing formulation. For instance, variations in peak, off-peak, and flat periods of electricity consumption are not adequately accounted for, despite their significance in determining optimal pricing structures. Additionally, the introduction of renewable energy sources significantly alters the consumer’s load curve, directly influencing the efficacy of pricing strategies.

Table 1.
Survey of previous studies on optimal electricity pricing.
Table 1.
Survey of previous studies on optimal electricity pricing.
| References | Prosumer | Demand Price /TOU Price | On-Grid Price /Auxiliary Subsidy Price | Load Feature | PV Uncertainty | Energy Storage Configuration |
|---|---|---|---|---|---|---|
| [1] | × | ×/× | ×/× | √ | √ | √ |
| [5] | √ | ×/× | ×/× | √ | √ | √ |
| [6] | √ | ×/√ | ×/× | √ | × | × |
| [13] | √ | ×/√ | ×/× | √ | × | × |
| [16] | × | ×/√ | ×/× | √ | × | × |
| [26] | × | ×/× | √/× | × | √ | √ |
Therefore, this paper proposes a customized pricing-based demand response model to study more effective pricing methods to guide different kinds of users’ electricity consumption behavior. The main innovations of this paper are as follows:
- •
- Addressing the variances in users’ electricity consumption behaviors, this paper proposes a two-layer iterative customized pricing strategy designed to incentivize user participation in demand response initiatives;
- •
- The upper VPP pricing incorporates two-part electricity price, on-grid electricity and auxiliary service subsidy. Concurrently, lower-tier prosumers optimize their benefits through an energy storage configuration model that accounts for PV uncertainties and auxiliary service. This comprehensive approach aims to encourage users to judiciously manage the costs associated with power supply and consumption;
- •
- This paper conducts simulations and analyses across various pricing strategies, evaluating aspects such as energy trading volumes, energy storage configurations, and PV output. The results serve to validate the rationale and efficacy of the proposed customized pricing-based demand response framework.
The remainder of this essay is structured as follows. The specific composition of the VPP and prosumer model is described in Section 2. Section 3 introduces the specific solution process of the proposed two-layer iterative model. In Section 4, the simulation results of the model are described in detail. Finally, Section 5 summarizes the results.
2. System Framework
2.1. The Pricing Model of VPP
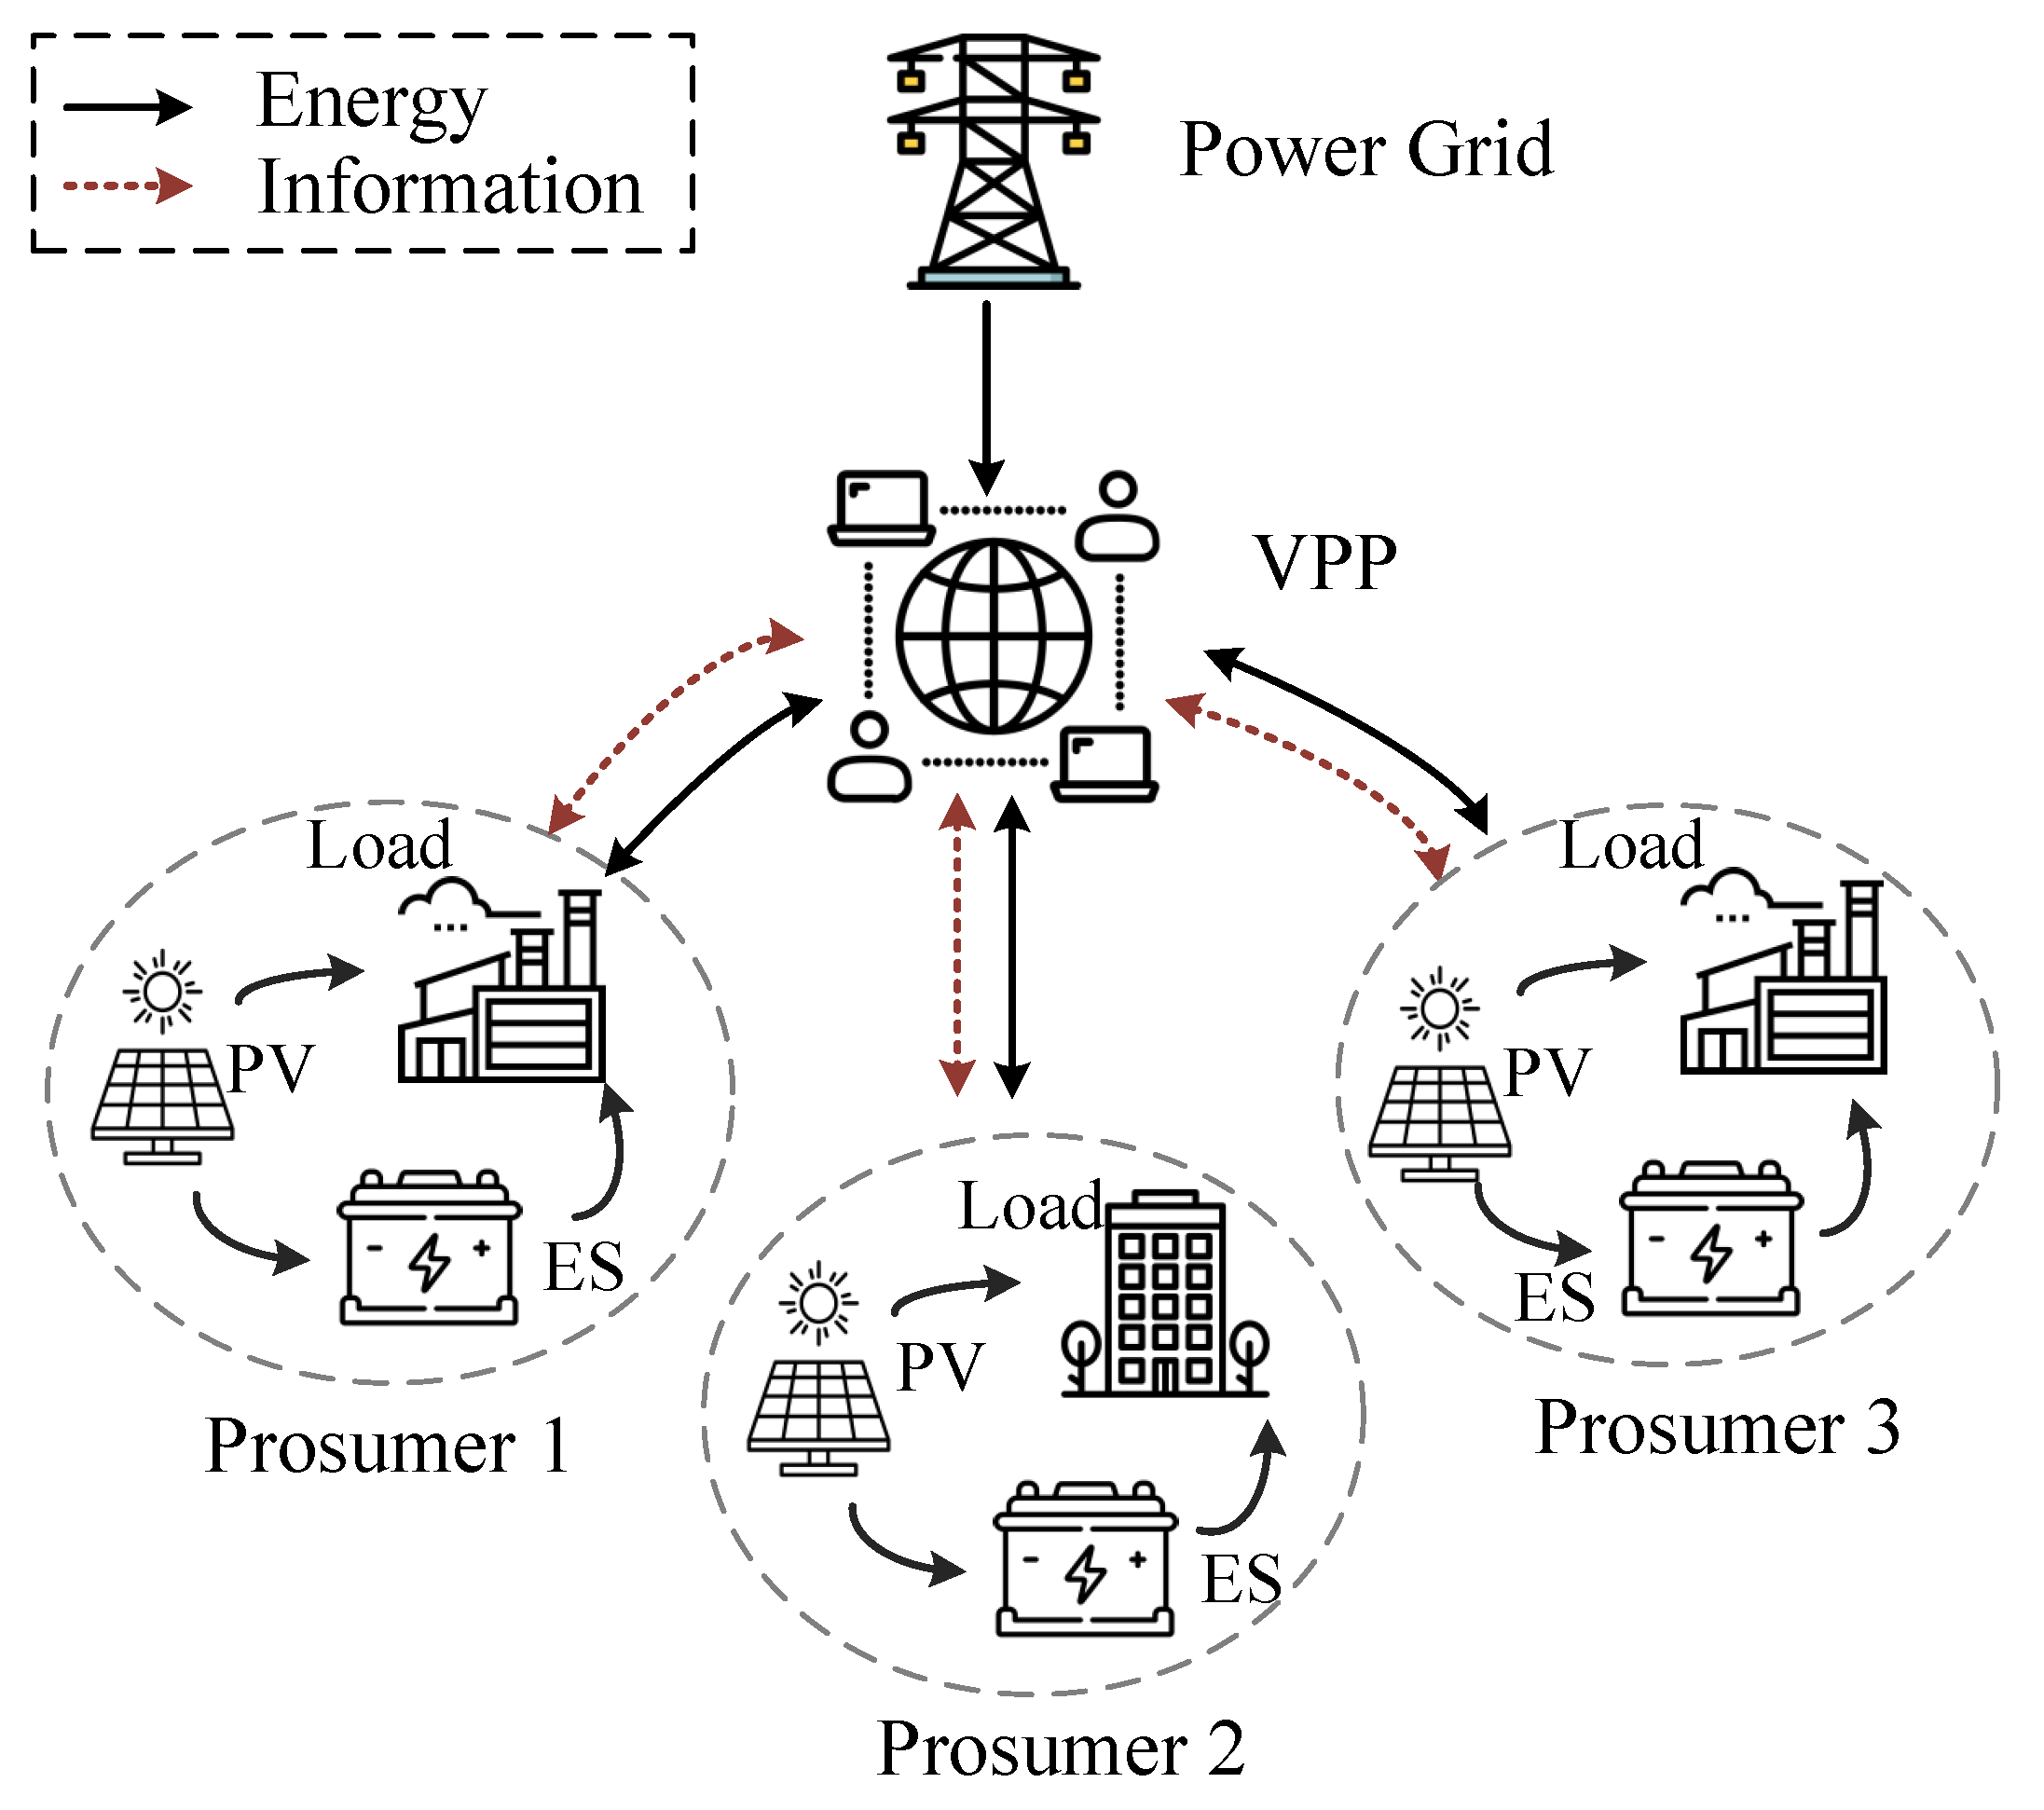
The system framework studied in this paper is illustrated by Figure 1. A VPP is an integrated energy system that provides reliable, efficient, and dispatchable power services by integrating and managing a variety of distributed energy resources of prosumers, including renewable energy, energy storage, and traditional decentralized power generation equipment. The pricing strategy of VPP can vary from region to region, market conditions and system requirements, usually involving a variety of electricity prices. The following is the introduction and analysis of the electricity price involved in this model.
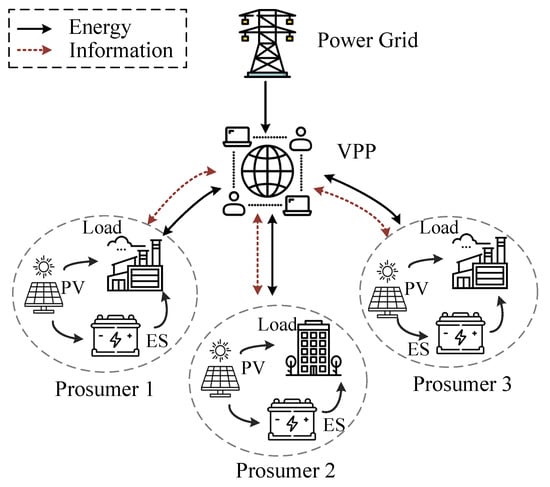
Figure 1.
System framework diagram.
2.1.1. The Model of TOU Price
TOU pricing is the most common electricity pricing mechanism, which adopts different standards for electricity charges according to different time periods. This pricing strategy aims to reflect the cost and demand changes of the power system in different time periods to encourage users to reduce electricity consumption during peak periods and increase electricity consumption during trough periods, thereby optimizing the load balance and resource utilization of the system. The setting of TOU electricity price is usually divided into three periods, which are expressed by , respectively. On this basis, in order to improve the enthusiasm of users to participate in demand response, this paper is devoted to the study of customized TOU electricity prices based on different prosumers, where k is the type of prosumer. Due to the differences in the electricity consumption behavior of prosumers, the peak and valley periods of different prosumers are different, and the corresponding TOU electricity prices are also different.
A critical basis for dividing the peak-valley-flat period is to take into account the electricity consumption behavior and demand patterns of different users, so as to ensure that the division of the peak-valley period meets the actual needs of users, guides users to use electricity more intelligently in different time periods, and promote the load balance and resource utilization efficiency of the power system. Therefore, VPP needs to divide the H time intervals of a day into corresponding peak period, flat period and peak period according to the load curve of each prosumer. The specific model is as follows:
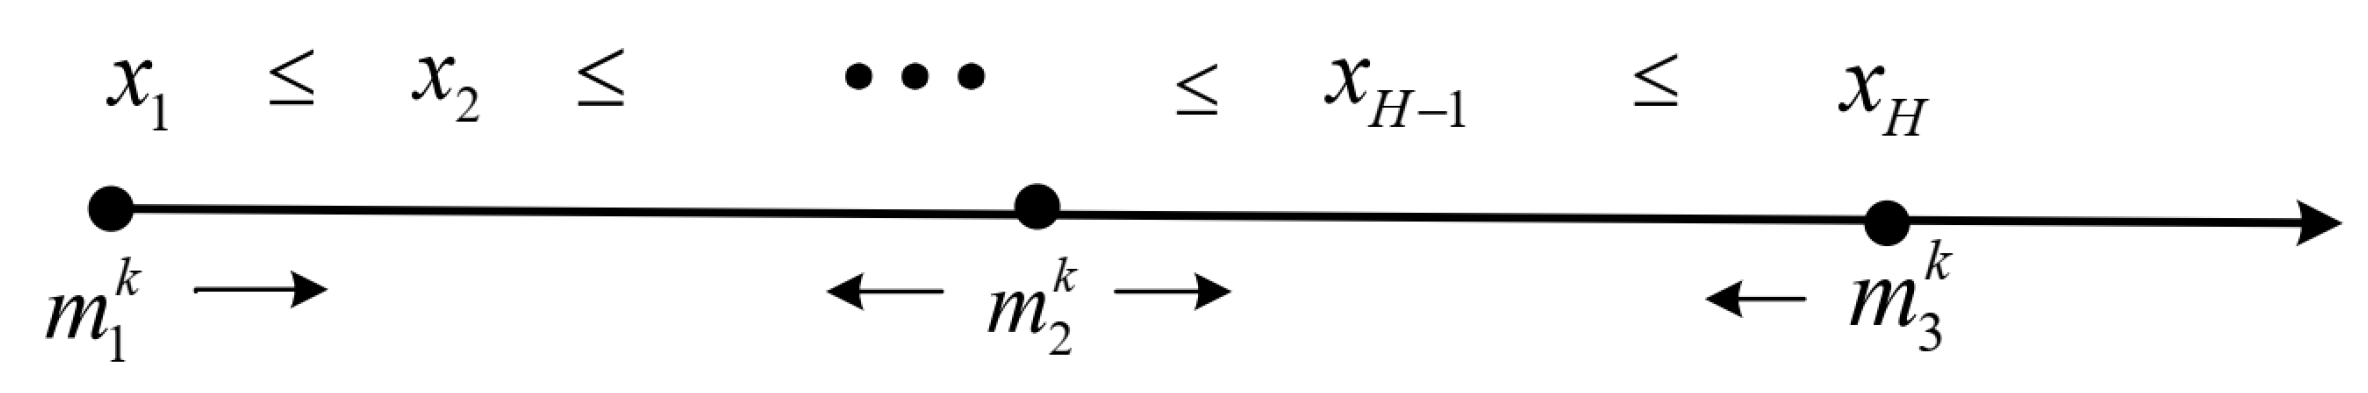
Taking prosumer k as an example. Firstly, we define , , , . Then, the absolute values of the difference between the net load value of each time and , and are calculated respectively. According to the principle of shortest distance, three periods are divided, as shown in Figure 2. The specific establishment criteria are as follows:
where are the valley, flat, peak period set of prosumer k, respectively. is the relevant statistics of the net load change of prosumers, when j takes 1, 2 and 3, it corresponds to the minimum, intermediate and maximum values of the net load at a time interval within a day, respectively. denotes the power demand of prosumer k in time h, and denotes the PV power of prosumer k in time h, , .

Figure 2.
The fast iteration algorithm.
Under the TOU electricity price, the electricity consumed by the prosumers in different time periods will be billed according to the corresponding electricity price, and the resulting electricity price is the electricity tariff, which is specifically expressed as:
where is the electricity tariff that the prosumer k needs to pay, is the power that the prosumer k needs to purchase from the VPP in the time h, and is the duration of each time interval.
2.1.2. The Model of Demand Electricity Price
Demand price is another pricing method, which is mainly based on the maximum power demand of prosumers in a specific period of time. This is a billing mechanism commonly used by commercial and industrial power users to reflect the cost of maintaining sufficient power supply capacity in the peak period of the power system, which can encourage users to reduce peak demand by reducing electricity consumption or using energy storage equipment. The demand price is expressed by , and the corresponding electricity charge charged by the demand price is the demand tariff. In actual power consumption, the demand tariff is charged monthly according to the product of demand price and maximum power demand. In this paper, the maximum demand is simplified into the maximum value of average load per time slot in a day, and then the demand tariff is divided equally into each day for analysis and calculation, which is specifically expressed as:
where is the demand tariff of prosumer k and a month assumes 30 days.
Demand price and TOU price together constitute a two-part electricity price, which is also a widely studied pricing mechanism. This structure aims to more fully reflect the actual cost of the power system and provide users with more electricity choices and incentives.
2.1.3. The Model of On-Grid Price
On-grid electricity price is one of the key mechanisms to support the development of renewable energy. By setting reasonable electricity prices and policy frameworks, encouraging more investment in renewable energy will help promote the sustainable development of clean energy. PV on-grid price refers to the price of electricity generated by solar PV power generation facilities injected into the power system and traded with the power grid. It usually adopts a fixed subsidy or pricing mechanism to ensure the economic feasibility of solar power generation. The PV on-grid price is expressed by . Under this price, the prosumers can sell electricity to VPP and obtain benefits during the period of abundant PV. In this paper, in addition to the use of energy storage for self-consumption, the excess PV generated by prosumers will be sold to the VPP according to the on-grid price, without considering the situation of PV abandonment. The specific expression is as follows:
where is the profit of PV of prosumer k to sell electricity to VPP, and is the power supplied by prosumer k to VPP in time h.
2.1.4. The Model of Auxiliary Service Subsidy Price
With the increase of the proportion of renewable energy, the power system is facing new challenges, such as load fluctuation, frequency adjustment and grid instability. Energy storage technology can be used as an effective solution, but its cost is high. Subsidies can reduce the investment risk of energy storage projects, promote the wide application of energy storage technology, and provide diversified economic opportunities for energy storage systems. It should be noted that the subsidy policy for ancillary services should be reasonably formulated and adapted to market demand, technological innovation and cost reduction to avoid excessive subsidies leading to waste of resources or bad market behavior. Energy storage subsidies can be divided into various forms. This paper mainly studies demand response subsidies and emergency energy supply subsidies.
Demand response refers to balancing the supply and demand relationship of power system by reducing or delaying the demand for electricity during the peak load of power system. Energy storage can play a key role in demand response. Demand response subsidy for energy storage refers to the economic benefits brought by the implementation of demand response strategy through energy storage system. The rational formulation of the demand response subsidy price can encourage energy storage to participate more flexibly in the electricity market, provide the required services, and achieve higher economic benefits when supply and demand fluctuate. The subsidy for energy storage participating in demand response can be expressed as:
where is the demand response subsidy of the prosumer k, is the demand response subsidy price, is the power value participating in the demand response, and is the number of times it participates in the demand response.
Emergency power supply refers to the temporary measures taken to ensure power demand for specific areas or users in the event of emergencies or system failures [28]. This mode of power supply is typically employed during power system failures, natural disasters, or other unforeseen circumstances. The advent of energy storage technologies and prosumer participation introduces new options and opportunities for emergency power supply [29]. The VPP incentivizes prosumers to invest in energy storage by offering subsidies, enabling prosumers to utilize their energy storage systems as emergency power sources in alignment with the VPP’s auxiliary service policy. In return, prosumers receive subsidies when supplying power during interruptions. This policy not only enhances power system stability during emergencies but also encourages investment and growth in user-side energy storage solutions [30,31]. Emergency energy supply subsidy can be expressed as:
where is the emergency energy supply subsidy for the prosumer k, is the emergency energy supply subsidy price, is the nth emergency power supply quantity, is the number of emergency energy supply, and is the probability coefficient of emergency power supply. The selection of the probability coefficient of emergency power supply subsidy usually needs to consider many factors, including the potential emergency power supply demand, the reliability of the power supply system, and the probability of past emergency events. Its setting is designed to reflect the possibility of emergency power supply in different scenarios [32].
2.2. The Optical Storage Configuration Model of Prosumers
With the changes in the electricity market and the maturity of renewable energy technologies, the prosumers with PV and energy storage have gradually become more attractive. The emergence of optical storage users can promote the utilization of renewable energy, reduce the demand for electricity purchase, and improve the autonomy of electricity consumption. However, the strong uncertainty of PV power generation and the high investment cost of energy storage have become obstacles to the transformation of many users. Therefore, based on these two problems, this paper establishes a model of prosumers to help prosumers choose the optimal configuration strategy.
2.2.1. The Model of PV Uncertainty
PV power generation is the process of converting solar energy into electrical energy using PV effects. PV power generation has the following characteristics: First, solar energy is sustainable and environmentally friendly as a renewable energy source. Secondly, once the PV power generation system is installed, it usually only needs basic maintenance, such as regular cleaning of solar panels, so it has lower maintenance costs. Third, PV power generation is affected by weather conditions and is intermittent, that is, power generation capacity will decline at night and inclement weather conditions. It is worth noting that although PV power generation is affected by weather conditions, due to the regularity and predictability of sunshine, it is possible to predict future power generation through meteorological data and prediction models, so as to better plan and manage PV power generation. Therefore, from the perspective of risk aversion, this paper proposes a probability interval optimization-based stochastic model to evaluate the risk associated with uncertain PV. This model involves several steps. Firstly, we generate a confidence interval to capture the uncertainty in PV generation. Subsequently, we quantify the risk of uncertain PV by deriving the expected power not served (EPNS) and expected power curtailment (EPC). Finally, a risk assessment model based on stochastic optimization is formulated to assess the impact of PV uncertainty on the income of prosumers.
According to the literature [33,34], the PV forecasting error always exists and cannot be avoided even using the best forecasting methods. In fact, in short-term scheduling scenarios such as the day-ahead dispatch, it is commonly accepted to assume that the PV forecasting error can be reasonably described by a Gaussian distribution [35]. Additionally, the use of a Gaussian assumption is supported by the Central Limit Theorem, which posits that the sum of a sufficiently large number of independent, non-Gaussian random variables tends toward a Gaussian distribution [36]. Based on this rationale, we have employed a Gaussian distribution to model the uncertain PV in our original manuscript. Taking prosumer k as an example, assuming that the forecast error of its PV power follows Gaussian distribution, and the stochastic nature of PV power generation can be expressed as a probability density function :
where and are the forecasted value and standard deviation of PV power in time h, respectively.
For convenience, we use to represent the upper and lower confidence intervals of prosumer k in time h, respectively. When the actual PV output of prosumer is greater than the predicted value, if the energy storage capacity is insufficient, there will be a risk of PV abandonment. We use to represent the EPC of prosumer k in time h, and the calculation formula is:
On the other hand, when the actual PV output of prosumer is less than the predicted value, it will lead to the risk of load loss for prosumer. In order to ensure their own benefits, prosumers have to pay additional electricity tariffs to purchase electricity from DSO. We here use to represent the EPNS of prosumer k in time h, and the calculation formula is:
2.2.2. The Model of Energy Storage Cost
The main cost of energy storage is composed of two parts: investment cost and operation and maintenance cost. For the investment cost, the unit energy storage capacity investment cost of prosumer k can be denoted as . In order to facilitate the formulation of the optimization problem, the investment cost can be converted into the daily cost , where , is the scale factor. To derive , we first use the annual interest rate r to calculate the present value of the annuity (a series of equal annual cash flows), and then divide the annuity equally into each day. Therefore, the expression of factor is as follows:
where y is the service life of the battery and is the total number of days in a year.
The operating cost of energy storage is an essential component for maintaining the power station in a standby state, and it is directly proportional to the power used for charging and discharging the energy storage. The operation cost of energy storage in a day can be expressed by , and its calculation formula is:
where is the technology-specific degradation slope parameter, is the cost coefficient of energy storage, and are, respectively, the power of energy storage charging and discharging of prosumer k in time h.
It should be noted that comes from two parts: One is the purchase from VPP, represented by , and the rest is the excess PV power, represented by . So , with .
Based on this, the volume of transactions between PV prosumer and VPP can be further expressed as:
where indicates that the energy storage acts as a load, and prosumer purchases electricity from VPP. Conversely, if , energy storage acts as a power source.
3. The Solution of the Model
3.1. Upper Layer: The VPP Model
(1) Objective function
where R is the total profit of VPP in one day, is the electricity tariff that the prosumer k needs to pay, is the demand tariff of prosumer k, is the profit of PV of prosumer k to sell electricity to VPP, is the demand response subsidy of the prosumer k, is the emergency energy supply subsidy for the prosumer k. In order to describe the relationship between power generation and power generation cost more accurately and improve the accuracy and reliability of cost prediction, the power generation cost of VPP is expressed as a quadratic function, where h, g are the coefficients of the quadratic cost function [37,38]. G is the total energy that VPP needs to purchase from the power producer in one day, which can be expressed as:
(2) Constraints
The formulation of electricity price should ensure the profit of users to a certain extent while achieving peak-shaving and valley-filling. The constraint can be expressed as:
where is the achievable welfare of the kth prosumer under the CPoE, is the kth user’s most desirable welfare value, and is the scaling factor. In this study, we set to ensure that the pricing decision made by the VPP guarantees that the prosumer’s benefit is not less than 93% of its ideal value.
In addition, to encourage prosumers to consume renewable energy locally, the on-grid price should not be higher than the valley period price:
3.2. Lower Layer: The Prosumer Model
(1) Objective function
where is the benefit of prosumer k in one day, is the electricity tariff that the prosumer k needs to pay, is the demand tariff of prosumer k, is the profit of PV of prosumer k to sell electricity to VPP, is the demand response subsidy of the prosumer k, is the emergency energy supply subsidy for the prosumer k. is the TOU price corresponding to the prosumer k in time h. In addition, various choices of utility functions are widely utilized in communication and network literature [39]. However, research indicates that the behavior of power users can also be effectively modeled using specific utility functions [40]. In [41], a detailed description of the selection process for the coefficients of the quadratic utility function for power users is provided. Building upon this analysis, and considering the electricity demand and behavior patterns of the users in our study, we have determined the utility function utilized in this paper, where and are the two utility function coefficients of prosumer k, respectively.
(2) Constraints
Energy storage constraints: To ensure the normal operation of energy storage device, the decision-making of the prosumer needs to meet the maximum power constraints, charge state constraints and power balance constraints in the charging and discharging processes. Specifically, energy storage constraints can be expressed as follows:
where (20a) ensures that energy storage charging and discharging cannot be performed simultaneously. Next, (20b) and (20c) are, respectively, the active power limits of energy storage charging and discharging for the prosumer k, is the maximum charging and discharging power at each time, while (20d) represents the formula used to calculate the rated energy storage capacity of prosumer k, is the state of charge (SOC) and is the remaining amount of energy storage in time h of prosumer k. Further, (20e) is the remaining power constraint for the energy storage, where , are the constraint coefficients of the energy storage system. In order to ensure the stability, efficiency and prolong the service life of the battery, the SOC limits, represented by and , are set to 0.2 and 1, respectively. In addition, (20f) indicates that the electrical energy of energy storage in time h related to the charging and discharging in time , is the charging and discharging power efficiency. Finally, (20g) characterizes the charging and discharging balance constraint of the energy storage over one day.
Demand response constraints: Demand response needs to meet the maximum load and average load of the response period should not exceed the corresponding value of 5 days before the response day. The relevant constraints are as follows:
where i is the response time of the demand response day, j is the corresponding time of 5 days before the response day; T is the time set of demand response; is the maximum value function of the element; is the arithmetic mean value function of the element; is the annual maximum load value.
Emergency power supply constraints: The emergency power supply constraint of energy storage should be limited by the single charge and discharge power of energy storage, which is expressed as:
where is the maximum power allowed for a single power supply of energy storage.
3.3. The Process of Solving
According to the introduction of the system framework, the two-layer pricing optimization can be described as:
(1) Upper layer (VPP):
(2) Lower layer (prosumers):
The specific implementation processes of the two-layer iterative pricing optimization are as follows:
Step 1: Users firstly submit their own load curve to DSO.
Step 2: According to Equations (1)–(3), VPP uses the fast iterative algorithm to divide the customized peak–flat–valley period of each type of prosumer.
Step 3: Considering the time period and the current two-part tariff, on-grid tariff and auxiliary service subsidy tariff, the prosumers determine the optimal energy storage configuration and the participation of auxiliary services according to Equation (19), and adjust their energy consumption behavior.
Step 4: VPP receives the decision information of prosumers, and then, according to Equation (15), VPP updates the two-part electricity price and the subsidized electricity price, and broadcasts the price information to prosumers, so that they can manage their own production and consumption behavior to adapt to renewable energy and adjust peak load. If the prosumers’ total welfare is basically unchanged compared with the previous iteration, stop the iteration; otherwise, go to 2.
4. Case Study
In this paper, three prosumers are selected to participate in customized pricing based demand response, and the corresponding optimization model is built. The optimization cycle is 24 h, setting , and the optimization time interval h. In order to make the simulation results more universal, this paper uses a typical daily load curve. The initial TOU electricity price does not consider the difference between prosumers. According to [42,43], the peak, valley and flat electricity prices are set to 0.9857 CNY/kWh, 0.4192 CNY/kWh, and 0.7027 CNY/kWh, respectively. The demand electricity price is 38 CNY/kW, the on-grid electricity price is 0.394 CNY/kWh, the subsidy electricity price for demand response is 15 CNY/kWh, and the subsidy electricity price for emergency power supply is 22 CNY/kWh. In order to better show the participation of prosumers in auxiliary services, the demand response period is set in times 68–76, and the emergency power supply period are set in times 20, 48 and 90 respectively.
The model in this paper is formulated as a quadratic mixed-integer optimization problem, and the solution is obtained using the Gurobi solver. Gurobi is a high-performance mathematical optimization solver widely utilized in various fields, including linear programming, integer programming, mixed-integer programming, quadratic programming, constrained optimization, among others [44]. It is known for its fast solving speed and efficient memory management, capable of finding optimal or near-optimal solutions within a short time frame. The upper layer of the model required 1936 iterations and 0.20 s to converge to a solution. The lower layer of the model required 3998 iterations and 0.04 s to converge to a solution.
4.1. The Results of Period Partition and Pricing
Figure 3 illustrates the period partition result of the three prosumers. For the three users who are prosumers, they all belong to the valley period in the times 40–60 when the PV power generation is sufficient, and there is no need to purchase energy from VPP at this time. In the periods of 1–10 and 20–40, the period partition results of different prosumers have their own characteristics, which are affected by the number of PV production capacity and the overall electricity consumption behavior, which also highlights the necessity of implementing customized pricing for different types of prosumers.
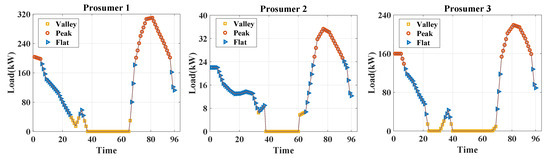
Figure 3.
Peak–flat–valley period partition of prosumers.
Table 2 provides the final pricing result of VPP. For the TOU electricity price, the results show that the greater the power consumption of prosumers, the higher the peak-to-valley difference. The peak-to-valley difference of prosumer 1 reaches 0.99, which can better motivate prosumers to adjust their electricity consumption behavior and adjust their electricity consumption. The demand price will be lower than before, and VPP is more inclined to adjust the peak load by increasing the peak period price. Due to the difference in the responsiveness of different prosumers to emergency power supply, the subsidy price of emergency power supply is higher than before, which can not only better encourage prosumers to participate in emergency power supply, but also promote the demand side to expand the configuration scale of optical storage.
Table 2.
VPP’s two-part electricity price, on-grid price and auxiliary service subsidy price pricing results for prosumers.
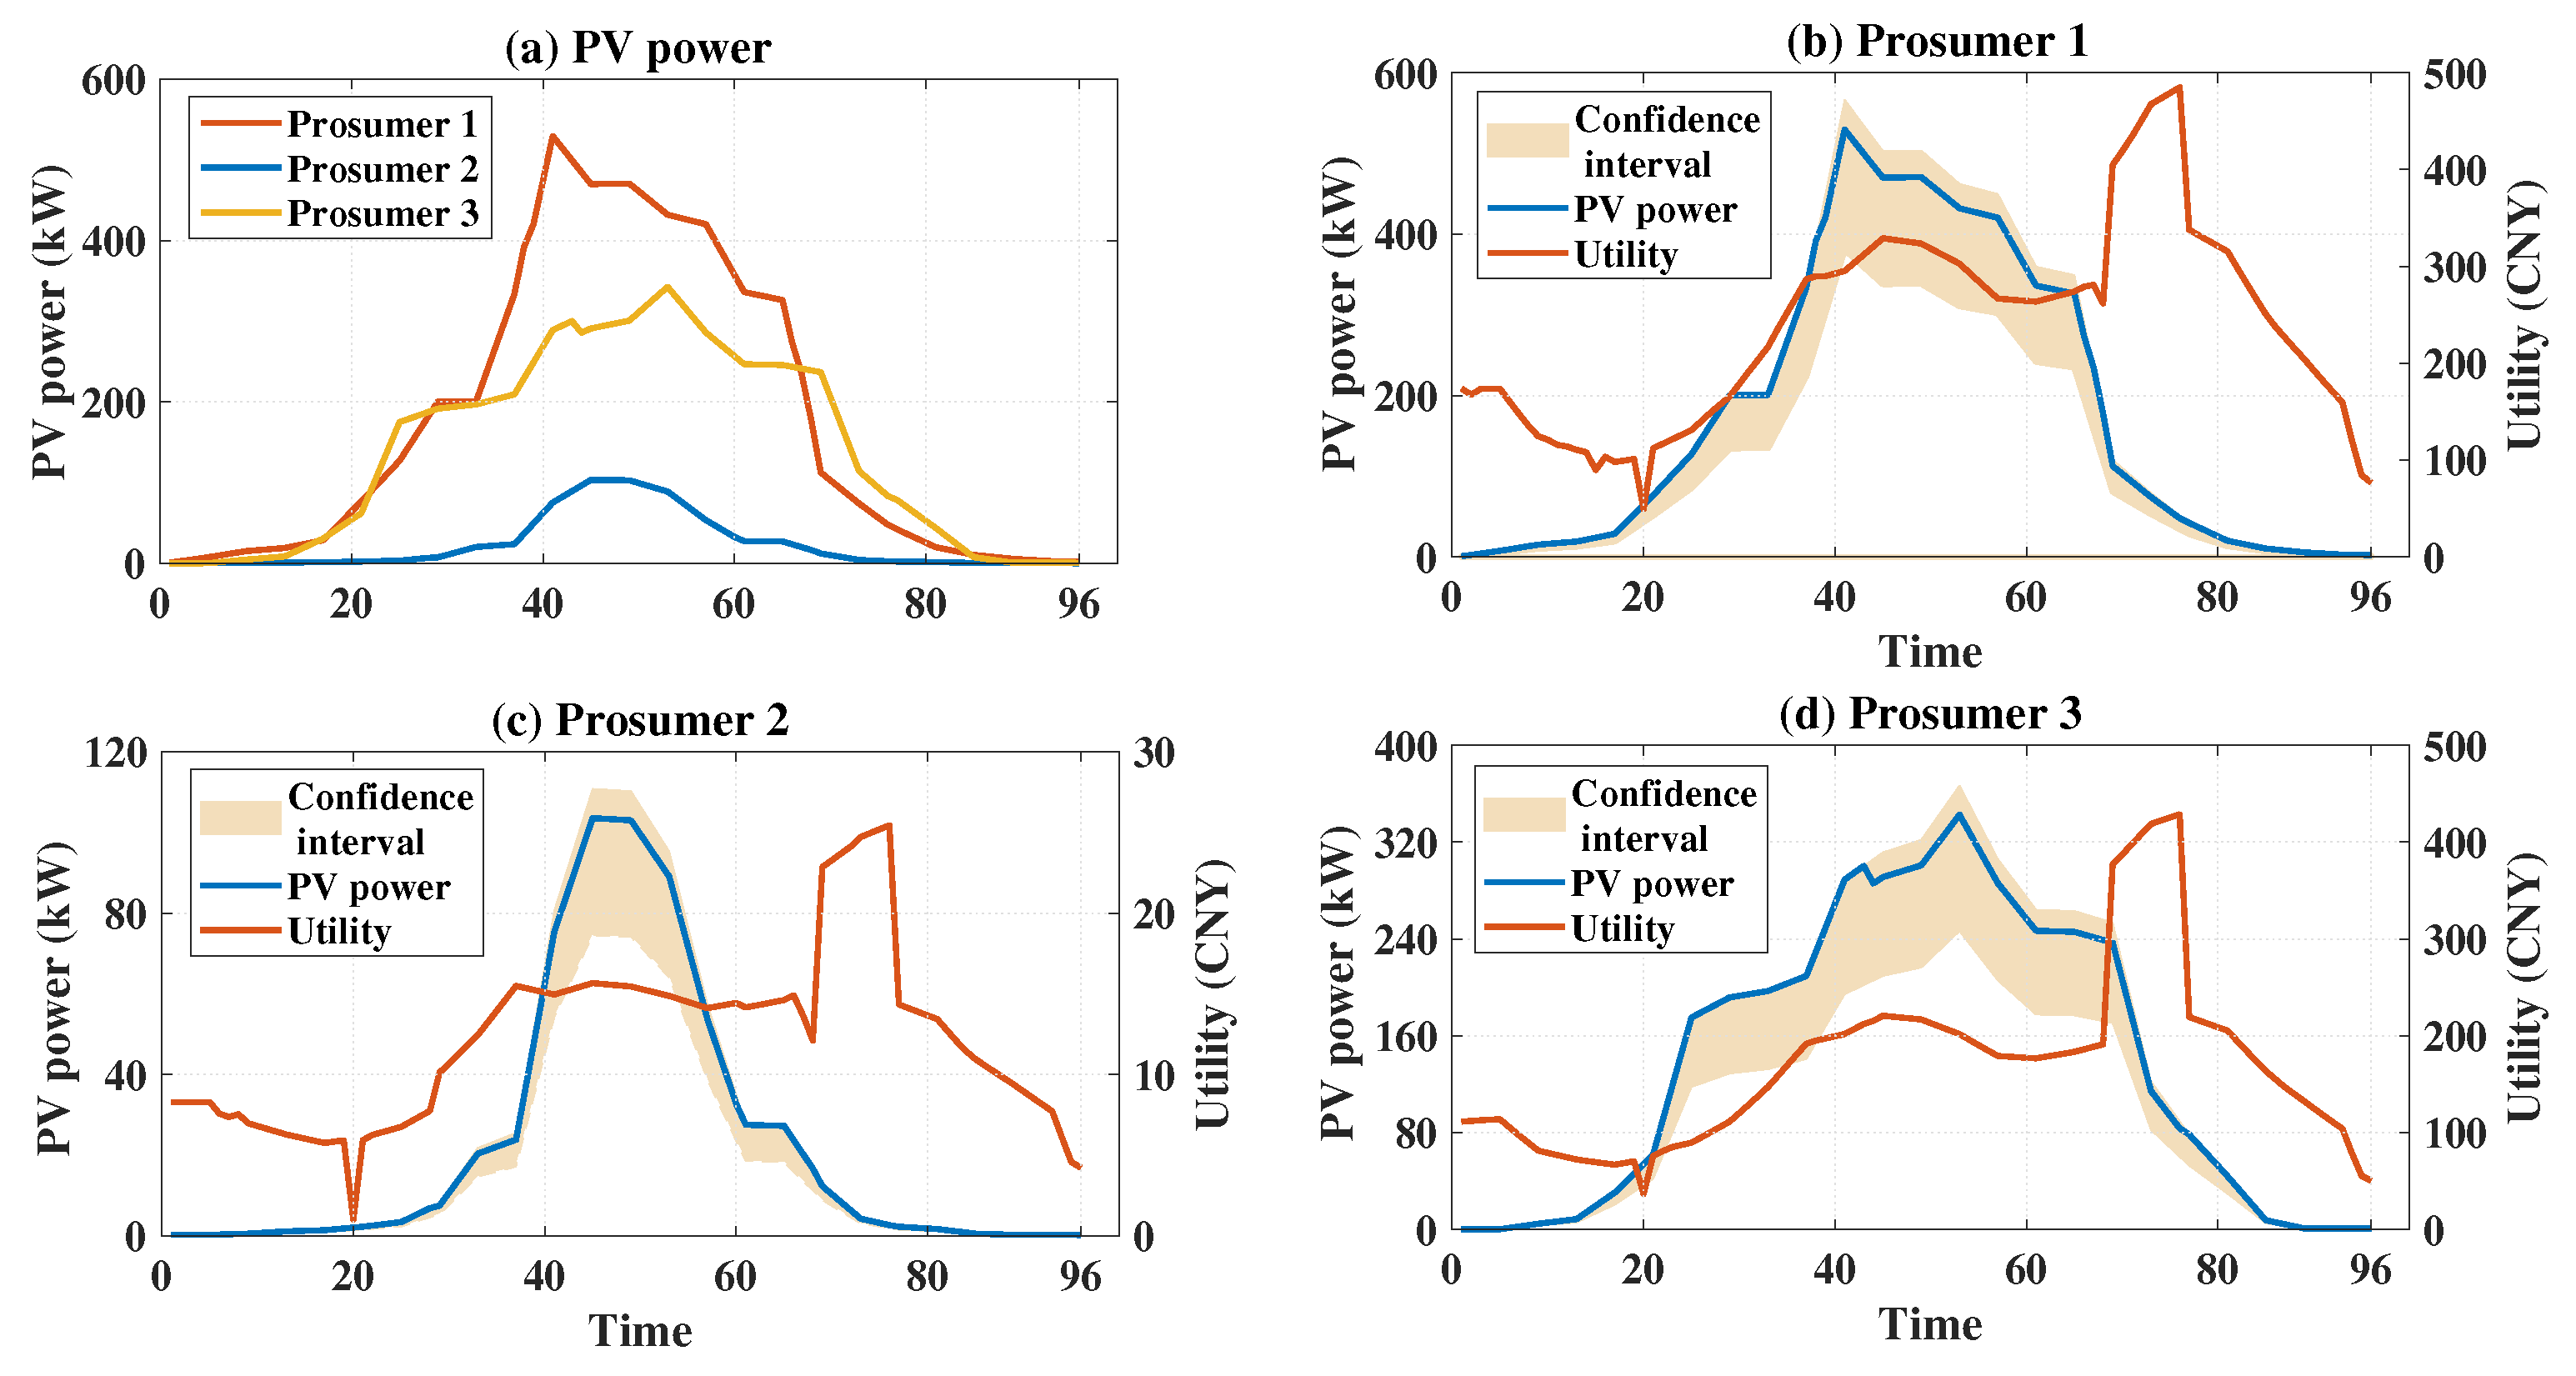
4.2. Analysis of Optimization Results of PV Uncertainty
Figure 4 shows the optimization results of PV capacity after considering PV uncertainty. The shadow part in the figure represents the confidence interval of its PV fluctuation. It can be found that the PV output results tend to select the maximum value in the interval. This shows that under this pricing strategy, prosumers prefer to be self-sufficient as much as possible, even if such a result may bear certain risks. Table 3 shows the specific variation of PV capacity after considering uncertainty. The PV capacity increased from 7185.77 to 8196.97, an increase of 10%. The results show that evaluating the uncertainty risk of PV power generation can better promote the enthusiasm of producers and consumers to configure PV and improve the renewable energy production on the user side.
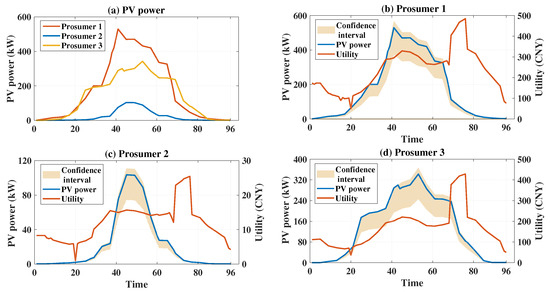
Figure 4.
Optimal PV power and utility of prosumers considering uncertainty.
Table 3.
PV energy comparison of prosumers (kWh).
4.3. The Influence of Different Pricing Strategies on Energy Storage Configuration
Table 4 shows the allocation results of energy storage capacity of prosumers under different pricing modes, including two-part tariff without considering ancillary services (Strategy 1), two-part tariff only considering demand response subsidy (Strategy 2), pricing considering energy storage subsidy but not considering demand price (Strategy 3), and two-part tariff considering energy storage subsidy (Strategy 4). Firstly, comparing strategy 1 with several other strategies, it can be found that without considering ancillary services, that is, under the existing two-part electricity price, the energy storage capacity of prosumers is small, less than 20% of strategy 4. This proves that the high cost and low return of energy storage are the key factors restricting its development. The pricing strategy proposed in this paper can promote the development of user-side energy storage. Secondly, strategy 2 takes into account the demand response subsidy of energy storage on the basis of strategy 1. Compared with strategy 1, the energy storage capacity has a large-scale increase, by more than four times. Among them, the energy storage capacity of prosumer 1 has increased to 4.4 times the original, and the energy storage capacity of prosumer 3 has increased to 12 times the original. Compared with strategy 2 and strategy 3, strategy 3 adopts a single pricing, while strategy 2 considers two-part pricing. From the results, the energy storage capacity under strategy 3 is only reduced by 3%, which indicates that the demand price has little effect on the energy storage configuration.
Table 4.
Energy storage capacity configuration of prosumers under different pricing strategies (kWh).
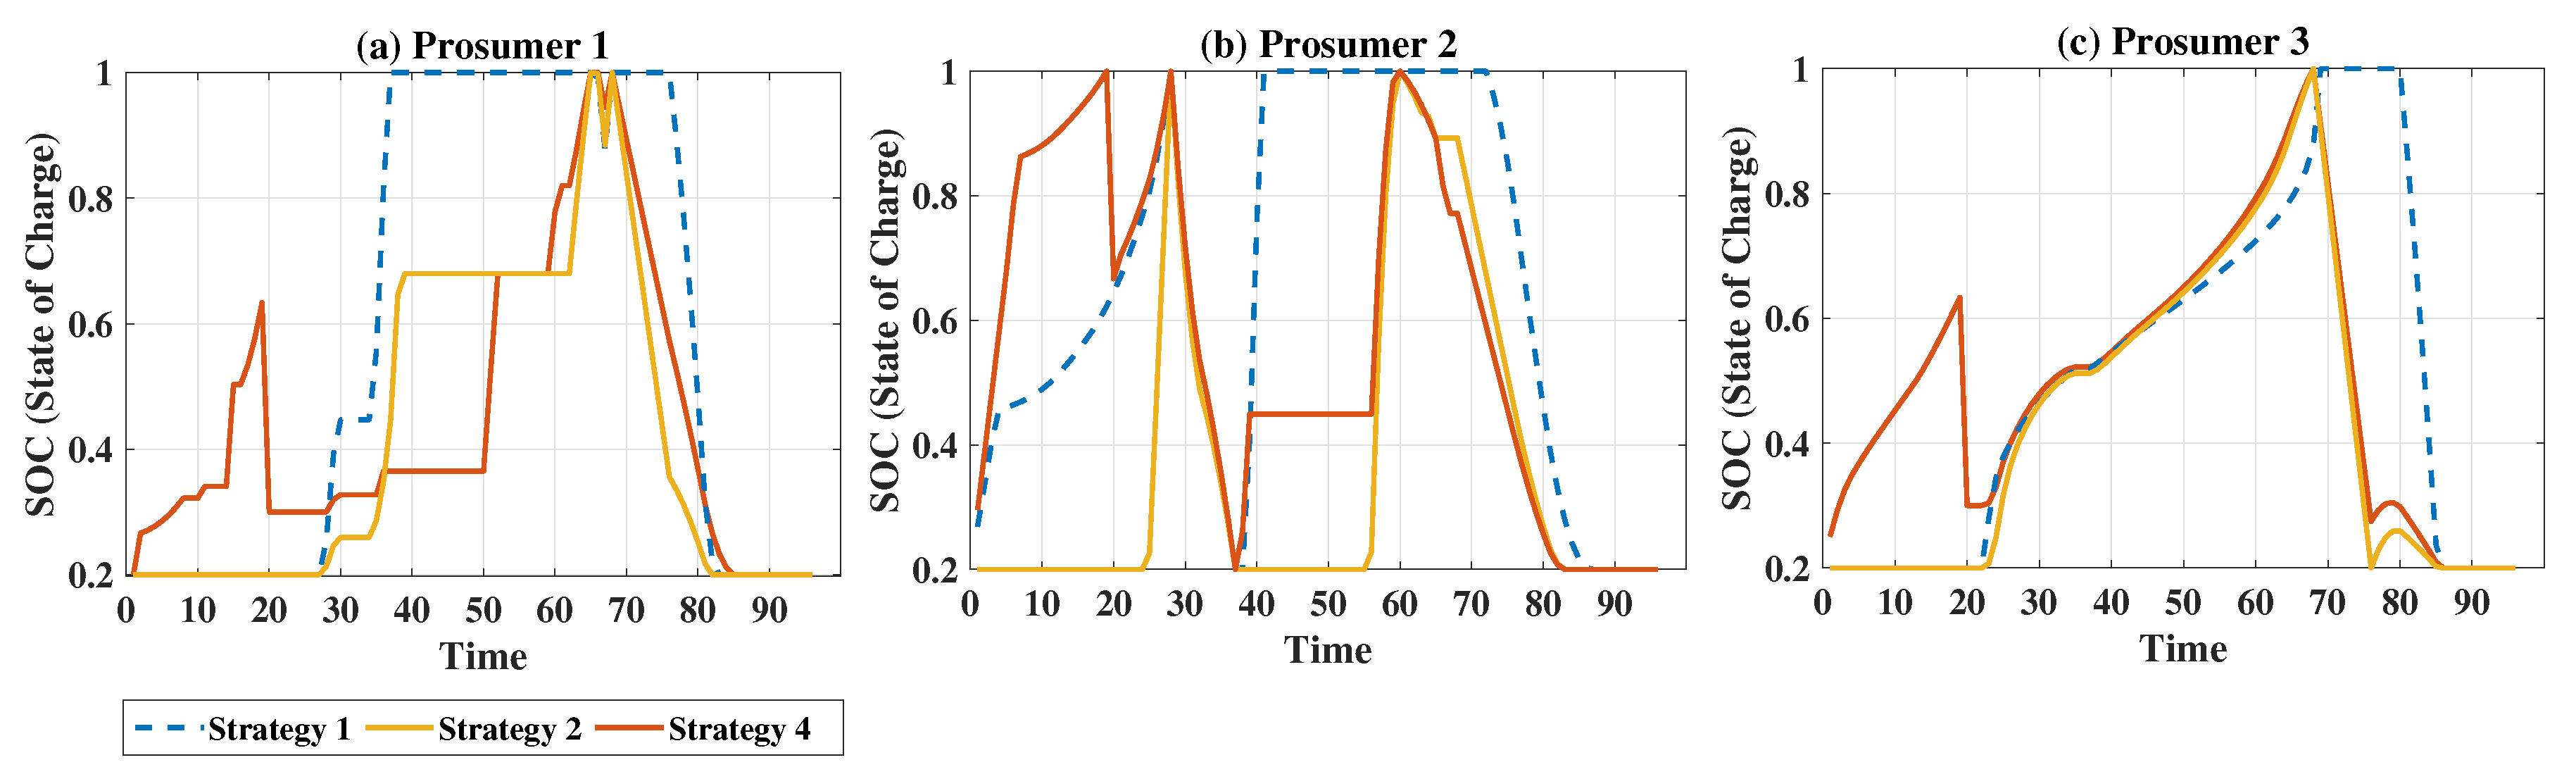
In order to better understand the process of energy storage participating in demand response, Figure 5 shows the SOC curve of each prosumer. The results show that the charge and discharge of strategy 1 and strategy 2 have changed significantly after 68 time. When the demand response subsidy is not considered, the energy storage will choose to discharge after 80 h, that is, when the PV power generation is insufficient, in order to make better use of the TOU price difference to make profits. After considering the demand response subsidy, the discharge time of the energy storage is obviously advanced. The energy stored by the energy storage is not only used for its own electricity demand, but also participates in the demand response and trades with VPP to earn more benefits.
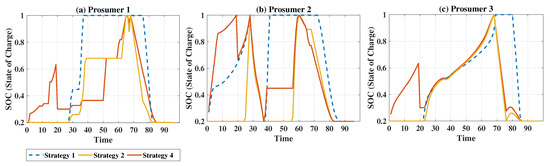
Figure 5.
The state of charging and discharging of prosumers’ energy storage under different pricing strategies.
Strategy 4 corresponds to the result of energy storage configuration considering demand response subsidy and emergency power supply subsidy. It can be seen from Figure 5 that compared with SOC without emergency power supply service, the three prosumers under strategy 4 will choose to obtain benefits through energy storage discharge in the 20 period, that is, the emergency power supply period preset by VPP. In order to better explore the impact of emergency power supply subsidy on prosumers’ decision-making, we also compare the differences of prosumers’ participation in emergency power supply at different times. When varying the emergency power supply duration to 20, 48 and 90 h, respectively, notable differences in capacity configuration emerge. Specifically, when the emergency power supply duration is set at 48 h, the energy storage capacity reaches its peak, surpassing that of strategy 2 by 40%. Conversely, when the emergency power supply duration is set at 90 h, the capacity configuration of prosumers closely aligns with that of strategy 2. Combined with the load curve of the prosumers, it can be seen that the greater the power demand of the prosumers at the emergency power supply time, the smaller the capacity of the configuration and the lower the participation. In the time of 48 h, the PV is the most sufficient, and the prosumer does not need to purchase electric energy from VPP under normal conditions. If the emergency power supply occurs at this time, the energy storage can store a large amount of energy to participate in the emergency. On the contrary, the electricity demand of the prosumers in the time of 90 is larger, and the energy storage used to participate in the emergency is smaller.
4.4. The Influence of Different Pricing Strategies on Electricity Trading
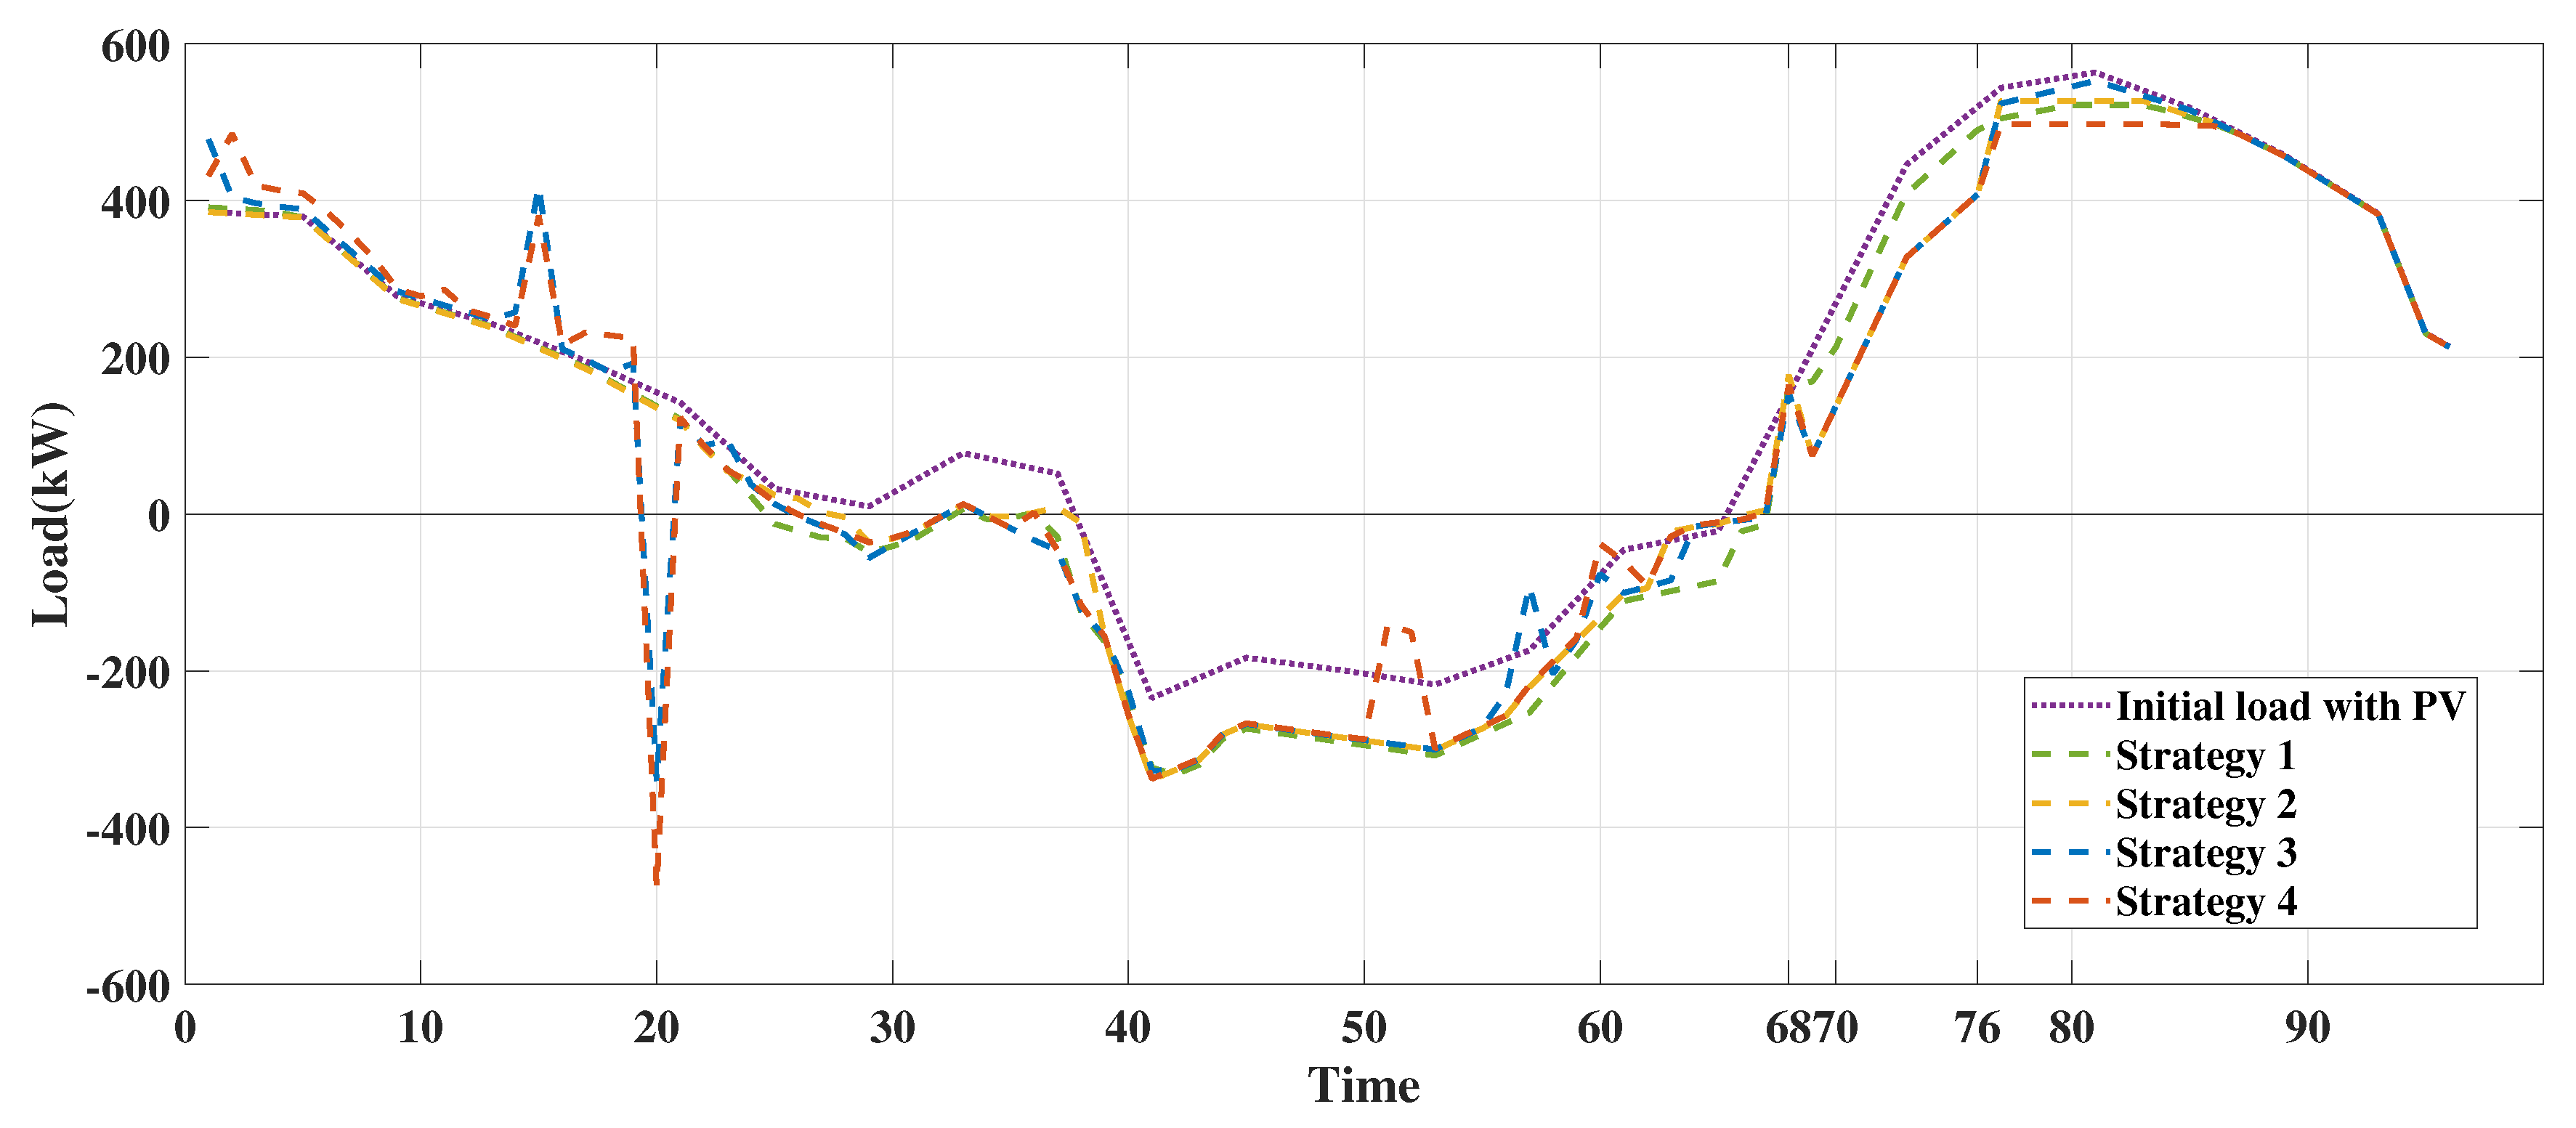
Figure 6 lists the power trading curve of prosumers and VPP under different pricing strategies. First of all, because the size of the PV output is affected by the light intensity, so in the 35–65 period, the PV power generation is abundant. At this time, regardless of whether the subsidy price is considered, the prosumer can be self-sufficient, without the need to purchase electricity from VPP, and can also sell excess electricity to VPP at the price of ppv. Secondly, compared with strategy 1 and strategy 2, it can be seen that in the 68–76 period, that is, the period of time set by VPP to participate in demand response, the demand for electricity in strategy 2 is significantly reduced. Combined with the SOC curve, it can be seen that the prosumer will meet their own electricity demand by increasing the amount of energy storage discharge at this time. During this period, the utility of prosumers has been greatly improved, as shown in Figure 4.
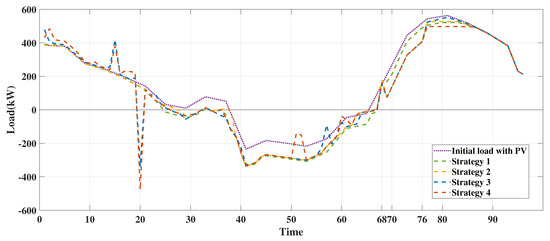
Figure 6.
The power trading curve of prosumers and VPP under different pricing strategies.
In addition, strategy 3 shows the load demand without considering the demand price. Comparing the peak load reduction under these strategies, it can be seen that the peak load without considering the demand price is only reduced by 2%, while strategy 2 and strategy 4 are reduced by 6% and 11% respectively, which is not conducive to the stability of power grid operation. Therefore, the formulation of a reasonable demand price is necessary.
Finally, strategy 4 is the trading situation of prosumers participating in emergency power supply. For the convenience of analysis, we assume that the prosumer’s participation in the emergency power supply period is time 20. At this time, the power grid has an emergency power outage and cannot supply power to the user normally. The power available to the prosumers only comes from PV and energy storage, and uses it to generate corresponding benefits. Since the emergency power supply subsidy is relatively high, prosumers will be more inclined to supply power to VPP to obtain subsidies.
4.5. The Impact of Different Pricing Strategies on the Benefit of Prosumers
Table 5 quantifies the impact of ancillary services on the income of prosumers. Combined with Figure 4, it can be seen that after considering the demand response subsidy, the energy storage capacity of the prosumers increases, and its utility also increases from the original CNY 37,473 to CNY 40,350, an increase of 7%. This shows that the energy storage subsidy can compensate for the investment cost of the energy storage capacity, and the impact of participating in auxiliary services by increasing the energy storage capacity on the total benefit is positive.
Table 5.
The benefit of prosumers under different pricing strategies (CNY).
Strategy 4 is a comparison of the benefits of setting up emergency power supply services at different time periods. The conclusion is similar to the configuration results of energy storage capacity. The benefits generated by participating in emergency power supply services during the period of large electricity demand are lower, and the benefits will be improved when the electricity demand is small. This shows that the setting of VPP auxiliary services should be coordinated with the prosumer’s electricity consumption behavior as much as possible, in order to better mobilize the prosumer’s participation and better play to the effect. In addition, the model takes into account the investment capacity cost and operation and maintenance cost of energy storage, and the energy storage cost of the three prosumers on a typical day is CNY 401.52.
5. Conclusions
In order to encourage prosumers to participate in demand response, this paper proposes a customized pricing method in VPP. In the upper layer, VPP implements a refined pricing strategy including TOU electricity price, demand electricity price, on-grid electricity price and auxiliary subsidy electricity price for prosumers’ electricity consumption behavior. In the lower layer, the prosumers make decisions according to the price signal, determine their own energy storage capacity configuration and power supply, electricity consumption behavior and establish an optimal configuration model of energy storage considering auxiliary services and PV uncertainty.
The findings of this study demonstrate the efficacy of the customized pricing method-based demand response in enhancing the energy storage capacity configuration of prosumers. Particularly noteworthy is the five-fold increase in prosumer energy storage capacity observed after the incorporation of ancillary service subsidies, leading to improved benefits. Furthermore, the adoption of this pricing strategy has resulted in a notable 10% increase in renewable energy power generation, specifically PV power generation, even after accounting for uncertainties. Additionally, the implementation of this strategy has contributed to an 11% reduction in peak load, significantly enhancing the stability of the power system. This has a positive impact on reducing carbon emissions and improving sustainability of power systems.
This paper introduces a novel customized pricing strategy, which, when applied, not only optimizes the configuration of prosumer energy storage but also fosters the advancement of user-side PV systems and energy storage technologies, ultimately contributing to enhanced power system stability. However, it is important to note that this study does not delve into the investment costs associated with PV systems, nor does it explore the interactions between prosumers and consumers. Therefore, in future research endeavors, we aim to focus on developing customized pricing strategies tailored to various user types and further refining the pricing model to account for these factors.
Author Contributions
Conceptualization, L.P. and J.C.; Investigation, L.P. and J.C.; Writing—original draft, L.P.; Validation, J.C.; Supervision, J.C.; Writing—review and editing, J.C. All authors have read and agreed to the published version of the manuscript.
Funding
This work was supported by National Natural Science Foundation of China under Grant (52377110).
Institutional Review Board Statement
Not applicable.
Informed Consent Statement
Informed consent was collected from all participants in this study.
Data Availability Statement
Data is contained within the article.
Conflicts of Interest
The authors declare no conflicts of interest.
References
- Mashlakov, A.; Pournaras, E.; Nardelli, P.H.; Honkapuro, S. Decentralized cooperative scheduling of prosumer flexibility under forecast uncertainties. Appl. Energy 2021, 290, 116706. [Google Scholar] [CrossRef]
- Venegas-Zarama, J.F.; Muñoz-Hernandez, J.I.; Baringo, L.; Diaz-Cachinero, P.; De Domingo-Mondejar, I. A review of the evolution and main roles of virtual power plants as key stakeholders in power systems. IEEE Access 2022, 10, 47937–47964. [Google Scholar] [CrossRef]
- Zheng, J.; Liang, Z.T.; Li, Y.; Li, Z.; Wu, Q.H. Multi-Agent Reinforcement Learning with Privacy Preservation for Continuous Double Auction-Based P2P Energy Trading. IEEE Trans. Ind. Inform. 2024. early access. [Google Scholar] [CrossRef]
- Li, P.; Wang, Z.; Wang, J.; Yang, W.; Guo, T.; Yin, Y. Two-stage optimal operation of integrated energy system considering multiple uncertainties and integrated demand response. Energy 2021, 225, 120256. [Google Scholar] [CrossRef]
- Liu, N.; Yu, X.; Wang, C.; Wang, J. Energy sharing management for microgrids with PV prosumers: A Stackelberg game approach. IEEE Trans. Ind. Inform. 2017, 13, 1088–1098. [Google Scholar] [CrossRef]
- Celebi, E.; Fuller, J.D. Time-of-use pricing in electricity markets under different market structures. IEEE Trans. Power Syst. 2012, 27, 1170–1181. [Google Scholar] [CrossRef]
- Wang, Z.; Sun, M.; Gao, C.; Wang, X.; Ampimah, B.C. A new interactive real-time pricing mechanism of demand response based on an evaluation model. Appl. Energy 2021, 295, 117052. [Google Scholar] [CrossRef]
- Shen, M.; Chen, J. Optimization of peak-valley pricing policy based on a residential electricity demand model. J. Clean Prod. 2022, 380, 134761. [Google Scholar] [CrossRef]
- Simshauser, P. Distribution network prices and solar PV: Resolving rate instability and wealth transfers through demand tariffs. Energy Econ. 2016, 54, 108–122. [Google Scholar] [CrossRef]
- He, Y.; Pang, Y.; Zhang, J.; Xia, T.; Zhang, T. Feed-in tariff mechanisms for large-scale wind power in China. Renew. Sust. Energy Rev. 2015, 51, 9–17. [Google Scholar] [CrossRef]
- Xu, Z.; Guo, Y.; Sun, H. Competitive pricing game of virtual power plants: Models, strategies, and equilibria. IEEE Trans. Smart Grid 2022, 13, 4583–4595. [Google Scholar] [CrossRef]
- Kong, X.; Lu, W.; Wu, J.; Wang, C.; Zhao, X.; Hu, W.; Shen, Y. Real-time pricing method for VPP demand response based on PER-DDPG algorithm. Energy 2023, 271, 127036. [Google Scholar] [CrossRef]
- Wang, L.; Yang, Y.; Dong, C.; Morosuk, T.; Tsatsaronis, G. Multi-objective optimization of coal-fired power plants using differential evolution. Appl. Energy 2014, 115, 254–264. [Google Scholar] [CrossRef]
- Arriola, E.R.; Ubando, A.T.; Chen, W.H. A bibliometric review on the application of fuzzy optimization to sustainable energy technologies. Int. J. Energy Res. 2022, 46, 6–27. [Google Scholar] [CrossRef]
- Nazari-Heris, M.; Mohammadi-Ivatloo, B. Application of robust optimization method to power system problems. In Classical and Recent Aspects of Power System Optimization; Academic Press: Cambridge, MA, USA, 2018; pp. 19–32. [Google Scholar]
- Huang, C.; Yue, D.; Xie, J.; Li, Y.; Wang, K. Economic dispatch of power systems with virtual power plant based interval optimization method. CSEE J. Power Energy Syst. 2016, 2, 74–80. [Google Scholar] [CrossRef]
- Kingma, D.P.; Ba, J. Adam: A method for stochastic optimization. arXiv 2014, arXiv:1412.6980. [Google Scholar]
- Zheng, J.; Guo, J.; Li, Z.; Wu, Q.; Zhou, X. Optimal design for a multi-level energy exploitation unit based on hydrogen storage combining methane reactor and carbon capture, utilization and storage. J. Energy Storage 2023, 62, 106929. [Google Scholar] [CrossRef]
- Kong, X.; Wang, Z.; Liu, C.; Zhang, D.; Gao, H. Refined peak shaving potential assessment and differentiated decision-making method for user load in virtual power plants. Appl. Energy 2023, 334, 120609. [Google Scholar] [CrossRef]
- Zhang, T.; Qiu, W.; Zhang, Z.; Lin, Z.; Ding, Y.; Wang, Y.; Wang, L.; Yang, L. Optimal bidding strategy and profit allocation method for shared energy storage-assisted VPP in joint energy and regulation markets. Appl. Energy 2023, 329, 120158. [Google Scholar] [CrossRef]
- Abbassi, A.; Ben Mehrez, R.; Abbassi, R.; Jerbi, H.; Saidi, S.; Jemli, M. Eco-feasibility study of a distributed power generation system driven by renewable green energy sources. Energy Sources Part A Recover. Util. Environ. Eff. 2022, 44, 3981–3999. [Google Scholar] [CrossRef]
- Abbassi, A.; Mehrez, R.B.; Abbassi, R.; Saidi, S.; Albdran, S.; Jemli, M. Improved off-grid wind/photovoltaic/hybrid energy storage system based on new framework of Moth-Flame optimization algorithm. Int. J. Energy Res. 2022, 46, 6711–6729. [Google Scholar] [CrossRef]
- Yang, Y.; Bremner, S.; Menictas, C.; Kay, M. Modelling and optimal energy management for battery energy storage systems in renewable energy systems: A review. Renew. Sust. Energy Rev. 2022, 167, 112671. [Google Scholar] [CrossRef]
- Dinh, H.T.; Yun, J.; Kim, D.M.; Lee, K.H.; Kim, D. A home energy management system with renewable energy and energy storage utilizing main grid and electricity selling. IEEE Access 2020, 8, 49436–49450. [Google Scholar] [CrossRef]
- Sikorski, T.; Jasiński, M.; Ropuszyńska-Surma, E.; Węglarz, M.; Kaczorowska, D.; Kostyła, P.; Leonowicz, Z.; Lis, R.; Rezmer, J.; Rojewski, W.; et al. A case study on distributed energy resources and energy-storage systems in a virtual power plant concept: Economic aspects. Energies 2019, 12, 4447. [Google Scholar] [CrossRef]
- Li, B.; Ghiasi, M. A new strategy for economic virtual power plant utilization in electricity market considering energy storage effects and ancillary services. J. Electr. Eng. Technol. 2021, 16, 2863–2874. [Google Scholar] [CrossRef]
- Abdullah, W.S.W.; Osman, M.; Ab Kadir, M.Z.A.; Verayiah, R.; Ab Aziz, N.F.; Rasheed, M.A. Techno-economics analysis of battery energy storage system (BESS) design for virtual power plant (VPP)—A case study in Malaysia. J. Energy Storage 2021, 38, 102568. [Google Scholar] [CrossRef]
- Szott, M.; Wermiński, S.; Jarnut, M.; Kaniewski, J.; Benysek, G. Battery energy storage system for emergency supply and improved reliability of power networks. Energies 2021, 14, 720. [Google Scholar] [CrossRef]
- Huang, W.; Zhang, X.; Li, K.; Zhang, N.; Strbac, G.; Kang, C. Resilience oriented planning of urban multi-energy systems with generalized energy storage sources. IEEE Trans. Power Syst. 2021, 37, 2906–2918. [Google Scholar] [CrossRef]
- Ma, X.; Pan, Y.; Zhang, M.; Ma, J.; Yang, W. A study of licensing strategies for energy storage technologies in the renewable electricity supply chain under government subsidies. J. Clean Prod. 2023, 420, 138343. [Google Scholar] [CrossRef]
- Zakeri, B.; Cross, S.; Dodds, P.E.; Gissey, G.C. Policy options for enhancing economic profitability of residential solar photovoltaic with battery energy storage. Appl. Energy 2021, 290, 116697. [Google Scholar] [CrossRef]
- Yang, Z.; Gao, T.; Liu, Y.; Huang, X.; Gao, S.; Zhao, Q.; Ding, H. A two-stage pricing strategy for electric vehicles participating in emergency power supply for important loads. Electr. Power Syst. Res. 2023, 218, 109239. [Google Scholar] [CrossRef]
- Mermoud, A.; Lejeune, T. Performance assessment of a simulation model for PV modules of any available technology. In Proceedings of the 25th European Photovoltaic Solar Energy Conference, Valencia, Spain, 6–10 September 2010; Volume 1, pp. 6–10. [Google Scholar]
- Thevenard, D.; Pelland, S. Estimating the uncertainty in long-term photovoltaic yield predictions. Sol. Energy 2013, 91, 432–445. [Google Scholar] [CrossRef]
- Zhang, Y.; Jin, Z.; Mirjalili, S. Generalized normal distribution optimization and its applications in parameter extraction of photovoltaic models. Energy Conv. Manag. 2020, 224, 113301. [Google Scholar] [CrossRef]
- Mandelbrot, B.B.; Mandelbrot, B.B. The Variation of Certain Speculative Prices; Springer: Berlin/Heidelberg, Germany, 1997. [Google Scholar]
- Wang, L.; Chen, J.; Peng, K.; Zhao, Y.; Zhang, X. Reward fairness-based optimal distributed real-time pricing to enable supply–demand matching. Neurocomputing 2021, 427, 1–12. [Google Scholar] [CrossRef]
- Park, J.; Kim, Y.; Eom, I.; Lee, K. Economic load dispatch for piecewise quadratic cost function using Hopfield neural network. IEEE Trans. Power Syst. 1993, 8, 1030–1038. [Google Scholar] [CrossRef]
- Low, S.H.; Lapsley, D.E. Optimization flow control. I. Basic algorithm and convergence. IEEE/ACM Trans. Netw. 1999, 7, 861–874. [Google Scholar] [CrossRef]
- Mohsenian-Rad, A.H.; Wong, V.W.; Jatskevich, J.; Schober, R.; Leon-Garcia, A. Autonomous demand-side management based on game-theoretic energy consumption scheduling for the future smart grid. IEEE Trans. Smart Grid 2010, 1, 320–331. [Google Scholar] [CrossRef]
- Samadi, P.; Mohsenian-Rad, A.H.; Schober, R.; Wong, V.W.; Jatskevich, J. Optimal real-time pricing algorithm based on utility maximization for smart grid. In Proceedings of the 2010 First IEEE International Conference on Smart Grid Communications, Gaithersburg, MD, USA, 4–6 October 2010; pp. 415–420. [Google Scholar]
- Jiang, X.; Nan, G.; Liu, H.; Guo, Z.; Zeng, Q.; Jin, Y. Optimization of battery energy storage system capacity for wind farm with considering auxiliary services compensation. Appl. Sci. 2018, 8, 1957. [Google Scholar] [CrossRef]
- Boyang, S.; Yin, X.; Ying, W. Optimal configuration and economic analysis of user-side energy storage participating in ancillary services. China Power 2023, 56, 164–170+178. [Google Scholar]
- Gurobi Optimization, LLC. Gurobi Optimizer Reference Manual; Gurobi Optimization, LLC.: Beaverton, OR, USA, 2021. [Google Scholar]

Disclaimer/Publisher’s Note: The statements, opinions and data contained in all publications are solely those of the individual author(s) and contributor(s) and not of MDPI and/or the editor(s). MDPI and/or the editor(s) disclaim responsibility for any injury to people or property resulting from any ideas, methods, instructions or products referred to in the content. |
© 2024 by the authors. Licensee MDPI, Basel, Switzerland. This article is an open access article distributed under the terms and conditions of the Creative Commons Attribution (CC BY) license (https://creativecommons.org/licenses/by/4.0/).