
Characteristics and Influencing Factors of Storm Surge-Induced Salinity Augmentation in the Pearl River Estuary, South China

 , ,
, ,
Abstract
:1. Introduction
2. Materials and Methods
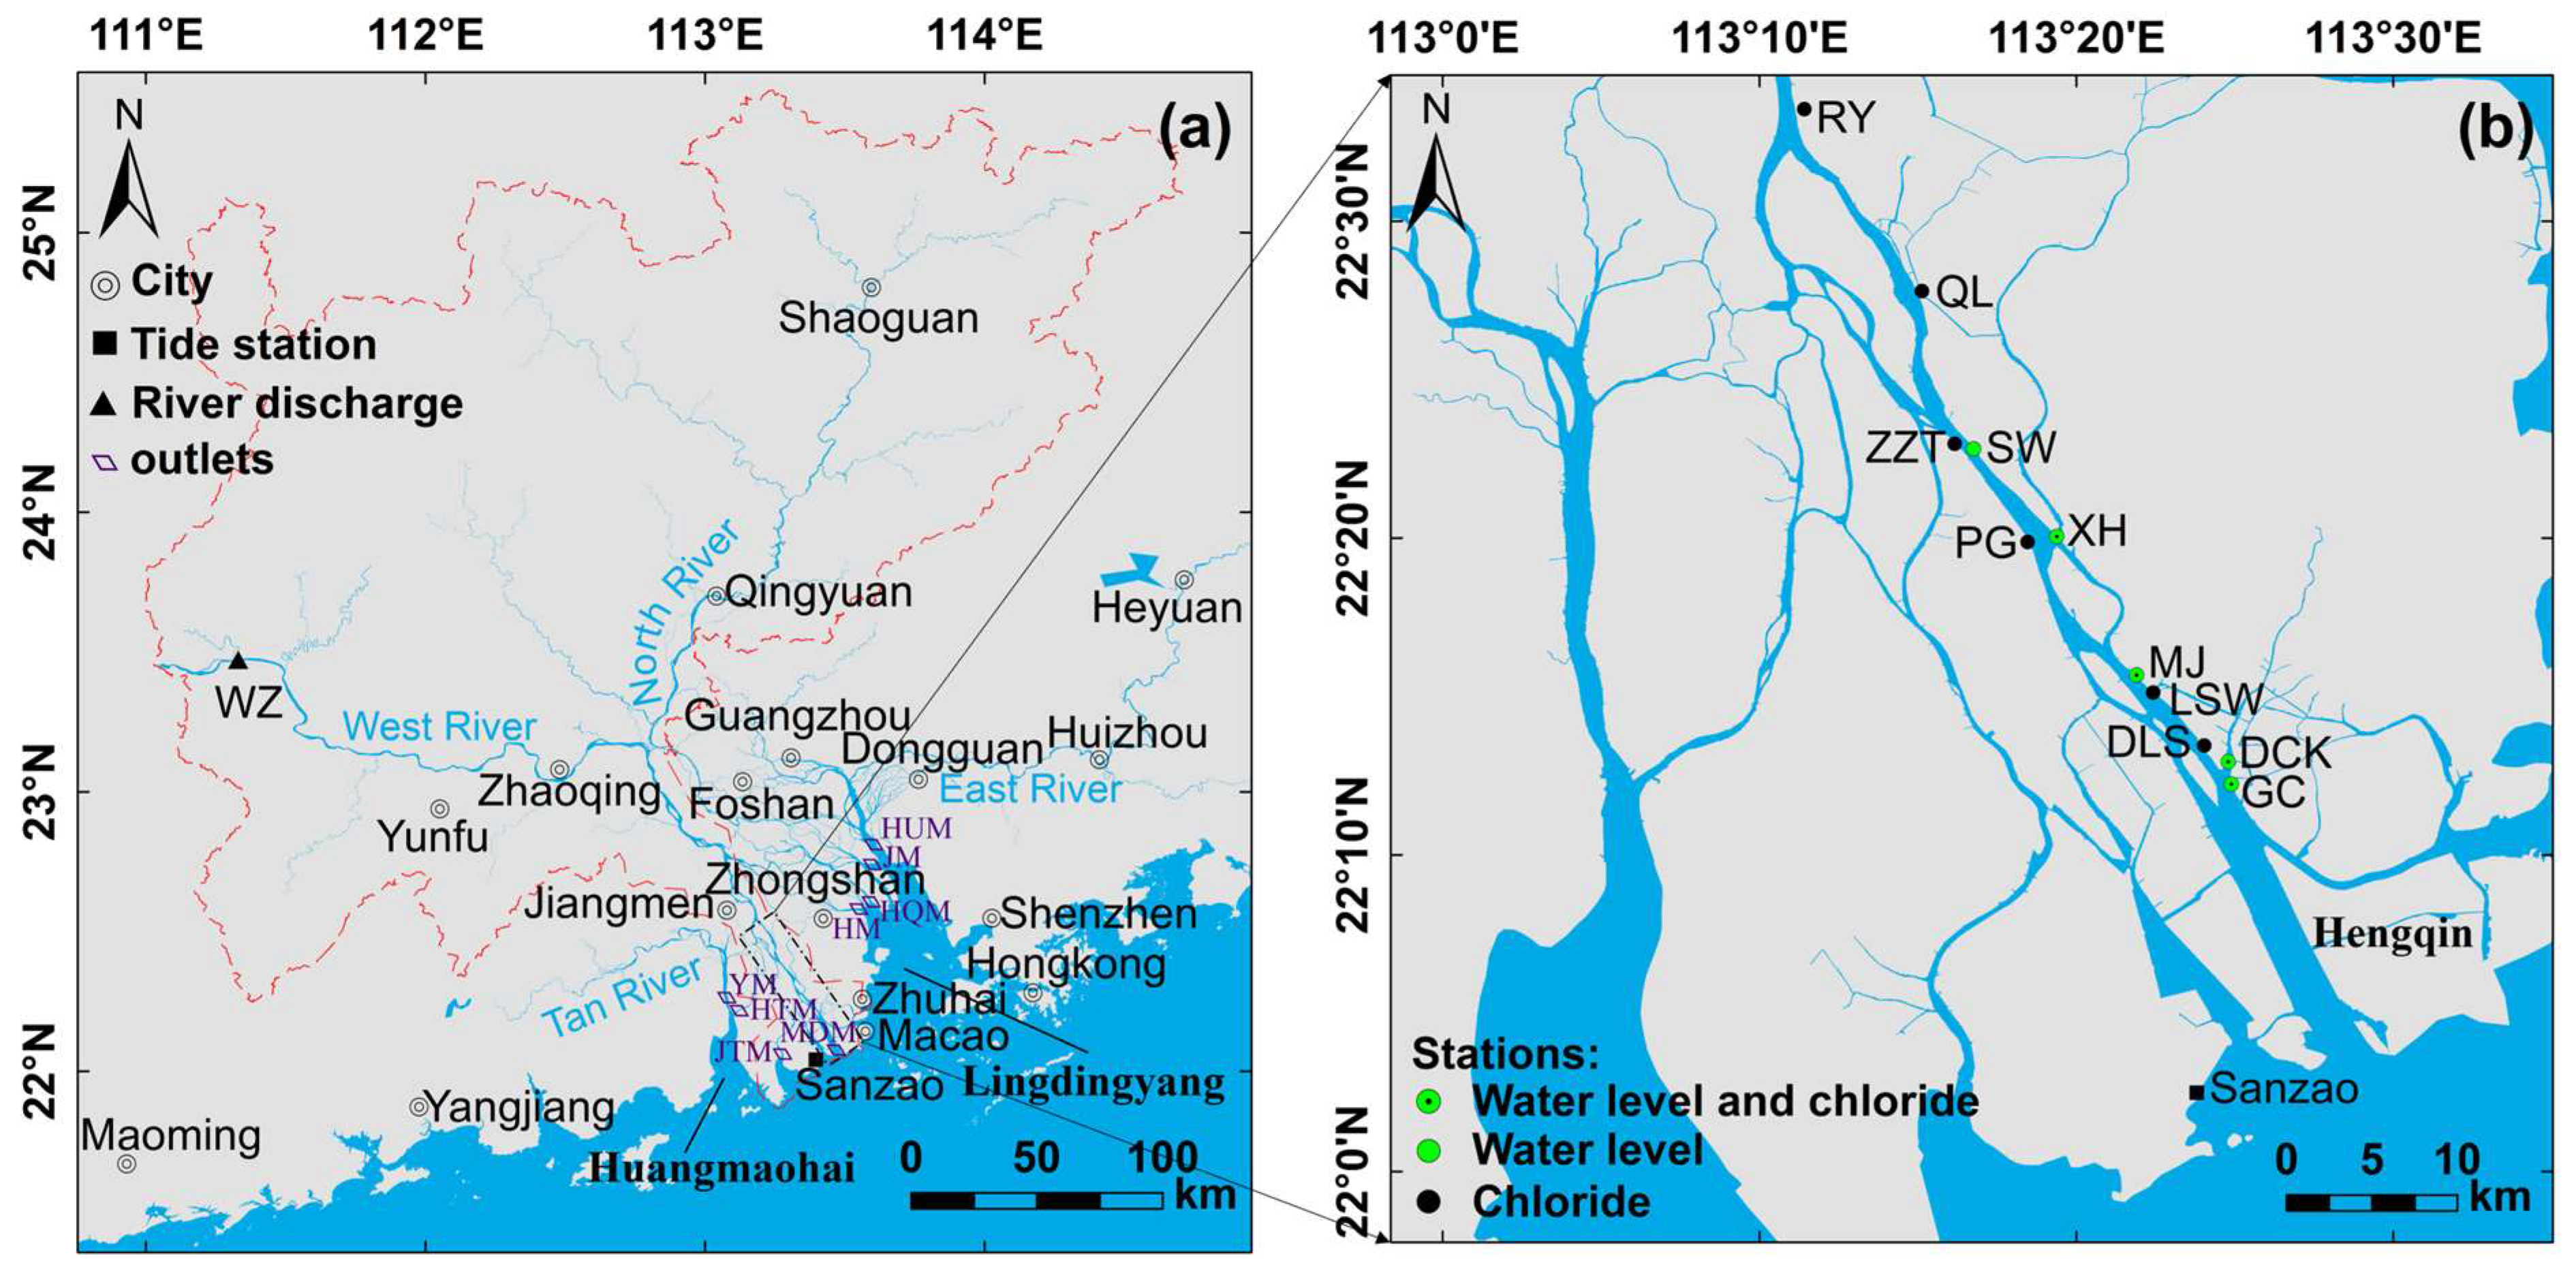
2.1. Study Area
2.2. Data
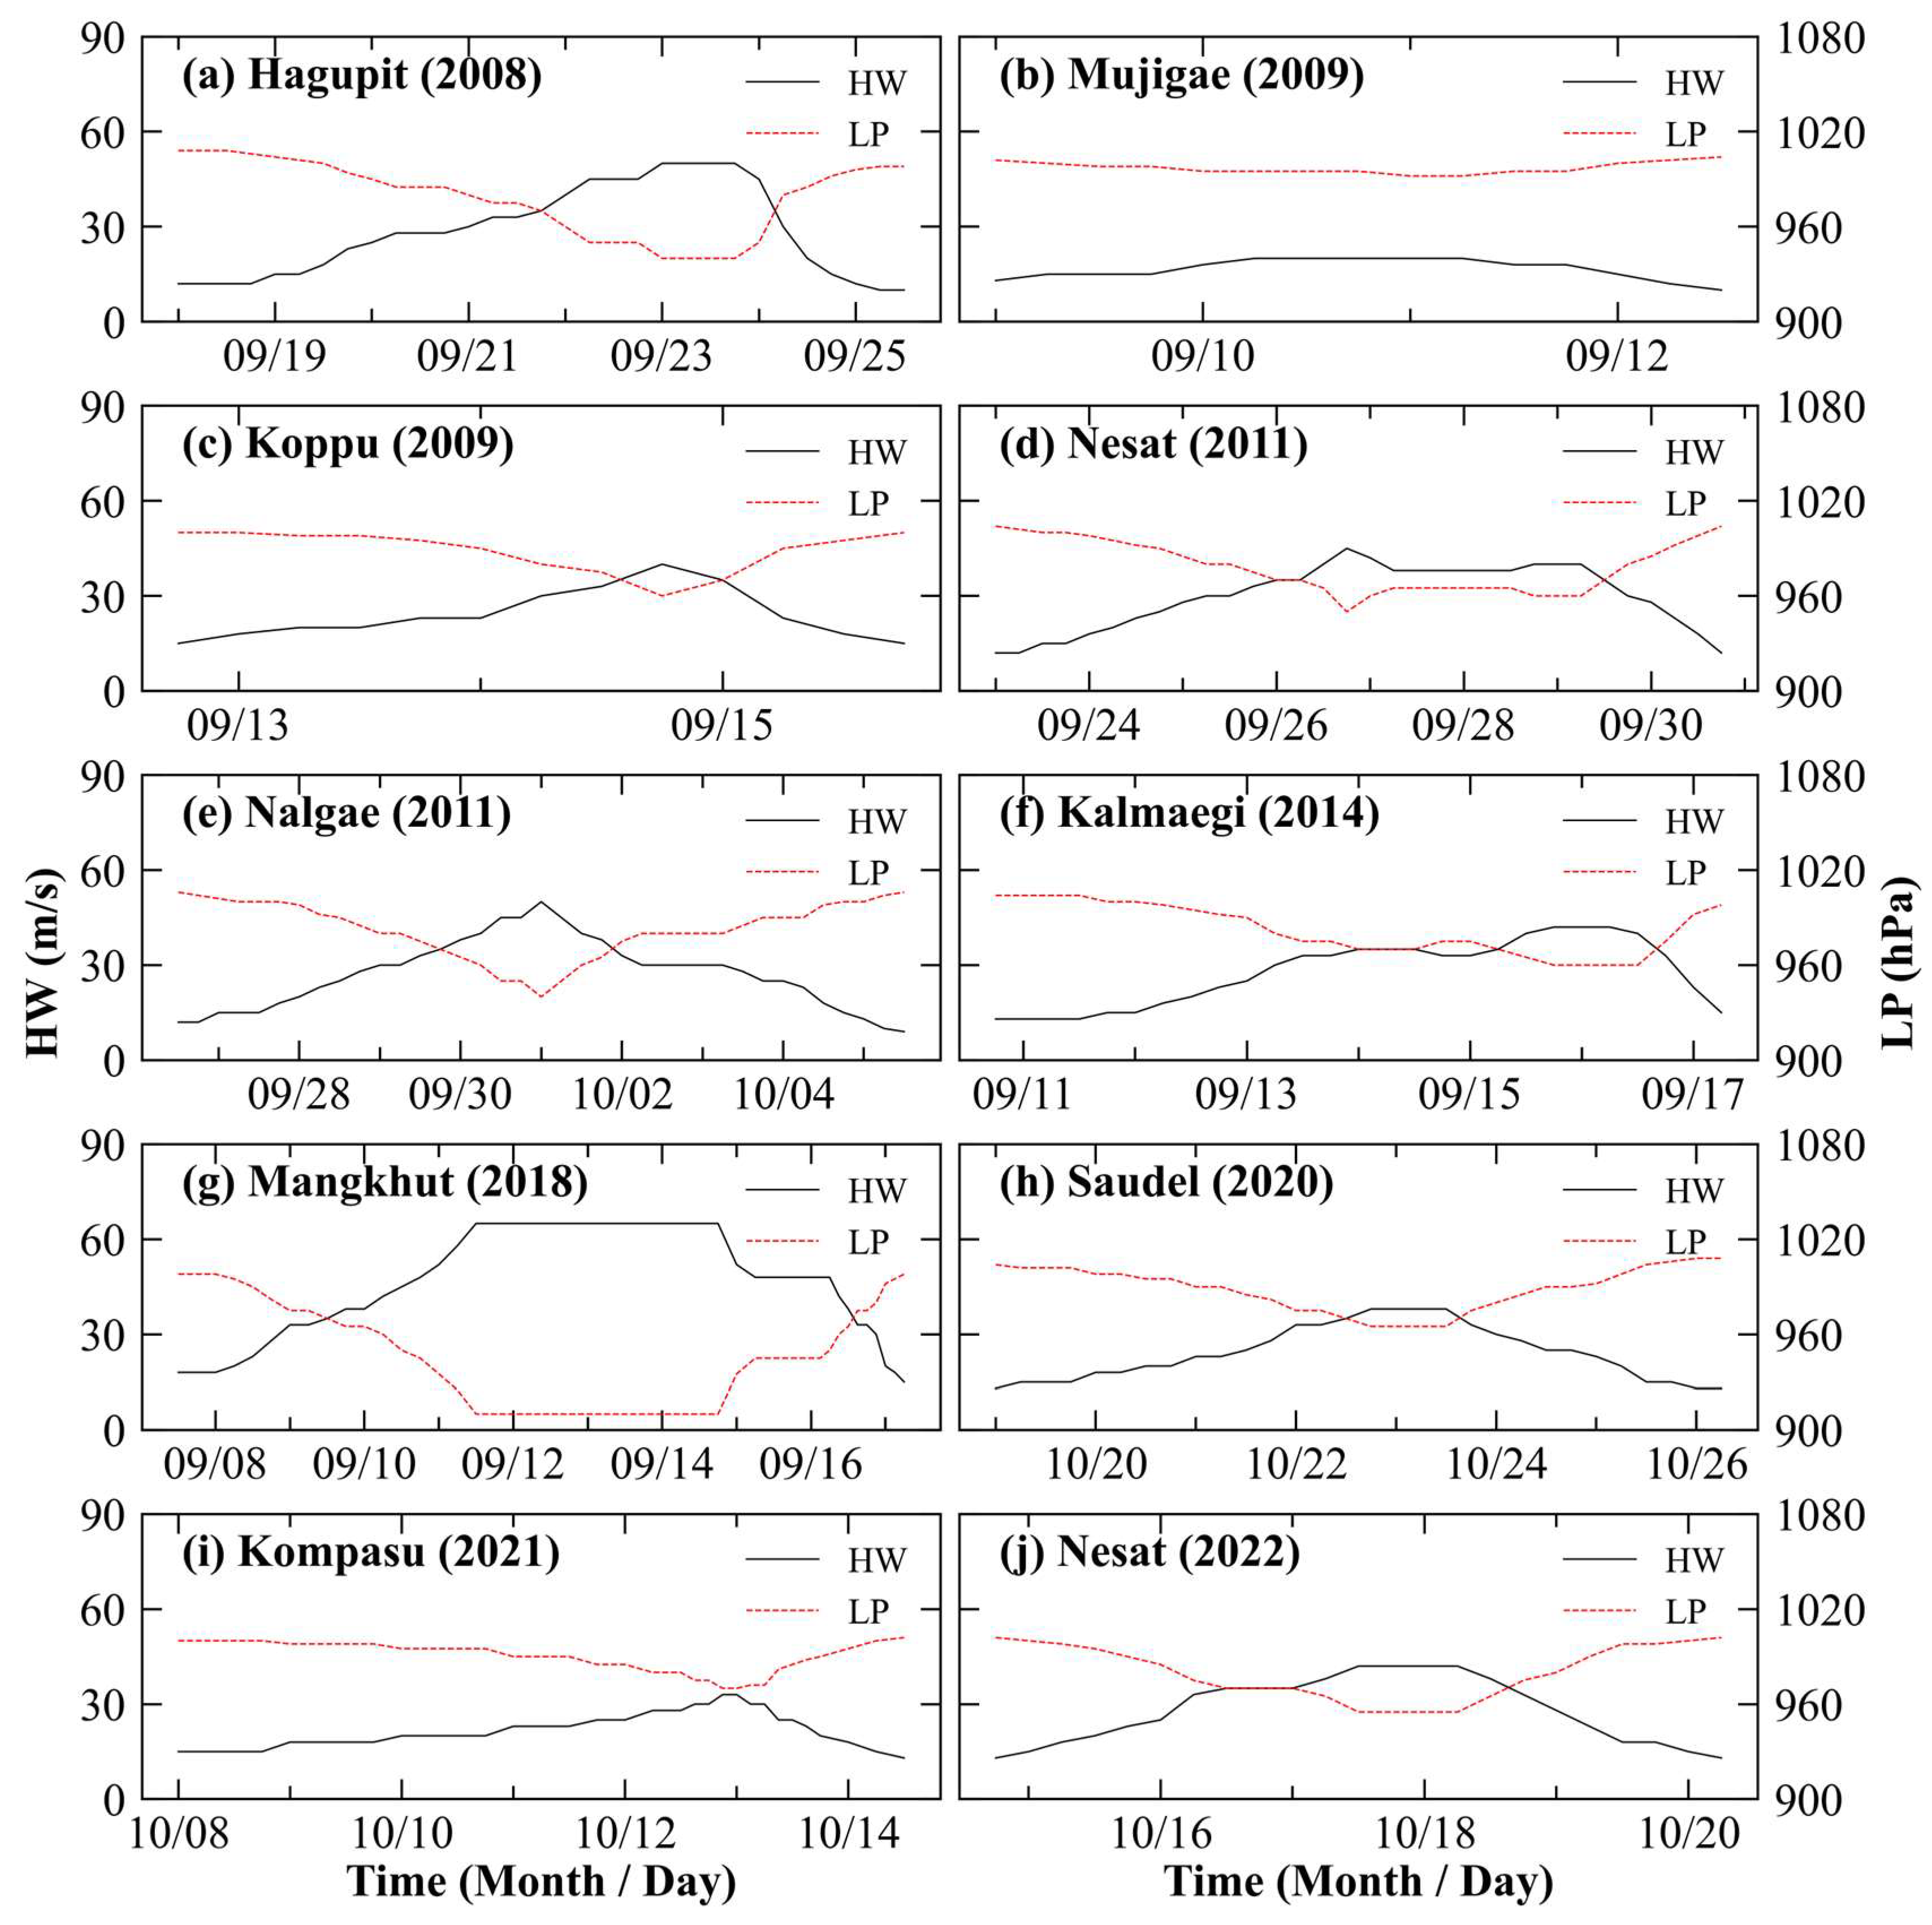
2.3. Typhoons
2.4. Calculation of Typhoon Rainfall-Induced Runoff
3. Results
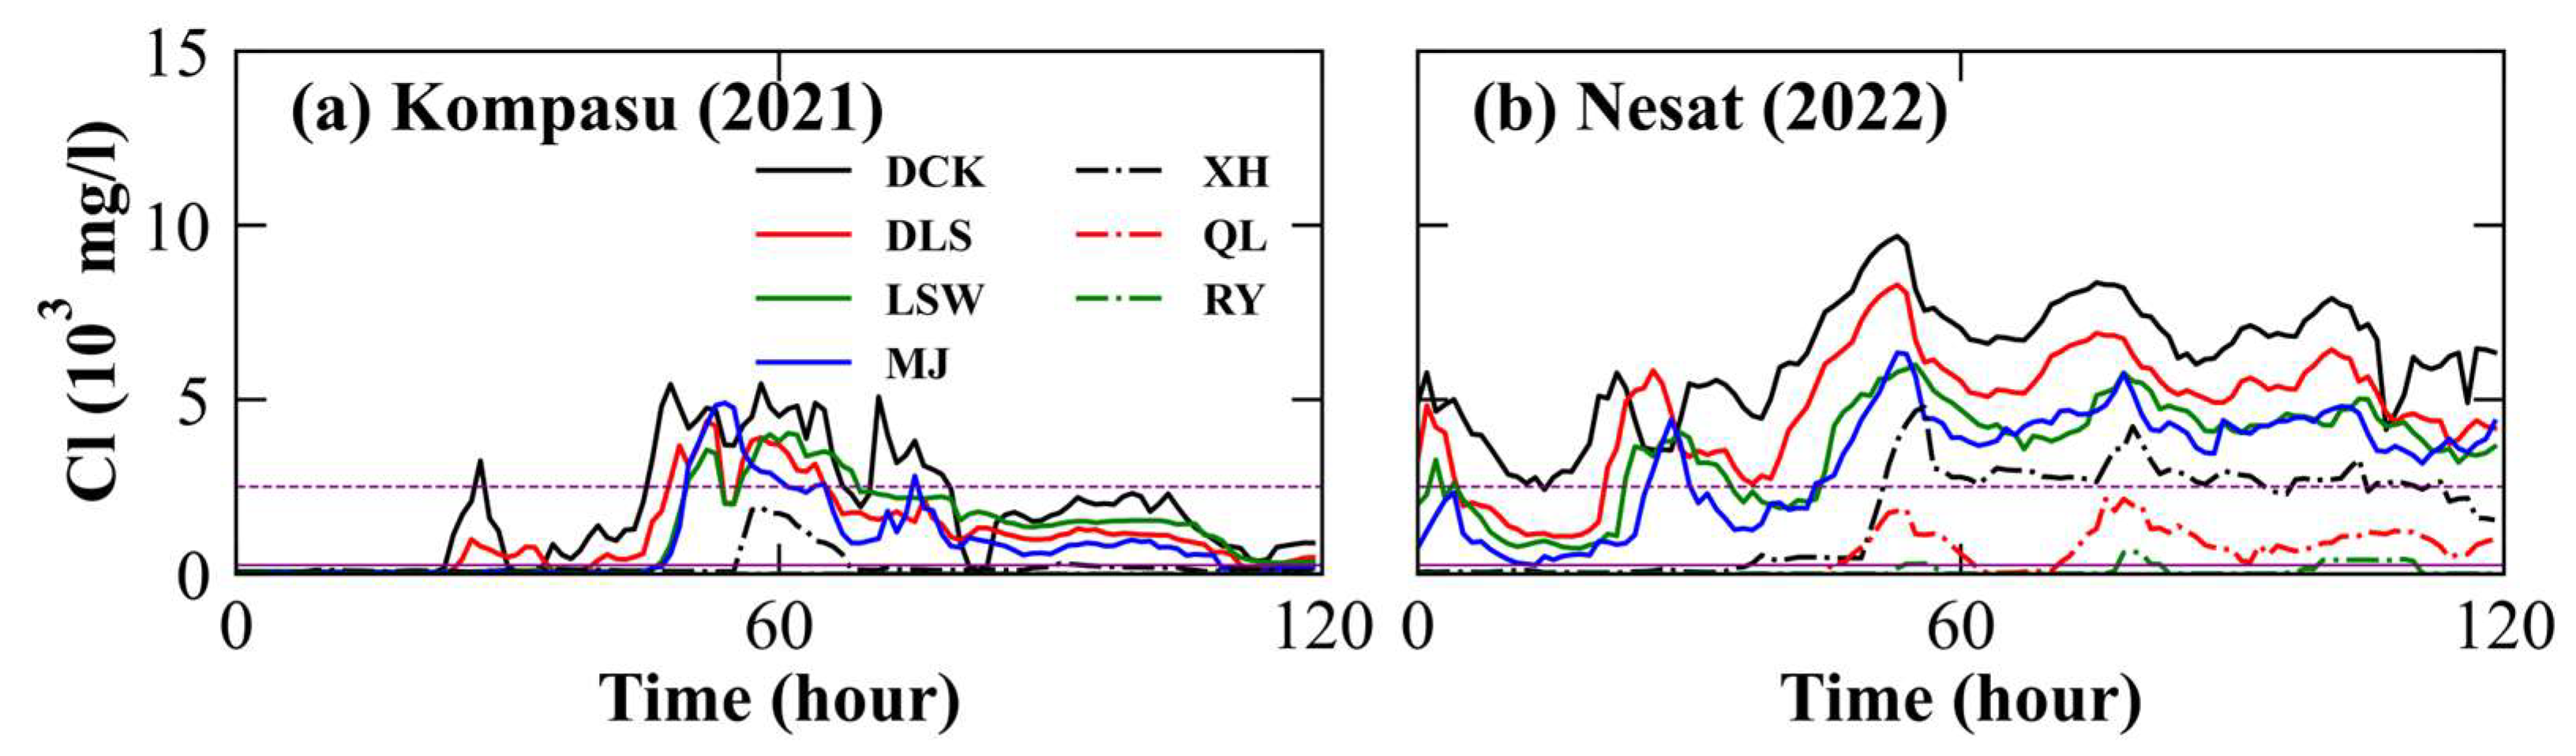
3.1. Impact Process Analysis of Storm Surge-Induced Salinity Augmentation
3.2. Spatiotemporal Variations of Storm Surge-Induced Salinity Augmentation
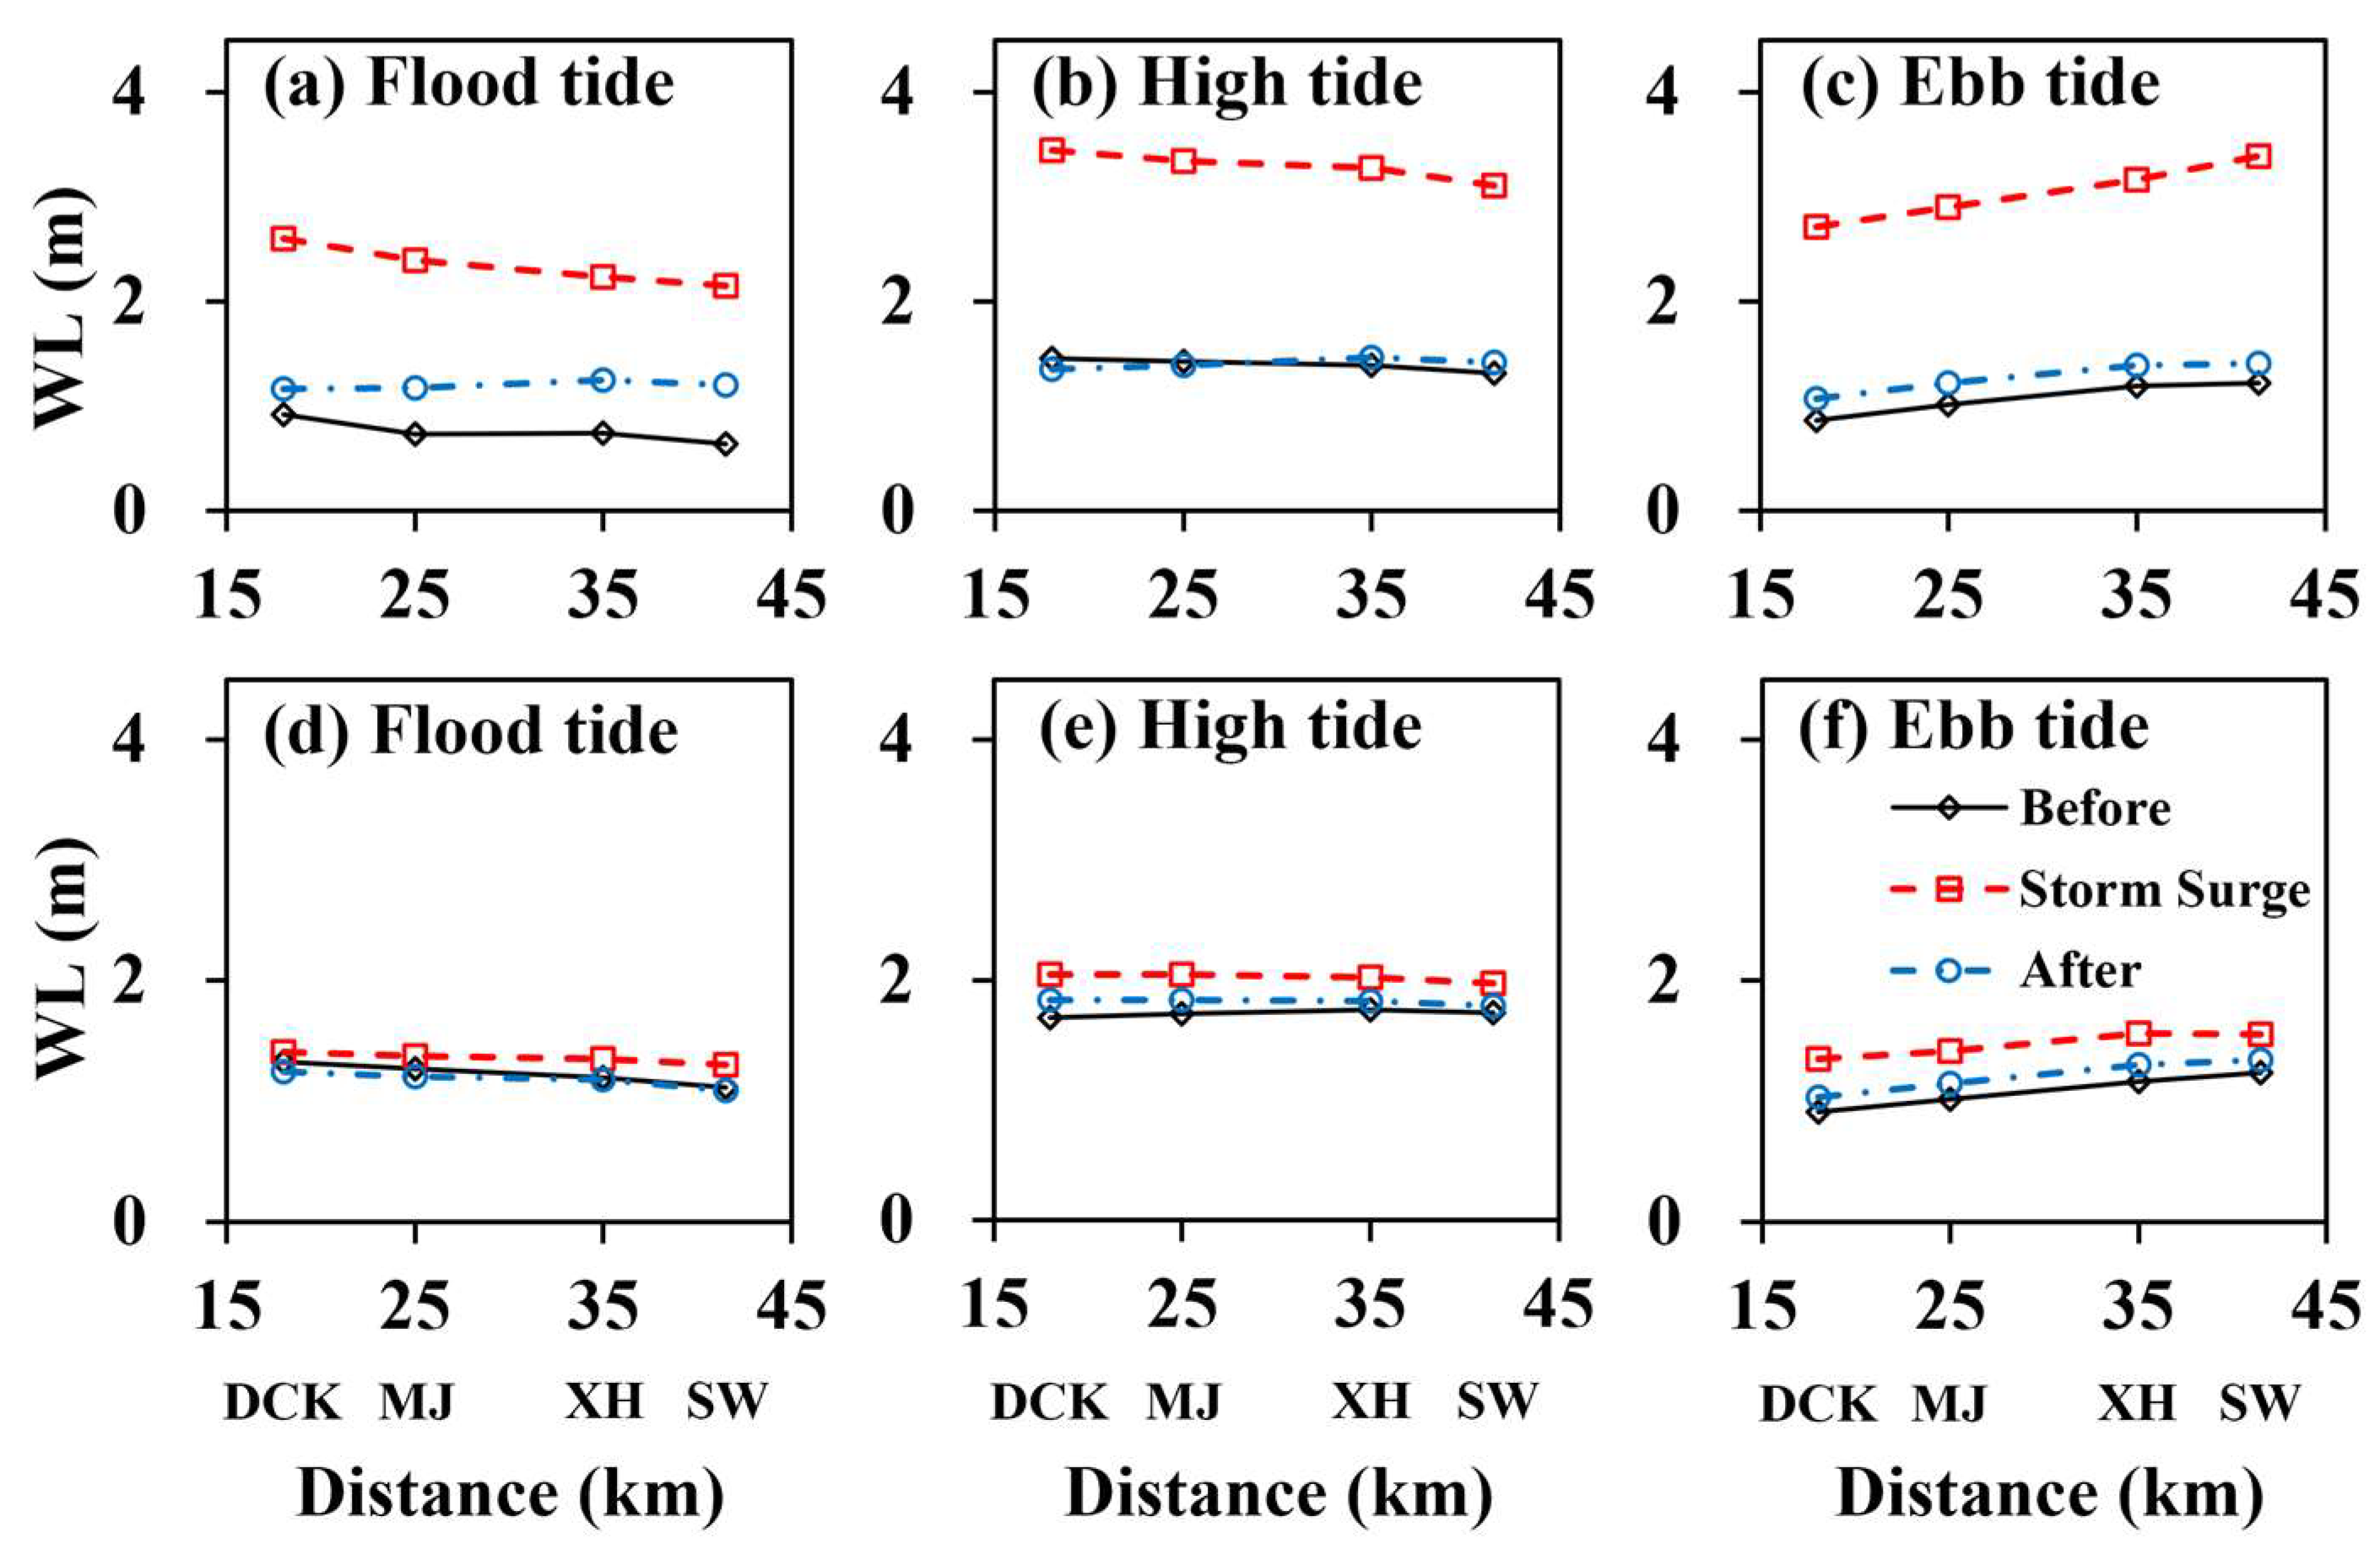
3.3. Changes in Water Level Gradients and Their Impact on Salinity Augmentation
4. Discussions
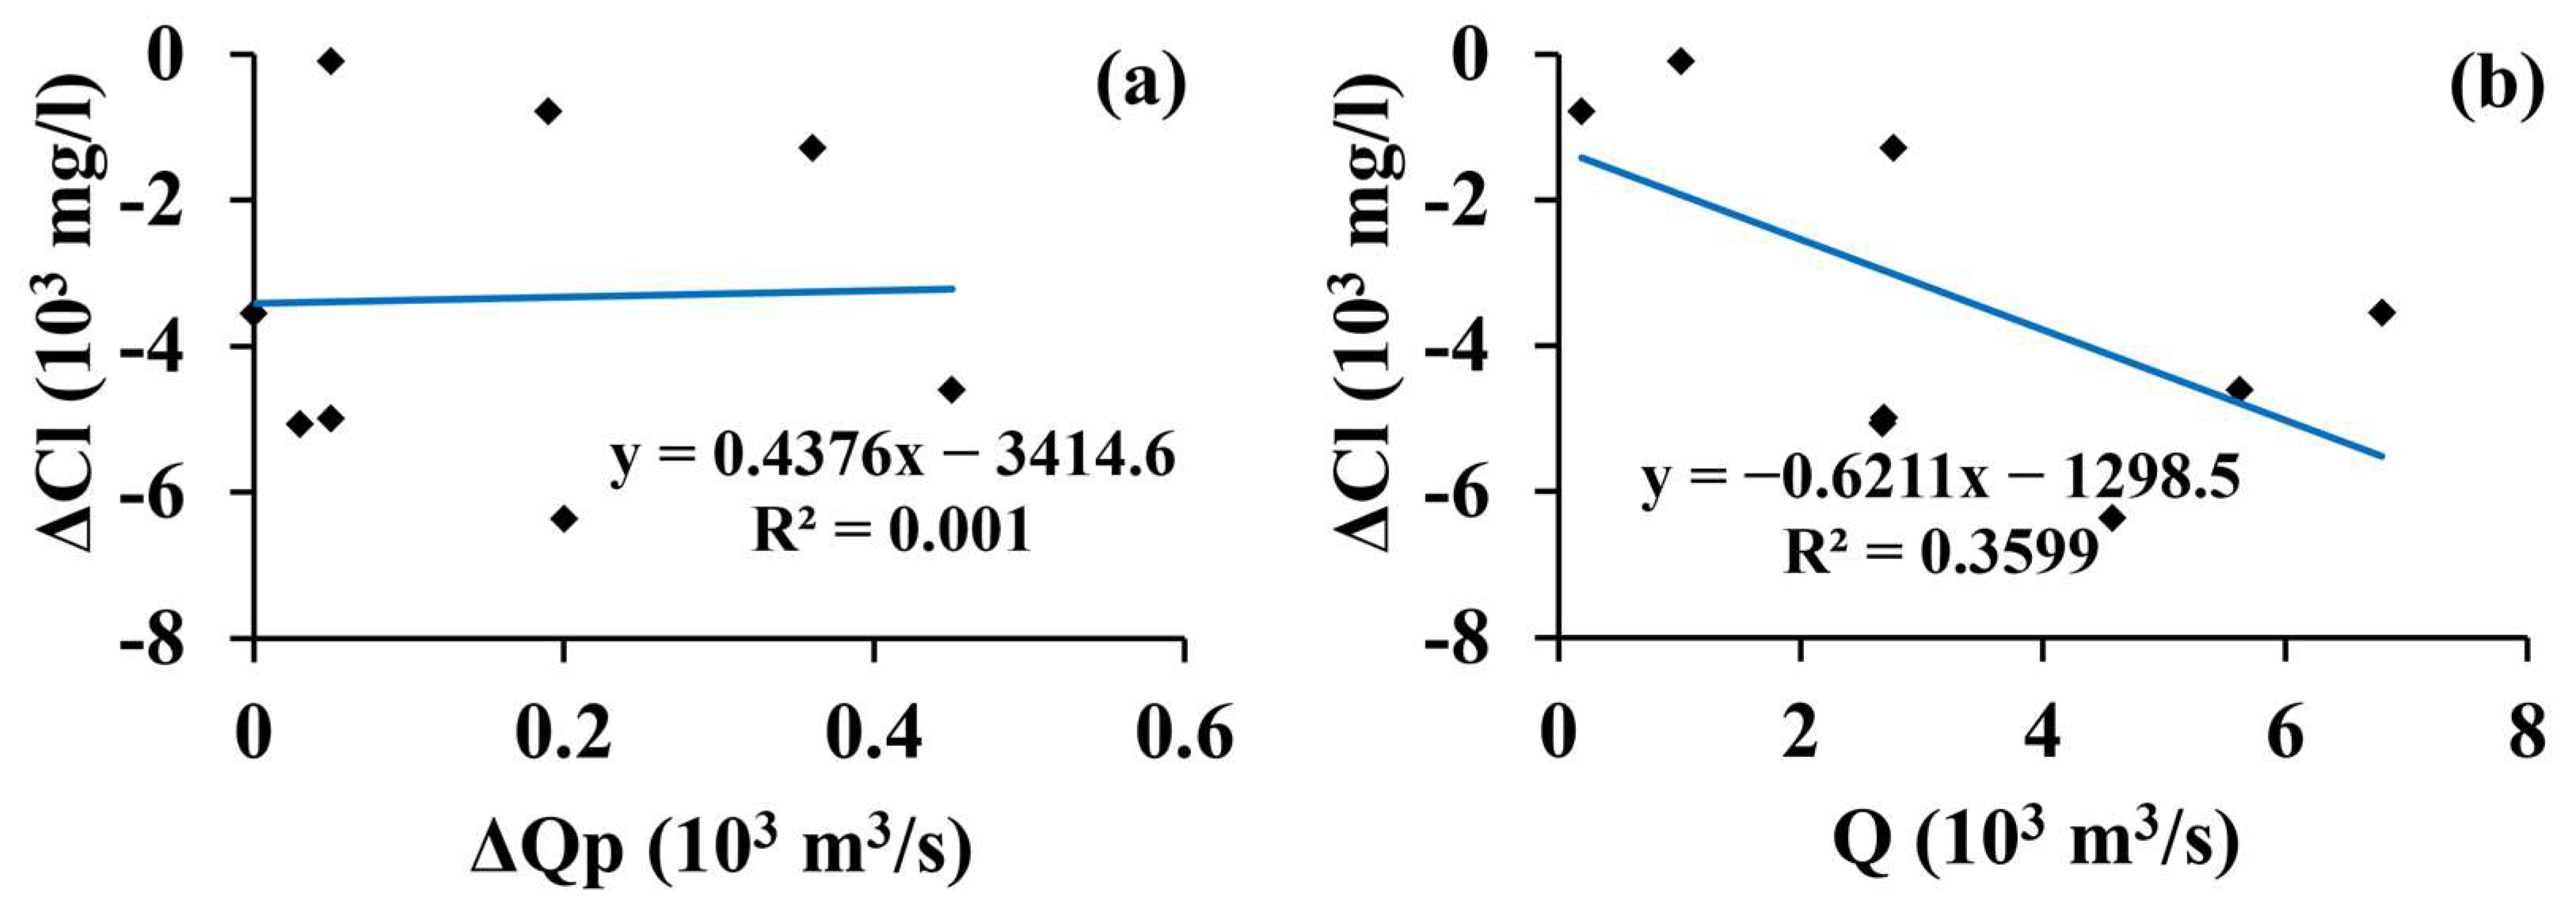
4.1. Influence of Storm Surge and Discharge on Salinity Augmentation
4.2. Impact of Typhoon Rainfall on Storm Surge-Induced Salinity Augmentation
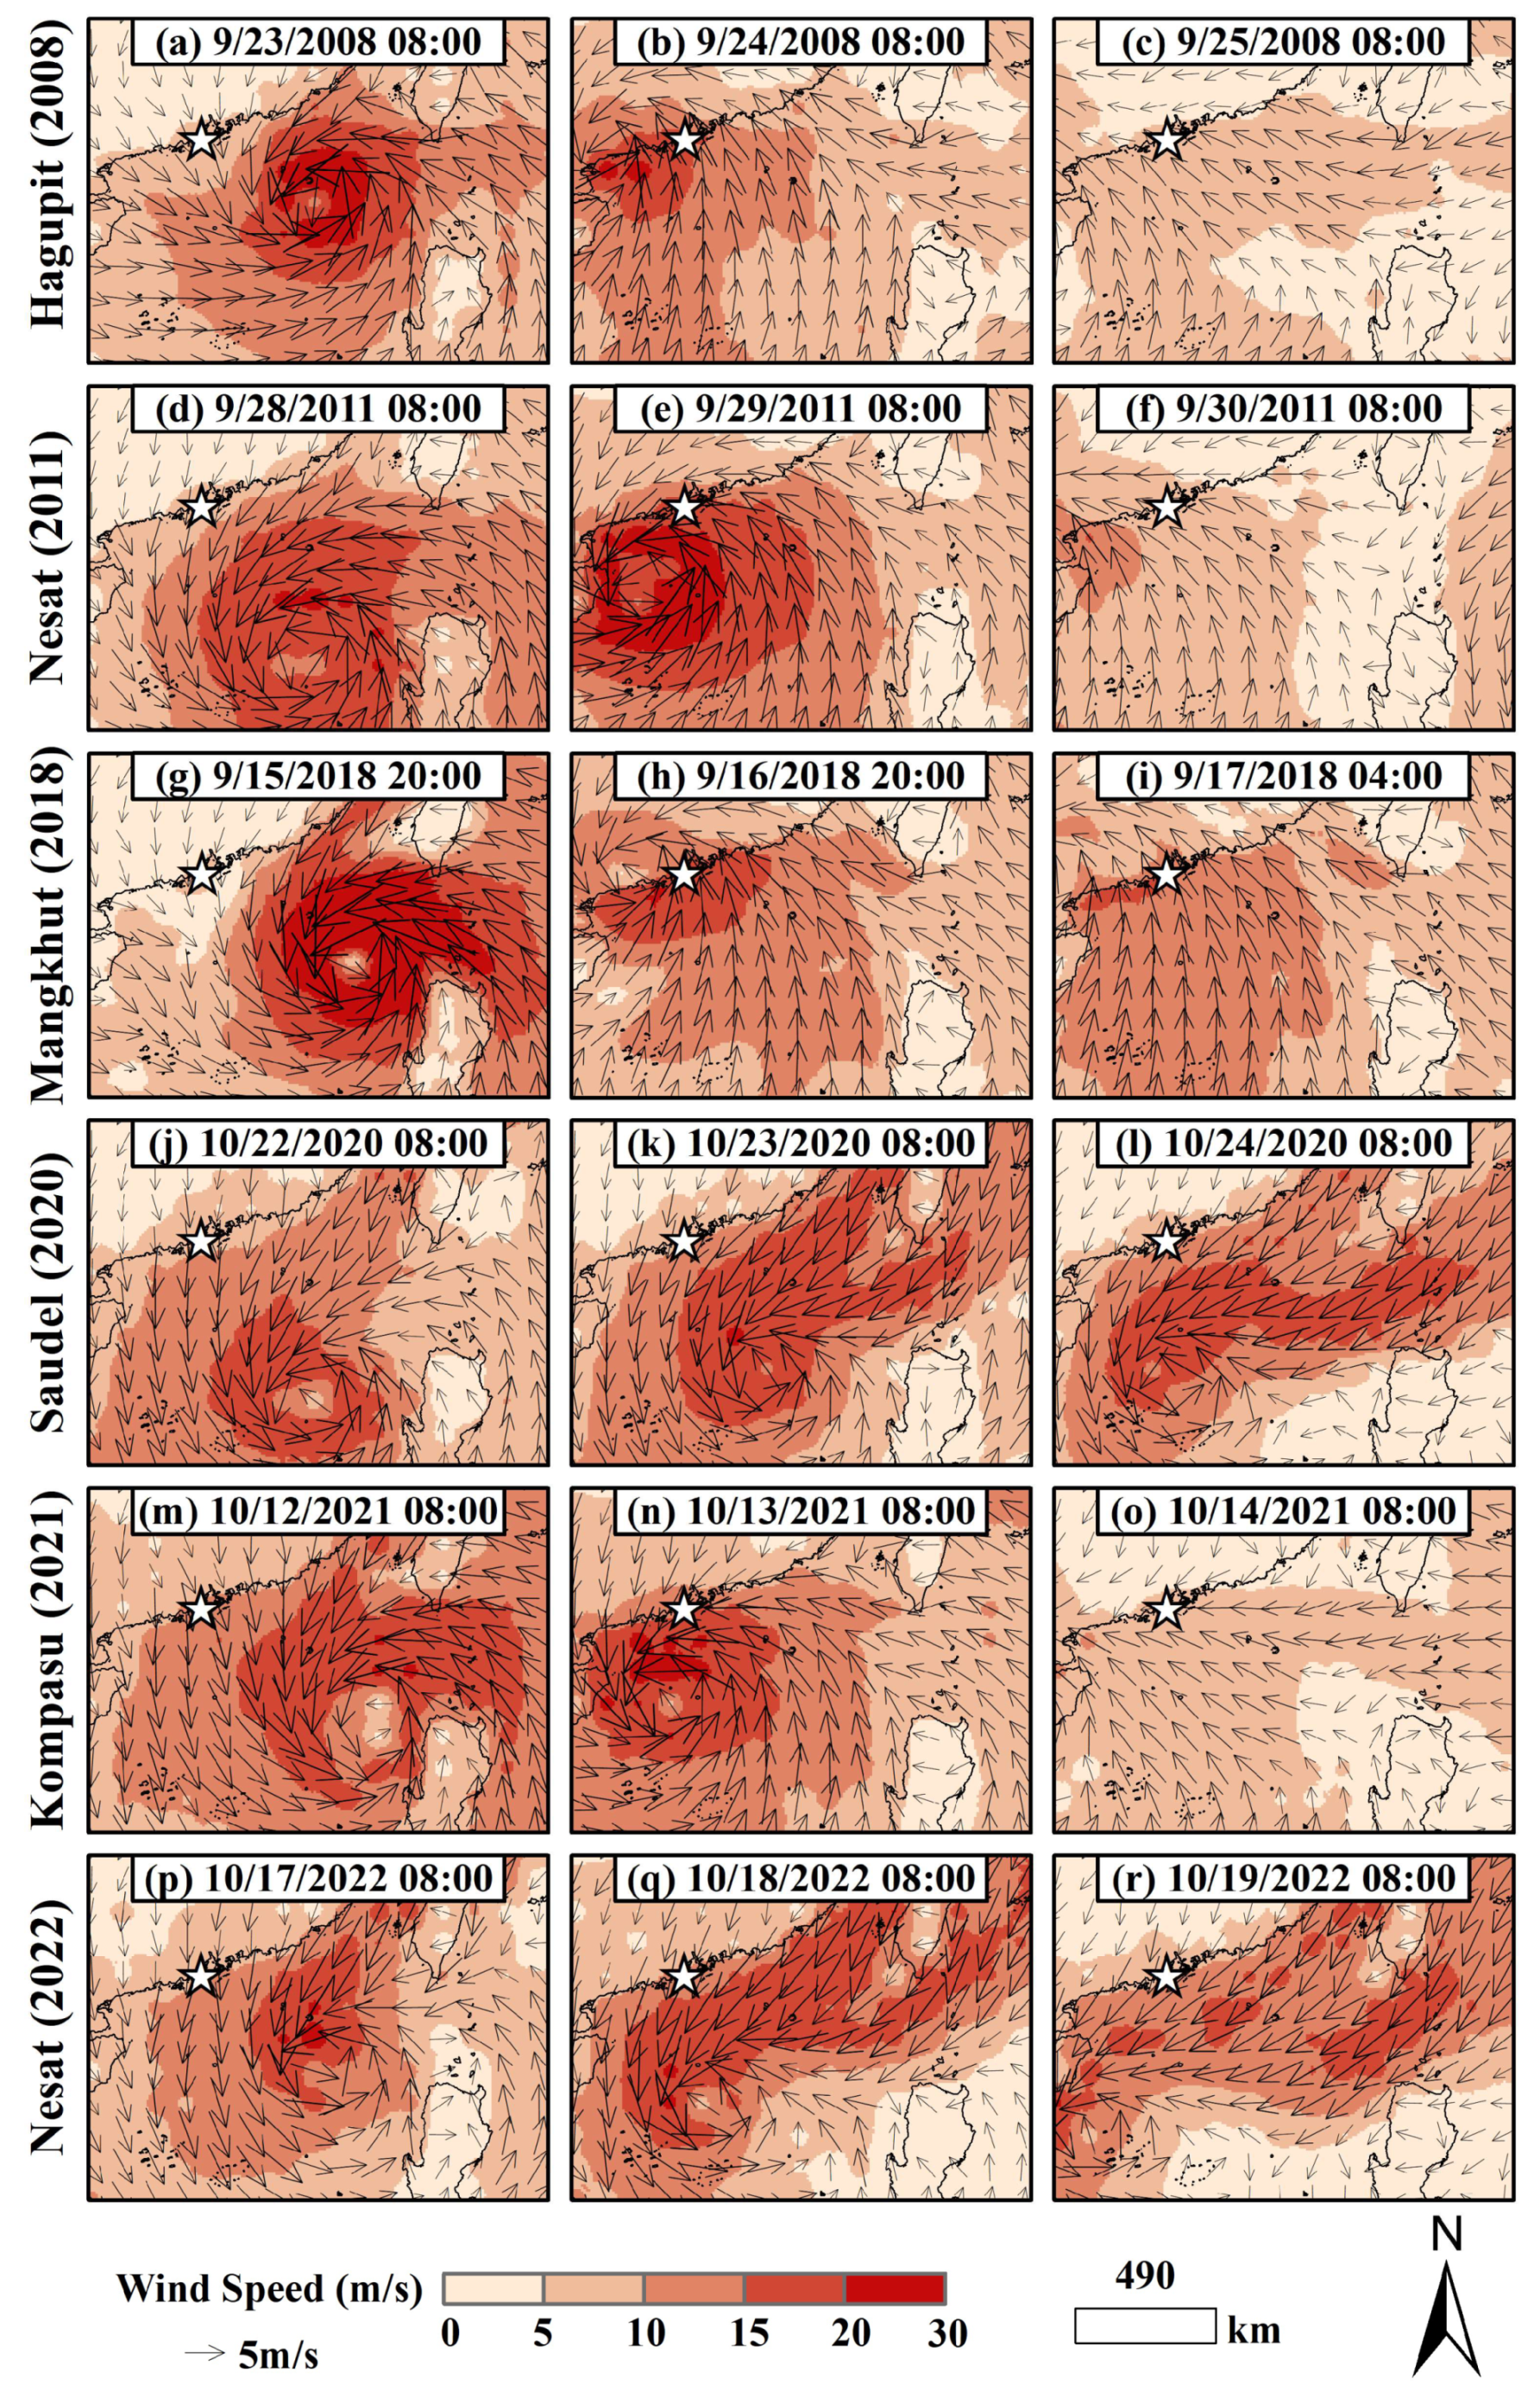
4.3. Impact of Wind Direction on Saltwater Intrusion
5. Conclusions
- (1)
- The SISA predominantly occurs in September and October, particularly in years and months, with typhoon landfalls affecting the PRE.
- (2)
- The distance between the typhoon path and the PRE affects SISA’s intensity, range, and duration. Typhoons with a closer landfall location and trajectory to the PRE tend to result in stronger salinity augmentation and longer durations of saltwater intrusion.
- (3)
- The dominant wind direction during a typhoon, particularly east and southeast winds, promotes the landward transport of strongly mixed high-salinity water, intensifying saltwater intrusion in the PRE.
- (4)
- Typhoons with a westward track cause the PRE’s most significant storm surges and salinity augmentation.
Author Contributions
Funding
Institutional Review Board Statement
Informed Consent Statement
Data Availability Statement
Acknowledgments
Conflicts of Interest
References
- Herbert, E.R.; Boon, P.; Burgin, A.J.; Neubauer, S.C.; Franklin, R.B.; Ardón, M.; Hopfensperger, K.N.; Lamers, L.P.M.; Gell, P. A Global Perspective on Wetland Salinization: Ecological Consequences of a Growing Threat to Freshwater Wetlands. Ecosphere 2015, 6, art206. [Google Scholar] [CrossRef]
- Zhou, W.; Wang, D.; Luo, L. Investigation of Saltwater Intrusion and Salinity Stratification in Winter of 2007/2008 in the Zhujiang River Estuary in China. Acta Oceanol. Sin. 2012, 31, 31–46. [Google Scholar] [CrossRef]
- Liu, B.; Peng, S.; Liao, Y.; Wang, H. The Characteristics and Causes of Increasingly Severe Saltwater Intrusion in Pearl River Estuary. Estuar. Coast. Shelf Sci. 2019, 220, 54–63. [Google Scholar] [CrossRef]
- Shen, Y.; Jia, H.; Li, C.; Tang, J. Numerical Simulation of Saltwater Intrusion and Storm Surge Effects of Reclamation in Pearl River Estuary, China. Appl. Ocean Res. 2018, 79, 101–112. [Google Scholar] [CrossRef]
- Yuan, R.; Zhu, J.; Wang, B. Impact of Sea-Level Rise on Saltwater Intrusion in the Pearl River Estuary. J. Coast. Res. 2015, 31, 477–487. [Google Scholar] [CrossRef]
- Liu, D.; Chen, X.; Lou, Z. A Model for the Optimal Allocation of Water Resources in a Saltwater Intrusion Area: A Case Study in Pearl River Delta in China. Water Resour. Manag. 2010, 24, 63–81. [Google Scholar] [CrossRef]
- Liu, B.; Yan, S.; Chen, X.; Lian, Y.; Xin, Y. Wavelet Analysis of the Dynamic Characteristics of Saltwater Intrusion - A Case Study in the Pearl River Estuary of China. Ocean Coast. Manag. 2014, 95, 81–92. [Google Scholar] [CrossRef]
- Wu, H.; Tu, X.; Chen, X.; Singh, V.P.; Alfonso, L.; Lin, K.; Liu, Z.; Lai, R. A Framework for Water Supply Regulation in Coastal Areas by Avoiding Saltwater Withdrawal Considering Upstream Streamflow Distribution. Sci. Total Environ. 2023, 905, 167181. [Google Scholar] [CrossRef]
- Short, F.T.; Neckles, H.A. The Effects of Global Climate Change on Seagrasses. Aquat. Bot. 1999, 63, 169–196. [Google Scholar] [CrossRef]
- Thomson, D.M.; Shaffer, G.P.; McCorquodale, J.A. A Potential Interaction between Sea-Level Rise and Global Warming: Implications for Coastal Stability on the Mississippi River Deltaic Plain. Glob. Planet. Chang. 2001, 32, 49–59. [Google Scholar] [CrossRef]
- Zhou, W.; Gao, J.; Liao, J.; Shi, R.; Li, T.; Guo, Y.; Long, A. Characteristics of Phytoplankton Biomass, Primary Production and Community Structure in the Modaomen Channel, Pearl River Estuary, with Special Reference to the Influence of Saltwater Intrusion during Neap and Spring Tides. PLoS ONE 2016, 11, e0167630. [Google Scholar] [CrossRef]
- Xiong, Y.J.; Liu, J.F. Can Saltwater Intrusion Affect a Phytoplankton Community and Its Net Primary Production? A Study Based on Satellite and Field Observations. Estuaries Coasts 2018, 41, 2317–2330. [Google Scholar] [CrossRef]
- Gong, W.; Lin, Z.; Zhang, H.; Lin, H. The Response of Salt Intrusion to Changes in River Discharge, Tidal Range, and Based on Wavelet in the Modaomen China. Ocean Coast. Manag. 2022, 219, 106060. [Google Scholar] [CrossRef]
- Gong, W.; Shen, J. The Response of Salt Intrusion to Changes in River Discharge and Tidal Mixing during the Dry Season in the Modaomen Estuary, China. Cont. Shelf Res. 2011, 31, 769–788. [Google Scholar] [CrossRef]
- Gong, W.; Maa, J.P.-Y.; Hong, B.; Shen, J. Salt Transport during a Dry Season in the Modaomen Estuary, Pearl River Delta, China. Ocean Coast. Manag. 2014, 100, 139–150. [Google Scholar] [CrossRef]
- Liu, B.; Liao, Y.; Yan, S.; Yan, H. Dynamic Characteristics of Saltwater Intrusion in the Pearl River Estuary, China. Nat. Hazards 2017, 89, 1097–1117. [Google Scholar] [CrossRef]
- Becker, M.L.; Luettich, R.A.; Mallin, M.A. Hydrodynamic Behavior of the Cape Fear River and Estuarine System: A Synthesis and Observational Investigation of Discharge–Salinity Intrusion Relationships. Estuar. Coast. Shelf Sci. 2010, 88, 407–418. [Google Scholar] [CrossRef]
- MacCready, P.; Geyer, W.R. Advances in Estuarine Physics. Annu. Rev. Mar. Sci. 2010, 2, 35–58. [Google Scholar] [CrossRef] [PubMed]
- Gong, W.; Lin, Z.; Chen, Y.; Chen, Z.; Zhang, H. Effect of Winds and Waves on Salt Intrusion in the Pearl River Estuary. Ocean Sci. 2018, 14, 139–159. [Google Scholar] [CrossRef]
- Wang, B.; Zhu, J.; Wu, H.; Yu, F.; Song, X. Dynamics of Saltwater Intrusion in the Modaomen Waterway of the Pearl River Estuary. Sci. China Earth Sci. 2012, 55, 1901–1918. [Google Scholar] [CrossRef]
- Zheng, S.; Guan, W.; Cai, S.; Wei, X.; Huang, D. A Model Study of the Effects of River Discharges and Interannual Variation of Winds on the Plume Front in Winter in Pearl River Estuary. Cont. Shelf Res. 2014, 73, 31–40. [Google Scholar] [CrossRef]
- Gong, W.; Chen, Y.; Zhang, H.; Chen, Z. Effects of Wave–Current Interaction on Salt Intrusion During a Typhoon Event in a Highly Stratified Estuary. Estuaries Coasts 2018, 41, 1904–1923. [Google Scholar] [CrossRef]
- Wang, J.; Kuang, C.; Chen, K.; Fan, D.; Qin, R.; Han, X. Wave–Current Interaction by Typhoon Fongwong on Saline Water Intrusion and Vertical Stratification in the Yangtze River Estuary. Estuar. Coast. Shelf Sci. 2022, 279, 108138. [Google Scholar] [CrossRef]
- Zhang, H.; Hu, S.; Cheng, W.; Zhu, L.; Chen, Y.; Liu, J.; Gong, W.; Li, Y.; Li, S. Response of Freshwater Transport during Typhoons with Wave-Induced Mixing Effects in the Pearl River Estuary, China. Estuar. Coast. Shelf Sci. 2021, 258, 107439. [Google Scholar] [CrossRef]
- Zhang, H.; Shen, Y.; Zhao, A.; Tang, J. Numerical Modelling of Storm Surge, Nutrient Pollution and Saltwater Intrusion in a Large Estuary with Typhoon Effects. Environ. Model. Softw. 2022, 155, 105449. [Google Scholar] [CrossRef]
- Pan, M.; Kong, J.; Luo, Z.; Lv, Z. Influence of Typhoon Path on Salt Water Intrusion in the Modaomen Waterway, China. J. Coast. Res. 2018, 85, 936–940. [Google Scholar] [CrossRef]
- Lin, S.; Liu, G.; Niu, J.; Wei, X.; Cai, S. Responses of Hydrodynamics to Changes in Shoreline and Bathymetry in the Pearl River Estuary, China. Cont. Shelf Res. 2021, 229, 104556. [Google Scholar] [CrossRef]
- Liu, C.; Yu, M.; Jia, L.; Cai, H.; Chen, X. Impacts of Physical Alterations on Salt Transport during the Dry Season in the Modaomen Estuary, Pearl River Delta, China. Estuar. Coast. Shelf Sci. 2019, 227, 106345. [Google Scholar] [CrossRef]
- He, Y.; Zhang, Z.; Lin, Z.; Cai, Y.; Chen, X. The Impacts of the Wetness–Dryness Encountering of the Upstream Inflow and Downstream Salt Intrusion on Water Supply in Coastal Urban Agglomeration. Water Policy 2023, 25, 87–115. [Google Scholar] [CrossRef]
- Ren, J.; Li, W.; Gao, Y. Analyzing Dynamic Characteristics of River Plume in the Modaomen Mouth, Pearl River Estuary. J. Oceanogr. 2020, 76, 247–258. [Google Scholar] [CrossRef]
- Lu, X.; Yu, H.; Ying, M.; Zhao, B.; Zhang, S.; Lin, L.; Bai, L.; Wan, R. Western North Pacific Tropical Cyclone Database Created by the China Meteorological Administration. Adv. Atmos. Sci. 2021, 38, 690–699. [Google Scholar] [CrossRef]
- Ying, M.; Zhang, W.; Yu, H.; Lu, X.; Feng, J.; Fan, Y.; Zhu, Y.; Chen, D. An Overview of the China Meteorological Administration Tropical Cyclone Database. J. Atmos. Ocean. Technol. 2014, 31, 287–301. [Google Scholar] [CrossRef]
- Blume, T.; Zehe, E.; Bronstert, A. Rainfall—Runoff Response, Event-Based Runoff Coefficients and Hydrograph Separation. Hydrol. Sci. J. 2007, 52, 843–862. [Google Scholar] [CrossRef]
- Xu, Z.; Wang, X. Flood risk analysis of local heavy storms in the embanked tidal river plain: A case study behind the Zhongshan-Shunde Joint Levee in the lower Pearl River Delta. Water Resour. Hydropower Eng. 2021, 52, 51–65. (In Chinese) [Google Scholar] [CrossRef]
- Scroccaro, I.; Spitz, Y.H.; Seaton, C.M. Effect of Local Winds on Salinity Intrusion in the Columbia River Estuary. Water 2023, 15, 326. [Google Scholar] [CrossRef]
- Scully, M.E.; Friedrichs, C.; Brubaker, J. Control of Estuarine Stratification and Mixing by Wind-Induced Straining of the Estuarine Density Field. Estuaries 2005, 28, 321–326. [Google Scholar] [CrossRef]
- Allen, J.S.; Newberger, P.A. Downwelling Circulation on the Oregon Continental Shelf. Part I: Response to Idealized Forcing. J. Phys. Oceanogr. 1996, 26, 2011–2035. [Google Scholar] [CrossRef]
- Hickey, B.M.; Zhang, X.; Banas, N. Coupling between the California Current System and a Coastal Plain Estuary in Low Riverflow Conditions. J. Geophys. Res. Oceans 2002, 107, 30-1–30-20. [Google Scholar] [CrossRef]
- Chen, S.-N.; Sanford, L.P. Axial Wind Effects on Stratification and Longitudinal Salt Transport in an Idealized, Partially Mixed Estuary. J. Phys. Oceanogr. 2009, 39, 1905–1920. [Google Scholar] [CrossRef]
- Jia, P.; Li, M. Dynamics of Wind-Driven Circulation in a Shallow Lagoon with Strong Horizontal Density Gradient. J. Geophys. Res. Oceans 2012, 117, C05013. [Google Scholar] [CrossRef]
- Wang, J.; Hong, B. Threat Posed by Future Sea-Level Rise to Freshwater Resources in the Upper Pearl River Estuary. J. Mar. Sci. Eng. 2021, 9, 291. [Google Scholar] [CrossRef]
- Chen, J.; Jiang, C.; Wu, Z.; Long, Y.; Deng, B.; Liu, X. Numerical Investigation of Fresh and Salt Water Distribution in the Pearl River Estuary during a Typhoon Using a Fully Coupled Atmosphere-Wave-Ocean Model. Water 2019, 11, 646. [Google Scholar] [CrossRef]
- Yu, Q.; Wang, X.; Fang, Y.; Ning, Y.; Yuan, P.; Xi, B.; Wang, R. Comprehensive Investigation on Spatiotemporal Variations of Tropical Cyclone Activities in the Western North Pacific, 1950–2019. J. Mar. Sci. Eng. 2023, 11, 946. [Google Scholar] [CrossRef]


| NO. | Parameter | Description | Source |
|---|---|---|---|
| 1 | Precipitation | Daily precipitation (mm) from GPM IMERG | NASA |
| 2 | Water level 1 | From GC station (m), hourly recorded | ZWEHG, PRWRC |
| 3 | River discharge | From WZ station (m3/s), daily recorded | ZWEHG |
| 4 | Chloride 1 | From GC, PG, and ZZT stations (mg/L), hourly recorded | ZWEHG |
| 5 | Chloride 2 and water level 2 | From RY to DCK stations (mg/L), recorded every 5 min | ZWA |
| 6 | Typhoon track | CMA Tropical Cyclone Best Track Dataset, recorded every 6 h | CMA |
| 7 | Wind speed | ERA5 reanalysis data recorded every 1 h | ECMWF |
| Name and Landfall Date of Typhoons | HW 1 (m/s) | LP 2 (hPa) | Storm surge (m) | PWL 3 (m) | River Discharge 4 (m3/s) | Distance 5 (km) | SISA (mg/L) | Tide Phase 6 |
|---|---|---|---|---|---|---|---|---|
| Hagupit (2008) 24 September 2008 | 50 | 940 | 1.77 | 3.20 | 5000 | 127 | 9590 | N, high tide |
| Mujigae (2009) 10 September 2009 | 20 | 992 | 0.25 | 1.83 | 2817 | 301 | 2048 | S to M, high tide |
| Koppu (2009) 15 September 2009 | 40 | 960 | 1.55 | 3.13 | 2515 | 65 | 10,190 | N to M, high tide |
| Nesat (2011) 29 September 2011 | 40 | 960 | 0.68 | 2.45 | 1470 | 299 | 6000 | S, high tide |
| Nalgae (2011) 3 October 2011 | 30 | 980 | 0.37 | 2.50 | 1690 | 467 | 800 | S to M, low tide |
| Kalmaegi (2014) 16 September 2014 | 40 | 960 | 1.15 | 2.66 | 4830 | 315 | 4600 | S to M, high tide |
| Mangkhut (2018) 16 September 2018 | 48 | 950 | 1.64 | 2.95 | 4910 | 51 | 6190 | M to N, low tide |
| Saudel (2020) 23 October 2020 | 30 | 980 | 0.11 | 1.78 | 6670 | 460 | 3400 | M to N, high tide |
| Kompasu (2021) 13 October 2021 | 33 | 970 | 0.62 | 2.10 | 3220 | 325 | 5700 | M to N, flood tide |
| Nesat (2022) 18 October 2022 | 42 | 955 | 0.39 | 2.05 | 1780 | 381 | 4834 | M to N, flood tide |
Disclaimer/Publisher’s Note: The statements, opinions and data contained in all publications are solely those of the individual author(s) and contributor(s) and not of MDPI and/or the editor(s). MDPI and/or the editor(s) disclaim responsibility for any injury to people or property resulting from any ideas, methods, instructions or products referred to in the content. |
© 2024 by the authors. Licensee MDPI, Basel, Switzerland. This article is an open access article distributed under the terms and conditions of the Creative Commons Attribution (CC BY) license (https://creativecommons.org/licenses/by/4.0/).
Share and Cite
Gao, Y.; Wang, X.; Dong, C.; Ren, J.; Zhang, Q.; Huang, Y. Characteristics and Influencing Factors of Storm Surge-Induced Salinity Augmentation in the Pearl River Estuary, South China. Sustainability 2024, 16, 2254. https://doi.org/10.3390/su16062254
Gao Y, Wang X, Dong C, Ren J, Zhang Q, Huang Y. Characteristics and Influencing Factors of Storm Surge-Induced Salinity Augmentation in the Pearl River Estuary, South China. Sustainability. 2024; 16(6):2254. https://doi.org/10.3390/su16062254
Chicago/Turabian StyleGao, Yixiao, Xianwei Wang, Chunyu Dong, Jie Ren, Qingnian Zhang, and Ying Huang. 2024. "Characteristics and Influencing Factors of Storm Surge-Induced Salinity Augmentation in the Pearl River Estuary, South China" Sustainability 16, no. 6: 2254. https://doi.org/10.3390/su16062254