Abstract
This study reveals the modification of the surface area of natural zeolite Clinoptilolite (CLN) by implementing the ion exchange method. The ammonium chloride cation exchange method was adopted and was followed by calcination at 450 °C for 5 h. This procedure helps to increase the surface area of CLN and also enhances its adsorption efficiency. The modifications of the CLN were confirmed by Fourier-transform infrared (FT-IR) spectroscopy and X-ray diffraction (XRD) analysis. The efficiency and adsorption capacity of the modified CLN were determined by the adsorption of a Rhodamine B (Rh B) dye from an aqueous medium. The comparative analysis of the adsorption efficiency of raw CLN and the modified CLN revealed an enhanced adsorption of Rh B by the modified CLN at pH = 10. For desorption, different solvents were used. The results showed good desorption in ethanol and methanol, and poor desorption in acidic (HCl) and basic (NaOH) solutions. The kinetic study of the adsorption of Rh B by the modified CLN helped us to conclude that the adsorption follows a pseudo-second-order kinetics. For the surface study and to understand the mechanism of adsorption, several isotherm models were applied to the adsorption data at equilibrium. The data showed consistency with the Freundlich adsorption isotherm confirming that the process took place at its heterogeneous surface. The experimentally calculated adsorption capacity of the modified CLN was 2.81 mg g−1, showing a comparable value to certain other common adsorbents. Therefore, the modified CLN may also be considered a cost-effective and promising adsorbent for the removal of Rh B dye from wastewater.
1. Introduction
Water is the most crucial and valuable compound on the Earth’s surface for all living beings. Our planet is mostly covered with water (71%); however, the fraction available for drinking purposes is less than 1%; therefore, ithas been more challenging to provide safe and clean water in recent times [1]. Poor water quality is due to the presence of various toxic chemicals including dyes. Some of the main ways that these chemicals end up in water bodies are through industry, urban waste, and agricultural practices [2].
Industry has unquestionably played a significant role in raising the standard of living for humanity, but is also the world’s top polluter due to its extensive use of chemicals and fuel. Air, soil, and water are all simultaneously contaminated. One of the many dangerous substances that are widely used in the textile, leather, paper, food processing, and agricultural industries, as well as in biological and chemical research, that contaminates water supplies is dye [3,4]. The huge amounts of drinking water utilized in the chain of production processes—such as washing, bleaching, and dyeing—are given special consideration. Reactive, basic, and acidic dyes are among the soluble organic molecules employed as coloring agents. It is difficult to dispose of them using conventional methods because of their solubility in water.
The color of textile dyes harms aquatic bodies not just visually but also because they block light from penetrating the water, slowing down photosynthesis and depleting the water’s supply of dissolved oxygen, which impacts the entire aquatic biota. In addition, textile dyes penetrate whole food chains, behave as poisonous, mutagenic, and carcinogenic substances, and persist as environmental pollutants. In this regard, particular attention should be given to azo-type textile dyes, of which 15–50% do not bond to the cloth during the dyeing process and are discharged into wastewater, which is frequently utilized for agricultural irrigation in underdeveloped nations. The application of these azo chemicals has a detrimental effect on plant germination and growth as well as soil microbial populations. Rhodamine B (Rh B) belongs to the azo dyes group and is one of the most toxic dyes used in the textile industry due to its highly stable, non-biodegradable nature and bright pink color. Water contaminated with Rh B produces adverse effects on plants by preventing light penetrating into the plants and thus reducing the rate of photosynthesis. It also causes serious health problems in humans, i.e., cancer, kidney dysfunction, and skin and respiratory tract infection. Inhalation and ingestion of Rh B causes liver and thyroid failure [5,6,7]. Therefore, determination of Rh B in various samples is crucial in order to remove it.
The classic wastewater treatment approaches, i.e., flocculation, coagulation, sedimentation, aeration, etc., are efficient in removing particulate matter from wastewater but their efficiency is low for colors/dyes and other dissolved organic pollutants [8,9,10]. Moreover, these methods involve the production of toxic by-products, high energy usage, and a large area required for method application [5]. Therefore cost-effective, efficient, and environmentally friendly approaches are necessary for the removal of Rh B and other toxic substances from wastewater.
More effective dye removal techniques have been published recently [1]. These techniques consist of adsorption, membrane separation, photocatalytic degradation, and oxidation methods [11,12,13,14]. Adsorption is the most often used technique for removing dyes and heavy metals among these since it is simple, effective, and sustainable because the adsorbent it uses is readily available [15,16]. Adsorbents such as activated carbons, polymer composites, biomass, waste mud, silica, metal-organic frameworks, zeolite, and clays have all been documented in the adsorption process for the removal of dyes [1,11]. Natural zeolites are often very porous, have good adsorption capacities and cation exchange properties, are environmentally friendly, and are reasonably priced. Therefore, they can be applied as effective adsorbents for the removal of pollutants including dyes from water containing these pollutants and for other applications [12].
Zeolites are crystalline and have aluminosilicate structures containing aluminum (Al3+) and silicon (Si4+) cations in a tetrahedral arrangement, surrounded by four oxygen atoms as anions. In this way, the ions formed have a charge difference such as (AlO4)5− and (SiO4)4−. Generally, cations such as Li+, Na+, K+, Ca2+, Mg2+, Ba2+, and Ra2+ are used to balance the negative charge in zeolite [17,18,19,20].
One of the most prevalent zeolites is Clinoptilolite (CLN), which has the chemical formula (Na, K, Ca)4Al6Si30O72·24H2O. This heulandite group type has a Si/Al ratio of four to five. In CLN, there are big channels that intersect and microspores that are filled with exchangeable cations and water molecules. Zeolite is an appealing option for the adsorption of many contaminants found in water because of its ionexchange capacity. It is most frequently employed in pharmaceuticals for different kinds of drug synthesis and environmental technology for the removal of heavy metals, dyes, and surfactants [21,22,23]. Unfortunately, the porosity and surface area of natural CLN are low. Thus, in order to improve natural CLN’s sorptive qualities, pretreatments of this kind are crucial. Pretreatment methods include modification of the material with inorganic salts (NaCl, FeCl2, NH4Cl), treatment with basic (NaOH, KOH) or acidic (HCl, HNO3, H2C2O4, H3PO4) solutions, acid leaching or ammonium exchange/calcination to prepare the H-form of CLN, and treating it sequentially with acid bases to create mesoporous CLN [12,24].
The ammonium exchange/calcination approach preserves the crystalline form of natural CLN and causes less structural damage than the acid leaching method for preparing H-CLN. Consequently, ammonium ions were used to modify CLN in the current work, and it was then calcined at 450 °C. The modified CLN becomes more porous when heated, revealing a high adsorption efficiency and facilitating the binding of larger molecules such as dyes. FT-IR, XRD, and point of zero charge were used to characterize the adsorbent’s structure both before and after modification. In order to conclude that modified CLN is an efficient and economical adsorbent for the removal of Rhodamine B dye from wastewater, its adsorption efficiency was examined and compared with other adsorbents, i.e., previous results for the dye Rhodamine B in an aqueous medium.
2. Materials and Methods
2.1. Materials
Analytical grade chemicals were used during the study. CLN under the CAS number 12173-10-3 and HTS code 25,309,000 was purchased from the Aydin Dunan Aegean exporters associations register No. 22,165, Turkey. The mineral composition of this clay was 92–96% CLN, 4–6% clayish mica, and 0–5% tridymit; its porosity was 45–50%. Rhodamine B was imported from Boss Chemical Industry Co, Ltd., China. All the other chemicals, including ammonium chloride (NH4Cl, 99.98%), hydrochloric acid (HCl, 37%), sodium hydroxide (NaOH, 98%), methanol (CH3OH, 99.60%), ethanol (CH3CH2OH, 95%), nitric acid (HNO3, 70%), acetic acid (CH3COOH, 99%), boric acid (H3BO3,99.5%), and phosphoric acid (H3PO4, 85%), were purchased from Sigma Aldrich GmbH, Germany.
2.2. Instruments
The instrumentation for this study includes a controlled temperature water bath (Yu Jia, China), an orbital shaker (Model OS-340C, digisystem laboratory instrument Inc. Made in Taiwan R.C.O), a pH meter (Model-Hanna Edge. III 2020), a magnetic stirrer (MS 300Hs Misung Co. Ltd., Korea), and a UV–visible spectrophotometer (721, FAITHFUL, Cangzhou, China, having matched 1 cm glass cells).
2.3. Modification Procedure of CLN
The experimental procedure involves the following steps.
2.3.1. Preparation of a 0.1 M NH4Cl Solution
The NH4Cl solution of 0.1 M was prepared by dissolving 1.32 g of ammonium chloride in small amount of distilled water followed by final volume of 250 mL.
2.3.2. Modification of CLN Using the IonExchange Method
The CLN was modified using the cation (NH4+ ion) exchange method with some modifications [25]. The 12.5 g of zeolite was added to 250 mL of 0.1 M NH4Cl solution. The resulting solution was stirred on a magnetic stirrer at 70 °C for 1/2 h. After stirring, it was filtered and placed in the open air for 24 h. Finally, it was oven-dried at 80 °C for 3 h followed by calcination at 450 °C in a furnace for 5 h. Ammonia (NH3) was eliminated during calcination, producing an altered CLN such as H-CLN.
2.4. Characterization Procedure for the CLN and Modified CLN
The following techniques were used to characterize the CLN and modified CLN.
2.4.1. FT-IR and XRD Analyses
The functional groups in the CLN and modified CLN were identified by FT-IR spectroscopy using a Spectrum Two (Perkin Elmer, UK) in the spectral range of 400–4000 cm−1.
The crystallinity of both the CLN and modified CLN were studied by XRD analysis using an XRD model JDX-9C, Japan, at room temperature and Cu-Kα as the monochromatic radiation source (λ = 1.5418 Å) at 40 KV and 30 mA in the 2θ range of 0–80° with 1.03° per minute.
2.4.2. Determination of the Point of Zero Charge (pzc) of the Adsorbent
Since CLN’s point of zero charge (pzc) has already been discussed in the literature, the modified CLN’s pzc was ascertained by following this process.
A total of 0.05 g of the adsorbent (modified CLN) was introduced to each of a series of flasks that contained 10 mL of 0.1 M KNO3 after the pH of each flask was raised from 2 to 10 using HCl and NaOH solutions. The pH was determined after these flasks were shaken at 150 rpm for an entire day, i.e., 24 h. The difference between the pre- and post-shaking pHs was drawn versus the starting or initial pH of the solution. The point on the x-axis where the curve crosses the x-axis reveals the point of zero charge (pzc) of the adsorbent’s surface. The point of zero charge basically indicates the pH level at which the adsorbent’s surface has no net charge, or it has zero charge with equal surface densities of positive and negative charges in the solution.
2.5. Spectral Analysis of the Rh B Dye in an Aqueous Medium
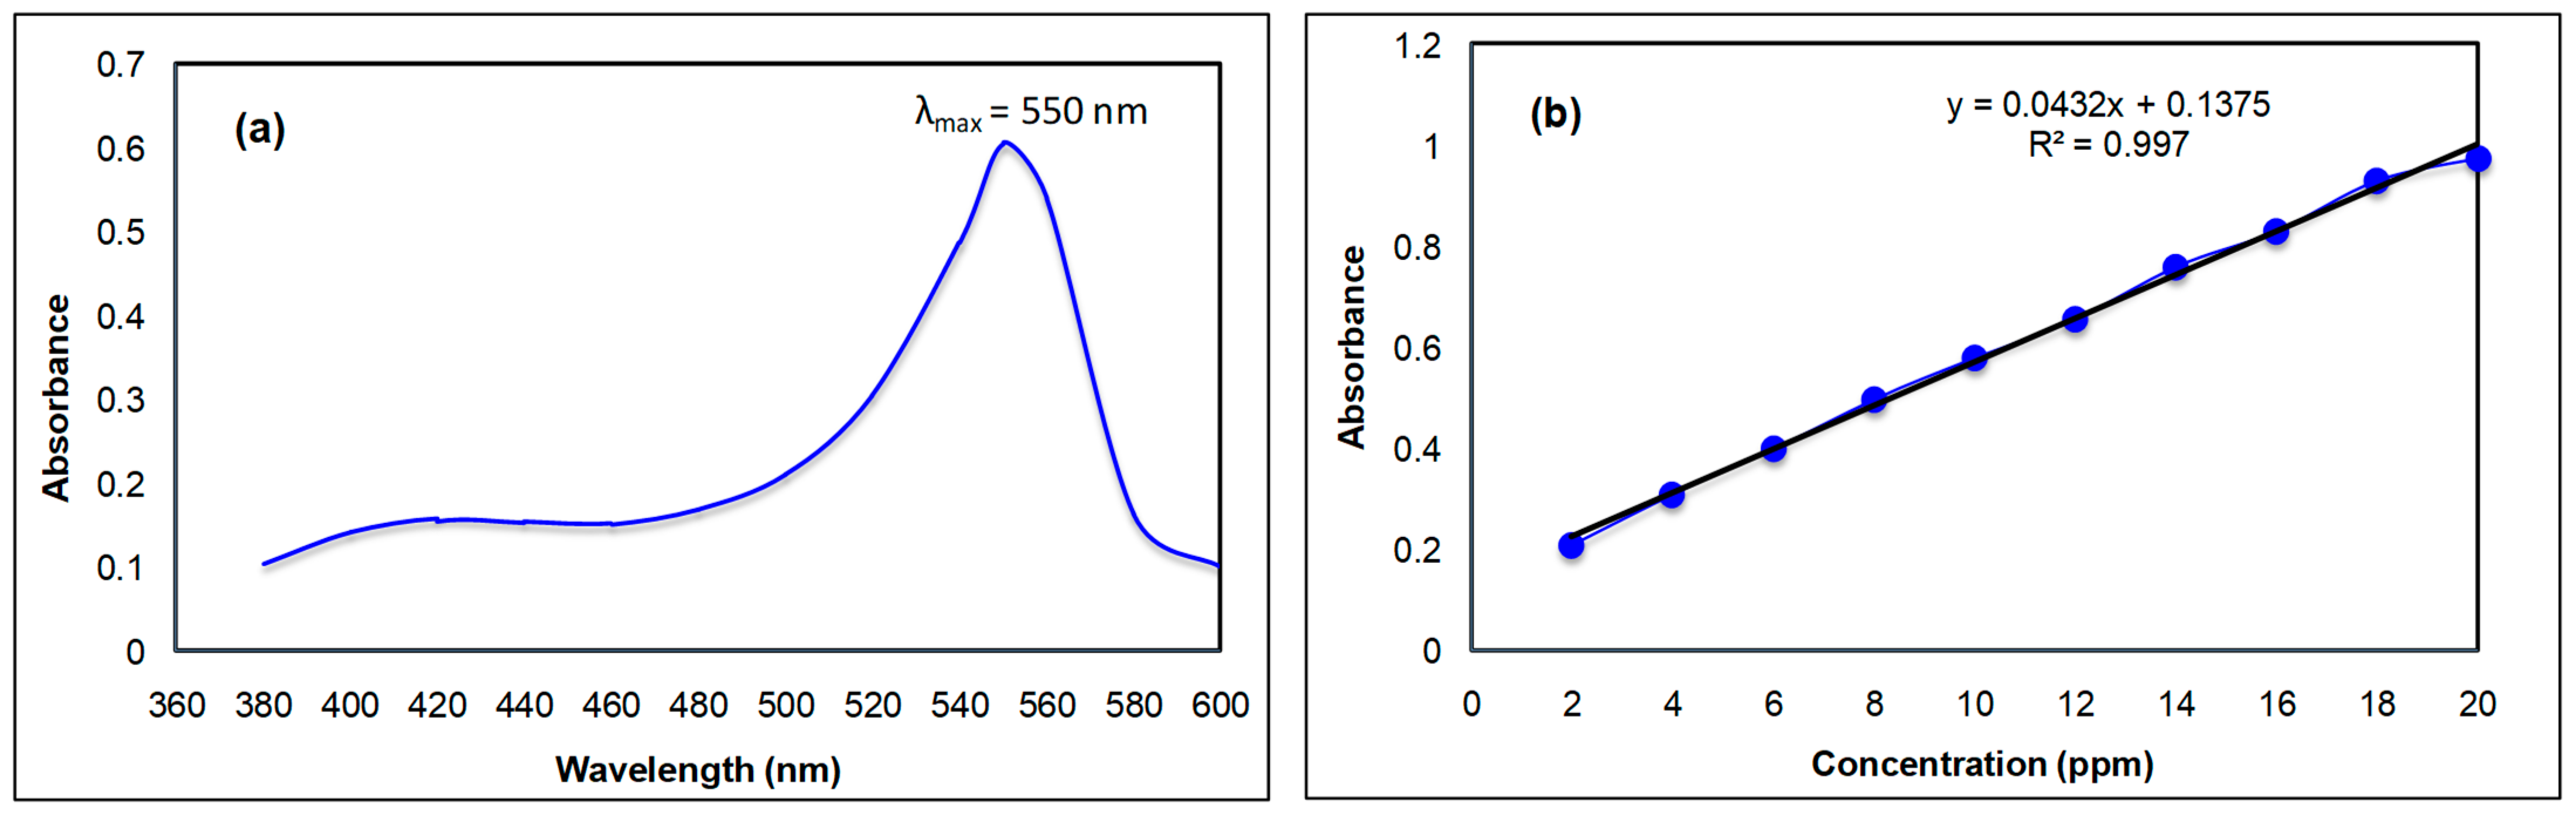
The spectral analysis of the Rh B dye was carried out in the visible region between 360 and 600 nm in an aqueous medium. The highest absorbance value was obtained at 550 nm; therefore, this wavelength was selected as the wavelength maximum for further study. The spectrum is displayed in Figure 1a. Using a calibration curve, the molar extinction coefficient of the Rh B at 550 nm was also ascertained. The Rh B concentration range adjustments were made between 2 and 20 ppm. Figure 1b presents the findings. The molar extinction coefficient of the Rh B can be obtained from the plot’s slope. The intercept value of Figure 1b was subtracted from the absorbance value whenever the absorbance was used to obtain the concentration of Rh B. The resulting figure was then divided by the slope value, which yielded the concentration of Rh B in parts per million.

Figure 1.
(a) Absorption spectrum of the Rh B in an aqueous medium. (b) Calibration curve of the Rh B in an aqueous medium.
2.6. Adsorption Study
The adsorption of Rhodmine B (Rh B) was studied in an aqueous medium by adopting following procedure to acquire data.
2.6.1. Preparation of the Working Solutions of Rh B
An Rh B dye of a 100 μg/mL concentration (stock solution, i.e., 100 ppm) was prepared using distilled water. Several dye concentrations such as from 2 to 20 μg/mL (2–20 ppm) were prepared in 25 mL volumetric flasks by diluting an appropriate amount taken from the 100 ppm stock solution.
2.6.2. Optimization of Various Parameters for the Adsorption of the Rh B Dye on the Raw CLN and Modified CLN
In order to compare the maximal adsorption of Rh B by both the raw and modified CLN, the optimization of the experimental parameters, including contact time, pH, adsorbent dose, temperature, and adsorbate concentration, was investigated. The following describes the standard experimental configuration used to investigate each parameter.
To determine the contact time, 0.1 g of the adsorbent was added to 10 different flasks, and then 5 mL of the Rh B dye from the stock solution (100 ppm) was added and diluted up to 25 mL, yielding 20 ppm of Rh B. The flasks holding the working solutions were allowed to equilibrate at room temperature for a duration of 10 to 100 min, with and without continuous shaking at 100 rpm on an orbital shaker. To determine the concentration of Rh B after adsorption, the absorbance of the filtrate of each solution was measured at 550 nm. In this experimental setup, only modified CLN was used to optimize the contact time for the adsorption process, and also to optimize the experimental condition of the need for shaking.
The adsorbate and adsorbent were taken in similar amounts and concentrations for the pH investigation, as previously described. After adjusting the pH values of these solutions with Briton–Robinson buffer at room temperature between 2 and 10, they were diluted up to 25 mL with distilled water. On an orbital shaker, the solution-filled flasks were shaken for 40 min at a speed of 100 rpm. After shaking, the absorbance of each filtrate was measured at a wavelength of 550 nm to determine the concentration of Rh B.
Various adsorbent dosages, ranging from 0.05 to 0.5 g, were added to each of the ten flasks, which each held 2 mL of pH 10 buffer. Each flask was filled with a 20 ppm/25 mL solution of Rh B. On an orbital shaker set to 100 rpm, all solutions were shaken for 40 min at ambient temperature. Following agitation, the resultant filtrates were subjected to absorbance analysis using the previously described methodology to determine the concentration of Rh B.
Ten flasks with a pH 10 buffer solution each were introduced, each containing an equivalent amount of adsorbent (0.4 g). Each flask received 25 mL of a 20 ppm Rh B solution. These flasks, which contained the dye solution and adsorbent, were heated for two to three minutes on a water bath between 25 and 100 °C. After that, they were shaken for up to 40 min at 100 rpm on an orbital shaker. After shaking and adsorption, the concentration of Rh B was calculated using the methodology described previously.
A constant dose of adsorbent (0.4 g) was taken in each of the nine flasks containing 2 mL of pH 10 buffer solutions in order to determine the optimal concentration of Rh B for its maximal adsorption. Each flask carrying the adsorbent and totaling 25 mL at pH 10 was prepared with the Rh B solution at concentrations between 20 and 100 ppm. The working solutions in the flasks were heated to 40 °C and then shaken for 40 min at 100 rpm on an orbital shaker. To find the concentration of Rh B, the filtrates of the aforementioned solutions were subjected to an absorbance measurement at 550 nm.
2.7. Desorption Study
The desorption study was performed with 0.1 M of HCl and NaOH solution each, and with ethanol and methanol separately, at ambient temperature. In a typical procedure, the filter paper containing the adsorbent residue was collected and then treated with 10 mL of the above solvents separately. Those solutions containing adsorbent (modified CLN) residue and dye molecules were shaken on orbital shaker for almost 40 min at 100 rpm and the absorbance of the filtrate was recorded at 550 nm to calculate the Rh B concentration.
The following equation was used to calculate the % desorption of the dye molecules.
3. Results and Discussion
3.1. Characterization of CLN and Modified CLN
3.1.1. FT-IR Spectral Analysis
For the natural and modified CLN, the percentage of transmittance (%T) was measured using a FT-IR spectrophotometer (model mentioned in Section 2.4.1). The threshold was set at zero for maximum peak detection. The FT-IR spectra of the raw CLN and modified CLN are displayed in Figure 2a. The bands in the range of 1100 to 400 cm−1 may be assigned to the aluminosilicate structure of the material. The bands in the range of 850 to 700 cm−1 are due to the symmetric stretching vibrations of quartz or amorphous SiO2, while those in the range of 600 to 400 cm−1 are due to the bending vibrations of Si–O–Si. The intensity of this band varied from sample to sample, indicating that the superimposition from the bands attributed to amorphous materials and/or exchangeable cations is a possibility. However, bands between 420 to 300 cm−1 may be observed due to pore opening vibrations and 650 to 500 cm−1 may because of double-ring vibrations [24,26].
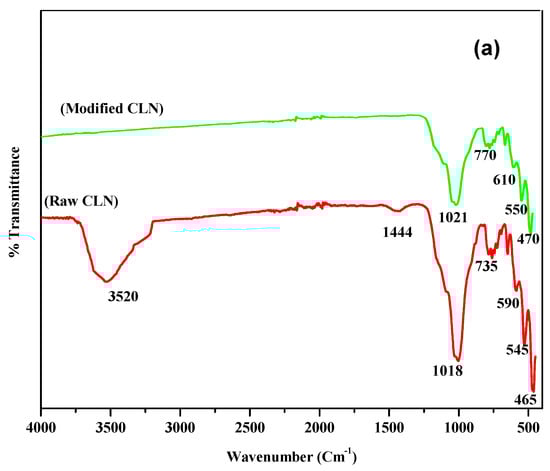

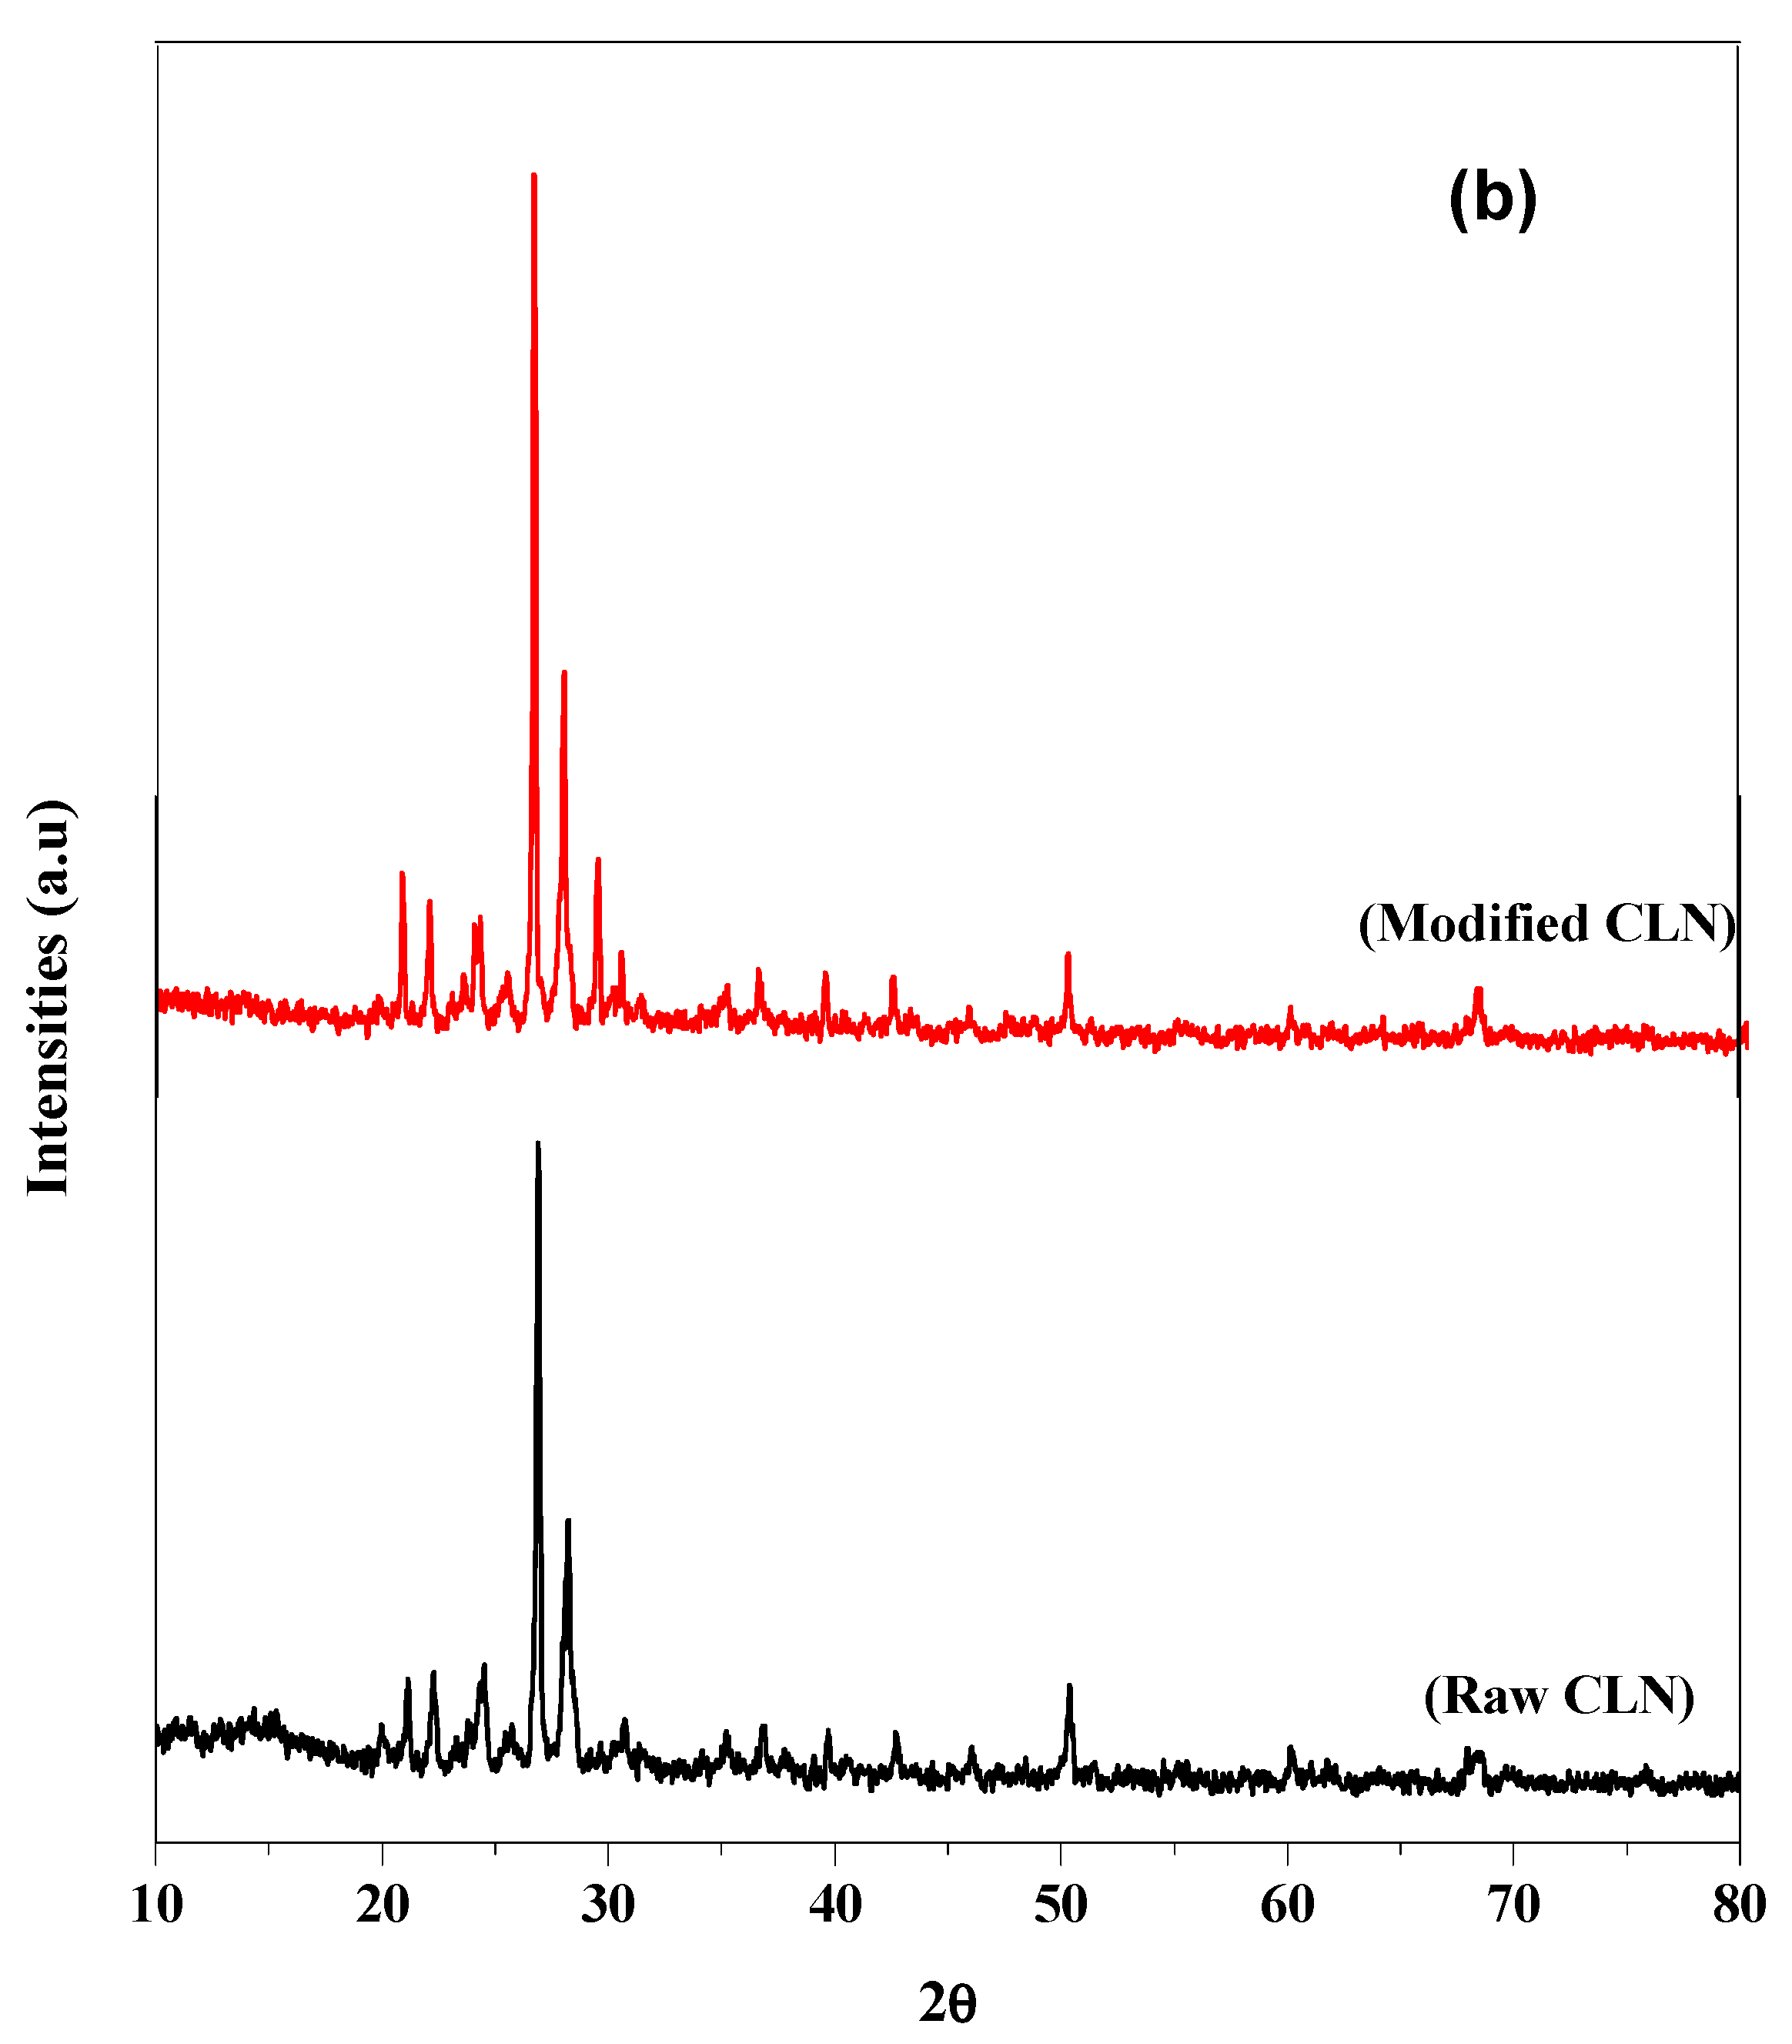
Figure 2.
(a) FT-IR spectral analysis of raw and modified CLN. (b) XRD spectra of raw and modified CLN.
3.1.2. XRD Pattern
The XRD spectra of the raw and modified CLN are shown in Figure 2b, where the y-axis shows intensity and the x-axis displays 2θ values. Comparing Figure 2b with the standard maps, the diffraction peaks of the raw CLN are mainly at positions 22.5°, 25°, and 30°. Similarly, the peaks at 22° and 44.5° are due to SiO2. The oxide of silicon and aluminum shows peaks at 50°, 58°, and 68° [27]. The degree of crystallinity of the raw CLN was calculated to be 76%, while that of the modified CLN was calculated to be 78%, using symmetric pseudo-Voigt functions [28]. The crystallinity of the modified CLN remains the same; however, the intensities of various peaks are slightly changed, possibly because of the modification.
3.1.3. Point of Zero Charge (pzc) of the Raw and Modified CLN
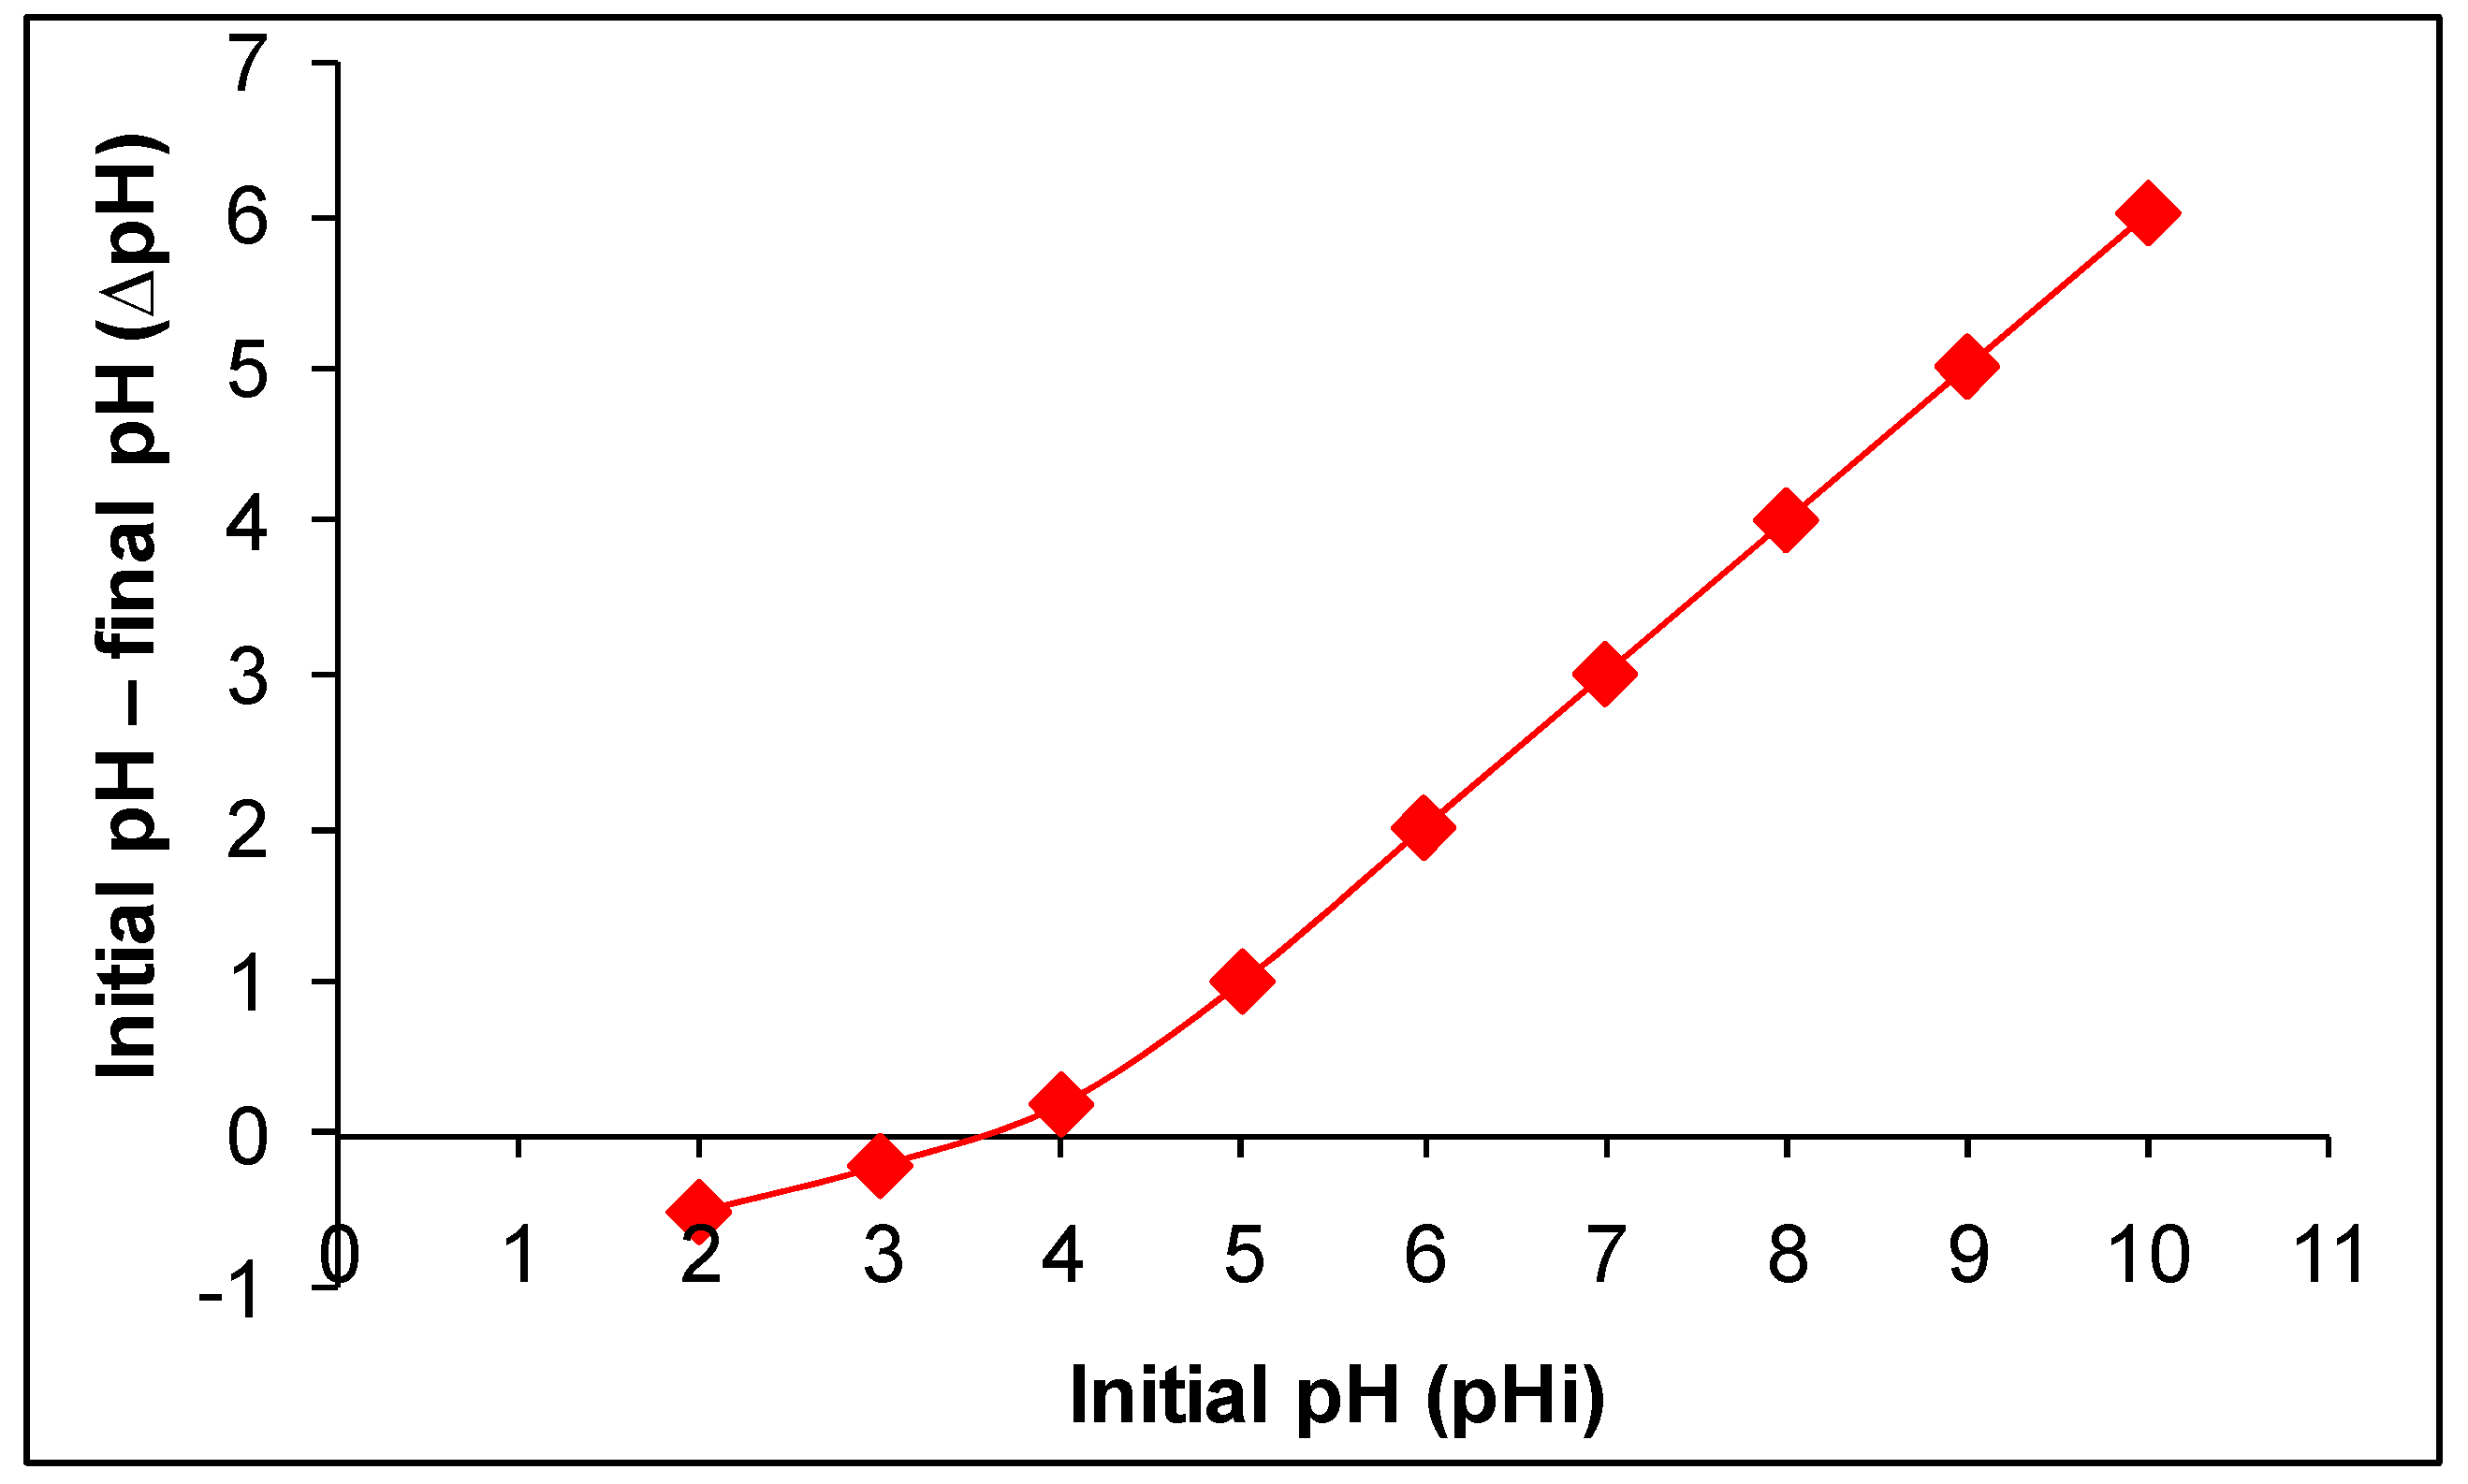
The point of zero charge (pHpzc) describes the pH at which the net charge on the adsorbent’s surface is zero, and it is a key factor for an adsorbent and for knowing the mechanism involved in the adsorption process. The pHpzc value experimentally determined for the modified CLN is 3.5 as shown in Figure 3. It indicates that the surface of the modified CLN is protonated/positively charged below 3.5 and deprotonated/negatively charged above 3.5 [2]. However, the pHpzc of the raw CLN is reported as 7.5 [29], which indicates the surface of the raw CLN as positively charged below pH 7.5 and as carrying a negative charge density above pH 7.5. The results reveal that the surface of the modified CLN has a greater negative charge/negative charge density compared to the raw CLN.

Figure 3.
Plot to determine the point of zero charge (pzc) of modified CLN.
3.2. Optimization of Contact Time for Adsorption of the Rh B by the Modified CLN
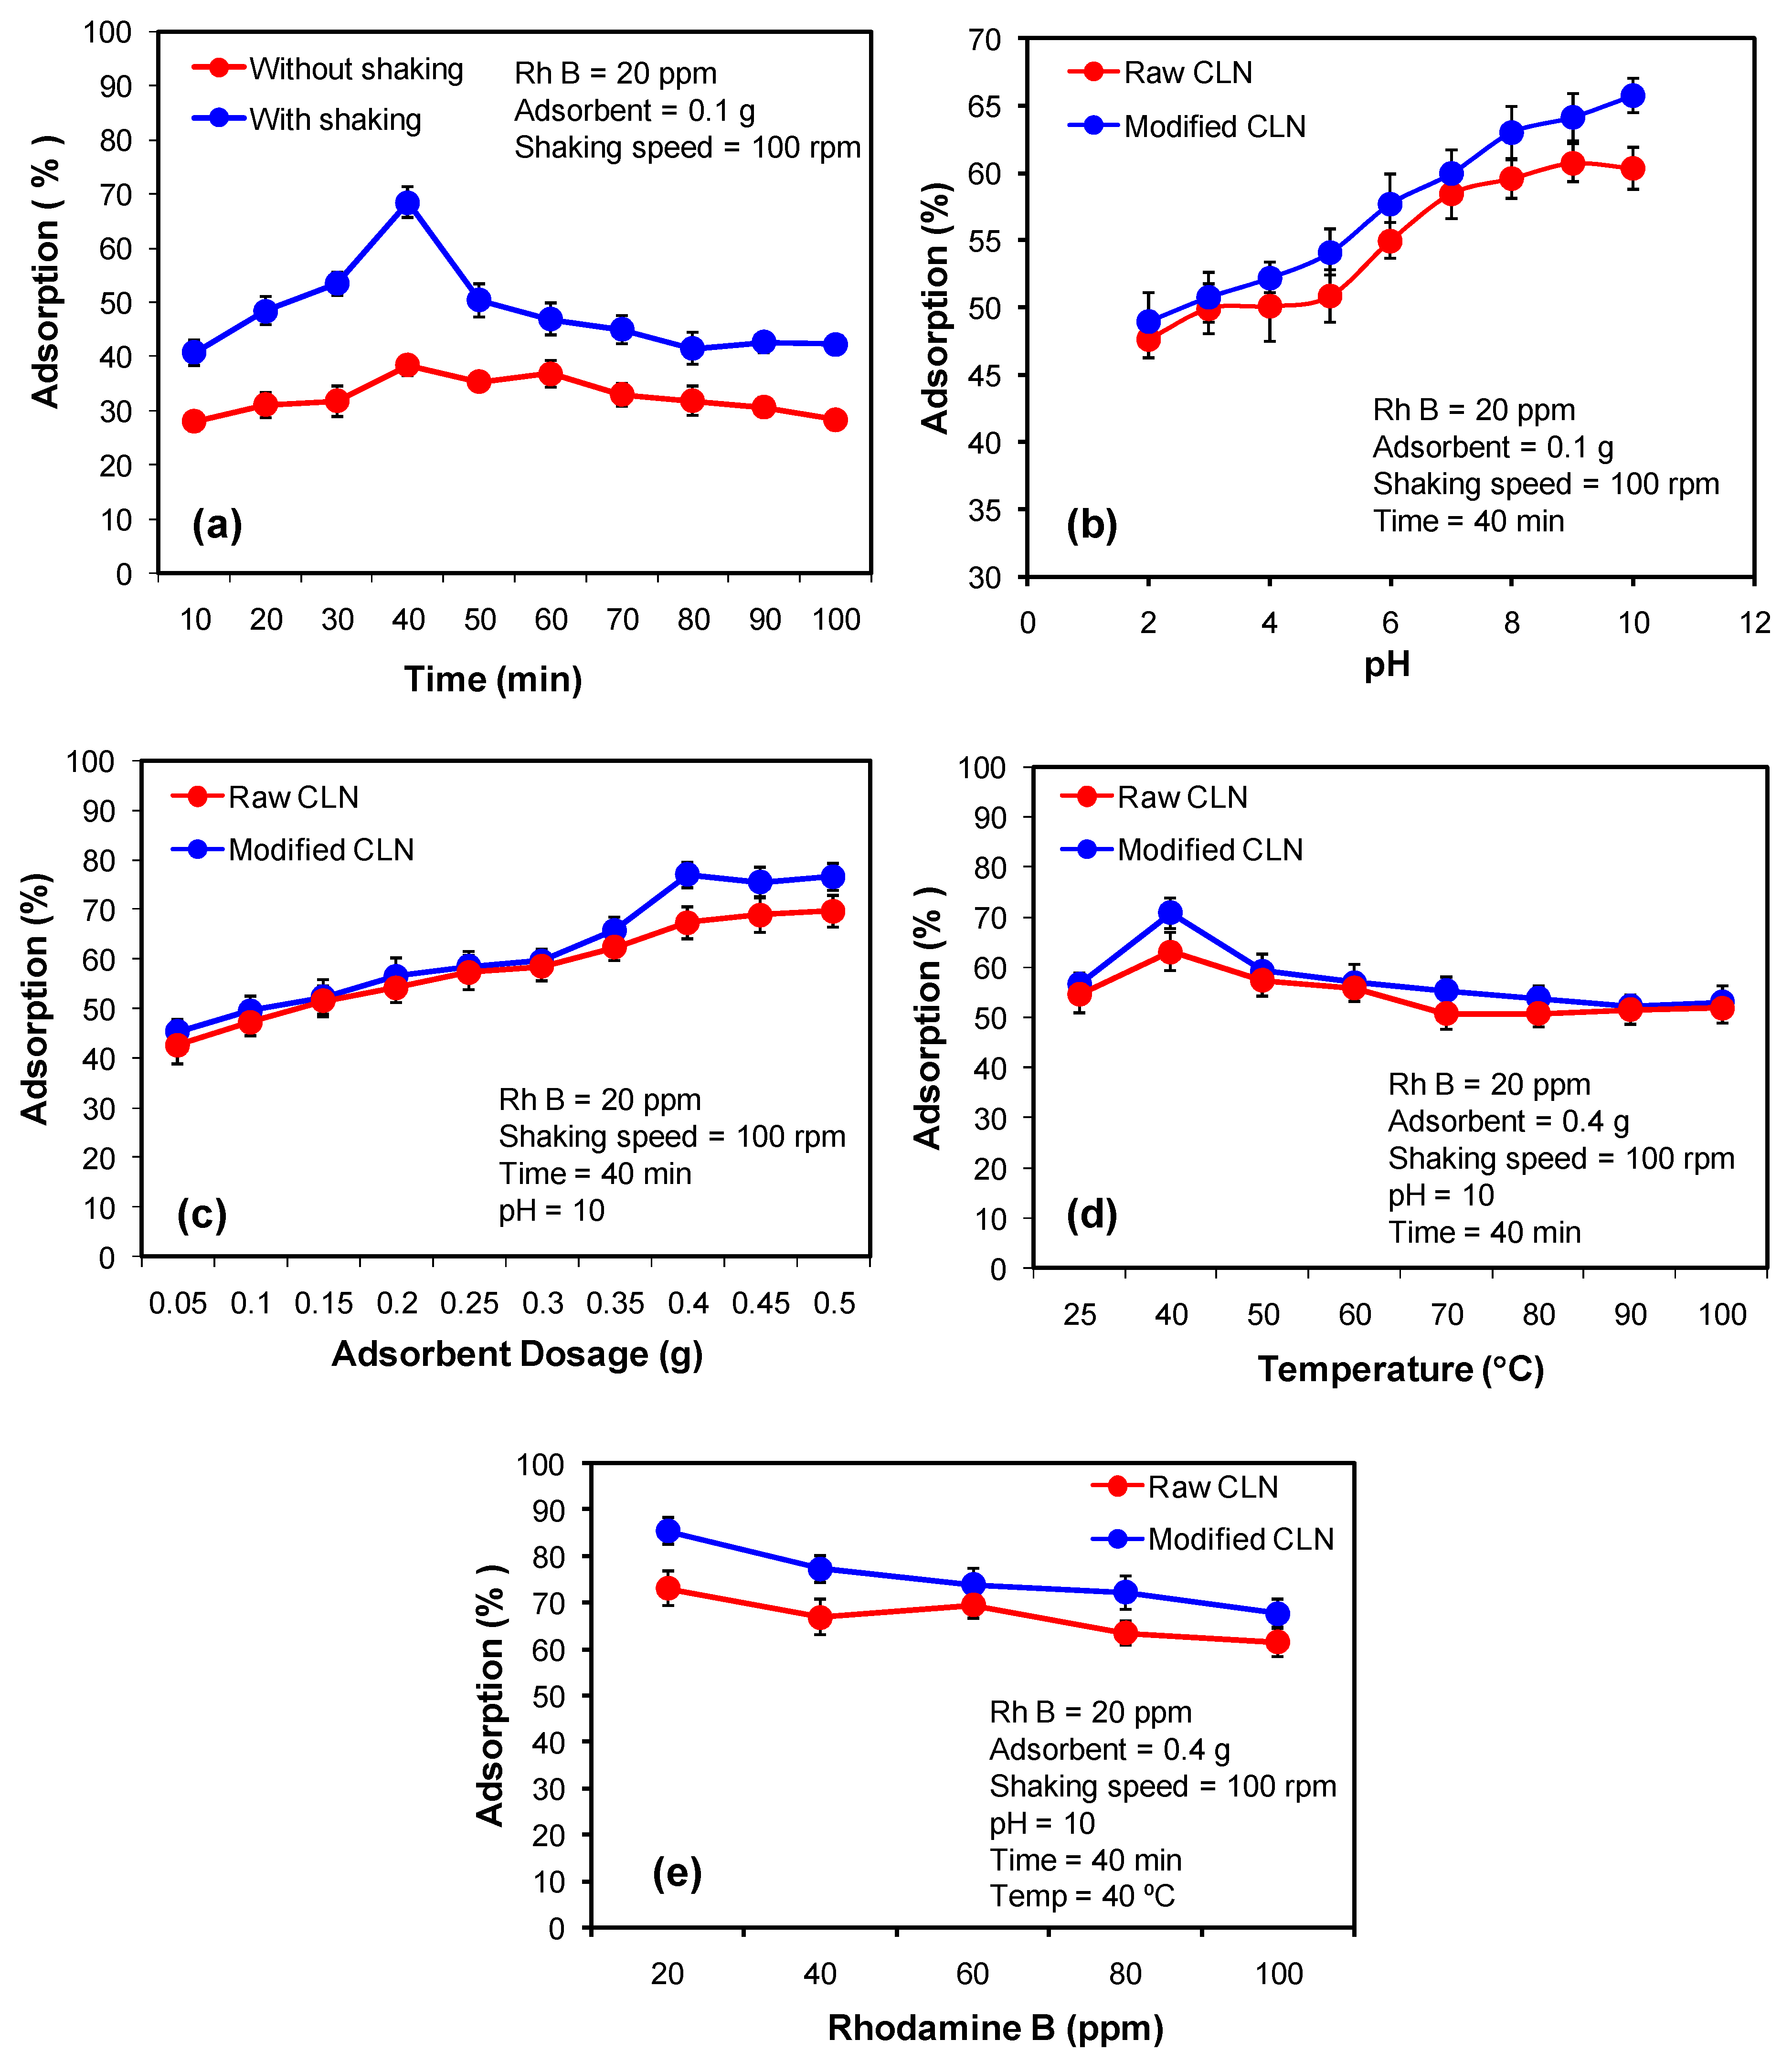
The contact time of the adsorbent and the adsorbate plays a significant role on the adsorption–desorption process. There is always a certain specified time where the interaction between the active sites of the adsorbent and the adsorbate yields a maximum adsorption because the adsorbate occupies the maximum of the surface of the adsorbent. After this, further contact between the adsorbent and the adsorbate gives rise to desorption because the process is usually studied under shaking conditions. In this study, the optimized contact time for the modified CLN was 40 min for maximum adsorption of the Rh B from an aqueous medium. However, the modified CLN showed superior performance when the adsorption process was performed under shaking conditions over static conditions (without shaking) such as 62% adsorption over 38% adsorption in 40 min, respectively. The results are displayed in Figure 4a.

Figure 4.
Optimization of parameters for the adsorption of Rh B by the raw and modified CLN. (a) The effect of contact time, (b) the pH effect, and (c) the adsorbent’s dose effect on the adsorption process, (d) the temperature effect, (e) the adsorbate’s concentration effect.
At 40 min, the maximum adsorption of 38% was obtained for Rh B without shaking and 62% adsorption was obtained in the solution that was kept on the orbital shaker for shaking. The adsorption process was fast at the beginning then it became slow and finally it reached maximum occupancy of the active sites of the modified CLN by the Rh B molecules and did not show the further effects of time. This is due to a greater number of vacant sites available in the beginning that are gradually occupied by the dye molecules [30]. Similarly, the increased percentage of adsorption of the solution with shaking was due to the dispersion of analyte molecules uniformly throughout the solution making it easy for the analyte molecules to adhere to the adsorbent. Secondly, the kinetic energy of the molecules increases with shaking, which enhances the rate of collision of the analyte with the adsorbent, resulting in a further increase in adsorption [31].
3.3. Effect of pH on the Adsorption of the Rh B by the Natural and Modified CLN
The comparative analysis of the pH effect on the adsorption of the Rh B after 40 min of contact time and under shaking conditions showed the enhanced adsorption efficiency of the modified CLN over the raw CLN. A maximum adsorption of 67% of the Rh B was obtained at pH 10 as compared to the 60% adsorption achieved by the raw CLN under the same experimental conditions (Figure 4b). The results show that the modified CLN performs well when compared to the raw CLN in the whole pH range of this study, i.e., from 2 to 10. In the basic medium, the modified CLN reveals a higher adsorption efficiency because upto pH 7, the bulky molecule of the dye, i.e., the cationic dye Rh B, competes with the protons to interact and occupy the active sites on the adsorbent. The point of zero charge of the modified CLN was identified to be 3.5 (Figure 3), which means that beyond pH 3.5 and upto 14, the surface of the modified CLN is negatively charged to attract cations. As a result, a higher adsorption of Rh B was observed beyond pH 7 where the hydroxyl ions dominate over protons and, therefore, the available active sites on the adsorbent adsorb the dye molecules. However, in the case of the raw CLN, a comparatively low efficiency of the adsorbent was observed, which became almost constant in the basic medium because the point of zero charge of the raw CLN is 7.5. Therefore, the maximum adsorption of cationic Rh B dye had already taken place. Further increases in pH, i.e., from 10 onwards might lead to a desorption process.
3.4. Effect of the Adsorbent Dose on the Adsorption of Rh B by the Raw and Modified CLN
The adsorbent dose has a significant impact on how any adsorbate is adsorbed throughout the surface. Compared to the 69% by the raw CLN, a maximal dye adsorption of 76% was seen at a 0.4 g dosage for the modified CLN (Figure 4c). In comparison to the raw adsorbent, the results demonstrated that treating CLN with NH4Cl increased its adsorption capacity [32]. The findings also showed that the amount of adsorbent had a substantial impact on the adsorption process. Lower doses cause the adsorbent surface to become saturated, leaving no sites available for further adsorption. But raising the dose also raises the amount of available adsorption sites. Thus, the ideal dosage for the investigation was determined to be 0.4 g. Nevertheless, the addition of more adsorbent caused the adsorption–desorption equilibrium to shift and cause desorption.
3.5. Effect of Temperature on the Adsorption Process of Rh B by the Raw and Modified CLN
The findings show that the maximum adsorption value for both modified and raw CLN was seen at 40 °C (Figure 4d). A consistent rise in adsorption was seen between 25 and 40 °C, with the modified CLN exhibiting a greater increase in adsorption than the raw CLN. Nonetheless, the absorption efficiency of both the raw and modified CLN slightly dropped and remained almost constant from 40 to 70 degrees Celsius. The adsorption effectiveness of the raw and modified CLN did not differ beyond 70 to 100 °C, and both exhibited comparable percentages of adsorption of Rh B. This demonstrates that the adsorption capability of both adsorbent surfaces is equal at higher temperatures. At first, however, an increase in the Rh B adsorption percentage as a function of temperature indicated that the adsorption was an endothermic process. A temperature increase of over 40 °C, on the other hand, disrupted the molecules, making the association between Rh B and the modified CLN unstable and reducing adsorption. With 70% adsorption by the modified CLN and 63% by the raw CLN at 40 °C, the results are displayed in Figure 4d.
3.6. Effect of Adsorbate (Rh B) Concentration on Its Adsorption by the Raw and Modified CLN
The effect of an increase in the concentration of Rh B on its adsorption was studied for both the raw and modified CLN. Both of the adsorbents showed similar trends with a noticeably higher adsorption efficiency for the modified CLN as compared to the raw CLN. However, an overall decrease was observed in the percentage of adsorption of Rh B when drawn as a function of the concentration of Rh B (Figure 4e). For 20 ppm of the dye, 95% adsorption was observed with the modified CLN. While in the case of the raw CLN, 85% of adsorption was found under similar experimental conditions. The outcomes of this study show an inverse relationship between the concentration and adsorption of Rh B. Steric hindrance of the analyte molecules caused a decrease in the percentage of adsorption with an increase in the Rh B dye concentration. Another possible cause could be the unavailability of active sites on the adsorbent surface since the majority of them are occupied by dye molecules. Thus, a drop in the percentage of adsorption is observed with an increase in the concentration of dye molecules [33].
3.7. Desorption Study
The percent of desorption of Rh B from the modified CLN was determined in four different solvents consisting of an acid, a base, and alcohols. The results are displayed in Table 1. The data in Table 1 indicate that the percentage of desorption in ethanol and methanol was higher than in the HCl and NaOH solutions, perhaps due to the organic character of the dye. Since the HCl and NaOH solutions are aqueous in nature, the organic dye’s desorption became difficult [34,35,36]. It is evident that methanol works better than ethanol, and that ethanol produced a somewhat better outcome than 0.1 M HCl, which is superior to 0.1 M NaOH. Methanol has a higher dielectric constant than ethanol, which allows it to dissolve the adsorbed dye more effectively and exhibit a better desorption quality for Rh B. In contrast to the basic medium, the cationic Rh B may have been better desorbed in the acidic medium due to the electrostatic interaction between protons and the negatively charged surface of the modified CLN.

Table 1.
Desorption of Rh B by selected solvents.
3.8. Adsorption Kinetic Models
According to the results, the modified CLN performs better than the raw CLN. In order to comprehend and determine the surface kinetics of the modified CLN, the adsorption kinetic models were applied.
3.8.1. Pseudo-First-Order Kinetic Model
The linear form of the pseudo-first-order kinetic model is expressed as follows.
where qe and qt are the quantity of the selected dye adsorbed at 40 min (equilibrium time) and at any time, respectively, k1 is the pseudo-first-order rate constant, Ci and Ce are the initial and final/equilibrium concentration (ppm) of the dye used in the process, respectively, m is the mass in grams of the modified adsorbent and V is the final volume of the filtrate in L.
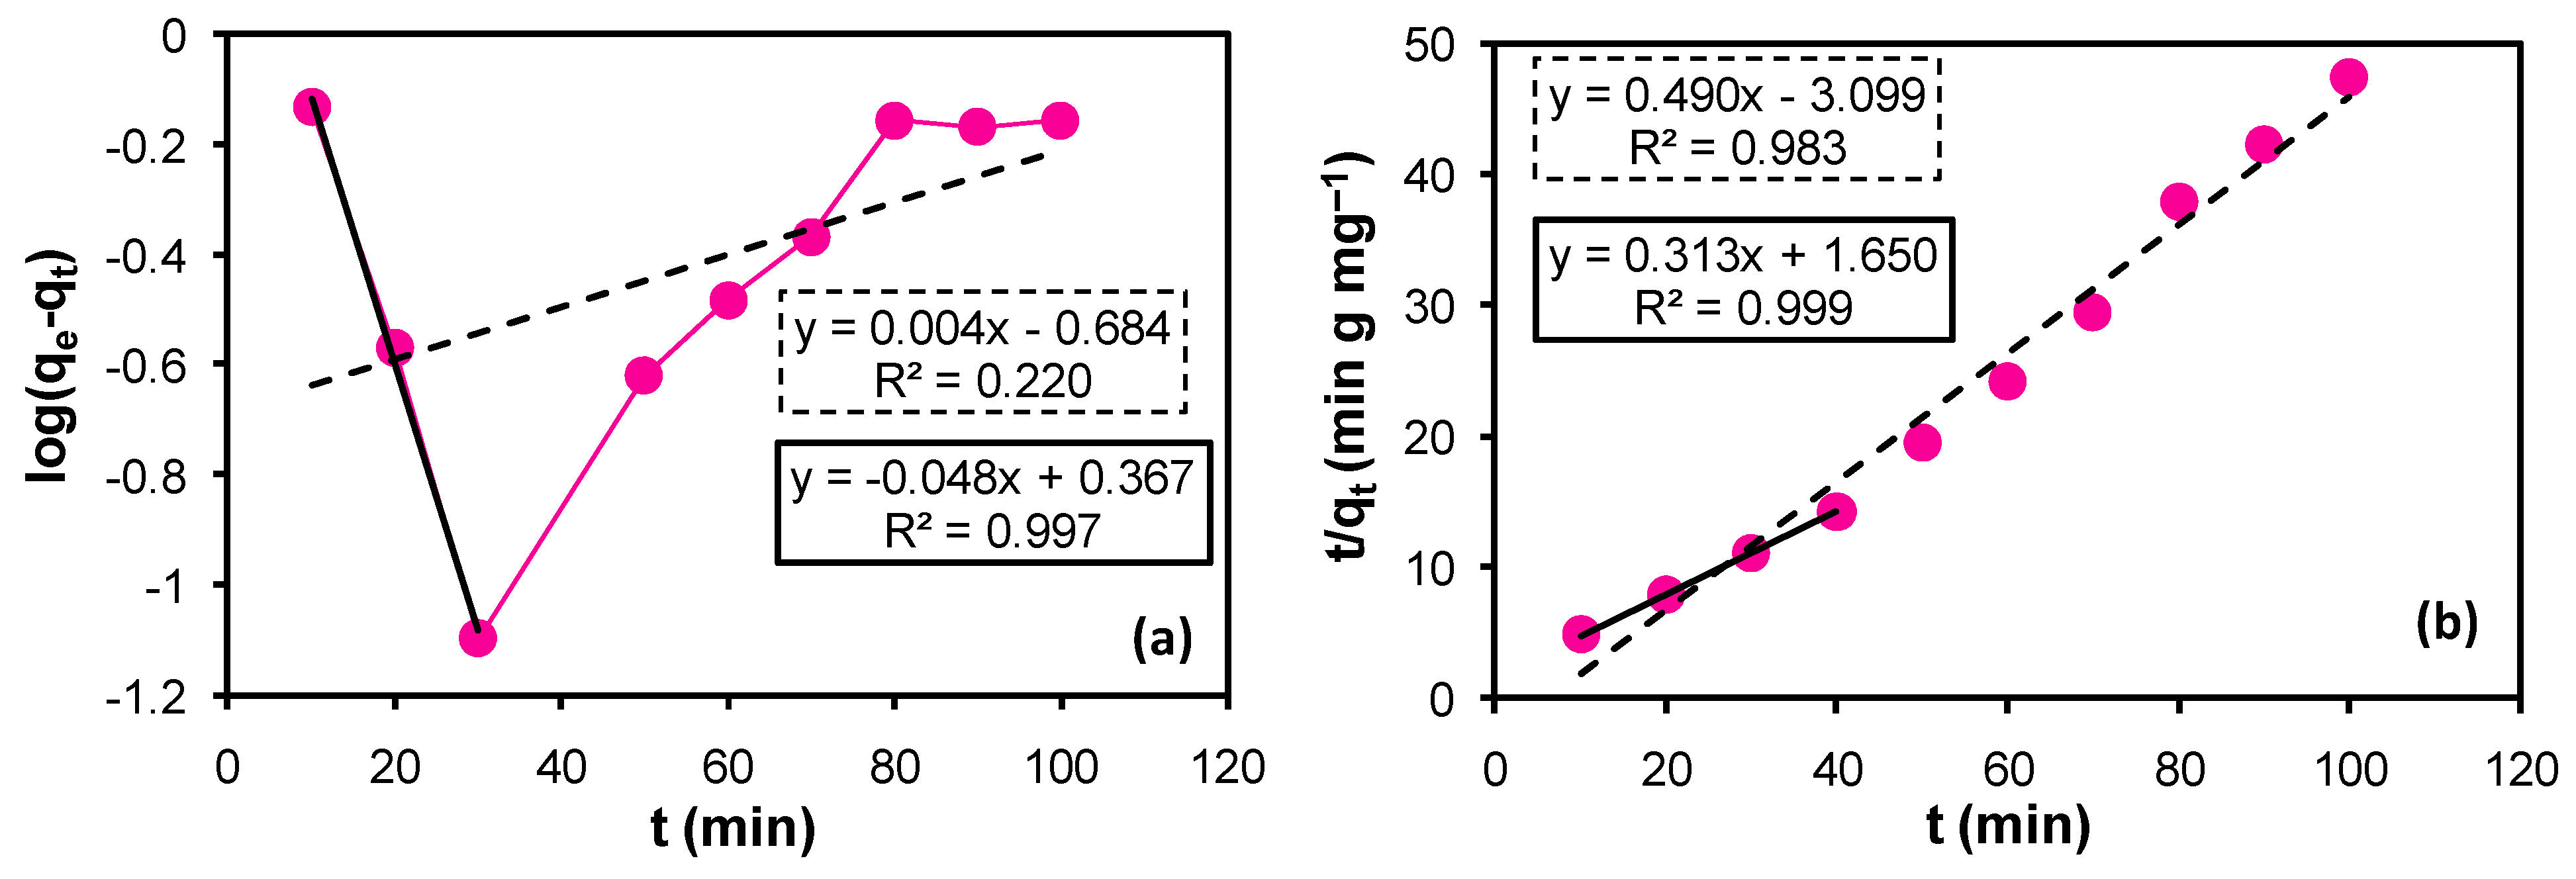
A plot of log(qe − qt) versus t (time) should produce a straight line with an intercept and a negative slope value, according to Equation (2). When Equation (2) was applied to the entire set of collected data (Figure 5a), poor linearity was seen, with a very small R2 value and a positive slope value that defies Equation (2). However, considering 40 min as the optimal time for adsorption where the adsorption–desorption attains equilibrium, and drawing the data via implementation of Equation (2) complies with the equation and gives a straight line with negative value for the slope and a positive value for the intercept. A very good linearfit (R2 = 0.997) was obtained. The results are displayed in Figure 5a. The value of the slope and intercept yielded the pseudo-first-order rate constant for the adsorption process k1 as 0.111 min−1 and the adsorption capacity qe as 2.328 mg g−1, respectively. However, the experimentally determined value of the adsorption capacity of the modified CLN was 2.81 mg g−1. Both of the values of qe are close together, hence supporting the adsorption process through pasudo-first-order kinetics on the surface of the modified CLN. The values are compiled in Table 2.

Figure 5.
(a) Pseudo-first-order kinetic model. (b) Pseudo-second-order kinetic model. The broken line (----) and its trendline label (broken border) represent the application of the model to the entire set of data. However, the unbroken line (―) and its label (unbroken border) represent the data upto the equilibrium time (40 min).
Table 2.
Kinetic parameters for the adsorption of Rh B by the modified CLN.
3.8.2. Pseudo-Second-Order Kinetic Model
The pseudo-second-order kinetic model was also applied to the acquired data of the modified CLN by using the following equation.
where, qe and qt are the quantity of Rh B adsorbed at 40 min (equilibrium time) and at any time, respectively, k2 is the pseudo-second-order reaction rate constant.
The plot of t/qt versus t (time) should yield a straightline with a positive value for the slope and a positive value for the intercept, if the surface kinetics follows the pseudo-second order.
The implementation of Equation (4) on the entire set of data for the modified CLN yielded a perfect straight line (dashed/broken line and its label) with a positive value for the slope but a negative value for the intercept (Figure 5b). The negative value for the intercept yields a negative value for the rate constant (k2) and a negative value for the rate constant has no physical existence. Therefore, the data upto the optimum or equilibrium time (40 min) were used to draw the straight-line equation according to the pseudo-second-order kinetic model (unbroken line and its label). The data fit the linearity very well and follow the model perfectly with positive values for both the slope and the intercept (Figure 5b). The slope and intercept were used to deduce the values of the adsorption capacity (qe) of the modified CLN and the rate constant (k2) of the surface kinetics as 3.195 mg g−1 and 0.059 g mg−1 min−1, respectively.
The strong match between the theoretical (qe 3.195 mg g−1) and experimental (qe 2.81 mg g−1) adsorption capacities and the high coefficient of determination (R2) imply that Rh B’s adsorption onto the modified CLN obeys a pseudo-second-order kinetics law rather than a pseudo-first-order law (Table 2). The adsorbate molecules are adsorbed onto a single binding site, according to the pseudo-second-order (PSO) model, which also postulates a chemisorption-controlled rate-determining step. Strong interactions between the adsorbate and the solid surface, such as the formation of hydrogen bonds as well as covalent and ionic bonds, are what cause chemisorption to occur. Most of the time, even at incredibly low concentrations, chemisorption occurs, and the species that are chemisorbed tend to become “irreversibly” attached to the surface—that is, they are difficult to desorb at ambient temperature. Chemisorption is finished when all of the active sites on the solid surface are occupied by chemisorbed molecules.
3.9. Adsorption Isotherm Study
The equilibrium study was carried out and the data were gathered in order to comprehend the interaction between the analyte (Rh B) and the adsorbent (modified CLN) as well as to determine if the adsorbent surface was homogeneous or not. The acquired data were subjected to a number of isotherm models, including the Freundlich, Langmuir, Temkin, and Dubinin–Radushkevich (D—R) models.
3.9.1. Freundlich Adsorption Isotherm
The adsorbent’s surface was assumed to be heterogeneous and adsorption is multilayer, i.e., strong binding sides are filled by analyte molecules first in the Freundlich isotherm. The linear form for this is given below.
where Ce is the equilibrium concentration in parts per million, 1/n is the adsorption intensity, n is the linearity deviation form, and KF is the Freundlich constant, which indicates maximal adsorption capacity.
The plot of logqe versus logCe yielded a very good linearfit (Figure 6a). The values of the Freundlich constant (KF) and n were determined from the intercept and slope of the plot, respectively, and are shown in Table 3.

Figure 6.
Adsorption isotherms for the adsorption of Rh B by the modified CLN. (a) Freundlich adsorption isotherm, (b) Langmuir adsorption isotherm, (c) Temkin adsorption isotherm, and (d) D–R model.
Table 3.
Parameters calculated for different isotherms.
3.9.2. Langmuir Adsorption Isotherm
The most commonly applied model for the surface study is the Langmuir adsorption isotherm. In this model, the surface is considered to be homogeneous, wherein the analyte’s molecules are supposed to be adsorbed uniformly on the surface layer only. These molecules never enter inside the surface as long as active sites are available on the surface. The straight-line equation of the Langmuir adsorption model (6) is given below.
where, Ce is the equilibrium concentration (ppm) of the analyte and qe is the amount of analyte adsorbed (mg)/gram of the adsorbent. KL is the adsorption or the Langmuir constant and qm is the monolayer capacity of the adsorbent or it is the highest adsorption capacity (mg g−1) obtained from the Langmuir model. These values were calculated from the Langmuir graph (Figure 6b) and mentioned in Table 3. The graph between Ce/qe versus Ce produced a straight line with R2 = 0.945 and a positive intercept as well as a positive slope value (Figure 6b). The highest adsorption capacity of the modified CLN for Rh B was determined from the slope of the plot and the value of the Langmuir constant was calculated from the intercept of the plot.
3.9.3. Temkin Adsorption Isotherm
In order to study the effect of heat on the interactions between the analyte and the adsorbent, the Temkin isotherm was used. It is suggested in this model that the heat of the adsorption of the molecules present in the layer will decrease linearly with the slope.
The linear form of the Temkin equation is as follows.
where AT is the Temkin isotherm equilibrium binding constant (L g−1), B is the constant related to the heat of sorption (J mol−1), and qe is the absorption capacity of the modified CLN at the equilibrium of the adsorption–desorption process of Rh B. R is the universal gas constant, T is the temperature of the experiment in Kelvin, and b is the Temkin isotherm constant related to the adsorption heat. A plot of qe as a function of lnCe yielded a straight line with a positive slope value and a negative intercept value (Figure 6c). The slope of the plot gives the value of B that was used to determine the value of AT from the intercept of the plot. The values are documented in Table 3. The Temkin plot defies the model because, although a positive intercept is expected based on the equation, we obtained a negative number.
3.9.4. Dubinin–Radushkevich Isotherm (D—R Model)
Thisis an empirical model used to indicate the adsorption mechanism of the adsorbate molecules onto the adsorbent surface to differentiate if the adopted process was chemisorption or physisorption. The linear equation of the D–R model is mentioned below.
where
In Equation (8), qe, R, T, and Ce carry similar representation as described in other isotherm models. However, qm, β, and ε correspond to the theoretical saturation capacity of the modified CLN in mg g−1 for Rh B dye, the activity coefficient related to the mean free energy of the adsorption in mol2 kJ−2, and the Polanyi potential (kJ mol−1), respectively. The value of β can then be used to find the value of E according to Equation (9).
E is the free energy change (kJ mol−1) that is required to transfer one mole of the analyte from the infinite distance in the solution to the surface of the adsorbent. If the E value is 1–8, physical adsorption takes place, when the E value is 9–16, ion exchange occurs, and when its value is 20–40 then electrostatic interaction/chemisorption takes place.
According to Equation (8), a plot of lnqe against ε2 should produce a straight line with a positive value for the intercept and a negative value for the slope. A straight line with a positive slope and a negative intercept value was produced when the D–R model was applied to the data collected for the adsorption of Rh B by the modified CLN. Since the slope equals β, the value carried by it is negative, as seen in Figure 6d. When the square root of the multiplication product is taken and this negative value of β is multiplied by the number 2, the result is infinity or zero energy. The results (Figure 6d and Table 3) show that the adsorption of Rh B by the modified CLN defies D–R model.
It can be seen from a comparative study of the graphs produced by applying various isotherms to the collected data that the Freundlich and Langmuir isotherms suit the data best. This is feasible for mono- or multi-layer formation. The Temkin and D-R models, however, do not fit the data. Thus, based on the previously provided information, the Langmuir isotherm appears to indicate chemisorption, whereas the Freundlich equation appears to indicate physisorption. However, if there is insufficient room for the formation of a second layer, a monolayer of adsorbed molecules onto the adsorbent surface may also form by physisorption. Moreover, multilayers may be formed by a combined process (the first layer through chemisorption, and the subsequent layers through physisorption).
To highlight the conclusions of this investigation, a comparison of the adsorption of Rhodamine B dye by various adsorbents is presented below (Table 4). The improved adsorption capability of the modified CLN is immediately evident from the comparison of the raw and modified CLN. When the results of this investigation are compared to those of other studies, however, it becomes clear that the adsorbent works best in extremely basic environments, such as those of pH 10, which has never been recorded for other adsorbents before.
Table 4.
Comparison of the adsorption of Rhodamine B dye by different adsorbents.
3.10. Adsorption Mechanism on the Surface of the Modified Clinoptilolite
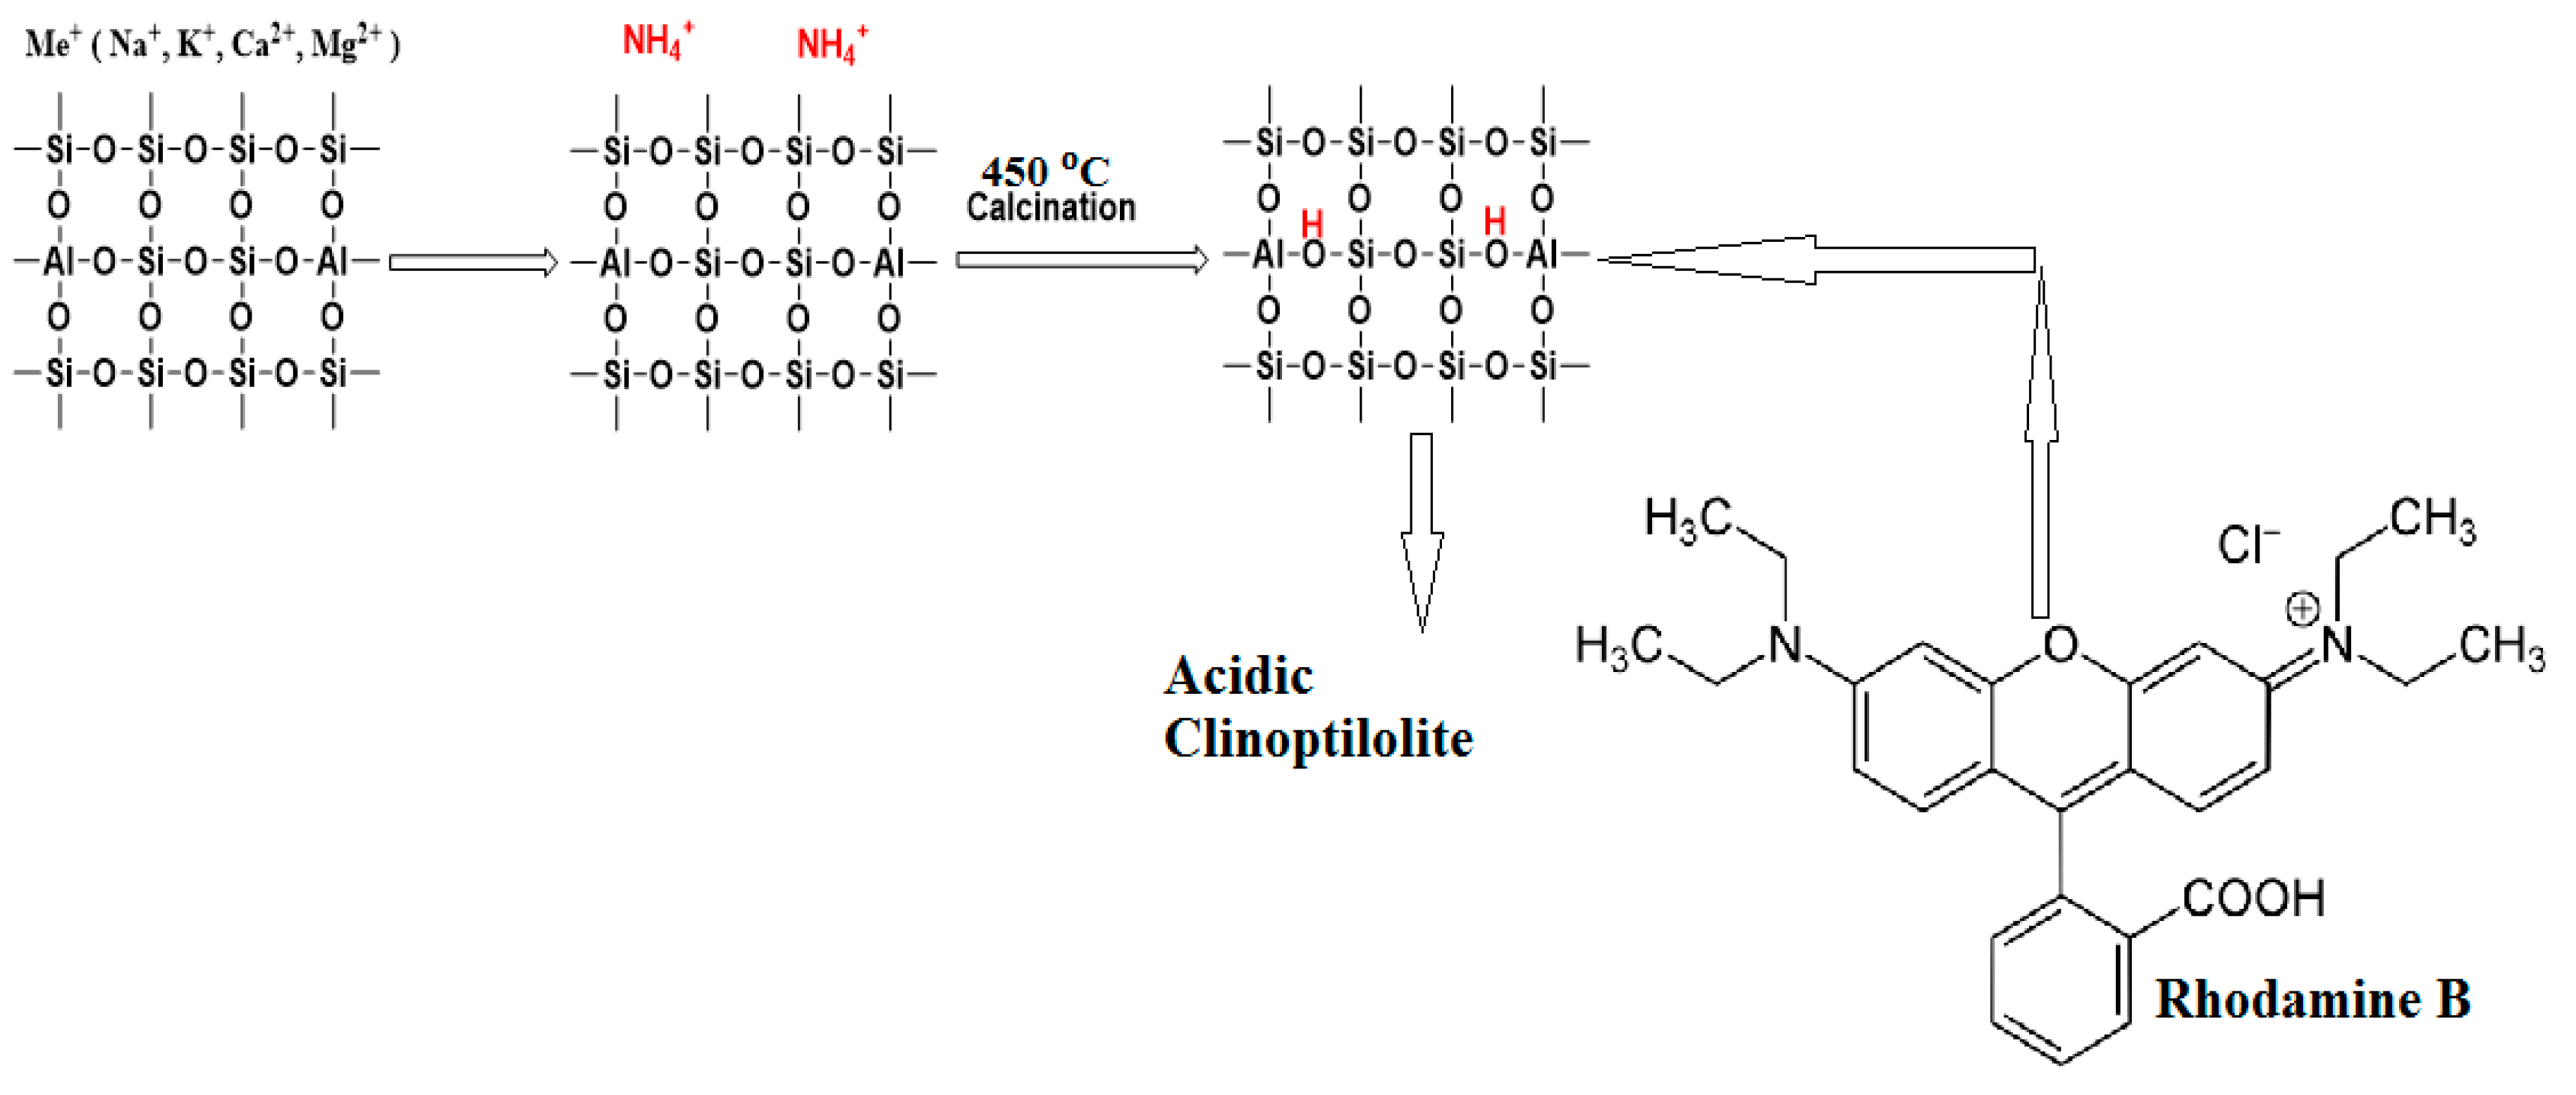
The adsorption process, which is thought to be based on electrostatic interaction between the adsorbent and the adsorbate, was identified with the assistance of the findings of the kinetic investigation and the use of the adsorption isotherm. Thus, the electrostatic interactions take place between the negatively charged adsorbent surface and the positively charged dye. Figure 7 shows a schematic of the suggested mechanism for the adsorption of Rh B dye on the modified CLN.

Figure 7.
Schematic of the adsorption mechanism of Rh B dye on the modified CLN.
4. Conclusions
A modified Clinoptilolite with an increased adsorption capacity over the raw Clinoptilolite (CLN) was produced by modifying the raw Clinoptilolite with an ammonium cation exchange process that was followed by calcination. The modified CLN’s preserved crystallinity, which was not affected by the modification process, was shown by its characterization. When compared to the raw CLN, the results of the adsorption of Rhodamine B (Rh B) dye by the modified CLN were outstanding. Nearly 95% of Rh B was adsorbed under optimized conditions in 40 min, even in extremely basic environments such as pH 10, which has not been documented for Rh B yet. Both pseudo-first- and pseudo-second-order kinetic models were found to be compatible with the adsorption of Rh B on the modified CLN; however, the best linearfit was indicated by the pseudo-second-order kinetic model. Adsorption isotherms such as the Freundlich and Langmuir isotherms also demonstrated chemisroption followed by physisorption. Rh B might therefore be extracted from extremely basic surroundings using the modified CLN in order to clean wastewater or contaminated water sources.
Supplementary Materials
The following supporting information corresponds to the surface area determination of the adsorbent and can be downloaded at: https://www.mdpi.com/article/10.3390/su16062267/s1, Table S1: Concentration of iodine solution before filtration; Table S2: Concentration of iodine solution after filtration; Table S3: Surface area of the modified CLN.
Author Contributions
Conceptualization, F.K. and R.K.; methodology, F.K.; software, H.G. and M.N.; validation, T., R.M. and M.N.; formal analysis, S.F.A.S., H.G. and M.S.K.; investigation, S.F.A.S. and T.; resources, R.K., R.M. and Z.V.-G.; data curation, M.S.K.; writing—original draft preparation, S.F.A.S., R.K. and T.; writing—review and editing, R.K. and Z.V.-G.; visualization, F.K.; supervision, F.K. and S.R.; project administration, F.K. and S.R. All authors have read and agreed to the published version of the manuscript.
Funding
This research received no external funding.
Institutional Review Board Statement
Not applicable.
Informed Consent Statement
Not applicable.
Data Availability Statement
Data are contained within the article and Supplementary Materials.
Conflicts of Interest
The authors declare no conflicts of interest.
References
- Singh, N.B.; Nagpal, G.; Agrawal, S. Water purification by using Adsorbents: A Review. Environ. Technol. Innov. 2018, 11, 187–240. [Google Scholar] [CrossRef]
- Shah, J.; Jan, M.R. Tasmia Magnetic Chitosan Graphene Oxide Composite for Solid Phase Extraction of Phenylurea Herbicides. Carbohydr. Polym. 2018, 199, 461–472. [Google Scholar] [CrossRef]
- Tkaczyk, A.; Mitrowska, K.; Posyniak, A. Synthetic organic dyes as contaminants of the aquatic environment and their implications for ecosystems: A review. Sci. Total Environ. 2020, 717, 137222. [Google Scholar] [CrossRef]
- Bharagava, R.N.; Chowdhary, P. Textile Wastewater Dyes: Toxicity Profile and Treatment Approaches. In Emerging and Eco-Friendly Approaches for Waste Management; Springer: Singapore, 2018; pp. 219–244. ISBN 9789811086694. [Google Scholar]
- Al-gheethi, A.A.; Marsya, Q.; Senthil, P.; Abdirizak, A.; Al-buriahi, A.K.; Maya, R.; Radin, S.; Al-shaibani, M.M. Chemosphere Sustainable approaches for removing Rhodamine B dye using agricultural waste adsorbents: A review. Chemosphere 2022, 287, 132080. [Google Scholar] [CrossRef]
- Carmine, A.L.; Ancona, A.; Di Cesare, K.; Dumontel, B.; Garino, N.; Canavese, G. Sonophotocatalytic degradation mechanisms of Rhodamine B dye via radicals generation by micro- and nano-particles of ZnO. Appl. Catal. B Environ. 2018, 243, 629–640. [Google Scholar]
- Xiao, W.; Garba, Z.N.; Sun, S.; Lawan, I.; Wang, L.; Lin, M.; Yuan, Z. Preparation and evaluation of an effective activated carbon from white sugar for the adsorption of rhodamine B dye. J. Clean. Prod. 2020, 253, 119989. [Google Scholar] [CrossRef]
- Júnior, M.A.C.; dos Santos, A.G.; de Paulo Silva, E.; Maimoni, G.F.; Martins, H.N.; de Moura Assis, M.L.; Camargo, C.A.C.M.; Camargo, M.A.F. Advances in the Treatment of Textile Effluents: A Review. Open Access Libr. J. 2019, 6, e5549. [Google Scholar] [CrossRef]
- Piaskowski, K.; Świderska-Dąbrowska, R.; Zarzycki, P.K. Dye removal from water and wastewater using various physical, chemical, and biological processes. J. AOAC Int. 2018, 101, 1371–1384. [Google Scholar] [CrossRef]
- Zajda, M.; Aleksander-Kwaterczak, U. Wastewater treatment methods for effluents from the confectionery industry-An overview. J. Ecol. Eng. 2019, 20, 293–304. [Google Scholar] [CrossRef]
- Dickhout, J.M.; Moreno, J.; Biesheuvel, P.M.; Boels, L.; De Vos, W.M.; Lammertink, R.G.H. Produced water treatment by membranes: A review from a colloidal perspective. J. Colloid Interface Sci. 2017, 487, 523–534. [Google Scholar] [CrossRef]
- Abdel-Aziz, R.; Ahmed, M.A.; Messih, M.F.A. A novel UV and visible light driven photocatalyst AgIO4/ZnO nanoparticles with highly enhanced photocatalytic performance for removal of rhodamine B and indigo carmine dyes. J. Photochem. Photobiol. A Chem. 2020, 389, 112245. [Google Scholar] [CrossRef]
- Raghu, S.; Woo, C.; Chellammal, S.; Palanichamy, S.; Basha, C.A. Evaluation of electrochemical oxidation techniques for degradation of dye effluents—A comparative approach. J. Hazard. Mater. 2009, 171, 748–754. [Google Scholar] [CrossRef]
- Adekola, F.A.; Ayodele, S.B.; Inyinbor, A.A. Activated biochar prepared from plaintain peels: Characterization and Rhodamine B adsorption data set. Chem. Data Collect. 2019, 19, 100170. [Google Scholar] [CrossRef]
- Saleh, T.A.; Ali, I. Synthesis of polyamide grafted carbon microspheres for removal of rhodamine B dye and heavy metals. J. Environ. Chem. Eng. 2018, 6, 5361–5368. [Google Scholar] [CrossRef]
- Mehrali-afjani, M.; Nezamzadeh-ejhieh, A. Efficient solid amino acid—Clinoptilolite nanoparticles adsorbent for Mn (II) removal: A comprehensive study on designing the experiments, thermodynamic and kinetic aspects. Solid State Sci. 2020, 101, 106124. [Google Scholar] [CrossRef]
- Zanin, E.; Scapinello, J.; de Oliveira, M.; Rambo, C.L.; Franscescon, F.; Freitas, L.; de Mello, J.M.M.; Fiori, M.A.; Oliveira, J.V.; Dal Magro, J. Adsorption of heavy metals from wastewater graphic industry using clinoptilolite zeolite as adsorbent. Process Saf. Environ. Prot. 2016, 105, 194–200. [Google Scholar] [CrossRef]
- Kim, G.; Kim, S.; Choi, J. Development of an Agent Suited for Adsorbing Cs-137 from Ash and Soil Waste Solutions. Sep. Purif. Technol. 2017, 173, 193–199. [Google Scholar] [CrossRef]
- Elaiopoulos, K.; Perraki, T.; Grigoropoulou, E. Microporous and Mesoporous Materials Monitoring the Effect of Hydrothermal Treatments on the Structure of a Natural Zeolite through a Combined XRD, FTIR, XRF, SEM and N2-Porosimetry Analysis. Microporous Mesoporous Mater. 2010, 134, 29–43. [Google Scholar] [CrossRef]
- Shahwan, T.; Zünbül, B.; Tunusoǧlu, Ö.; Eroǧlu, A.E. AAS, XRPD, SEM/EDS, and FTIR Characterization of Zn2+ Retention by Calcite, Calcite-Kaolinite, and Calcite-Clinoptilolite Minerals. J. Colloid Interface Sci. 2005, 286, 471–478. [Google Scholar] [CrossRef]
- Ambrozova, P. Synthesis and Modification of Clinoptilolite. Molecules 2017, 22, 1107. [Google Scholar] [CrossRef]
- Akgu, M.; Acar, O.; Yu, Y. Removal of Silver (I) from Aqueous Solutions with Clinoptilolite. Microporous Mesoporous Mater. 2006, 94, 99–104. [Google Scholar] [CrossRef]
- Rodríguez, P.S.A.; Paramio, J.M.G.C.; Díez, C.F.E. H-Clinoptilolite as an Efficient and Low-Cost Adsorbent for Batch and Continuous Gallium Removal from Aqueous Solutions. J. Sustain. Metall. 2021, 7, 1699–1716. [Google Scholar] [CrossRef]
- Moradi, M.; Karimzadeh, R.; Sadat, E. Modi Fi Ed and Ion Exchanged Clinoptilolite for the Adsorptive Removal of Sulfur Compounds in a Model Fuel: New Adsorbents for Desulfurization. Fuel 2018, 217, 467–477. [Google Scholar] [CrossRef]
- Kurama, H.; Zimmer, A.; Reschetilowski, W. Chemical Modification Effect on the Sorption Capacities of Natural Clinoptilolite. Chem. Eng. Technol. 2002, 25, 301–305. [Google Scholar] [CrossRef]
- Król, M.; Rożek, P.; Chlebda, D.; Mozgawa, W. ATR/FT-IR Studies of Zeolite Formation during Alkali-Activation of Metakaolin. Solid State Sci. 2019, 94, 114–119. [Google Scholar] [CrossRef]
- Lin, H.; Liu, Q.; Dong, Y.; Chen, Y.; Huo, H.; Liu, S. Study on Channel Features and Mechanism of Clinoptilolite Modified by LaCl3. J. Mater. Sci. Res. 2013, 2, 37–44. [Google Scholar] [CrossRef]
- Altynbaeva, L.S.; Mashentseva, A.A.; Aimanova, N.A.; Zheltov, D.A. Eco-Friendly Electroless Template Synthesis of Cu-Based Composite Track-Etched Membranes for Sorption Removal of Lead (II) Ions. Membranes 2023, 13, 495. [Google Scholar] [CrossRef] [PubMed]
- Ngeno, E.C.; Shikuku, V.O.; Orata, F.; Baraza, L.D.; Kimosop, S.J. Caffeine and ciprofloxacin adsorption from water onto Clinoptilolite: Linear isotherms, kinetics, thermodynamic and mechanistic studies. S. Afr. J. Chem. 2019, 72, 136–142. [Google Scholar] [CrossRef]
- Tasmia; Shah, J.; Jan, M.R. Microextraction of Selected Endocrine Disrupting Phenolic Compounds Using Magnetic Chitosan Biopolymer Graphene Oxide Nanocomposite. J. Polym. Environ. 2020, 28, 1673–1683. [Google Scholar] [CrossRef]
- Cheng, Z.; Li, Y.; Liu, Z. Novel adsorption materials based on graphene oxide/Beta zeolite composite materials and their adsorption performance for rhodamine B. J. Alloys Compd. 2017, 708, 255–263. [Google Scholar] [CrossRef]
- Qiu, M.; Qian, C.; Xu, J.; Wu, J.; Wang, G. Studies on the adsorption of dyes into clinoptilolite. Desalination 2009, 243, 286–292. [Google Scholar] [CrossRef]
- Armagan, B.; Turan, M.; Mehrnet, S. Equilibrium studies on the adsorption of reactive azo dyes into zeolite. Desalination 2004, 170, 33–39. [Google Scholar] [CrossRef]
- Kılınc, S. The adsorption kinetics and removal of cationic dye, Toluidine Blue O, from aqueous solution with Turkish zeolite. J. Hazard. Mater. 2008, 151, 213–220. [Google Scholar]
- Kadirvelu, K. Activated carbon from industrial solid waste as an adsorbent for the removal of Rhodamine-B from aqueous solution: Kinetic and equilibrium studies. Chemosphere 2005, 60, 1009–1017. [Google Scholar] [CrossRef] [PubMed]
- Vijayakumar, G.; Tamilarasan, R.; Dharmendirakumar, M. Adsorption, Kinetic, Equilibrium and Thermodynamic studies on the removal of basic dye Rhodamine-B from aqueous solution by the use of natural adsorbent perlite. J. Mater. Environ. Sci. 2012, 3, 157–170. [Google Scholar]
- Ding, L.; Zou, B.; Gao, W.; Liu, Q.; Wang, Z.; Guo, Y.; Wang, X.; Liu, Y. Adsorption of Rhodamine-B from aqueous solution using treated rice husk-based activated carbon. Colloids Surf. A Physicochem. Eng. Asp. 2014, 446, 1–7. [Google Scholar] [CrossRef]
- Selvam, P.P.; Preethi, S.; Basakaralingam, P.; Thinakaran, N.; Sivasamy, A.; Sivanesan, S. Removal of rhodamine B from aqueous solution by adsorption onto sodium montmorillonite. J. Hazard. Mater. 2008, 155, 39–44. [Google Scholar] [CrossRef]
- Hayeeye, F.; Sattar, M.; Chinpa, W.; Sirichote, O. Kinetics and thermodynamics of Rhodamine B adsorption by gelatin/activated carbon composite beads. Colloids Surf. A Physicochem. Eng. Asp. 2017, 513, 259–266. [Google Scholar] [CrossRef]
- Shrestha, D. Efficiency of Wood-Dust of Dalbergia Sisoo as Low-Cost Adsorbent for Rhodamine-B Dye Removal. Nanomaterials 2021, 11, 2217. [Google Scholar] [CrossRef] [PubMed]
- Thakur, A.; Kaur, H. Response Surface Optimization of Rhodamine B Dye Removal Using Paper Industry Waste as Adsorbent. Int. J. Ind. Chem. 2017, 8, 175–186. [Google Scholar] [CrossRef]
- Ai, H.; Pham, L.; Vo, T.K.; Nguyen, D.T.; Huynh, H.K. Facile Synthesis of Bismuth Terephthalate Metal—Organic Frameworks and Their Visible-Light- Driven Photocatalytic Activities toward Rhodamine B Dye. Green Chem. Lett. Rev. 2022, 15, 572–581. [Google Scholar] [CrossRef]


Disclaimer/Publisher’s Note: The statements, opinions and data contained in all publications are solely those of the individual author(s) and contributor(s) and not of MDPI and/or the editor(s). MDPI and/or the editor(s) disclaim responsibility for any injury to people or property resulting from any ideas, methods, instructions or products referred to in the content. |
© 2024 by the authors. Licensee MDPI, Basel, Switzerland. This article is an open access article distributed under the terms and conditions of the Creative Commons Attribution (CC BY) license (https://creativecommons.org/licenses/by/4.0/).