Article

Investigation of Emission Inventory for Non-Road Mobile Machinery in Shandong Province: An Analysis Grounded in Real-World Activity Levels

1
School of Automotive and Transportation Engineering, Wuhan University of Science and Technology, Wuhan 430081, China
2
Hubei Key Laboratory of Automotive Power Train and Electronic Control, Shiyan 442002, China
3
School of Automotive Engineering, Hubei University of Automotive Technology, Shiyan 442002, China
*
Author to whom correspondence should be addressed.
Sustainability 2024, 16(6), 2292; https://doi.org/10.3390/su16062292
Submission received: 2 January 2024 / Revised: 4 March 2024 / Accepted: 5 March 2024 / Published: 9 March 2024

Abstract

:
In tandem with the advancement of urban intelligent technology, the construction of remote monitoring platforms and databases for non-road mobile machinery is gradually improving in various provinces and cities. Employing the remote monitoring platform for non-road mobile machinery enables a detailed big data analysis of the actual operational state of the machinery. This method yields precise data on the activity levels of various machinery types. Importantly, it addresses the issue of reduced accuracy in emission inventories, which often arises from the conventional practice of using standard recommended values from the Guide to determine machinery activity levels during the compilation of non-road mobile machinery emission inventories. Based on the remote monitoring and management system of non-road mobile machinery, the actual value of the activity level of non-road mobile machinery was obtained, and the emission inventory of non-road mobile machinery in Shandong Province was established. The emission levels of PM, HC, NOx, and CO from main non-road mobile machinery, including forklifts, excavators, loaders, off-road trucks, and road rollers, were measured. The findings indicate that the operational activity levels of non-road mobile machinery in Shandong Province typically exceeded the guideline’s recommended values. Among them, the annual use time of port terminal ground handling equipment was the longest, with an average annual working time of 4321.5 h per equipment, more than six times the recommended value. Among all types of non-road mobile machinery, loader emissions accounted for the highest proportion, reaching 43.13% of the total emissions of various pollutants. With the tightening of the national standard for non-road mobile machinery from Stage II to Stage III, a significant reduction in actual mechanical emissions was observed, primarily manifested as a 91% decrease in NOx emissions. Based on the data from the remote monitoring platform, a new method for compiling the emission inventory of non-road mobile machinery is proposed in this paper. The calculated emission inventory can reflect more real emission situations and provide a reference and basis for emission control and sustainable emission reduction policy measures for non-road mobile machinery.

1. Introduction

Non-road mobile machinery has the characteristics of low technical level, long service life, and significant emissions per unit. In recent years, the emission contribution of non-road mobile machinery has become increasingly prominent, and its emission of PM2.5 and NOx has seriously affected air quality and human health [1,2]. Since China issued the “Technical Guide for Compilation of Non-Road Mobile Source Air Pollutant Emission Inventory (Trial)” (hereinafter referred to as the “Guide”) in 2014, many scholars have carried out research on the non-road mobile machinery emission inventory based on city [3,4], provincial [5,6], regional [7,8,9], and national [10] scales. Emission inventories, serving as a fundamental aspect of air quality research and atmospheric environmental capacity assessment, enable a macro-level examination of the overall emission status of non-road mobile machinery within a given region. Furthermore, these inventories facilitate the exploration of emission contributions from various types of machinery [11].
The current research on the emission characteristics of non-road mobile machinery mainly focuses on field testing and emission model estimation [12,13]. Among them, the field test generally has the problem of small sample size and narrow coverage, and the emission inventory compilation generally lacks the actual activity level data for the machinery. Activity level, a critical parameter in the compilation of emission inventories for non-road mobile machinery, remains a challenging aspect to quantify accurately. Most studies have relied on estimates derived from consultations with machinery owners or relevant industry associations rather than obtaining the actual activity level data [14,15,16]. Liu et al. [17] from the Chinese National Automobile Quality Inspection and Testing Center calculated the emission list for Beijing construction machinery based on the power method and found that the uncertainty of the established emission list mainly came from the activity level of the machinery and from the use of rough activity level data rather than the actual activity level data of the machinery. Pang et al. [18] estimated the exhaust emission inventory of China’s construction machinery in 2015 and pointed out that, in the process of compiling the emission inventory, it was necessary to strengthen the research on the level of localization activities to improve the accuracy of the emission inventory estimation. Obtaining accurate actual activity level data for the machinery can greatly improve the accuracy of the emission inventory and further improve the compilation of the emission inventory. However, there is a lack of research on how to obtain more accurate data on the actual activity level of machinery.
In this study, the most realistic level of mechanical activity was obtained by using the monitoring data from the remote monitoring management system of the non-road mobile machine throughout the year. By integrating these data with the ownership and average rated power of various machinery types in Shandong Province, as indicated by the exhaust smoke opacity spot-check data, an emission inventory for construction machinery in Shandong Province for the year 2021 was compiled using the power method. This study culminated in quantifying the contributions of different types of machinery to particulate matter emissions.

2. Materials and Methods

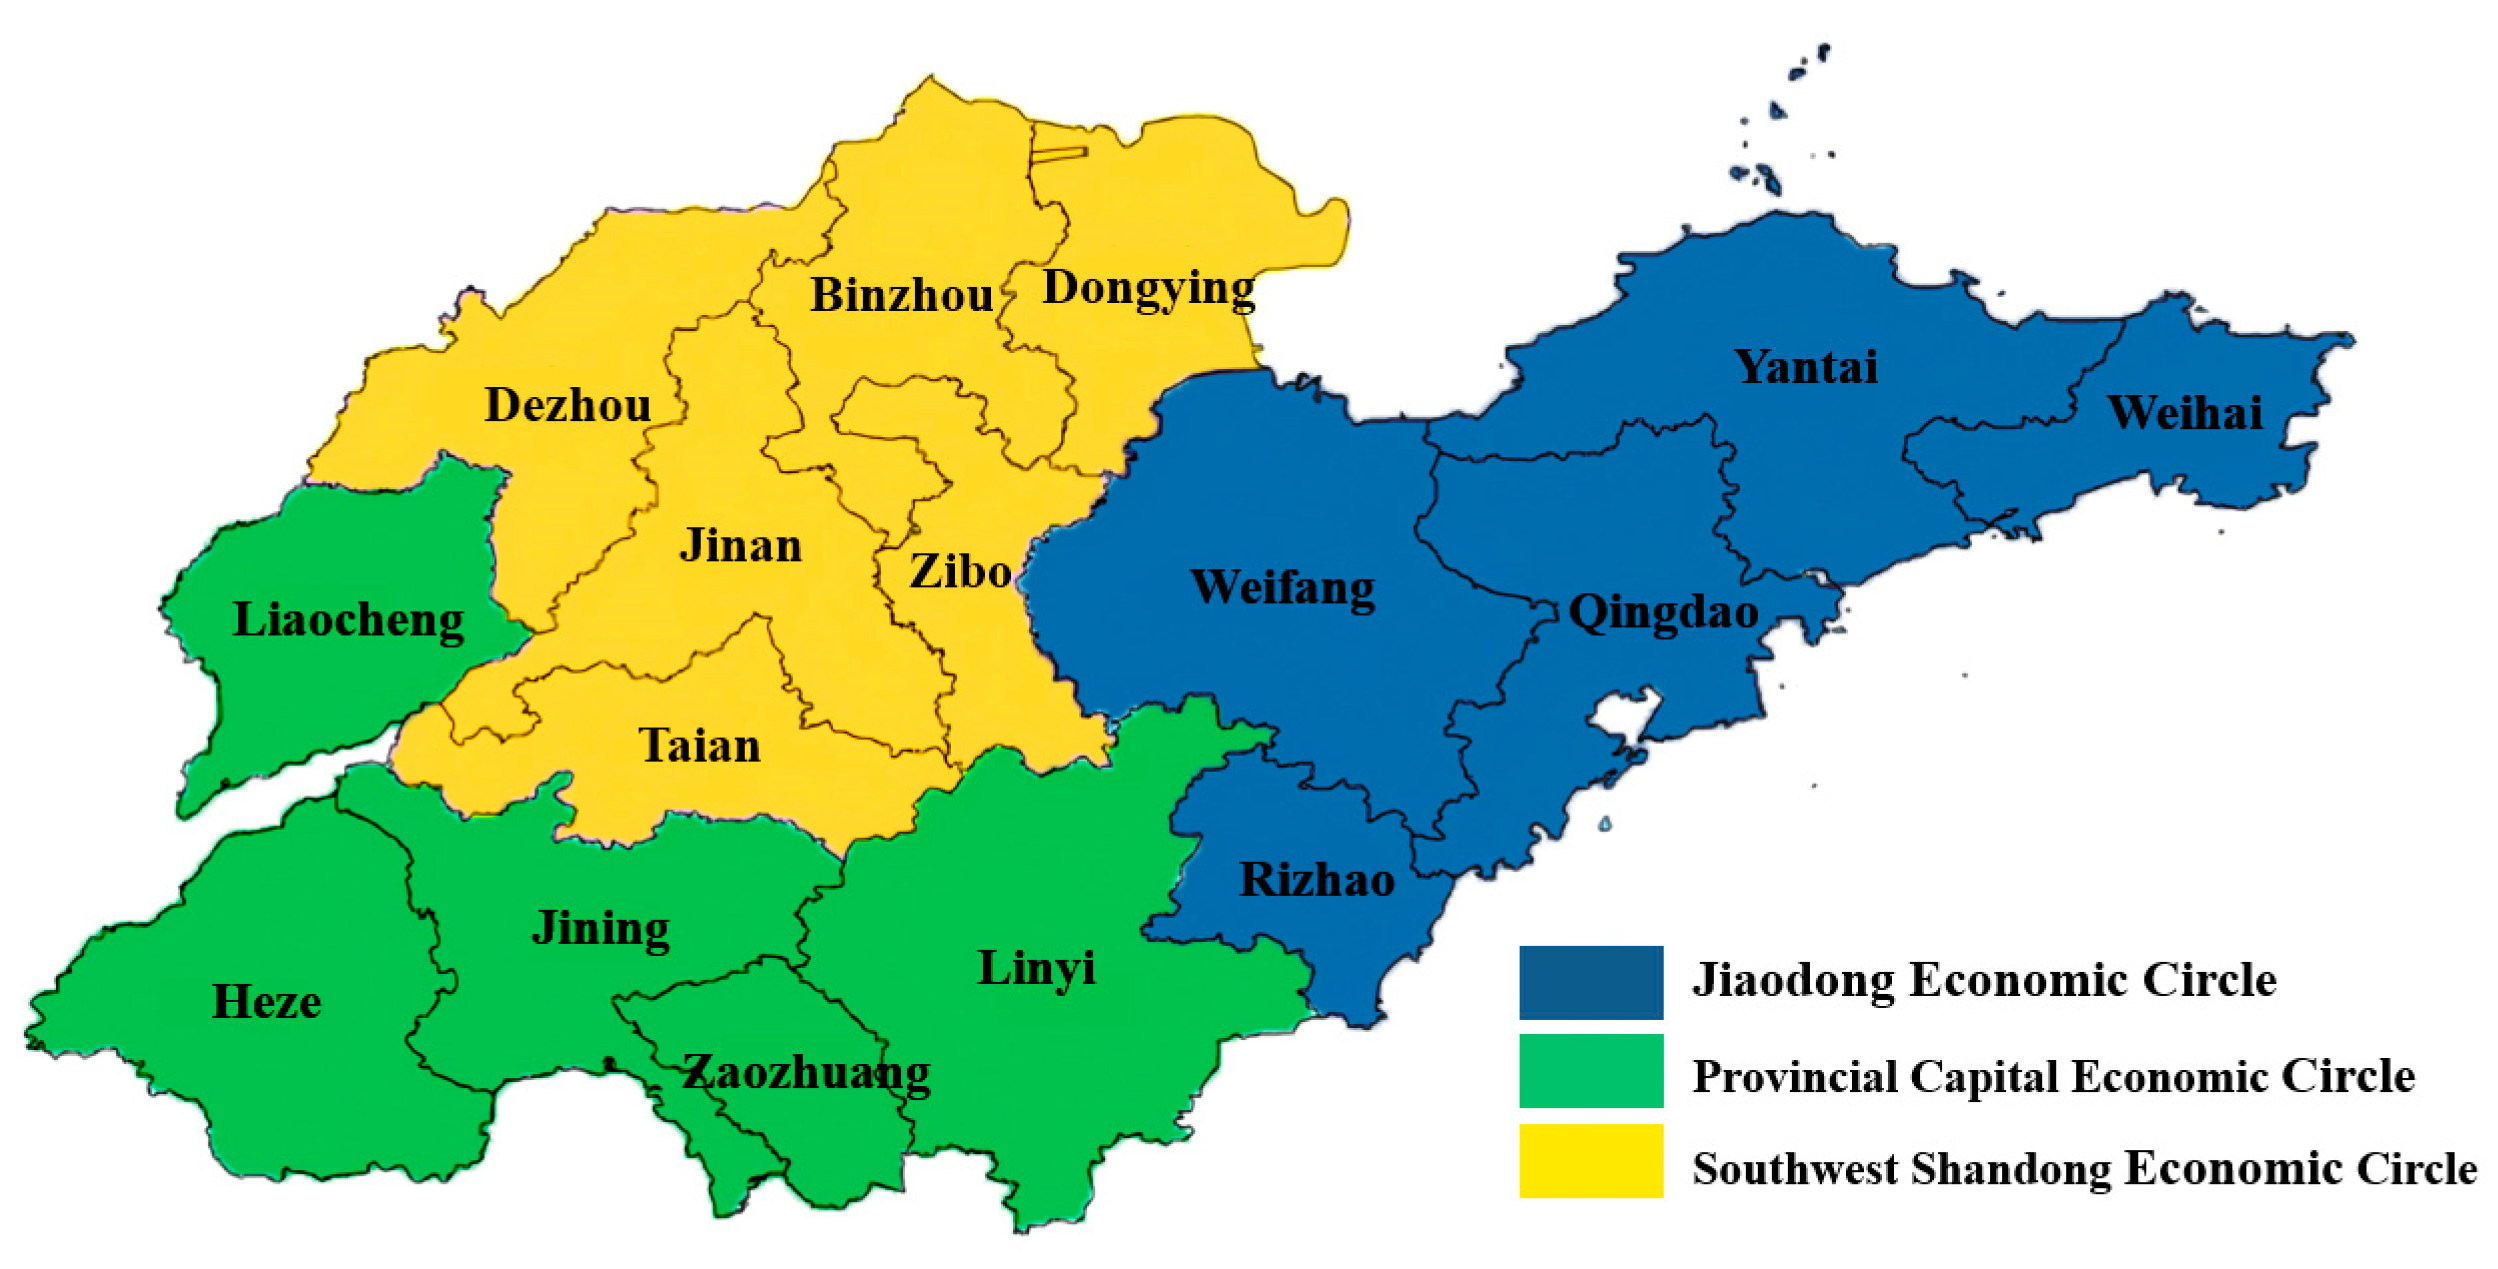
2.1. Overview of the Study Area

The number of non-road mobile machines in Shandong Province is the highest in the country, and the impact of exhaust pollution is increasingly prominent [19]. It is necessary to establish an accurate emission inventory to strengthen the pollution prevention policies and control of non-road mobile machinery. According to the guiding strategy for the integrated development of the three economic circles in Shandong Province, this research area covers the three economic circles of the capital of Shandong Province, Jiaodong, and Lunan, including 16 prefecture-level cities. The division of urban agglomerations in the three major economic circles is shown in Figure 1.

2.2. Data Sources

The dataset utilized in this study on the emission characteristics of non-road mobile machinery primarily derives from two parts. Part of the data came from the measured exhaust smoke of non-road mobile machinery collected by the Shandong Provincial Environmental Protection Department through the sampling method. A total of 13,413 machines were sampled in the province; the testing time was 2019–2020, and all the machines were in normal working condition. A sampling inspection refers to the sampling of machinery in different prefecture-level cities, of different types and at different emission stages by inspectors of the Shandong Environmental Protection Department following the actual distribution ratio of the machinery. The sample data are similar to the actual distribution of the non-road mobile machinery. The other part comes from the mechanical historical operation data on the remote monitoring platform for non-road mobile machinery in Yantai, Shandong province, and exports the data for the whole year of 2021 from the database of the Yantai non-road mobile machinery remote monitoring management system, with a volume of about 35 million data. As a part of Shandong Province, Yantai City is consistent with other cities in terms of its non-road machinery-related emission policies. Meanwhile, in terms of economy, Yantai’s total economic output ranks third within the province. In terms of industrial structure, Yantai City has a complete range of industrial categories and complete industrial support facilities. In terms of terrain, Yantai City and Shandong Province have similar overall characteristics, including mountains, hills, plains, coastlines, and other terrains. The operation data of non-road mobile machinery in Yantai City can be regarded as a suitable representative of that in Shandong Province to a large extent.

2.3. Methodology for Calculating Emission Inventories

The compilation of the emission inventory of non-road mobile machinery is usually based on the Guide [20], combined with the actual machinery emission data obtained from various places. This involves a localization process of the parameters in the Guide, followed by estimations to establish the inventory. The Guide recommends three calculation methods and guides researchers to choose the appropriate compilation method based on the form of data obtained. Among them, the emission inventory estimation method based on the rated power of non-road mobile machinery has the most parameters involved in the calculation, and the calculated emission inventory has the highest accuracy, which requires the user to master the emission source data. The formula for this method is as follows:
E = j k n ( P j , k , n × G j , k , n × L F j , k , n × h r j , k , n × E F j , k , n ) × 10 6
where j is the category of non-road mobile machinery; k is the emission stage; n is the rated power segment of the machine; P is the quantity of stock (unit: set); G is the average rated power (unit: kW/set); LF is the load factor; hr is the number of hours used per year (unit: h); and EF is the emission factor (unit: g/(kW·h)).
This study employs the emission inventory estimation method based on the rated power of non-road mobile machinery. It integrates the actual machinery activity levels obtained from the remote monitoring and management system, along with the machinery category distribution in Shandong Province as indicated by spot-check registration information. This bottom-up approach enables the compilation of a more accurate emission inventory for non-road mobile machinery in Shandong Province, facilitating a statistical analysis of particulate matter emission contributions by different machinery categories.

2.4. Activity Level Data Collection and Statistical Methods

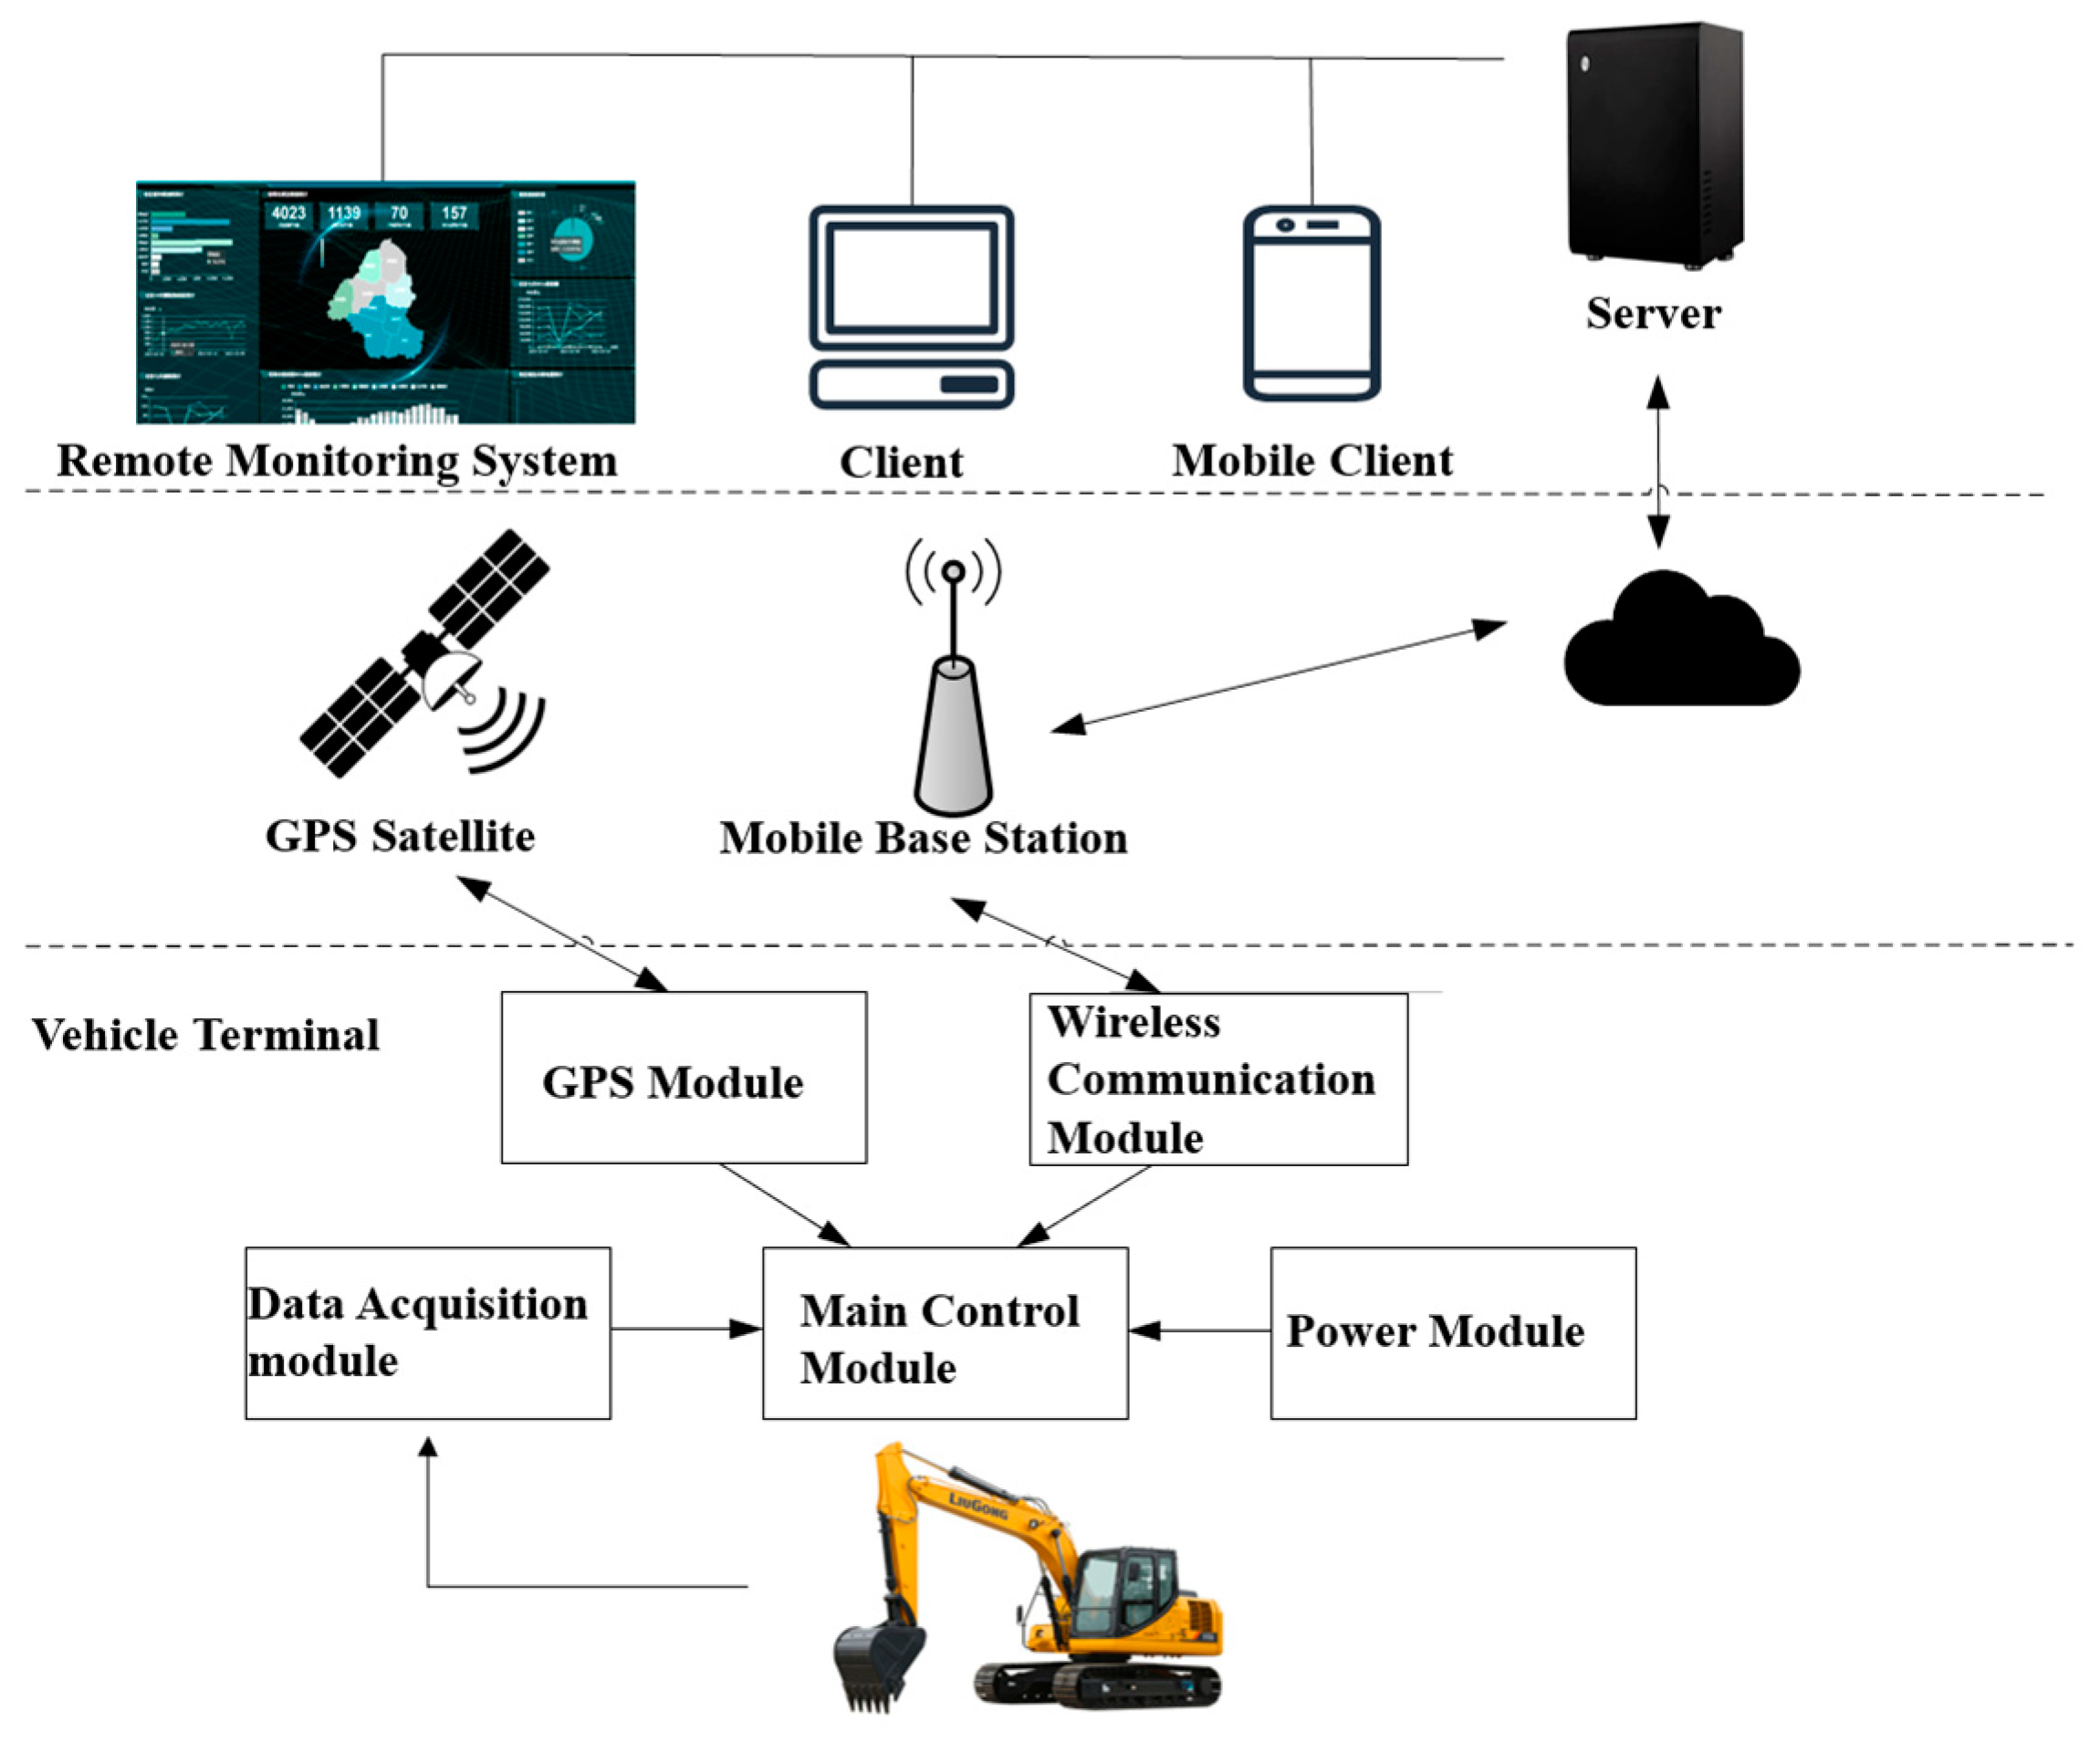
2.4.1. Remote Monitoring Management System

The remote monitoring and management system for non-road mobile machinery is mainly composed of two parts: the on-board terminal and the monitoring platform. The on-board terminal is also known as the on-board diagnostics system (OBD), which is responsible for collecting vehicle information including non-road mobile machinery GPS positioning, real-time operation data, exhaust gas post-processing, device working status, mechanical fault code, and other data. On the one hand, the data collected by the OBD of the vehicle terminal are stored in the SD card of the local storage device, which is used for the local software to read and analyze the mechanical information. At the same time, it also acts as a “black box” to provide the stored data before failure in case of a mechanical failure or sudden accident. On the other hand, the 4G module is used to send packets to the remote monitoring platform at a frequency of 30 s. After the packets sent by the server are received, they are analyzed according to the J1939 protocol and finally stored in the database in JSON data format. A pictorial description of the whole data collection and transmission process is shown in Figure 2. This system plays a crucial role in enhancing urban air quality and promoting environmental sustainability [21,22].
A non-road mobile machinery remote monitoring platform is generally established by the national or local government and is mainly used by the government or designated agencies to manage non-road mobile machinery and its owners within the jurisdiction. In addition to the functions of receiving, analyzing, and storing the data stream uploaded by the vehicle terminal, the remote monitoring platform also has the functions of historical data query, real-time location monitoring, electronic fence warning, and fault warning.
The database is an important part of the non-road mobile machinery remote monitoring platform, and all the data uploaded by the vehicle terminal are stored in the database after being received by the server, providing basic data support for system operation and maintenance and big data analysis. According to the functions to be realized by the remote monitoring platform, various monitoring data item forms are designed in the database, mainly including a user information table, mechanical basic information table, real-time operation data table, and vehicle terminal information table. The real-time operation data records the mechanical real-time data are transmitted by the vehicle terminal to the monitoring platform server, including data collection time, pollution emission data, etc.

2.4.2. Statistical Method of the Actual Activity Level of Machinery

This paper used the historical data from the Yantai City remote monitoring platform database for non-road mobile machinery, in conjunction with big data analytics, to conduct a statistical analysis of the actual activity levels of non-road mobile machinery. This includes an examination of the characteristics and trends associated with the activity levels of various types of non-road mobile machinery. The actual activity level of non-road mobile machinery is calculated as follows:
  • Obtain the historical data of the database. Extract the required data from the database according to study year, region, machine type, etc.
  • Data preprocessing. Perform data cleaning to ensure data quality and integrity, including the exclusion of missing values, duplicate values, and outliers.
  • Calculate the actual activity level. For non-road mobile machinery equipped with an onboard terminal OBD, once started, it is connected to the server through wireless communication, and the mechanical data are sent to the server every 30 s. Therefore, as long as the total number of data of a non-road mobile machine on the platform is counted, the actual activity level of the machine in this period can be calculated. The specific calculation formula is as follows:
    h r = m 2 × 60
    where m is the total number of data of the machine in the database within a certain period.
  • Data analysis. By employing big data technologies and methodologies, this study conducts statistical and trend analyses to reveal the distribution of actual activity levels. It also involves descriptive statistical analysis to characterize the overall distribution of the data.
At present, the Yantai non-road mobile machinery remote monitoring platform monitors 44 machines in real time; it has been running stably for more than 800 days, and all its functions and service modules are normal. The size of data stored in the database is 53 GB, and the total number of data items exceeds 50 million.

3. Obtain the Calculation Parameters

3.1. Mechanical Activity Level

The data for the whole year of 2021 in the Yantai non-road mobile machinery remote monitoring and management system database was exported, with the volume of data being about 35 million and the total size of files being about 33.6 G. The calculation method in Section 2.4.2 was adopted to obtain statistics on the actual activity level of various types of machinery, and the statistical results were compared with the recommended values in the Guide, as shown in Table 1. The Guide provides a recommended annual usage duration of 770 h for all types of construction machinery. However, statistical analysis of the actual operational data revealed that the average annual usage hours for each category of machinery significantly exceeded the recommended values stipulated in the Guide, being about four times that in the guideline, which is consistent with the research conclusion of Pang et al. [7,18]. As can be seen from Table 1, the mechanical activity levels obtained in different studies are different, which is caused by different research areas and different data acquisition methods. The research areas of the two comparative literatures were East China and the average values of different regions in China, respectively, and the coverage of the research area was large, which is not conducive to the investigation of localized activity level. The data acquisition method of the two comparative literatures was a field questionnaire survey, which may have caused the investigated value to be lower than the actual value, and its authenticity is lower than the activity level value obtained by the remote monitoring and management system.
The actual activity level of the machinery at different emission stages calculated in this study presents the following rules: The level of mechanical activity in Stage II is the highest. The level of mechanical activity in Stage I and before is the lowest, about 65% of the level of mechanical activity in Stage II. The level of mechanical activity in Stage III is slightly lower than that in Stage II, about 85% of the level of mechanical activity in Stage II. Taking the loader as an example, the average annual use hours of the Stage I and previous machinery were 2767.4 h, the average annual use hours of the Stage II loader were 3870.3 h, and the average annual use hours of the Stage III loader were 3372.6 h. Among all mechanical types, the annual use time of port terminal ground handling equipment was the longest, which is consistent with the conclusion of the survey data in the literature [7], reflecting the characteristics of high operation intensity of port terminal ground handling equipment. On average, each port terminal ground handling equipment worked 4321.5 h a year—more than five times the recommended value. Secondly, the annual use time of off-highway trucks, loaders, and other types of machinery was longer—more than 3000 h. The annual use time of excavators, road rollers, and material handling machinery was between 2000 and 3000 h. Forklifts had the lowest level of activity at 1642.8 h, but this value was also much higher than the 770 h recommended by the guidelines.
According to the actual annual activity level data for non-road mobile machinery obtained by remote monitoring, the monthly and hourly distribution rules of the actual activity level were analyzed. The average activity level distribution of non-road machinery in different months in 2021 is shown in Figure 3. The Lunar New Year was in February, with the lowest level of mechanical activity, and the number of hours used was about 20 h. Activity levels were also lower in January and March, near the Lunar New Year, at 219 h and 50 h, respectively. The level of mechanical activity in the other months exceeded 300 h, and the monthly level of mechanical activity continued to remain at around 500 h from July to October. This suggests that the actual usage environment and intensity of non-road mobile machinery could significantly surpass the anticipations of regulatory bodies.
Taking the data for October, the month with the highest average mechanical activity level, as an example, the activity level distribution for different periods of mechanical working days and rest days was analyzed, as shown in Figure 4. The distribution trend of the activity level in different periods of a working day and for the rest day was basically consistent, and the number of hours used on the rest day was slightly higher than that on a working day. Analyzing the temporal distribution, midnight (0:00) and noon (12:00) were identified as the periods with the lowest activity levels, while 18:00 (6 p.m.) registered as the next lowest. These times likely correspond to the drivers’ rest periods or shift changes. In addition to the above three periods, the number of data sent by the vehicle OBD to the platform in other periods was around 90; that is, within one hour, the average working time of the machine was 45 min.

3.2. Net Mechanical Power Rating

Based on the data for 13,413 sets of non-road mobile machinery registered by Shandong Provincial Environmental Protection Department in the actual sampling work, the average rated power of each type of machinery was calculated and compared with the recommended value in the Guide. The results are shown in Table 2. The Guide provides specific recommended values for eight categories of machinery, including excavators, bulldozers, and generator sets. However, machinery types with high usage frequency, such as non-highway trucks and port terminal ground equipment, lack specific recommended values and are merely categorized as “others”. For these “other” machinery types, a recommended rated power of 30 kW is suggested, which significantly deviates from the average rated power derived from actual calculations. In the case of the eight types of machinery with specific recommended values, a comparative analysis with the average rated power obtained from actual measurements revealed that the actual average rated powers were generally higher than those recommended in the Guide. This finding aligns with the conclusions drawn in the study by Yang et al. [23].

3.3. Quantity of Stock

According to the survey data from the Shandong Provincial Environmental Protection Department, the total number of non-road mobile machinery units in Shandong Province in 2022 was approximately 427,000. However, detailed data on the quantity of machinery within specific categories have not been disclosed. Under the assumption that the distribution of non-road mobile machinery in Shandong Province strictly adheres to the distribution found in the spot-check samples, the respective proportions of forklifts, excavators, loaders, non-highway trucks, rollers, port terminal ground equipment, material handling machinery, and other types of machinery in the province’s total non-road mobile machinery inventory are 62%, 6%, 21%, 7%, 1%, 1%, 1%, and 1%, respectively. Assuming that the emission stage distribution for each category of machinery mirrors the overall sample distribution, the proportion of machinery at or preceding the National Stage I standard would be 6%, while Stage II and Stage III machinery would account for 41% and 53%, respectively. The estimated amount of various types of construction machinery is shown in Table 3.

3.4. Selection of Other Factors

The load factor, LF, represents the ratio of the net power of the engine during actual operation to the rated net power. Due to the lack of actual investigation of this factor, the recommended value of 0.65 in the Guide is adopted. The Guide recommends a corresponding emission factor for each emission inventory estimation method. The recommended value of the emission factor of the emission inventory estimation method used in this paper was obtained based on the measured data, as shown in Table 4, which had a certain reference significance. The selection of the emission factor was first based on the actual power of the machinery in Table 3 and was then combined with the emission stage of the machinery.

4. Results and Discussion

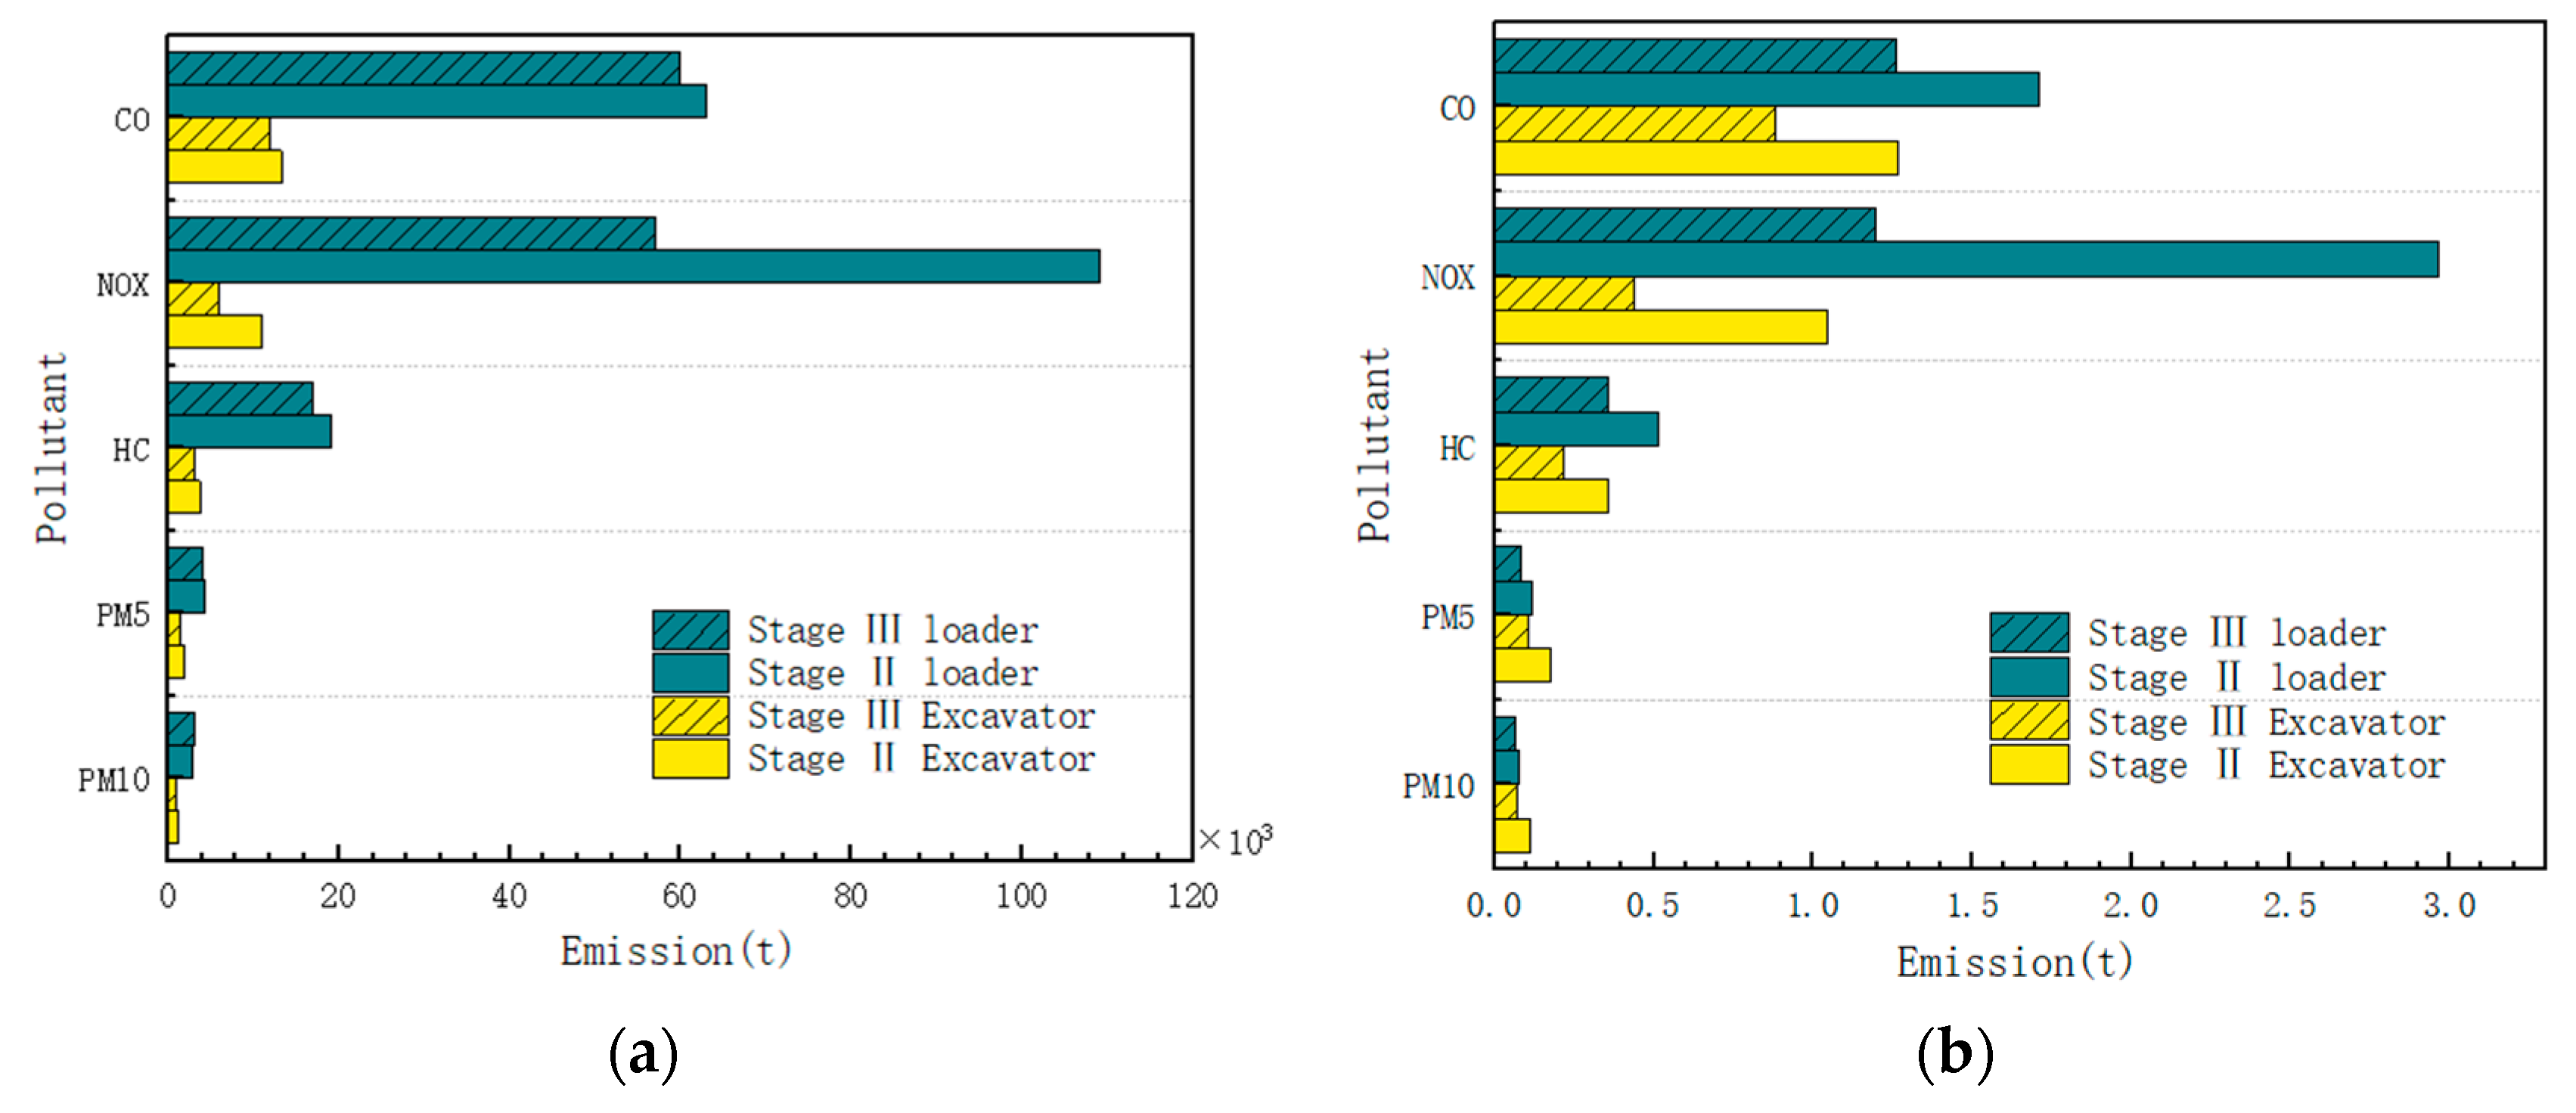
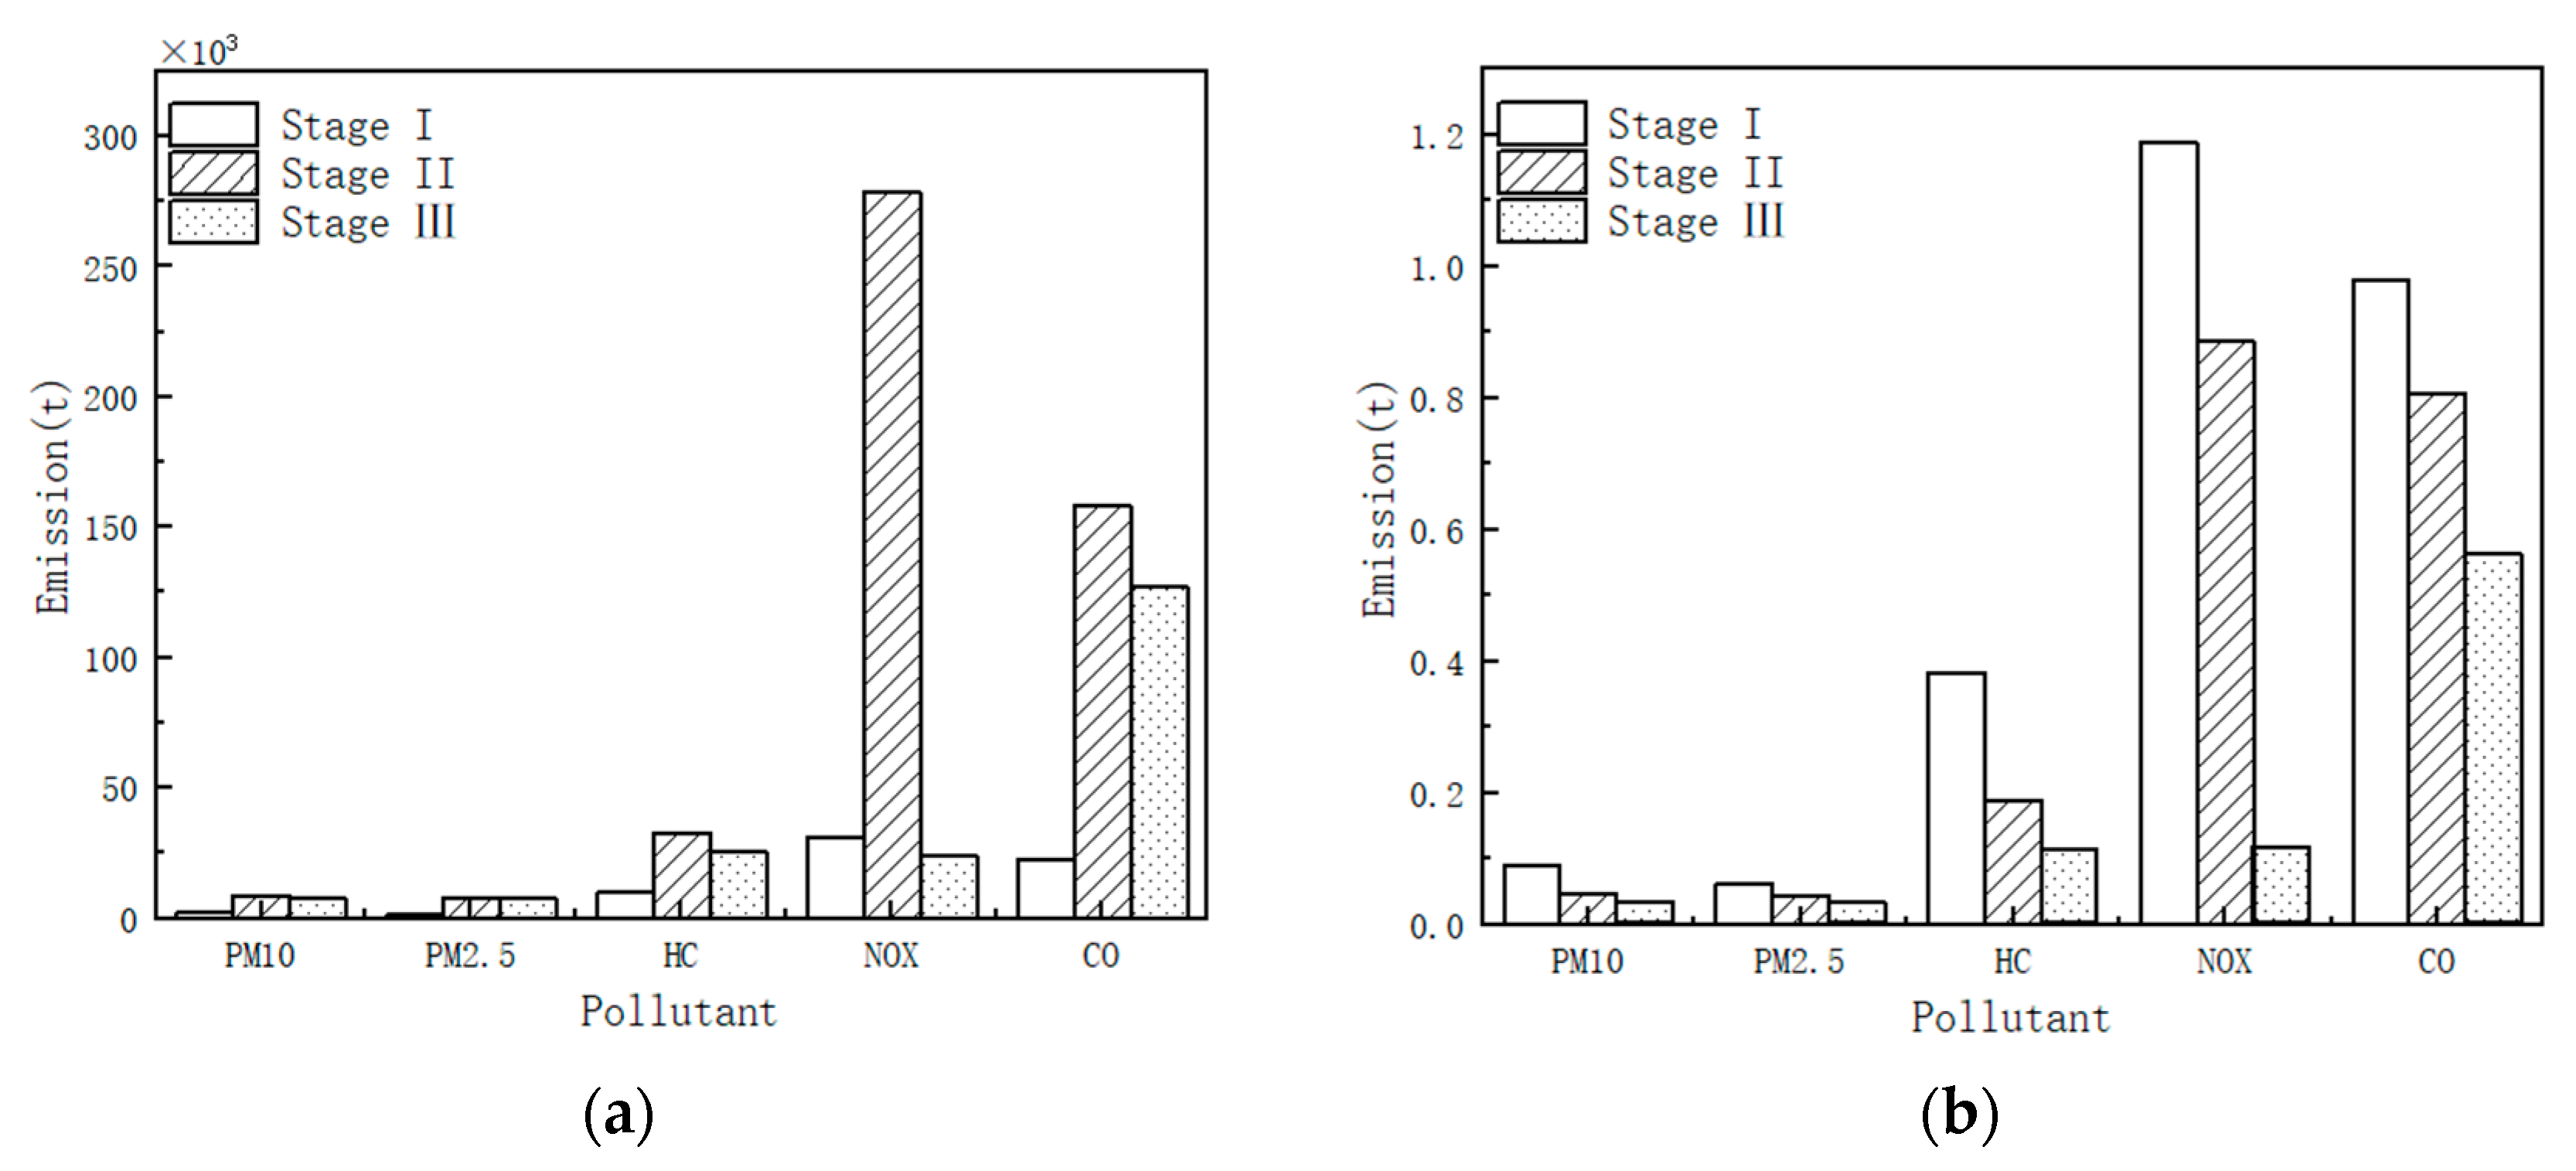
4.1. Calculation Result of Emission Inventory

The estimated results for Shandong Province’s non-road mobile machinery emission inventory in 2021 are shown in Table 5. The results show that the emission of various pollutants ranked as E(NOx) > E(CO) > E(HC) > E(PM10) > E(PM2.5), which is similar to the conclusion of Fan et al. [6,13]. Among them, the emission of NOx was much higher than other pollutants, and the emission control of non-road mobile machinery was the focus. Among the different types of machinery, the four pollutants emitted by the loader were the largest, and the emissions of various types of air pollutants were PM10 6915.7 t, PM2.5 6371.8 t, HC 30,062.3 t, NOx 148,202.0 t, and CO 109,602.2 t. Secondly, the machinery types with high pollution were forklifts, excavators, and off-highway trucks. In the future, the emission control of non-road machinery should focus on loaders, forklifts, and excavators, which is similar to the conclusion of Guo et al. [13,18]. In comparison with other types of machinery, road rollers had the best emission status. Compared with high-pollution excavators and loaders, the rated power of rollers had no obvious trend of reduction, and the reason for the better emission status was that the mechanical use intensity was low; the average annual working time was short; and the deterioration of the mechanical exhaust device was low.
Loaders and excavators, being key focal points in research, are emblematic of construction machinery. In our sample dataset, Stage II and Stage III machinery collectively made up over 94% of the total, with Stage I and earlier machinery representing less than 6%. Consequently, for this study, Stage II excavators, Stage III excavators, Stage II loaders, and Stage III loaders were selected to investigate the differences in the emission masses of four pollutants across various machinery types and emission stages, as illustrated in Figure 5. It can be seen from Figure 5a that the quality of NOx discharged by loaders was the highest, and the quality of CO discharged by excavators was the highest. The PM quality of loaders and excavators was not much different, but the loaders’ emission of the other three pollutants was much higher than that of the excavators. A comparative analysis of excavators and loaders across different emission stages, specifically between Stage II and Stage III machinery, revealed that the emission levels of PM, HC, and CO were relatively similar. To avoid the difference caused by the different numbers of Stage II machinery and Stage III machinery, we calculated the average annual emissions per unit of the corresponding type of machinery, as shown in Figure 5b. As can be seen from Figure 5b, the average annual NOx emission per unit for Stage III machinery was significantly lower than that for Stage II machinery. This is because the implementation of Stage III emission standards has a more obvious effect on NOx reduction.
The emission standard of diesel exhaust pollutants for non-road mobile machinery has been upgraded from Stage II to Stage III, mainly putting forward stricter requirements for the emission of HC and NOx, two kinds of pollutants. Although there is no separate limit on NOx emission pollutants in Stage III, the limits for HC + NOx were reduced by about 30% compared to Stage II. The emission inventories of non-road machinery at different emission stages obtained in this study are shown in Figure 6. As can be seen from Figure 6a, Stage I machinery had the lowest total emission mass. This is because the Stage I machinery has been phased out, and due to the number of large-scale reductions, the total emission quality is significantly reduced. The actual emission of NOx pollutants from Stage III machinery was significantly reduced by 91% compared with that from Stage II machinery, which is similar to the conclusion of Liu et al. [24]. As shown in Figure 6b for calculating the average annual emissions per machine of each stage, the average annual emissions per machine of each type of pollutant of the Stage III machinery were lower, and they had better emission characteristics than that of the Stage II machinery. Therefore, it is necessary to increase the proportion of the number of National Stage III machinery, phase out the non-road mobile machinery of National Stage II emission standards, and reduce the emission of pollutants.
The contribution rate of different types of machinery to particulate matter emission is shown in Figure 7, which is consistent with the overall trend of the emission inventory. Loaders contributed the most, accounting for about 39% of the total particulate matter emissions from construction machinery, followed by forklifts and off-highway trucks, accounting for 29% and 18%, respectively. Excavators and port and terminal ground handling equipment contributed more emissions, accounting for 8% and 3%, respectively. Material handling machinery, road rollers, and other types of machinery each contributed 1% of particulate matter emissions.

4.2. Particulate Matter Emission Verification

In this paper, the fitting empirical formula between exhaust smoke value and exhaust particulate weight of a single machine established by engine bench test is used [25]. The formula is as follows:
W = q Q t 2.293 × 3600
where q is the exhaust smoke value of the quantity (m−1); Q is exhaust flow (kg/h); and t is the time (h).
The exhaust flow value for the machinery was obtained through literature research and consultation with machinery manufacturers. Combined with the average exhaust smoke of the machinery and the actual activity level of the non-road mobile machinery obtained in Section 3.1, the particle emission quality of a single vehicle can be calculated. After multiplying the particle emission mass of a single vehicle by the number of units, the total particle mass of this type of machinery can be estimated. The total particulate matter emissions of this type of machinery was obtained and compared with the estimated results of the inventory, as shown in Table 6.
The results show that the emission quality of particulate matter calculated by mechanical exhaust smoke was generally higher than that calculated by emission inventory, and only the emission quality levels of excavators and off-highway trucks were lower than the inventory results. The difference in particulate matter emissions estimated by the two methods for different types of machinery was averaged to a single machine. It was found that the error for material handling machinery and other types of machinery was large, and the reason was that other types of machinery included more types of machinery, and the emission was uneven. For the material handling machinery, this is due to the large power of the machinery itself, and the actual emission is also poor, so the particle mass calculated based on the measured exhaust smoke was significantly higher than the inventory result. In addition to the above two types of machinery, for the remaining six types of machinery, under the two measurement methods of particulate matter emission quality difference, the average for a single machine within a year of emissions showed only about a 20 kg difference. This proves to a certain extent that the emission inventory established in this study is in good agreement with the exhaust smoke data that can reflect the actual emission status of machinery.

5. Conclusions

Based on the actual activity level data obtained from the remote monitoring and management system of non-road mobile machinery in Yantai City and the data for the inspected machinery registered in the exhaust smoke measurement work, this article establishes the emission inventory of non-road mobile machinery in Shandong Province in 2021. The contribution of different types of machinery to particulate matter emissions is discussed, and the calculated results of particulate matter emissions are verified. The main conclusions are as follows:
The average rated power and activity level of non-road mobile machinery in Shandong Province is generally higher than the recommended values in the Guide. There is a big difference between the activity level parameter and the recommended value in the Guide, and the actual activity level of various types of machinery is about four times the recommended value in the Guide. Additionally, the activity levels of machinery at or preceding the National Stage I standard are the lowest, while Stage II machinery exhibits slightly higher activity levels than Stage III machinery.
The emission of the four pollutants PM, HC, NOx, and CO from loaders, forklifts, off-highway trucks, and excavators was high, and these are the types of machinery that regulatory authorities need to focus on. The national standard for non-road mobile machinery has been tightened from Stage II to Stage III, and the actual mechanical emissions are mainly reflected in the decrease in NOx emissions, which is down by 91%.
The contribution rate of different types of machinery to particulate matter emissions is as follows: loaders 39%, forklifts 29%, off-highway trucks 18%, excavators 8%, and port and terminal ground handling equipment 3%; material handling machinery, rollers, and other types of machinery contribute 1%, respectively.
To reduce the uncertainty of future emission inventories, it is recommended to further develop a remote monitoring platform for non-road mobile machinery to obtain the actual operation data for various types of machinery. This will facilitate the process of quantitative analysis of emission inventories. In addition, this study did not cover the potential impact of vehicle aging, post-maintenance, and the working environment on emissions, which may lead to an underestimation of emissions in the actual environment. In the subsequent emission inventory formulation process, more emission-influencing factors should be considered to obtain a more detailed emission inventory.

Author Contributions

Conceptualization, N.Z. and X.X.; methodology, Y.C. and X.X.; validation, H.O. and Z.X.; investigation, N.Z. and H.O.; resources, N.Z. and X.X.; data curation, H.O.; writing—original draft preparation, H.O.; writing—review and editing, N.Z., Z.X. and X.X.; visualization, Y.C. and H.O.; supervision, X.X.; project administration, X.X.; funding acquisition, N.Z. and X.X. All authors have read and agreed to the published version of the manuscript.

Funding

This research was funded by the National Natural Science Foundation of China, grant number 52301382, and the Natural Science Foundation of Hubei Province, grant number 2022CFB730.

Institutional Review Board Statement

Not applicable.

Informed Consent Statement

Not applicable.

Data Availability Statement

No new data were created or analyzed in this study. Data sharing is not applicable to this article.

Acknowledgments

The authors are thankful to all the personnel who either provided technical support or helped with data collection. We also acknowledge all the reviewers for their useful comments and suggestions.

Conflicts of Interest

The authors declare no conflicts of interest.

References

  1. Bie, P.; Ji, L.; Cui, H.; Li, G.; Liu, S.; Yuan, Y.; He, K.; Liu, H. A Review and Evaluation of Nonroad Diesel Mobile Machinery Emission Control in China. J. Environ. Sci. 2023, 123, 30–40. [Google Scholar] [CrossRef]
  2. Cui, M.; Chen, Y.; Li, C.; Yin, J.; Li, J.; Zheng, J. Parent and Methyl Polycyclic Aromatic Hydrocarbons and N-Alkanes Emitted by Construction Machinery in China. Sci. Total Environ. 2021, 775, 144759. [Google Scholar] [CrossRef]
  3. Wang, C.; Duan, W.; Cheng, S.; Zhang, J. Multi-Component Emission Characteristics and High-Resolution Emission Inventory of Non-Road Construction Equipment (NRCE) in China. Sci. Total Environ. 2023, 877, 162914. [Google Scholar] [CrossRef]
  4. Zhang, Y.; Zhou, R.; Peng, S.; Zhang, X.; Mao, H.; Zhu, L.; Li, X.; Zheng, L.; Wang, Y. Study on Emission Characteristics of Non-Road Mobile Source Pollutants in Tianjin. IOP Conf. Ser. 2020, 467, 012163. [Google Scholar] [CrossRef]
  5. Gu, C.; Zhang, L.; Xu, Z.; Xia, S.; Wang, Y.; Li, L.; Wang, Z.; Zhao, Q.; Wang, H.; Zhao, Y. High-Resolution Regional Emission Inventory Contributes to the Evaluation of Policy Effectiveness: A Case Study in Jiangsu Province, China. Atmos. Chem. Phys. 2023, 23, 4247–4269. [Google Scholar] [CrossRef]
  6. Fan, W.; Chen, J.; Li, Y.; Jiang, T.; Sun, S.; Wang, G.; Liao, H.; Jiang, T.; Wu, K.; Qian, J.; et al. Study on the non-road mobile source emission inventory for Sichuan province. China Environ. Sci. 2018, 38, 4460–4468. (In Chinese) [Google Scholar]
  7. Huang, C.; An, J.; Jun, L. Emission Inventory and Prediction of Non-Road Machineries in the Yangtze River Delta Region, China. Huan Jing ke Xue Huanjing Kexue 2018, 39, 3965–3975. [Google Scholar]
  8. Gao, C.; You, H.; Ba, Q.; Liang, C. Study on a Non-road Mobile Source Emission Inventory and Scenario Prediction in Northeast China. J. Northeast. Univ. (Nat. Sci.) 2021, 42, 358–366. (In Chinese) [Google Scholar]
  9. Yang, L.; Zeng, W.; Zhang, Y.; Liu, Y.; Liao, C.; Gan, Y.; Deng, X. Establishment of emission inventory and spatial-temporal allocation model for air pollutant sources in the Pearl River Delta region. China Environ. Sci. 2015, 35, 3521–3534. (In Chinese) [Google Scholar]
  10. Shen, X.; Kong, L.; Shi, Y.; Cao, X.; Li, X.; Wu, B.; Zhang, H.; Yao, Z. Multi-Type Air Pollutant Emission Inventory of Non-Road Mobile Sources in China for the Period 1990–2017. Aerosol Air Qual. Res. 2021, 21, 210003. [Google Scholar] [CrossRef]
  11. Lončarević, Š.; Ilinčić, P.; Šagi, G.; Lulić, Z. Problems and Directions in Creating a National Non-Road Mobile Machinery Emission Inventory: A Critical Review. Sustainability 2022, 14, 3471. [Google Scholar] [CrossRef]
  12. Wu, B.; Xuan, K.; Shen, X.; Zhao, Q.; Shi, Y.; Kong, L.; Hu, J.; Li, X.; Zhang, H.; Cao, X.; et al. Non-Negligible Emissions of Black Carbon from Non-Road Construction Equipment Based on Real-World Measurements in China. Sci. Total Environ. 2022, 806, 151300. [Google Scholar] [CrossRef]
  13. Guo, X.; Wu, H.; Chen, D.; Ye, Z.; Shen, Y.; Liu, J.; Cheng, S. Estimation and Prediction of Pollutant Emissions from Agricultural and Construction Diesel Machinery in the Beijing-Tianjin-Hebei (BTH) Region, China☆. Environ. Pollut. 2020, 260, 113973. [Google Scholar] [CrossRef]
  14. Wang, C.; Duan, W.; Cheng, S.; Jiang, K. Emission Inventory and Air Quality Impact of Non-Road Construction Equipment in Different Emission Stages. Sci. Total Environ. 2024, 906, 167416. [Google Scholar] [CrossRef]
  15. Hou, X.; Tian, J.; Song, C.; Wang, J.; Zhao, J.; Zhang, X. Emission Inventory Research of Typical Agricultural Machinery in Beijing, China. Atmos. Environ. 2019, 216, 116903. [Google Scholar] [CrossRef]
  16. Li, X.; Yang, L.; Liu, Y.; Zhang, C.; Xu, X.; Mao, H.; Jin, T. Emissions of Air Pollutants from Non-Road Construction Machinery in Beijing from 2015 to 2019. Environ. Pollut. 2023, 317, 120729. [Google Scholar] [CrossRef]
  17. Liu, Y.; Peng, Y.; Zhang, C.; Jin, T. Study of the Beijing construction machinery emission pollution in 2019. J. Saf. Environ. 2021, 21, 2835–2844. (In Chinese) [Google Scholar]
  18. Pang, K.L.; Zhang, K.S.; Ma, S.; Wang, F. Analysis of activity and its emissions trend for construction equipment in China. Huan Jing Ke Xue Huanjing Kexue 2020, 41, 1132–1142. (In Chinese) [Google Scholar]
  19. Sun, S. Study on Evolution of Vehicle Emissions in Shandong Province. Master’s Thesis, University of Jinan, Jinan, China, June 2017. [Google Scholar]
  20. Ministry of Environmental Protection. Technical Guidelines for Compilation of Emission Inventory of Air Pollutants from Non-Road Mobile Sources (Trial). 2014. Available online: https://www.mee.gov.cn/gkml/hbb/bgg/201501/W020150107594587960717.pdf (accessed on 1 December 2023).
  21. Wang, H.; Zhou, J.; Li, X.; Ling, Q.; Wei, H.; Gao, L.; He, Y.; Zhu, M.; Xiao, X.; Liu, Y.; et al. Review on Recent Progress in On-Line Monitoring Technology for Atmospheric Pollution Source Emissions in China. J. Environ. Sci. 2023, 123, 367–386. [Google Scholar] [CrossRef] [PubMed]
  22. Xue, Y.; Liu, X.; Cui, Y.-Y.; Shen, Y.; Wu, T.; Wu, B.; Yang, X. Characterization of Air Pollutant Emissions from Construction Machinery in Beijing and Evaluation of the Effectiveness of Control Measures Based on Information Code Registration Data. Chemosphere 2022, 303, 135064. [Google Scholar] [CrossRef]
  23. Yang, B.; Cui, H.; Liu, S.; Li, G. Distribution and Exhaust Smoke Characteristics of Typical Construction Machinery in Service in Jinan. Constr. Mach. Equip. 2021, 52, 108–112+13. (In Chinese) [Google Scholar]
  24. Liu, P.; Hu, M. Emission Inventory of Non-Road Mobile Machinery in Shenzhen. J. Shenzhen Univ. (Sci. Eng.) 2020, 38, 331–339. (In Chinese) [Google Scholar] [CrossRef]
  25. Wang, L. Study on Relationship among Dynamic Smoke, Filter Type Smoke Fs and Particles. Mod. Veh. Power 2016, 4, 32–35. [Google Scholar]
Figure 1. Division of the investigated three economic circles in Shandong Province, China.
Sustainability 16 02292 g001
Figure 2. The overall architecture of the remote monitoring system.
Sustainability 16 02292 g002
Figure 3. Average monthly activity levels in 2021.
Sustainability 16 02292 g003
Figure 4. Activity level distribution in different periods.
Sustainability 16 02292 g004
Figure 5. Emission differences of typical machinery at different emission stages. (a) Total emissions; (b) average annual emissions of a single machine.
Sustainability 16 02292 g005
Figure 6. Emission inventories of non-road machinery at different emission stages. (a) Total emissions; (b) average annual emissions of a single machine.
Sustainability 16 02292 g006
Figure 7. Contribution rate of particulate matter emission from different types of machinery.
Sustainability 16 02292 g007
Table 1. Comparison of annual usage hours (Unit: h).
Type of MachineryAnnual Use HoursThe Guide-Recommended Annual Use Hours
This ResearchThe Literature [18]The Literature [7]
Forklift1642.82274950770
Excavator2212.419831580770
Loader3618.321311261770
Off-highway truck3815.0--770
Road roller2507.21983617770
Port terminal ground handling equipment4321.5-2442770
Material handling machinery2760.322991826770
Other3268.23749-770
Table 2. Comparison of average rated power (Unit: kW).
Type of MachineryAverage PowerThe Guide-Recommended Power
Forklift4640
Loader150135
Off-highway truck20430 (other)
Excavator125100
Road roller118110
Port terminal ground handling equipment18130 (other)
Material handling machinery14530 (other)
Bulldozer153120
Asphalt pavers15680
Industrial drilling equipment13230 (other)
Generator set18088
Air compressor15230 (other)
Airport ground handling equipment1830 (other)
Table 3. Number of construction machines by category (Unit: units).
Type of MachineryStage I and beforeStage IIStage IIITotal
Forklift15,884109,044140,812265,740
Excavator153710,50413,57925,620
Loader538036,76547,52589,670
Off-highway truck179312,25515,84229,890
Road roller205140118103416
Port terminal ground handling equipment359245131685978
Material handling machinery256175122634270
Other154105013582562
Total25,568175,221226,357427,146
Table 4. Emission factor (Unit: g/kWh).
Emission StandardPM10PM2.5HCNOxCO
G < 37 kWStage I and before1.201.141.3010.506.50
Stage I1.000.951.3010.506.50
Stage II0.950.901.307.506.50
Stage III0.550.521.106.005.00
37 kW < G < 75 kWStage I and before1.000.951.3010.506.50
Stage I0.850.811.309.206.50
Stage II0.400.381.307.005.00
Stage III0.350.321.003.504.50
75 kW < G < 130 kWStage I and before0.800.761.3010.005.00
Stage I0.700.671.309.205.00
Stage II0.300.291.006.005.00
Stage III0.250.230.802.804.50
G > 130 kWStage I and before0.700.671.3010.005.00
Stage I0.540.511.309.205.00
Stage II0.200.191.006.003.50
Stage III0.180.160.802.803.00
Table 5. Emission list of construction machinery in Shandong Province in 2021 (Unit: t).
Machinery CategoryPM10PM2.5HCNOxCO
Forklift5208.14863.514,837.568,621.962,744.1
Excavator1370.11294.14200.120,705.821,806.5
Loader6915.76371.830,062.3148,202.0109,602.2
Off-highway truck3172.32922.813,789.867,981.450,275.4
Road roller195.4184.6599.12953.43110.4
Port terminal ground handling equipment637.7587.52771.913,665.010,105.9
Material handling machinery233.1214.71013.14994.53693.7
Other188.4173.68194037.52985.9
Total17,920.816,612.668,092.8331,161.5264,324.1
Table 6. Calculation of particulate matter mass.
Machinery CategoryExhaust Smoke
(m−1)
Exhaust Flow
(kg/h)
Activity Level
(h)
Quantity of StockParticulate Matter Mass Estimated by Exhaust Smoke (t)Inventory Estimation Quality (t)
Forklift0.552821642.8264,7408171.65208.1
Excavator0.237822212.425,6201235.01370.1
Loader0.307963618.389,6709386.06915.7
Off-highway truck0.209293815.029,8902566.63172.3
Road roller0.357022507.23416254.9195.4
Port terminal ground handling equipment0.288444321.55978739.6637.7
Material handling machinery0.407752760.34270442.6233.1
Other0.536883268.22562369.9188.4
Disclaimer/Publisher’s Note: The statements, opinions and data contained in all publications are solely those of the individual author(s) and contributor(s) and not of MDPI and/or the editor(s). MDPI and/or the editor(s) disclaim responsibility for any injury to people or property resulting from any ideas, methods, instructions or products referred to in the content.

