Abstract
Trifluoroacetic acid (TFA) is a known and persistent pollutant in the environment. Although several direct anthropogenic sources exist, production from the atmospheric degradation of fluorocarbons such as some hydrofluorocarbons (HFCs) has been a known source for some time. The current transition from HFCs to HFOs (hydrofluoroolefins) is beneficial from a global warming viewpoint because HFOs are much shorter-lived and pose a much smaller threat in terms of warming, but the fraction of HFOs converted into TFA is higher than seen for the corresponding HFCs and the region in which TFA is produced is close to the source. Therefore, it is timely to review the role of TFA in the Earth’s environment. This review considers its toxicity, sources and removal processes, measurement in a variety of environments, and future prospects. New global model integrations are used to quantify the impacts of uncertainties on TFA levels using the Henry’s Law constant for TFA and the range of gas-phase kinetic parameters chosen for the reaction of OH radicals with a representative HFO (HFO-1234yf). Model runs suggest that TFA surface concentrations vary by up to 10% based on Henry’s Law data but could be up to 25% smaller than previously modelled values suggest depending on the kinetic analysis adopted. Therefore, future estimates of TFA surface concentrations based on HFO removal require updating and the kinetic analysis of TFA production warrants further investigation. The toxicity of TFA appears to be low, but further studies of a much wider range of animal and plant types are required.
1. Introduction
Trifluoroacetic acid (TFA, CF3COOH) is the shortest-chain species of perfluorinated carboxylic acid (PFCA) and the broader family of perfluorinated carboxylates. It is one of thousands of compounds categorized as a per- and polyfluoroalkyl substance (PFAS). PFCAs include all substances that have a carboxylic group and at least one perfluoroalkyl moiety, represented by CnF2n+1 (where n ≥ 1) [1]. Many long-chain PFASs have been found to potentially cause adverse effects on human and animal health in several in vitro and in vivo studies [2,3,4,5,6,7,8,9], to be ubiquitous and persistent in the environment, and to bio-magnify along food chains [2,10,11,12,13,14,15]. Over 9000 PFASs have been identified to date and many face regulations that restrict their use because of their toxicity to humans and animals [16,17,18,19,20,21]. In view of these regulations, studies have recently shifted their focus towards shorter-chain PFASs, which are set to replace those long-chain versions most used [22,23]. In fact, many of the short-chain PFASs that are replacing more traditional long-chain PFASs are already beginning to see widespread environmental occurrence and may present similar challenges [24,25].
TFA is the focus of this review as most longer-chain PFASs degrade in the environment (for example, atmospherically, via oxidation by OH radicals) into this compound. Unlike many other PFASs, which are non-polar and largely insoluble in water, short-chain PFASs such as TFA are highly mobile in the environment and accumulate in environmental aqueous phases due to their high solubility [26]. Current research suggests that most short-chain PFASs, including TFA, do not bioaccumulate in food chains and are rapidly excreted from humans, although some reports state that TFA has the potential to bioaccumulate in plant material [27]. A 2012 study by Russell et al. [25], sponsored by DuPont, collected measurement data for TFA in aquatic systems across the world and then carried out a detailed modelling analysis of TFA levels in aquatic systems across the USA. Comparing measured and modelled data with ecotoxicity data for freshwater algae, marine algae, aquatic plants, crustacea, and fish, they concluded that, even with rising levels of TFA predicted from the use of HFOs, aquatic life would be ‘unaffected’ by these levels of TFA [28]. Most tests on microorganisms have found that high TFA concentrations cause no harm, although one species of algae did show inhibited growth when exposed to extremely high concentrations [27]. Biological and medical research is encouraging in its unanimous findings that TFA does not bioaccumulate and exhibits low-to-moderate toxicity in a range of organisms, even in instances of very high exposure [29,30]. Furthermore, anthropogenically generated TFA is not expected to contribute significantly to acid rain or further terrestrial acidification [31]. But caution must be taken not to underestimate the impacts of TFA as its anthropogenic sources increase.
Even in the absence of evidence that TFA presents a significant risk to humans or the environment, its persistence due to its environmental stability [29,32,33], combined with constant or increasing emissions, will likely result in significant accumulation in the environment. TFA contamination would then be widespread, long-lasting, and difficult to remove; this would present a huge challenge if future research were to discover any detrimental effects of TFA. Indeed, TFA is already being observed in significant and increasing quantities in surface water, rain, fog, sewage treatment plants, snow, the atmosphere, and sediments [30,34,35,36,37,38,39,40,41,42,43,44]. TFA rapidly dissociates into its deprotonated form, trifluoroacetate, in an aquatic environment, particularly in aqueous phases [30]. Therefore, in the context of environmental contamination, TFA salts are the most important compounds to consider. As a result, TFA and subsequent trifluoroacetate contamination have been considered in a range of international regulatory assessments conducted by the United Nations Environmental Program (UNEP) since 1998 [30,41]. Depending on their ecological or toxicological properties, persistent substances can pose a threat to the environment as they are irrecoverable and lead to environmental pollution lasting decades to centuries, and eventually longer.
Presented herein is a comprehensive review of the current and recent literature, consolidating what is currently known about the physical and chemical properties, sources and sinks, environmental fate, and toxicity of TFA.
2. Physicochemical Properties
TFA (CAS: 76-05-1, MW = 114.02 g mol−1) is a colorless, volatile liquid with a distinctive odor and a density of about 1.49 g cm−3 at 25 °C. It has a melting point of approximately −15.4 °C and a boiling point between 72 and 74 °C [30,45]. It is soluble in water and various organic solvents such as methanol, ethanol, acetone, and chloroform [45]. The solubility of TFA in water has been shown to decrease with decreasing pH, as would be expected for an acidic species [46,47]. The physicochemical properties of TFA have been listed in Table 1.

Table 1.
Physicochemical properties of TFA.
TFA is strongly acidic due to the inductive effect of the highly electronegative fluorine atoms, which draw electron density away from the carboxylate group and stabilize the anion. Similarly, the resonance of the C-F bond stabilizes the anion as electron density is distributed more evenly. The acid dissociation constant of TFA, the pKa, is contested in the literature, but is generally accepted to be between 0.2 and 0.5 [30,45,46,48,49,50,51]. This value is over 34,000 times more acidic than acetic acid. As a result, TFA is highly soluble in water. This rapid dissociation in aqueous solutions produces the TFA anion, known as trifluoroacetate, Figure 1. Environmentally, this means that TFA is expected to partition entirely into aqueous phases.
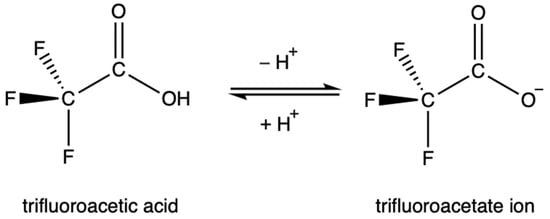
Figure 1.
The equilibrium between trifluoroacetic acid and its conjugate base.
The trifluoroacetate anion persists in soil and environmental aqueous phases due to the high chemical and biological stability of the C-F bond [30]. TFA and its salts are highly soluble. As such, they are found in rain, fog, and water bodies, with large reservoirs present in the ocean. TFA has no known degradation pathways in environmental aqueous phases [53].
Henry’s Law describes the proportionality between the amount of dissolved gas in a liquid and the partial pressure above said liquid; this is a metric commonly used in atmospheric chemistry. The Henry’s Law constant of TFA was originally reported to be (9 ± 2) × 103 mol kg−1 atm−1 at 298 K [49]. More recently, Kutsuna et al. [46] proposed a Henry’s law constant 0.63 times smaller than that of Bowden et al. [49] when assuming pKa = 0.47, and equal to that determined by Bowden et al. [49] when assuming pKa = 0.2 [46]. The uncertainty in the pKa of TFA, arising as a result of significant variability in values reported depending on the measurement technique used, is suggested to be the main cause of discrepancies between calculated Henry’s Law constants [46]. Additionally, the solvation energy used is crucial in the calculation of pKa and reported values for this property vary significantly [46,49].
The behavior of TFA with respect to gas-to-aerosol partitioning around 298 K is likely to be similar to that discussed by Bowden et al. [49]. These authors reported that TFA in the atmosphere will partition entirely into fog and cloud water, but that partitioning into smaller amounts of liquid water, e.g., aerosol, is more complex. Here, TFA may partition into the liquid phase in alkaline aerosol, but less so as the aerosol becomes more acidic, and this idea has support in the wider literature [49,54,55]. Interestingly, Kazil et al. suggested that, upon cloud evaporation, dissolved TFA is released into the gas phase [54]. While the participation of TFA in aerosol formation and its ability to partition into existing aerosols is complicated, with dependencies on pH, temperature, and aerosol composition [49], research supports the contribution of TFA to aerosol formation [56]. However, a recent study demonstrated that quantifying the gas-particle-phase partitioning of TFA is particularly sensitive to predicted physical properties under atmospherically relevant conditions [55].
Using previous global model integrations as a basis for research [57] (see Supplementary Materials for more details about the integration carried out) and utilizing the global 3D chemical transport model STOCHEM-CRI, integrations have been carried out to assess the sensitivity of the global TFA burden to the choice of Henry’s Law constant. Specifically, the TFA Henry’s Law constant presented in Kutsana et al. [46] 5.7 × 101 mol m−3 Pa−1 has been used to determine the upper limits for dynamic and convective scavenging coefficients (2.2 cm−1 and 4.3 cm−1, respectively) that represent wet deposition [57]. The model used has been described elsewhere, and previously published work provides a STOCHEM-base scenario (which involves HFO-CI-HETFA, using dynamic and convective scavenging coefficients of 1.9 cm–1 and 3.8 cm–1 derived from the average of the Henry’s Law constants reported by Sander et al. [58]) for comparison [57].
The updated simulation with altered scavenging coefficients, referred to as STOCHEM-USC, shows a small increase in the wet deposition flux of TFA by ~0.5% compared to the base scenario, with a corresponding decrease in TFA global burden of ~4.5%. Figure 2 depicts the absolute and percentage variations between the STOCHEM-base and STOCHEM-USC simulations. While a small shift is seen globally, the most significant absolute changes are found in a small section of the upper latitudes.
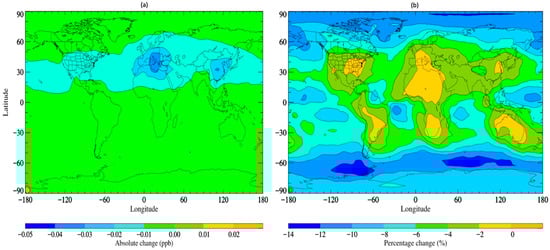
Figure 2.
Surface distribution plot depicting the (a) absolute and (b) percentage changes in. TFA concentrations from STOCHEM-base to STOCHEM-USC simulation.
Areas of reduced atmospheric TFA concentrations represent areas of greater deposition and therefore higher environmental contamination. In view of these updates to the model, which are understood to represent an upper limit of wet deposition from data in the existing literature, we can expect relatively minor sensitivity to variation in wet deposition parameters. Although further detailed measurements of the Henry’s Law coefficient for TFA are useful, other parameters concerning TFA, like its lifetime and environmental impact, are more pressing (as discussed in later sections).
Wet deposition is the dominant loss process for atmospheric TFA (being responsible for approximately 80% of total atmospheric TFA loss according to results published previously) [57]. Therefore, it is also the primary route to TFA environmental contamination. Given its high solubility, major concerns with TFA contamination center around environmental aqueous phases, e.g., rivers, lakes, and surface waters. As a result of pervasive TFA contamination, there have been some attempts to quantify the toxicity of TFA and its salts, particularly for species whose habitats are especially impacted.
3. Toxicity
The accumulation of TFA, or rather its deprotonated form trifluoroacetate, in environmental aqueous phases is well established; as a result, it is becoming increasingly important to consider the degree of its potential toxicity. To date, the toxicological and ecotoxicological properties of short-chain PFASs, including TFA, have arguably been only sparsely investigated [41].
Given that TFA is likely to partition in the environment into its deprotonated form, toxicity assessments are generally conducted with the anion, trifluoroacetate. Overall, the reported toxicity is low (Table 2), with only one aquatic alga presenting a concerning sensitivity to TFA [59]. More generally, the resistance of aquatic plants to the effects of TFA contamination is demonstrated in several reports [60,61], with Berends et al. reporting a ‘safe’ TFA level of 0.10 mg L−1 for aquatic life [59].
While aquatic plant species are expected to be exposed to elevated TFA concentrations given its accumulation in water, terrestrial plants associated with these same water systems may also experience significant exposure [62,63]. For example, Zhang et al. reported the efficient absorption and uptake of TFA by wheat roots, with no tendency to reach a steady state [64]. Additionally, a number of studies reported that direct uptake from the atmosphere can contribute to high levels of TFA in terrestrial plant leaves [65,66,67]. Some terrestrial plants have been reported to bioaccumulate TFA [68], with bioconcentration factors reported to span from 4.9 to 1439 [29,65,69,70]. As a result, the toxicity they experience may be higher.
The unreactive nature of TFA in the environment appears to translate into an inertness in organisms, thereby limiting its toxic effects [63]. TFA has been detected in a wide range of organisms [59,61,65,70,71,72,73,74], but a primary concern relates to its potential toxicity in humans and other mammals. A full review of the question of mammalian toxicity can be found in Dekant et al. [74], but can be summarized with the following: at the time of writing, the potential of TFA to induce toxicity in living organisms is considered to be very low. Additionally, TFA is reported to be easily excreted by mammals and so is unlikely to bioaccumulate [74,75,76]. Despite this, some bioaccumulation of TFA has been reported. For example, Lan et al. demonstrated the ability of TFA to bioaccumulate in a range of organisms and suggested the use of locusts as a biomonitoring tool for ecological risk assessment [70].
Additionally, a recent study reported a significant detection frequency of TFA (>90%) in the serum of 252 subjects in China [77]. The authors obtained a median concentration of 8.46 ng mL−1 across subjects and saw that TFA concentrations were correlated with age, which could suggest accumulation. However, another report suggested that the TFA concentrations measured by Duan et al. [77] might result from its metabolic generation from longer-chain PFASs, or from elevated local exposure [78]. Both the detection of metabolically generated TFA in mammals and elevated TFA exposure from certain occupational sources have been reported [79,80,81]. If this is the case, concentrations reported by Duan et al. [73] might not be representative of the general population. On the other hand, Zheng et al. [82] also detected TFA in human serum that was in good agreement with the values reported by Duan et al. [77].
Kim et al. have recently reported what they believe to be the first study detecting TFA in urine samples taken from the general population [83]. Later, Zheng et al. [82] reported the detection of TFA in 31% of urine samples taken, with some of the samples showing high concentrations. However, it has also been suggested that urine may not be a suitable matrix for long-term screening [83]. Overall, there is a clear need for development of a quantitative biomonitoring strategy for emerging contaminants such as TFA and further studies are urgently required.
Table 2.
Summary of toxic effects of TFA on organisms, adapted from Seiber et al. [63]. Reproduced and updated with permission, Copyright © 2021, Taylor and Francis Group LLC—Books.
Table 2.
Summary of toxic effects of TFA on organisms, adapted from Seiber et al. [63]. Reproduced and updated with permission, Copyright © 2021, Taylor and Francis Group LLC—Books.
| Species | Type of Organism | No Observed Effects Level or Concentration (NOEL or NOEC) | 50% Effect (TD50 or EC50) [mg L−1] | Ref. |
|---|---|---|---|---|
| Animals | ||||
| Mice | Mammal | 5000 mg kg−1 | not reported | [71] |
| Rats | Mammal | 237 mg kg−1 | not reported | [72] |
| Danio Rerio | Fish | 1200 mg L−1 | >1200 | [59] |
| Daphnia Magna | Aquatic invertebrate | 1200 mg L−1 | >1200 | [59] |
| Aquatic Plants and Algae | ||||
| Lemna gibba | Aquatic macrophyte | 300 mg L−1 | 1100 | [59] |
| Lemna gibba | Aquatic macrophyte | not reported | 618.3–3000 | [61] |
| Myriophyllum spicatum | Aquatic macrophyte | not reported | 312.9–10,000 | [61] |
| Myriophyllum spicatum | Aquatic macrophyte | not reported | 340.7–10,000 | [61] |
| Selenastrum capricornutum | Green alga | 0.12 and <0.36 mg L−1 | >1.2 and 4.8 | [59] |
| Chlorella vulgaris | Green alga | 1200 mg L−1 | >1200 | [59] |
| Scenedesmus subspicatus | Green alga | not reported | >120 | [59] |
| Chlamydomonas reinhardtii | Green alga | 120 mg L−1 | >120 | [59] |
| Dunaliella tertiolecta | Green alga | <124 mg L−1 | >125 | [59] |
| Euglena gracilis | Green alga | 112 mg L−1 | >112 | [59] |
| Phaeodactylum tricornutum | Diatom | 117 mg L−1 | >117 | [59] |
| Navicula pelliculosa | Diatom | 600 mg L−1 | 1200 | [59] |
| Skeletonema costatum | Diatom | 2400 mg L−1 | >2400 | [59] |
| Anabaena Flos-Aquae | Blue-green alga | 600 mg L−1 | 2400 | [59] |
| Microcytis aeruginosa | Blue-green alga | 117 mg L−1 | >117 | [59] |
| Average NOEC for aquatic plants and algae: 520 mg L−1 a | ||||
| Terrestrial Plants | ||||
| Deschampsia elongata | Terrestrial plant | >1 mg L−1 b | not reported | [84] |
| Lasthenia californica | Terrestrial plant | >1 mg L−1 b | not reported | [84] |
| Oryza sativa (rice) | Terrestrial plant | >1 mg L−1 b | not reported | [84] |
| Pinus ponderosa | Terrestrial plant | >10 mg L−1 c | not reported | [65] |
| Phaseolus vulgaris (common bean) | Terrestrial plant | >2.5 mg L−1; LOEL = 10 mg L−1 b,d | not reported | [85] |
| Vigna radiata (mung bean) | Terrestrial plant | 1 mg kg−1 of soil b | not reported | [29] e |
| Zea mays (corn) | Terrestrial plant | >2.5 mg L−1; LOEL = 10 mg L−1 b,d | not reported | [85] |
| Triticum aestivum (wheat) | Terrestrial plant | 1–32 mg L−1 b 5 mg L−1 c | not reported | [29] e |
| Plantago major | Terrestrial plant | 32 mg L−1 b | not reported | [29] e |
| Helianthus annus (sunflower) | Terrestrial plant | <1 mg kg−1 soil b; 100 mg L−1 c | not reported | [29] e |
| Glycine max (soybean) | Terrestrial plant | 1 mg L−1 b; 10 mg L−1 c | not reported | [29] e |
| Average NOEC for terrestrial plants: 7.2 mg L−1 b,f | ||||
| Seedling Terrestrial Plants g | ||||
| Tomato | seedling | <37.5 μL L−1 | not reported | [86] |
| Wheat | seedling | <37.5 μL L−1 and <0.7 μL L−1 | not reported | [86] |
| Sunflower | seedling | <0.7 μL L−1 | not reported | [86] |
| Mung bean | seedling | <0.7 μL L−1 | not reported | [86] |
| Soybean | seedling | <0.031 μL L−1 | not reported | [86] |
a test was a mixture of TFA and TCA that showed no long-term effects. There were transitory effects in the first few days. b root uptake route of exposure. c foliar uptake route of exposure. d based on biomass production; however other indices of plant performance showed effects as low as 0.625 mg L−1. e data summarized in Boutonnet et al. [26] from grey literature reports. f the average NOEL calculations used the minimum possible value, such that treated values were reported as “>1” as 1. g unit that expresses μL of TFA per liter of nutrient solution.
Much of the research on potential toxicity of TFA contamination has been conducted via modelling studies. Russell et al. [28] evaluated potential aquatic risk related to TFA accumulation in several modelling assessments, and predicted that after 50 years of precursor emissions, trifluoroacetate concentrations would reach 1–15 mg L−1 over most of the continental United States. Such values remain well below the nominal ecotoxicological endpoint [28]. They also modelled a ‘worst-case’ scenario of 50 years of continuous upper-bound emissions with no TFA loss in low-rainfall regions; in this instance, concentrations range between 50 and 200 mg L−1, resulting in reduced risk quotients of 5–20 [28]. This was conducted using toxicological data from Berends et al. [59] and Hanson et al. [61,73].
Overall, Russell et al. reported that it is unlikely that increased TFA contamination will impair aquatic systems given the relative insensitivity of relevant organisms to TFA [28]. Similar results emerged from additional studies relating to rainwater and surface waters [37,39,87,88]; in all examples, modelled TFA proved to be below the ‘no observed effect concentration’ reported by Berends et al. [55].
4. Sources and Removal
There are a wide variety of recognized anthropogenic sources of TFA in the environment. Recently, however, controversy has arisen over proposed natural sources of TFA. Some argue that TFA emissions derive solely from anthropogenic sources, whereas others dispute this claim. Here, we summarize the literature available so far on this debate and other reported sources of TFA.
4.1. Anthropogenic Sources of TFA
In contrast to the ongoing debate surrounding natural sources of TFA, the existence of anthropogenic sources is well established. TFA may emerge in the environment via either direct emission or as a result of the degradation of precursors. Many sources may act as both a primary point source and as a secondary source. For example, TFA is widely used in industrial organic synthesis, notably in the early stages of syntheses of many fluorinated organic compounds [89,90]. Via this route, TFA may be directly released into the environment as a result of fugitive emissions or in wastewater discharge [91]. Such point sources have been shown to significantly elevate TFA concentrations in surface water, river water, outdoor dust, and soils [66,89,91] in close proximity to the source and, in one case, at a considerable distance from it [91]. Additionally, many precursor molecules are often released at the same source, providing an additional route for TFA contamination via degradation. For instance, Lv et al. [92] support the idea that heterogeneous oxidation of FOSA (perfluorooctane sulfonamide), a synthetic compound, at the surface of natural clay minerals may act as an important source of TFA.
Secondary sources of TFA are numerous, with over 2000 chemicals reported to form TFA in the environment [93,94]. Of these chemicals, fluorochemical pesticides, that is those containing the C-CF3 moiety, are expected to contribute significantly [95]. Another known indirect source of TFA is the thermolysis of fluoropolymer products during their use or incineration [52,96,97,98,99]. Ellis et al. [52] reported a thorough degradation mechanism for the thermolysis of fluoropolymers such as PTFE (polytetrafluoroethylene), CPTFE (chloropolytrifluoroethylene), ECTFE (ethylene-chlorotrifluoroethylene), and PFEPE, (polytetrafluoroethylene-co-tetrafluoroethylene-perfluoropropylether). Their findings revealed that the main acids (or their conjugate bases) present in the thermolysis of fluoropolymers and chlorofluoropolymers were TFA and chlorodifluoroacetate, in addition to longer-chain perhalogenated acids that were also detected. A full presentation of the thermal degradation pathways resulting in TFA degradation can be found in Ellis et al. [52] and further mechanistic investigations have been reported elsewhere [100,101,102,103].
Wastewater treatment plants represent significant and concerning primary and secondary sources of TFA release into the aquatic environment given that TFA cannot be removed by typical water treatment methods. There is some uncertainty as to the factors influencing TFA concentrations being eluted from wastewater treatment plants, but it has been suggested that the concentration is primarily determined by the concentration of TFA in local drinking water (see Section 5.6). However, this may not be true for wastewater treatment plants with high inflows of industrial wastewater [42].
Furthermore, TFA may be generated as a degradation product during water treatment processes designed to remove longer-chain PFASs [103,104]. As PFAS remediation technologies continue to gain widespread commercial application, the subsequent formation of TFA has the potential to become a noteworthy secondary source, with wastewater treatment plants at the center of this process. This aspect becomes particularly relevant considering the growing emphasis on removing PFAS contamination from drinking water, municipal wastewater, and industrial wastewater [39,42,105,106]. A promising novel method for removal of larger PFASs from water was recently published, demonstrating the mineralization of perfluoroalkyl carboxylic acids under relatively mild conditions. This process involves a cascade of reactions in a dimethyl sulfoxide/water and sodium hydroxide mixture, resulting in the formation of both nonfluorinated molecules and TFA [107]. This route to TFA production is supported by several preceding reports that showed TFA to be a primary degradation product generated during removal treatment of other PFCAs [39,46,105,106]. Consequently, the widespread adoption of such remediation technologies in commercial applications may lead to a significant increase in TFA production, establishing it as a significant secondary source.
The principal anthropogenic source of TFA is reported to be the degradation of gaseous precursors [108,109]. Specifically, the oxidation of next-generation refrigerants is expected to become a major source. Next-generation refrigerants, typically hydrofluoroolefins (HFOs), are increasingly replacing legacy refrigerants, such as chlorofluorocarbons (CFCs), hydrochlorofluorocarbons (HCFCs), and hydrofluorocarbons (HFCs), due to concerns initially relating to ozone depletion and, later, to global warming potential. While this phasing out of legacy refrigerants will likely have significant climate benefits, as HFOs have short atmospheric lifetimes and small GWPs (global-warming potentials) and do not deplete stratospheric ozone [110], they produce much more TFA via oxidative degradation in the atmosphere than their predecessors. Considering a currently used refrigerant (HFC-134a, 1,1,1,2-Tetrafluoroethane) alongside its analogous next-generation HFO refrigerant (HFO-1234yf, 2,3,3,3-Tetrafluoropropene), a significant increase of 21–100% in TFA yield is predicted [53,111]. Additionally, the formation of TFA via HFO degradation also occurs at a much higher rate than that from HFCs. Hence, HFO emission is a much more productive source of TFA and is likely to concentrate TFA production close to the point of emission [57]. Indeed, Behringer et al. estimate a theoretical TFA formation potential from refrigerants and propellants in the EU market of 37,000 tons/year or more if HFO-1234yf continues to be used in automotive air-conditioning systems [94]. Similarly, previous modelling research predicted a significant multiplicative increase in TFA in the event of a full switch from HFC to HFO use under the current emission inventory, as shown in Figure 3 [57].

Figure 3.
Surface distribution plot depicting the multiplicative increase of TFA distributions predicted by changeover from HFC use to HFO use as described by Holland et al. [57]. Reproduced with permission from authors, Copyright © 2021, American Chemical Society.
In an update to the previous work of Holland et al. [57], further model integrations (see Supplementary Text S1 for model description and Figure S1 for more details) have been produced to assess the impact of emerging kinetic data on predictions of the production of TFA from HFOs, using HFO-1234yf as the representative species. More recent values, reported by Orkin et al. and Tokuhashi et al., of k(T) = 4.06 × 10⁻¹³(T/298)1.17e(296/T) cm3 molecule−1 s−1 and 1.54 × 10⁻¹²e(−100/T) cm3 molecule−1 s−1, respectively, were used in further integrations [112,113]. In the original model study [54], the temperature-dependent rate coefficient for HFO-1234yf oxidation by OH used was k(T) = 1.26 × 10⁻¹²e(−35/T) cm3 molecule−1 s−1, with this value taken from Papadimitriou et al. [110]. The temperature dependencies of the rate coefficients arising from these different parametrizations are compared in Figure 4.
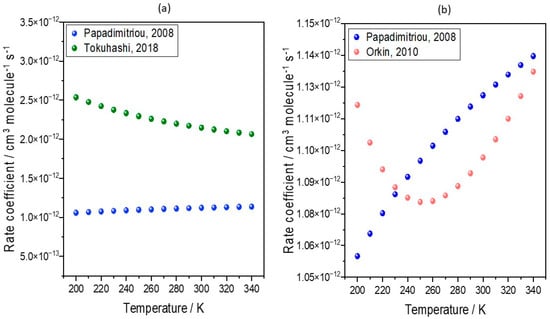
Figure 4.
Temperature dependence of the rate coefficients for the reaction of HFO-1234yf with OH. The plots show values derived from parametrizations of k(T) used by (a) Tokuhashi, 2018 (green circles) [113] and (b) Orkin, 2010 [112] (red circles), and in both cases these are compared to values used in previous model simulations using the values of Papadimitriou, 2008 [110] (blue circles).
Figure 4a shows that across the temperature range of the troposphere, the rate co-efficient derived by Tokuhashi et al. [113] (referred to as Tokuhashi, 2018) is smaller than that derived from the study of Papadimitriou et al. [110] (referred to as Papadimitriou, 2008). Therefore, we should expect the decreased removal of HFO-1234yf by OH radical oxidation, lower TFA atmospheric concentrations, and decreased surface levels. Similarly, the rate coefficient derived by Orkin et al. [112] (Orkin, 2010) is smaller than that of Papadimitriou, 2008 [110], being down at about 230 K. Therefore, we should expect the HFO to be removed more slowly and the TFA production to be lower. Indeed, this is seen in Figure 5b,d, with decreases ranging from 0 to 25% and with larger decreases seen in the research of Tokuhashi, 2018. This modelling analysis demonstrates that even small variations in kinetic determinations of the rate constants for the reaction of HFOs with the OH radical can lead to non-negligible differences in predicted TFA surface concentrations. These different gas-phase kinetic analyses may not significantly alter the overall lifetime of HFOs, and therefore also parameters such as GWP, but may make a more profound difference to the surface concentrations of TFA (see Supplementary Text S2, Tables S1 and S2). Hence, further kinetic studies are needed to achieve a clear consensus in the literature if we are to accurately predict current and future trends in TFA loadings with increases in HFO use. A short kinetic review of HFO is shown in Supplementary Text S3. Additionally, if such a consensus is achieved, previously reported assessments [53,57] of the likely impact of a switch from previously used HFC refrigerants to HFO use should be repeated with updated kinetic data.
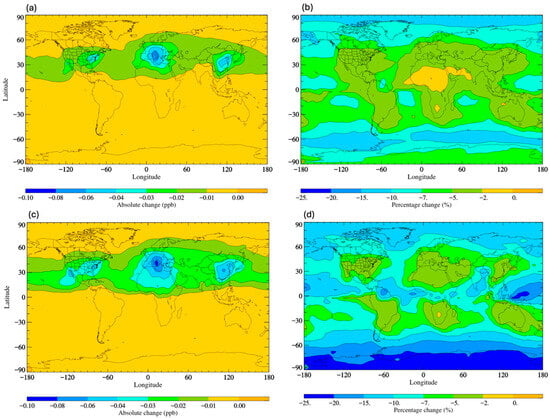
Figure 5.
Surface distribution plot depicting the (a) absolute and (b) percentage changes in TFA surface concentrations following implementation of kinetic data of Orkin, 2010 [112] and the (c) absolute and (d) percentage change in TFA surface concentrations following implementation of kinetic data of Tokuhashi, 2018 [113]. In all cases, the comparisons are made to the data in Figure 3 and calculated using kinetic data of Papadimitriou, 2008 [110].
Given the concern surrounding increasing sources of TFA release into the atmosphere and wider environment, the oxidative breakdown of HFOs has been considered for inclusion in amendments to the Montreal Protocol, which has driven the evolution of refrigerants towards more ‘environmentally friendly’ options. Despite this concern about HFO use, other sources of TFA that fall under the purview of the Montreal protocol may be more important but less well understood [78]. These sources include fugitive emissions from landfills, transfer stations, and incinerators.
4.2. Natural Sources of TFA
Evidence is presented for natural sources of TFA in various analytical and environmental studies. For example, TFA concentration measurements in leaves reported by Freeling et al. predate the use of HFC refrigerants, which could support a biogenic source of TFA [44]. Von Sydow et al. found TFA concentrations ranging from 6 to 56 ng L−1 in 190-year-old Antarctic ferns, and 5 ng L−1 concentrations in glacier ice from Sweden [40]. This led them to conclude that a natural source of TFA must exist. However, the possibility of TFA contamination of the older layers of glacier ice by meltwater from the most recent ones was not dismissed. A number of natural sources have been proposed. For example, Harnisch et al. posited that accessory fluorite in granite is a natural source of TFA [114]. Terrestrial invertebrates have also been suggested as TFA sources, with Zhao et al. reporting TFA as a major biotransformation product of earthworms [115].
Additionally, several reports argue in favor of a significant oceanic source of TFA [116,117,118]. A recent inventory of TFA emissions from 1930 to 1999 suggests that the TFA emissions measured in the oceans in the period of 1998–2002 must have included a large natural burden [117]. Lindley et al. based this conclusion on the high TFA concentration of 160 ng L−1 found in the deep Arctic Ocean in waters, with a reported 14C age of about 1000 years [116], and a different study concluded that the waters have a comparably high average age of perhaps 400 years [118].
Conversely, Nielsen et al. [119] reported very low concentrations (below MDL of 2 ng L−1) of TFA in ancient, pre-industrial (>2000 years old) freshwater samples from Greenland and Denmark, suggesting no significant natural sources. Similarly, Berg et al. used 15,000-year-old groundwater as a method blank for their measurement of TFA in rainwater and surface waters and did not observe TFA above the detection limit of 5 ng L−1 [39]. More recently, Joudan et al. [120] asserted that there is insufficient evidence for a natural source of TFA; the origins of the arguments for a natural TFA source are largely based on the observation of TFA in pre-industrial samples, but the authors argue that no studies as yet present a plausible mechanism for the formation of TFA from natural sources.
4.3. Atmospheric Fate of TFA
TFA demonstrates exceptional stability across different environments, which is primarily attributed to its structural characteristics. It is not photochemically activated at the wavelengths of solar radiation that reach the troposphere. In the absence of any abstractable H atoms, it is resistant to chemical degradation by hydrogen abstraction reactions, and the carbon–fluorine bonds are chemically inactive. Consequently, TFA exhibits a slow rate of degradation in the environment. This stability is particularly evident in the atmosphere, where TFA remains chemically intact across significant time periods, even in the presence of sunlight and OH radicals [121]. The result is a considerable atmospheric lifetime, reported to be up to 230 days, with respect to oxidation by OH [122,123,124]. Of course, this lifetime will see significant variation on a seasonal scale, and so the values reported here represent global average values.
Therefore, OH-mediated oxidation is of little importance in determining the dominant fate of TFA in the atmosphere, and physical loss processes must instead be considered. The atmospheric lifetimes of TFA with regard to dry and wet deposition have been reported to be between 10 and 30 days, and between 3 and 15 days, respectively [122,123,125,126]. Given its high solubility, its polarity and its Henry’s Law constant, its dominant removal process from the atmosphere is wet deposition, as is reflected in the shorter atmospheric lifetime associated with this loss process [49]. Wet deposition to the Earth’s surface is also likely to be a significant mechanism for the dispersal of TFA to the wider environment.
Although TFA cannot be removed through the common photochemical reactions initiated by OH, ozone, or NO3 that occur in the atmosphere, a recent report suggests the consideration of previously ignored oxidants, Criegee intermediates, which may reduce the atmospheric lifetime significantly [57]. Chhantyal-Pun et al. [127] determined the rate coefficients for the gas-phase reaction of TFA with two Criegee intermediates, formaldehyde oxide (CH2OO) and acetone oxide ((CH3)2COO), as k(CH2OO + CF3COOH) = 3.4 ± 0.3 × 10⁻¹⁰ cm3 s−1 and k((CH3)2COO + CF3COOH) = 6.1 ± 0.2 × 10⁻¹⁰ cm3 s−1, respectively at 294 K. Using the global chemistry and transport model, STOCHEM-CRI, the lifetime of TFA was calculated to be between 5 and 9 days with respect to atmospheric oxidation by OH and the deposition losses described previously. However, including the TFA loss by reaction with Criegee intermediates in the model reduced the lifetime of TFA to as little as 2 days over tropical regions, as shown in Figure 6 [57]. In view of this update, chemical loss may compete with physical loss (i.e., wet deposition) in some regions. However, the fates of the hydroperoxyester adducts formed by Criegee intermediate reactions with TFA were not determined. These adducts may condense into secondary organic aerosols, or instead may decompose (e.g., by hydrolysis) to re-release TFA instead of representing a true loss mechanism, with consequences for how atmospheric TFA is redistributed in the environment.
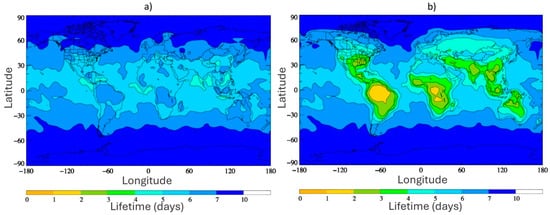
Figure 6.
Global annual surface level distribution plots depicting the lifetime of TFA with respect to (a) OH removal and deposition processes only, and (b) OH removal, deposition processes, and removal by SCIs, as reported in Holland et al. [57]. Reproduced with permission from authors, Copyright © 2021, American Chemical Society.
Combining the different loss processes allows for the determination of an overall lifetime of TFA in the atmosphere. This lifetime has been estimated to be between 5 and 10 days [57]. Loss via the deposition of TFA from the atmosphere is an important secondary source of TFA addition to the wider environment; hence, many investigations have been carried out to elucidate the impact of greater atmospheric TFA burdens due to the increasing use of next-generation refrigerants, HFOs, as discussed previously. One modelling study estimated that a complete replacement of legacy refrigerants with HFOs would result in an annual TFA wet deposition of 160–240 μg m−2 in continental North America [53]. These estimates are higher than the cumulative deposition obtained from ice core measurements during the last decade on record (between 2005 and 2016) [43]. Pickard et al. report that deposition of TFA to the Arctic is expected to increase with greater use of HFOs [43].
4.4. Removal of TFA from the Environment
As discussed previously, the stability of TFA makes it persist in the environment, for example in aqueous systems under ambient conditions. Generally, conventional water treatments are not effective for TFA removal or breakdown. Neither thermal degradation nor photodegradation will promote a significant removal of TFA [128]. Additionally, poor or null degradation was reported by biodegradation [29,129], ozonation [130], and chlorination [91]. Activated carbon filtration is not a suitable treatment option for TFA removal, neither for drinking water services nor when activated carbon is used in wastewater treatment plants [91]. One experimental study proposed that anoxic sediment samples could reductively degrade TFA [131]. However, subsequent studies using samples from similar areas failed to reproduce these results [132].
Treatment options for the effective removal of TFA can be found in the literature. However, a recurring issue is that the efficiency of these processes is insufficient to serve as a viable solution for TFA accumulation in large water bodies. For instance, reverse osmosis is proven to be effective in removing TFA from wastewater, but fails in terms of selectivity for TFA over divalent ions [91]. The effective degradation of TFA was achieved via its reaction with sulphate radicals [106], although this process had a significant energy demand and was slow. Another promising removal technique involves the homogeneous photocatalytic decomposition of TFA, with fluoride (F−) and CO2 released as final products [133]. Even though this process can decompose TFA at high concentrations, the critical conditions involved are not yet applicable to large-scale water treatment. In addition, ion exchange achieves the partial removal of TFA [91,134]. However, a more thorough evaluation surrounding economic and ecological concerns is required.
Recently, the use of adsorbent materials for targeted TFA removal has shown promising results. Zhou et al. [134]. successfully removed TFA from different aqueous matrices by employing the adsorption power of surface-defunctionalized activated carbon felt, followed by in situ electro-assisted desorption, with recovery rates higher than 90%. The small-scale flow cell experiments demonstrated significant TFA enrichment factors, reaching up to 7.5. These encouraging outcomes justify further studies on larger-scale units [134]. Additionally, waste organic acid treatment with polyethyleneimine-grafted polystyrene resin shows promising potential for the absorptive remediation of TFA, among other concerning common organic acids [135]. This methodology may represent the basis for emergent research and technologies aimed at tackling the practicality of the large-scale remediation of TFA and other environmentally concerning organic acids.
5. Measurements
TFA has been detected and quantified using diverse testing methods, with samples taken from, for example, environmental and biological media [63], as well as different food products [70,136]. Regardless of the type of sample analyzed, a common factor has been the notable increase in TFA concentration over the past few decades [36,44,137,138,139,140,141,142,143,144]. A full review of TFA measurement techniques and challenges can be found in Bjornsdotter et al. [145]. Here, we summarize reported observations.
5.1. TFA in Air
Annual studies of TFA concentrations in a heavily urbanized area of China’s capital city, Beijing, conducted from May 2012 to April 2013 and from April 2013 to April 2014, reported TFA concentrations of 1580 ± 558 pg m−3 and 1459 ± 223 pg m−3, respectively [137,146], (Table 3). Similar levels were reported in Japan in 2020 (1570 ± 2750 pg m−3) [147]. These values are significantly higher than the average levels reported in previous years, such as in Zurich (Switzerland) in 1995, Freiburg (Germany) in 1995, Mamelodi (South Africa) in 1996, and Guelph and Toronto (Canada) in 2000, which had values of 65, 44, 40, and 760 pg m−3, respectively [148,149,150].
Table 3.
Summary of TFA concentration in air.
Consistent with the previous atmospheric TFA concentrations reported in Beijing [137,146], an analysis conducted by Zhang et al. [151] using data from April 2013 to April 2016 revealed that the concentration of TFA in the atmosphere varied greatly on a monthly basis and showed noticeable seasonal changes. Hu et al. [138] reported measurements of atmospheric TFA concentrations spanning 501–7447 pg m–3, with an average concentration of 2593 pg m–3, at Peking University, Beijing, in 2012. The concentrations of TFA in Beijing collected in spring and summer were found to be significantly higher than in fall and winter, indicating that temperature plays a significant role in its formation. For example, high temperatures may lead to greater generation of TFA through the volatilization of known short-lived fluorocarbon precursors.
Measured TFA concentrations in gas and particle phases showed an average of 3550 ± 1733 pg m−3 and 134 ± 48 pg m−3, respectively, at Jinan, China, during April 2016 [89]. Similar to the studies by Hu et al. [138] and Guo et al. [146], concentrations of gaseous TFA were significantly higher than those of particulates, and the gas-particle partition coefficient of TFA decreased with increasing air temperature. Xie et al. also showed diurnal variation in atmospheric TFA, with higher levels seen during the daytime (gas + particle = 4251 ± 183 pg m−3) compared with nighttime (3118 ± 1521 pg m−3) [89]. This variation can be explained by the strong daytime solar radiation leading to secondary transformation of precursors driven by photochemically derived oxidants such as the hydroxyl radical [152,153]. This diurnal study is consistent with the study of Wu et al. who observed very low and very high concentrations of TFA at nighttime and daytime, respectively [137]. Experiments conducted above the Bohai and Yellow Seas in China during June–July 2016 highlight the relevance of the area chosen for sampling, as the air above the two seas showed 17 times lower TFA concentrations than those reported for the Chinese mainland [154].
5.2. TFA in Rainfall
Precipitation, or wet deposition, is commonly recognized as the primary contributor of short-chain PFCAs to the surface environment. The concentration of TFA in rainwater varies significantly depending on the location [29]. Additionally, studies have shown that TFA concentrations fluctuate during a period of rainfall, with the highest levels observed at the start of the event because of the high solubility of TFA in water and its rapid partitioning into air and water [39]. Furthermore, TFA consistently displays higher concentrations compared with other targeted PFCA homologues [139]. This prevalence of TFA in precipitation aligns with previous studies [139,140,155].
Measurements conducted in California and Nevada during 1994–1996 and 1996–1997 showed TFA concentrations in fog and rain ranging over 31–3779 ng L−1 and 20.7–1530 ng L−1, respectively, with significantly higher concentrations in fog water compared with rain water [36,141], (Table 4). Subsequent measurements conducted over a decade later in the Midwest region of the country, particularly in the states of Ohio and Indiana, revealed that TFA emerged as the predominant compound across a set of recorded PFAS data, comprising approximately 90% of the detected concentrations ranging from 50 to 850 ng−1 [155].
Between 2002 and 2004, measurements conducted in Canada revealed fluctuating concentrations of 4–100, 8–220, and 5–140 ng L−1 at various isolated sites. In contrast, urban sites in the southern regions of the country reported elevated values of 43–170 and 87–270 ng L−1 [140]. Similarly, in China, TFA rainwater concentrations ranged from 46–974 ng L−1 in 2007–2008 for samples collected from the Pearl River Delta [36,141,142]. Later measurements, taken in city locations in 2016, showed significantly elevated TFA rainfall concentrations between 8.8 and 1.8 × 10³ ng L−1 [36,139,141,142]. Comparable values were reported in one-day studies in Tsukuba and Kawaguchi, two cities in Japan, with detected levels of TFA in rainwater ranging from 39 to 76 ng L−1 [156]. Another study reported that concentrations of TFA in rainwater from Chile, Malawi, and Canada exhibited levels of 6–87, 4–15, and <0.5–350 ng L−1, respectively [157], with the latter value showing an increase compared with measurements taken a year prior [140].
There have not been many long-term or multi-site studies of TFA precipitation concentrations. However, a fairly comprehensive assessment of the occurrence of TFA in rainwater in Germany has been conducted by Freeling et al. [158]. In 2018–2019, close to 1200 samples were collected across 12 months in 8 locations. A median concentration of 0.21 mg L−1 was reported in the study [158]. Freeling et al. also reported a marked seasonality of TFA concentrations in rainwater, with a higher level of loading seen in the summer, leading to enhanced deposition and environmental contamination during this time. More studies such as this would significantly improve the understanding of localized and seasonal TFA occurrence in rainwater and therefore begin to further elucidate the flux of TFA from the atmosphere to the surface.
Table 4.
Summary of TFA concentration in rainwater.
Table 4.
Summary of TFA concentration in rainwater.
| Location | Date of Sample | Concentration [ng L−1] |
|---|---|---|
| California and Nevada, United States | 1994–1996 | 31–3779 [141] |
| 1996–1997 | 20.7–1530 [157] | |
| Chile | 1999 | 6–87 [157] |
| Malawi | 1999 | 4–15 [157] |
| Canada | 1999 | <0.5–350 [140] |
| Canada | 2002–2004 | 43–270 [140] (near urban) 4–220 [140] (remote) |
| Tsukuba, Japan | 2007 | 64–76 [156] |
| Kawaguchi, Japan | 2007 | 39–65 [156] |
| Pearl river delta, China | 2007–2008 | 46–974 [142] |
| Urban locations in China | 2016 | 8.8–1.8 × 10³ [139] |
| Germany a | 2018–2019 | 210 [158] |
| Ohio–Wyoming region, United States b | 2019 | 50–1200, median 430 [155] 70–170, median 100 [155] 110–1100, median 340 [155] 60–1100, median 370 [155] 80–750, median 200 [155] 4–170, median 80 [155] 270–850, median 470 [155] |
a close to 1200 samples were collected across 12 months in 8 locations, b reported concentration values were measured at Shaker Heights, Willoughby, Wooster, Ashland, Rockford, Whitestown, and Jackson Hole, USA, respectively.
In the existing literature, studies conducted between 1990 and 2016 on remote Arctic ice cores reveal TFA deposition levels exceeding 100 μg m−2 [43], as well as a flux ranging from 2.5 to 8200 ng m−2 yr−1, from 2006 to 2019 [159]. The amplitude of the median flux is highly seasonally dependent; for instance, the TFA levels were 36 times higher during precipitation event sampling in April–August 2019 compared with sampling in January–March 2019. The authors linked these results with seasonal variations in atmospheric hydroxyl radical concentrations and/or the variable contributions of sources that may have emerged during testing [159].
This is one of the leading routes of TFA contamination of the surface environment, revealing that the role of precipitation in distributing TFA to land or surface water is of paramount importance to identifying areas of particular significance. Such areas are important locations for monitoring in the future.
5.3. TFA in Surface Water
Surface waters are the predominant environmental sink for TFA. TFA has the potential to accumulate in natural water bodies through precipitation and influent water if the water bodies have little or no effluent losses via drainage or groundwater recharge [28,29,125]. These terminal water bodies are potentially subject to concentration enhancement over time due to evaporation, which serves to remove water while retaining less volatile chemicals like TFA.
Similarly to rainwater, the levels of TFA found in surface waters have also been shown to vary significantly depending on the location, (Table 5). In remote bodies of water, TFA has been measured at concentrations of 5 to 600 ng L−1 [91,94,160]. For example, in 1998, remote sites in the Northern Hemisphere recorded surface water TFA concentrations ranging from 8 to 40 ng L−1 (Yukon and Alaska) and from 21 to 63 ng L−1 (British Columbia) [161]. Another study reported considerably elevated TFA concentrations in the surface waters of Lake Malawi. These were in the range of 55–99 ng L−1 in samples collected in 1998 and 2000 [91,94,160]. Similarly, values recorded in urban areas of Northern California were elevated to 5–300 ng L−1 [30]. Furthermore, an extension of this latter study reported an on-average 6-fold increase in TFA concentrations when re-sampling the same sites 23 years later [160]. Measurements taken from lakes in Beijing, China, (2001 and 2012) reported TFA concentrations in the range of 345–828 ng L−1, with an average 17-fold increase in surface water over ten years [143].
Table 5.
Summary of TFA concentration in surface fresh water.
Xie et al. found variable concentrations of TFA in flowing water bodies, landscape water bodies, tap water, and well water in Jinan, the capital of Shandong province of Eastern China, in 2016 [89]. In the study, the average TFA concentrations of 884 ± 180 ng L−1 in flowing water bodies were found to be significantly lower than those found in landscape water bodies 2265 ± 277 ng L−1, suggesting the accumulation of TFA in stagnant water bodies. However, the average TFA concentrations in rivers detected in their study are 2 to 3 times higher than those found in tap water (384 ± 7 ng L−1) and well water (319 ± 8 ng L−1) [89]. In surface water taken from streams in Sweden, TFA was detected at concentrations ranging from 30 to 820 ng L−1, while a value of 34 ± 5.2 ng L−1 was reported following analysis performed in a nearby lake (with a reported annual increase of over 5%, equivalent to 150 kg) [162]. Industrial activities and poor waste disposal could contribute to higher TFA concentrations in rivers and lakes. Indeed, another study found that TFA contaminant fingerprints were linked to surrounding anthropogenic activities [163].
Increased surface water sampling campaigns can assist in the identification of localized pollution events and sources. Furthermore, water bodies are likely to be the habitats most ‘at risk’ of significant TFA contamination due to long-term accumulation, in addition to likely increases in the atmospheric sources, as discussed previously. This is particularly true for stagnant water bodies. As such, monitoring is increasingly important.
5.4. TFA in Soils and Vegetation
TFA exhibits a stronger attraction to organic soils compared with mineral soils, as reported by Richey et al. [164]. Therefore, the soil retention of this compound can be notably reduced as the volume of inorganic anions increases owing to the polar characteristics of TFA [164]. Between 1999 and 2000, a study aimed to explore the distribution of TFA in soil samples from the Northern and Southern Hemispheres. The study included soil samples from various countries: Canada, Malawi, Chile, and the UK. The concentration values for TFA in these samples showed ranges, in ng g−1 units, of <0.1–3.3, <0.1–7.5, 0.1–9.4, and 0.85–7.0, respectively [157]. These values are similar to those found in Chinese soil samples, ranging from 2.1 to 2.6 ng g−1 [165] and 0.034 to 2.081 ng g−1 [89]. Xie et al. [89] found higher TFA concentrations in the soil around fluorochemical plants than that at a background site, suggesting that industrial production resulted in significant TFA contamination of the surrounding soil environment, or that TFA may accumulate in soil. Similarly, a more recent study conducted near an oil refinery in China showed significantly elevated upper limits of TFA concentration, compared to other studies listed here, which could further support the theory of TFA accumulation in soil [166], (Table 6).
Table 6.
Summary of TFA concentration in soils.
The presumed primary uptake pathway of PFASs, including TFA, by plants is through absorption via roots from the soil or pore water. Hence, soil contamination may result in increased TFA concentrations in the affected vegetation [4,136]. An additional proposed route, that plant leaves can absorb different contaminants from the atmosphere [67,167], could also contribute to this. Atmospheric uptake is thought to occur via one of two main pathways: first, by directly absorbing gas-phase chemicals from the surrounding air, and second, by absorbing chemicals associated with atmospheric particulate matter through mass exchange [67,167]. Interestingly, Freeling et. al. [44] recently established that the physicochemical properties of TFA are favorable to its accumulation in vascular plants. Furthermore, as in other environmental media, there is also the potential for longer-chain PFASs to undergo biotransformation in plants to generate TFA in situ [168].
Despite variations in the contamination mechanisms, TFA has been measured in vegetation in a number of locations. For example, Scott et al. investigated the TFA distribution in pine needle samples collected from both the Southern and Northern Hemispheres and revealed that TFA levels were elevated in the Northern Hemisphere [157]. Furthermore, an altitudinal transect showed a decreasing concentration trend in TFA concentrations with increasing altitude [157]. Additional TFA concentrations were reported for a number of vegetative species by Freeling et. al. [44] as follows: 24.6–312 μg kg−1 in European beech leaf samples; 156–1060 μg kg−1 in Lombardy poplar leaf samples; 42.8–538 μg kg−1 in Norway spruce leaf samples; and 98.5–453 μg kg−1 in Scots pine leaf samples, (Table 7). Such measurements are comparable with the results of similar studies across the world, where values between 280 and 3000 μg kg−1 were reported [67,70].
Table 7.
Summary of TFA concentration in vegetation.
These TFA concentrations in vegetation have also been shown to be increasing. Freeling et. al. [44] reported a significantly increasing trend, between 1989 and 2020, in the TFA concentration for most of the species and sites sampled around Germany as a result of both bioaccumulation and the growing emissions of gaseous TFA precursors over the last three decades. The predominant source of TFA to the plants studied was concluded to be atmospheric deposition, resulting in ubiquitous TFA contamination of terrestrial ecosystems, even at remote locations [44].
5.5. TFA in Ice and Snow
TFA has been found ubiquitously in surface snow in the Arctic, with concentrations ranging from 22 to 1800 ng m−2 in 2019 measurements [169]. Furthermore, Hartz et al. [169] reported that TFA accounted for 71% of the total mass of C2–C11 PFCAs in the ice core [159]. The TFA concentrations in snow samples taken from remote areas in California were found to be in the range of 51–584 ng L−1 [141], while measurements of snow samples from Canada, Sweden, New Zealand, and East Antarctica revealed an elevated maximum of 1100 ng L−1 TFA [40]. In a study of a firm core drilled in Antarctica, concentrations of 3–56 ng L−1 TFA were found in layers formed during the 19th century [40].
Consistent with other measurements of TFA contamination summarized here, further reports have confirmed the trend of the increasing concentration of TFA in snow samples collected from China [143,144]. This analysis of snow has revealed a noteworthy escalation over a ten-year span, with levels varying from 148–169 ng L−1 in 2001–2002 [144] to 282 ± 68 ng L−1 in 2012 [143,144].
5.6. TFA in Dust and Sediment
Recent studies have attempted to quantify TFA in other environmental media, such as dust. For example, Wang et al. conducted an extensive investigation of indoor and outdoor dust samples across mainland China to quantify the presence of multiple PFASs [170]. The results revealed that the median concentration of PFASs in outdoor dust tripled in 2017 compared with the levels found in 2013, with a heightened contribution from TFA. Over the course of four years, the median contributions of TFA profiles increased from 29–66% to 47–87% [170]. Similar results were obtained during a study in the USA, where TFA was found to be one of the most abundant PFASs in indoor dust [82]. Notably, ultra-short-chain PFCAs (C2 and C3) exhibited significantly higher levels in indoor dust than in outdoor dust, suggesting the presence of PFAS emission sources within indoor environments. A similar conclusion, highlighting higher levels of PFASs in indoor environments compared with outdoor settings, was also drawn from studies involving indoor airborne particulate matter in five cities of China [171], as well as air samples from Birmingham, UK, [172] and Brno, Czech Republic [171,173].
Another noteworthy finding is the correlation observed between the distribution of various PFCA and PFAS levels in indoor dust samples and the regional economic status. Elevated levels of TFA were detected in regions experiencing rapid economic development. Nevertheless, comparable outcomes were identified in the profiles of indoor and outdoor dust samples between urban and rural areas [170].
Recently, the presence of TFA has been reported for the first time in sediment and suspended solid samples from water bodies in Northern Germany [174]. TFA was the most frequently detected PFAS, occurring at a prevalence of 64%, with concentrations ranging from 0.9 to 5.1 μg kg−1. While such investigations are still in their early stages, the study by Guckert et al. using TOP assay analysis suggests the potential existence of TFA precursors in numerous sediments [174]. This finding highlights the significance of considering sediment samples as a potential source of TFA, a notion only now being explored. Whether the detection of TFA can be attributed to the presence of residual water in the pores of the samples before the drying process, or to the sediment itself, remains to be clarified [174].
5.7. TFA in Drinking Water and Other Consumables
Other than direct inhalation, a clear route for human exposure to TFA is via drinking water and other contaminated consumables, (Table 8). The analysis of drinking water samples has indicated a broad spectrum of TFA concentrations when measurements have been taken. For example, in Germany (2020), TFA concentrations in drinking water were reported to range from 0.96 to 12.4 μg L−1 [175]. Much lower concentrations were reported in drinking water from Beijing in 2012 (155 ng L−1) [143]. In both instances, water samples were taken from water treatment plants. Furthermore, a recent study of concentrations and profiles of target PFAS in raw and treated water carried out in China has shown that the current estimated concentration of TFA is lower than that previously reported in 2012 [25], suggesting that levels recently reported in Germany are significantly elevated.
Similarly, TFA is reportedly the most abundant PFAS in both untreated water and drinking water in the Netherlands, with median concentrations ranging between 33.56 and 1104.6 ng L−1 [176]. The authors of this study suggest groundwater protection to protect drinking water from contamination. In this regard, Germany has been a pioneer in the formulation of regulations for TFA levels in drinking water, having instituted a maximum permissible limit of 60 μg/L for this consumable [177].
A recent investigation of the TFA contamination of beer and tea found it to be widespread [178]. TFA was detected up to concentrations of 51 μg L−1 and 2.4 μg L−1 in beer and tea, respectively [178]. The authors concluded that applied water is not the source of TFA contamination, instead suggesting the influence of the added malt on beer. These concentrations are significantly higher than some of the concentrations measured for drinking water presented previously, supporting this conclusion.
In the context of food contamination, a study conducted in PFAS-contaminated agricultural fields revealed consistently high concentrations of TFA across various crop samples [136]. Notably, wheat grain exhibited quantified levels ranging from approximately 50 to 180 µg kg−1, while maize grain and leaves displayed values ranging from around 50 to 100 µg kg −1 and from approximately 250 to 500 µg kg−1, respectively. Furthermore, elevated levels of TFA were detected in Jerusalem artichoke and ryegrass, with concentrations ranging from 150 to 200 µg kg−1 for the former and 120 to 180 µg kg−1 for the latter [136]. Similarly, in an agricultural environment located in northern China, researchers discovered elevated concentrations of TFA in various matrices [70]. The 2016/2017 sampling campaign demonstrated that as well as being found in soil, TFA was found at elevated levels in maize straw, leaves, and kernels (11.8–149 ng g−1, up to 767 ng g−1, and 15.8–102 ng g−1, respectively) [70]. A large range of concentrations, 14.2–105 ng g−1, was also reported in oriental migratory locust (Locusta migratoria manilens) samples [70]. These results indicate the potential for TFA to accumulate in different organisms.
Table 8.
Summary of TFA concentration in consumables.
Table 8.
Summary of TFA concentration in consumables.
| Consumable | Type of Sample | Location | Date of Sampling | Concentration |
|---|---|---|---|---|
| Drinking water | Water treatment | Beijing | 2002 | Not detectable [25] |
| 2012 | 155 ng L−1 [143] | |||
| 2019 | <7.53–78.7 g L−1 [25] | |||
| Water treatment | Germany | 2020 | 0.9–12.4 μg L−1 [175] | |
| Tap water | Netherlands | 2021 | 33.56–1104.6 ng L−1 [176] | |
| Tap water | Indiana, USA | 2020 | median 79 ng L−1 [82] | |
| Beer | Commercial beer | Germany, UK, Netherlands, Greece, USA, New Zealand, Spain, Denmark, Norway, Italy, Belgium, Austria, Sweden, Japan, France, Estonia, Ireland, Portugal, Mexico, Namibia, Australia, Faroe Islands | - | <51 μg L−1, median 6.1 [178] |
| Tea/herbal infusion | Commercial samples | Not specified | - | 2.4 μg L−1 [178] |
| Wheat | Grain | Agricultural fields, Germany | - | 50–180 μg kg−1 [136] |
| Maize | Leaves | Agricultural fields, Germany | - | 250–500 μg kg−1 [136] |
| Beijing, Tianjin and Hebei, Northern China | 2016–2017 | >767 ng g−1 [70] | ||
| Straw | 2016–2017 | 11.8–149 ng g−1 [70] | ||
| Grain | Agricultural fields, Germany | - | 50–180 μg kg−1 [136] | |
| Beijing, Tianjin and Hebei, Northern China | 2016–2017 | 15.8–102 ng g−1 [70] | ||
| Jerusalem Artichoke | Root | Agricultural fields, Germany | - | 150–200 μg kg−1 [136] |
| Ryegrass | Grain | Agricultural fields, Germany | - | 120–180 μg kg−1 [136] |
| Locusta migratoria manilens | Insect | Beijing, Tianjin and Hebei, Northern China | 2016–2017 | 14.2–105 ng g−1 [70] |
6. Future Prospects
Further research is required to quantify the amounts of TFA used globally, any other currently unidentified sources of TFA in the environment, and the cycle of TFA in the atmosphere and hydrosphere. Solomon et al. found the risk to marine life to be low for current and predicted concentrations of TFA [30]. However, there is a knowledge gap that needs to be addressed before we can conclude that TFA will have negligible effects on the environment. The increasing use of compounds that degrade to TFA requires continued monitoring to ensure that concentrations do not exceed what are currently judged to be safe levels. Furthermore, some measurements only consider the concentration once eventual dilution in the ocean has been achieved. The implications of TFA deposits being concentrated over specific regions must be considered, and TFA concentrations should therefore be monitored on a smaller scale [39,179]. Improved monitoring data will ensure that smaller water bodies are not at risk, something that could otherwise potentially harm marine life, plants, and humans in the long term.
Although TFA as a pollutant has attracted increasing attention in recent decades, and many studies confirm trends of growing levels, there remain gaps in understanding the toxicity data for TFA, the effects of chronic TFA exposure, and their impacts on the wider environments including plants, animals, and humans. Information is limited on toxicity to organisms found in surface waters, which needs to be explored as water bodies are the most important terminal sinks for TFA. There are few studies on TFA concentrations in air, groundwater, soil, rainfall, snow, or sediments, and very few measurements of the concentrations of TFA in crops have been reported. As crops are consumed by humans and used as livestock feed, it is important to measure and report TFA contamination levels so that people can be better aware of the intake of TFA into their bodies.
Industrial sources of TFA and TFA formed from the ozonation of wastewater species can affect downstream areas, which is a concern for drinking water supplies. The standard ozonation and filtration processes commonly used to treat water are not able to remove TFA [91]. The development and implementation of new methods for the efficient removal of TFA from drinking water on a large scale is a priority.
An in-depth analysis of the consequences of phasing out HFC use and replacing HFCs by HFOs is urgently needed because of the expected significant increases in the overall formation of TFA globally and the concentration of those increases near to source regions. Future increases in the emissions of HFO-1234yf as a direct substitute for HFC-134a, for example, is likely to result in a significantly greater TFA burden near to the source region [54]. Thee close monitoring and recording of the future emissions of HFOs are important to tracking the TFA burden and its impact on aquatic ecosystems.
Establishing maximum exposure limits for TFA in both marine and terrestrial organisms remains a pressing issue in terms of determining chronic and acute effects on wildlife. The removal of precursor species that lead to TFA production from use in, for example, refrigeration is a clear way to alleviate the potential problem.
7. Conclusions
Trifluoroacetic acid and its conjugate base trifluoroacetate are highly soluble and have been detected in various environmental settings, including rain, fog, and water bodies, with large reservoirs present in the oceans. These fluorinated organic acid compounds have no known degradation pathways in environmental aqueous phases. There are various anthropogenic sources that lead to the generation of TFA. These sources can have a significant impact on downstream areas, even if they are far away from where any discharge occurs. As TFA is persistent, it can accumulate in remote areas of the planet, such as the North and South polar regions. In addition to anthropogenic sources of TFA, it is important to acknowledge the possibility of natural sources of TFA, several of which have been proposed. Wet deposition is the most substantial loss process of atmospheric TFA by a significant margin, being responsible for approximately 80% of total atmospheric TFA loss. Therefore, it is also the primary route to TFA environmental contamination.
The reported toxicity of TFA is low, with only one aquatic alga presenting a concerning sensitivity to TFA exposure. More generally, the resistance of aquatic plants to the effects of TFA contamination is suggested in several reports. TFA is easily excreted by mammals and so is unlikely to bioaccumulate. Nevertheless, some bioaccumulation of TFA has been reported in the literature. Lan et al. demonstrated the ability of TFA to bioaccumulate in a range of organisms and suggested the use of locusts as a biomonitoring tool for ecological risk assessment [70]. Russell et al. [28] reported that it is unlikely that greater TFA contamination will impair aquatic systems given the relative insensitivity of relevant organisms to TFA. Similar results can be found in additional studies relating to rainwater and surface waters; in all examples, modelled TFA concentrations proved to be below the no observed effect concentration (NOEC) level reported by Berends et al. [59]. Overall, there is a clear need for the development of a quantitative biomonitoring strategy for emerging contaminants such as TFA, and further studies are urgently required.
TFA emerges in the environment via either direct processes, or by the degradation of precursor compounds, and many sources act as both primary and secondary routes to TFA. The principal anthropogenic source of atmospheric TFA is considered to be via the degradation of gaseous precursors. Specifically, the oxidation of next-generation refrigerants is expected to become a major source as HFCs (with high global warming potentials) are phased out and replaced by HFOs. Considering a currently used refrigerant (HFC-134a) alongside its corresponding next-generation HFO refrigerant (HFO-1234yf), a significant increase of 21–100% in TFA yield is predicted [53]. Additionally, the formation of TFA via HFO degradation occurs at a much higher rate than that from HFCs. Hence, HFO emissions are a more productive source of TFA and are likely to concentrate TFA production close to the point of emission of HFOs. Ongoing debate remains about natural sources of TFA, with data suggesting elevated levels in environments that predate significant anthropogenic sources.
TFA degrades slowly in the environment because of its resistance to photochemical and chemical reactions. OH-mediated oxidation only plays a minor role in determining the fate of TFA in the atmosphere; instead, its primary removal route is through wet deposition. Although TFA cannot be removed by the most common photochemical reactions that occur in the atmosphere, a recent report encourages greater consideration of previously ignored oxidants, Criegee intermediates, which may reduce the atmospheric lifetime of TFA significantly. Including TFA loss by reaction with the Criegee intermediates in a model simulation reduces the lifetime of TFA to as little as 2 days over tropical regions [57]. In view of this update, chemical loss should be considered as a potential competitor with physical loss (i.e., wet deposition) over some regions, although more information is needed about the environmental fates of the products of these chemical reactions to assess their impact. The main result of reaction kinetic updates such as these is the redistribution of surface level TFA concentrations based on the varying temperature dependence of reaction rates. With this redistribution comes shifts in the productivity of various TFA loss processes, both chemical and physical.
Overall, the concentrations of TFA in various matrices analyzed to date show strong correlations with both the season during which the measurement was taken and the area that was selected for sampling. It is also apparent that TFA loadings in the environment will continue to increase as a consequence of human activity and that further work is required to quantify these loadings and their potential impact on the environment. Although some technological progress has been made in the development of methods for TFA removal from water, there is still no current method that allows for the efficient remediation of different sources of water contaminated with this persistent organic acid.
In summary, HFOs are being introduced as sustainable alternatives to climate-wrecking HFCs. But the short lifetime of HFOs now introduces a different issue, this being an increase in the surface levels of TFA. Given the potential toxicity of TFA, this is an area of concern; rising levels of TFA have already been observed in regions where HFO emissions have increased and so there is a potential socio-economic issue, e.g., an impact on aquatic animals and flora, and the need to monitor levels of TFA is now pressing.
Supplementary Materials
The following supporting information can be downloaded at: https://www.mdpi.com/article/10.3390/su16062382/s1, Text S1: Model Description; Text S2: Other HFO sources of TFA; Text S3: Short kinetic review of HFOs; Figure S1: Degradation mechanisms of HFC-134a and HFO-1234yf oxidation by OH; Table S1: Kinetic data for the reaction between the HFO and OH radicals; Table S2: Estimated lifetimes for HFOs, GWP and TFA yields.
Author Contributions
All authors contributed to the collation of references and writing of this review. R.H., M.A.H.K. and D.E.S. conducted the model studies and M.d.l.A.G., R.H., M.A.H.K., A.J.O.-E. and D.E.S. contributed to the analysis of model data. All authors have read and agreed to the published version of the manuscript.
Funding
We are grateful to NERC for funding for our research through grant NE/X00452X/1, Investigating HALocarbon impacts on the global Environment (InHALE). Our laboratory studies of TFA reactions with Criegee intermediates were supported by NERC grants NE/K004905/1 and NE/P013104/1.
Institutional Review Board Statement
Not applicable.
Informed Consent Statement
Not applicable.
Data Availability Statement
The data presented in this study are available on request from corresponding author.
Acknowledgments
We thank Bristol ChemLabS and the Primary Science Teaching Trust under whose auspices various aspects of this work was supported.
Conflicts of Interest
The authors declare no conflicts of interest.
Abbreviations
| CPTFE | chloropolytrifluoroethylene |
| EC50 | half-maximal effective concentration |
| ECTFE | ethylene-chlorotrifluoroethylene |
| FOSA | perfluorooctane sulfonamide |
| GWP | Global-warming potential |
| HCFC | hydrochlorofluorocarbon |
| HFC | hydrofluorocarbon |
| HFO | hydrofluoroolefins |
| NOEC | no observed effect concentration |
| NOEL | no observed effect level |
| PFAS | per- and polyfluoroalkyl substance |
| PFCA | perfluorinated carboxylic acid |
| PFEPE | polytetrafluoroethylene-co-tetrafluoroethylene-perfluoropropylether |
| PTFE | polytetrafluoroethylene |
| TD50 | median lethal dose |
| TFA | trifluoroacetic acid |
References
- Buck, R.C.; Franklin, J.; Berger, U.; Conder, J.M.; Cousins, I.T.; de Voogt, P.; Jensen, A.A.; Kannan, K.; Mabury, S.A.; van Leeuwen, S.P. Perfluoroalkyl and polyfluoroalkyl substances in the environment: Terminology, classification, and origins. Integr. Environ. Assess. Manag. 2011, 7, 513–541. [Google Scholar] [CrossRef]
- Herzke, D.; Nikiforov, V.; Yeung, L.W.Y.; Moe, B.; Routti, H.; Nygård, T.; Gabrielsen, G.W.; Hanssen, L. Targeted PFAS analyses and extractable organofluorine—Enhancing our understanding of the presence of unknown PFAS in Norwegian wildlife. Environ. Int. 2023, 171, 107640. [Google Scholar] [CrossRef]
- Lau, C.; Anitole, K.; Hodes, C.; Lai, D.; Pfahles-Hutchens, A.; Seed, J. Perfluoroalkyl acids: A review of monitoring and toxicological findings. Toxicol. Sci. 2007, 99, 366–394. [Google Scholar] [CrossRef]
- Letcher, R.J.; Bustnes, J.O.; Dietz, R.; Jenssen, B.M.; Jorgensen, E.H.; Sonne, C.; Verreault, J.; Vijayan, M.M.; Gabrielsen, G.W. Exposure and effects assessment of persistent organohalogen contaminants in arctic wildlife and fish. Sci. Total Environ. 2010, 408, 2995–3043. [Google Scholar] [CrossRef]
- Blevin, P.; Tartu, S.; Ellis, H.I.; Chastel, O.; Bustamante, P.; Parenteau, C.; Herzke, D.; Angelier, F.; Gabrielsen, G.W. Contaminants and energy expenditure in an Arctic seabird: Organochlorine pesticides and perfluoroalkyl substances are associated with metabolic rate in a contrasted manner. Environ. Res. 2017, 157, 118–126. [Google Scholar] [CrossRef]
- Briels, N.; Ciesielski, T.M.; Herzke, D.; Jaspers, V.L.B. Developmental Toxicity of Perfluorooctanesulfonate (PFOS) and Its Chlorinated Polyfluoroalkyl Ether Sulfonate Alternative F-53B in the Domestic Chicken. Environ. Sci. Technol. 2018, 52, 12859–12867. [Google Scholar] [CrossRef]
- Routti, H.; Berg, M.K.; Lille-Langoy, R.; Oygarden, L.; Harju, M.; Dietz, R.; Sonne, C.; Goksoyr, A. Environmental contaminants modulate the transcriptional activity of polar bear (Ursus maritimus) and human peroxisome proliferator-activated receptor alpha (PPARA). Sci. Rep. 2019, 9, 6918. [Google Scholar] [CrossRef] [PubMed]
- Gore, A.C.; Chappell, V.A.; Fenton, S.E.; Flaws, J.A.; Nadal, A.; Prins, G.S.; Toppari, J.; Zoeller, R.T. EDC-2: The Endocrine Society’s Second Scientific Statement on Endocrine-Disrupting Chemicals. Endocr. Rev. 2015, 36, E1–E150. [Google Scholar] [CrossRef] [PubMed]
- Tomy, G.T.; Budakowski, W.; Halldorson, T.; Helm, P.A.; Stern, G.A.; Friesen, K.; Pepper, K.; Tittlemier, S.A.; Fisk, A.T. Fluorinated organic compounds in an eastern Arctic marine food web. Environ. Sci. Technol. 2004, 38, 6475–6481. [Google Scholar] [CrossRef] [PubMed]
- Conder, J.M.; Hoke, R.A.; De Wolf, W.; Russell, M.H.; Buck, R.C. Are PFCAs bioaccumulative? A critical review and comparison with regulatory lipophilic compounds. Environ. Sci. Technol. 2008, 42, 995–1003. [Google Scholar] [CrossRef] [PubMed]
- Giesy, J.P.; Kannan, K. Global distribution of perfluorooctane sulfonate in wildlife. Environ. Sci. Technol. 2001, 35, 1339–1342. [Google Scholar] [CrossRef]
- Haukas, M.; Berger, U.; Hop, H.; Gulliksen, B.; Gabrielsen, G.W. Bioaccumulation of per- and polyfluorinated alkyl substances (PFAS) in selected species from the Barents Sea food web. Environ. Pollut. 2007, 148, 360–371. [Google Scholar] [CrossRef]
- Kannan, K.; Koistinen, J.; Beckmen, K.; Evans, T.; Gorzelany, J.F.; Hansen, K.J.; Jones, P.D.; Helle, E.; Nyman, M.; Giesy, J.P. Accumulation of perfluorooctane sulfonate in marine mammals. Environ. Sci. Technol. 2001, 35, 1593–1598. [Google Scholar] [CrossRef]
- Kelly, B.C.; Ikonomou, M.G.; Blair, J.D.; Surridge, B.; Hoover, D.; Grace, R.; Gobas, F.A.P.C. Perfluoroalkyl Contaminants in an Arctic Marine Food Web: Trophic Magnification and Wildlife Exposure. Environ. Sci. Technol. 2009, 43, 4037–4043. [Google Scholar] [CrossRef] [PubMed]
- Verreault, J.; Houde, M.; Gabrielsen, G.W.; Berger, U.; Haukas, M.; Letcher, R.J.; Muir, D.C.G. Perfluorinated alkyl substances in plasma, liver, brain, and eggs of glaucous gulls (Larus hyperboreus) from the Norwegian Arctic. Environ. Sci. Technol. 2005, 39, 7439–7445. [Google Scholar] [CrossRef]
- US EPA. PFAS Master List of PFAS Substances (Version 2); U.S. Environmental Protection Agency: Washington, DC, USA, 2021. [Google Scholar]
- OECD Global PFAS List. Toward a New Comprehensive Global Database of Per-and Polyfluoroalkyl Substances (PFASs); OECD: Paris, France, 2018. [Google Scholar]
- Land, M.; De Wit, C.A.; Bignert, A.; Cousins, I.T.; Herzke, D.; Johansson, J.H.; Martin, J.W. What is the effect of phasing out long-chain per-and polyfluoroalkyl substances on the concentrations of perfluoroalkyl acids and their precursors in the environment? A systematic review. Environ. Evid. 2018, 7, 4. [Google Scholar] [CrossRef]
- Tyrrell, N.D. A Proposal That Would Ban Manufacture, Supply, and Use of All Fluoropolymers and Most Fluorinated Reagents within the Entire EU. Org. Process Res. Dev. 2023, 27, 1422–1426. [Google Scholar] [CrossRef]
- Madronich, S.; Sulzberger, B.; Longstreth, J.D.; Schikowski, T.; Andersen, M.P.S.; Solomon, K.R.; Wilson, S.R. Changes in tropospheric air quality related to the protection of stratospheric ozone in a changing climate. Photoch. Photobio. Sci. 2023, 22, 1129–1176. [Google Scholar] [CrossRef]
- Wallington, T.J.; Andersen, M.P.S.; Nielsen, O.J. The case for a more precise definition of regulated PFAS. Environ. Sci.-Proc. Imp. 2021, 23, 1834–1838. [Google Scholar] [CrossRef]
- Harris, K.J.; Munoz, G.; Woo, V.; Sauve, S.; Rand, A.A. Targeted and Suspect Screening of Per- and Polyfluoroalkyl Substances in Cosmetics and Personal Care Products. Environ. Sci. Technol. 2022, 56, 14594–14604. [Google Scholar] [CrossRef] [PubMed]
- Gomis, M.I.; Vestergren, R.; Borg, D.; Cousins, I.T. Comparing the toxic potency in vivo of long-chain perfluoroalkyl acids and fluorinated alternatives. Environ. Int. 2018, 113, 1–9. [Google Scholar] [CrossRef]
- Bjornsdotter, M.K.; Yeung, L.W.Y.; Karrman, A.; Jogsten, I.E. Ultra-Short-Chain Perfluoroalkyl Acids Including Trifluoromethane Sulfonic Acid in Water Connected to Known and Suspected Point Sources in Sweden. Environ. Sci. Technol. 2019, 53, 11093–11101. [Google Scholar] [CrossRef]
- Jiao, E.M.; Zhu, Z.L.; Yin, D.Q.; Qiu, Y.L.; Karrman, A.; Yeung, L.W.Y. A pilot study on extractable organofluorine and per- and polyfluoroalkyl substances (PFAS) in water from drinking water treatment plants around Taihu Lake, China: What is missed by target PFAS analysis? Environ. Sci. Process. Impacts 2022, 24, 1060–1070. [Google Scholar] [CrossRef] [PubMed]
- Cousins, I.T.; Vestergren, R.; Wang, Z.Y.; Scheringer, M.; McLachlan, M.S. The precautionary principle and chemicals management: The example of perfluoroalkyl acids in groundwater. Environ. Int. 2016, 94, 331–340. [Google Scholar] [CrossRef]
- European Fluorocarbons Technical Comittee (EFCTC). Special Review on … Understanding TFA. Available online: https://www.fluorocarbons.org/wp-content/uploads/2016/09/EFCTC-Special-Review-on-TFA-2017_07_11F.pdf (accessed on 23 August 2023).
- Russell, M.H.; Hoogeweg, G.; Webster, E.M.; Ellis, D.A.; Waterland, R.L.; Hoke, R.A. TFA from HFO-1234yf: Accumulation and aquatic risk in terminal water bodies. Environ. Toxicol. Chem. 2012, 31, 1957–1965. [Google Scholar] [CrossRef]
- Boutonnet, J.C.; Bingham, P.; Calamari, D.; de Rooij, C.; Franklin, J.; Kawano, T.; Libre, J.M.; McCulloch, A.; Malinverno, G.; Odom, J.M.; et al. Environmental risk assessment of trifluoroacetic acid. Hum. Ecol. Risk Assess. 1999, 5, 59–124. [Google Scholar] [CrossRef]
- Solomon, K.R.; Velders, G.J.M.; Wilson, S.R.; Madronich, S.; Longstreth, J.; Aucamp, P.J.; Bornman, J.F. Sources, fates, toxicity, and risks of trifluoroacetic acid and its salts: Relevance to substances regulated under the Montreal and Kyoto Protocols. J. Toxicol. Env. Heal. B 2016, 19, 289–304. [Google Scholar] [CrossRef] [PubMed]
- Lindley, A.; McCulloch, A.; Vink, T. Contribution of hydrofluorocarbons (HFCs) and hydrofluoro-olefins (HFOs) atmospheric breakdown products to acidification (“Acid Rain”) in the EU at present and in the future. Open J. Air Pollut. 2019, 8, 81–95. [Google Scholar] [CrossRef]
- Key, B.D.; Howell, R.D.; Criddle, C.S. Fluorinated organics in the biosphere. Environ. Sci. Technol. 1997, 31, 2445–2454. [Google Scholar] [CrossRef]
- Ellis, D.A.; Hanson, M.L.; Sibley, P.K.; Shahid, T.; Fineberg, N.A.; Solomon, K.R.; Muir, D.C.G.; Mabury, S.A. The fate and persistence of trifluoroacetic and chloroacetic acids in pond waters. Chemosphere 2001, 42, 309–318. [Google Scholar] [CrossRef]
- Scott, B.F.; Mactavish, D.; Spencer, C.; Strachan, W.M.J.; Muir, D.C.G. Haloacetic acids in Canadian lake waters and precipitation. Environ. Sci. Technol. 2000, 34, 4266–4272. [Google Scholar] [CrossRef]
- Rompp, A.; Klemm, O.; Fricke, W.; Frank, H. Haloacetates in fog and rain. Environ. Sci. Technol. 2001, 35, 1294–1298. [Google Scholar] [CrossRef]
- Wujcik, C.E.; Cahill, T.M.; Seiber, J.N. Determination of trifluoroacetic acid in 1996–1997 precipitation and surface waters in California and Nevada. Environ. Sci. Technol. 1999, 33, 1747–1751. [Google Scholar] [CrossRef]
- Scott, B.F.; Spencer, C.; Marvin, C.H.; MacTavish, D.C.; Muir, D.C.G. Distribution of haloacetic acids in the water columns of the Laurentian Great Lakes and Lake Malawi. Environ. Sci. Technol. 2002, 36, 1893–1898. [Google Scholar] [CrossRef]
- Frank, H.; Christoph, E.H.; Holm-Hansen, O.; Bullister, J.L. Trifluoroacetate in ocean waters. Environ. Sci. Technol. 2002, 36, 12–15. [Google Scholar] [CrossRef]
- Berg, M.; Muller, S.R.; Muhlemann, J.; Wiedmer, A.; Schwarzenbach, R.P. Concentrations and mass fluxes of chloroacetic acids and trifluoroacetic acid in rain and natural waters in Switzerland. Environ. Sci. Technol. 2000, 34, 2675–2683. [Google Scholar] [CrossRef]
- Von Sydow, L.M.; Grimvall, A.B.; Boren, H.B.; Laniewski, K.; Nielsen, A.T. Natural background levels of trifluoroacetate in rain and snow. Environ. Sci. Technol. 2000, 34, 3115–3118. [Google Scholar] [CrossRef]
- Brunn, H.; Arnold, G.; Korner, W.; Rippen, G.; Steinhauser, K.G.; Valentin, I. PFAS: Forever chemicals-persistent, bioaccumulative and mobile. Reviewing the status and the need for their phase out and remediation of contaminated sites. Environ. Sci. Eur. 2023, 35, 20. [Google Scholar] [CrossRef]
- Freeling, F.; Bjornsdotter, M.K. Assessing the environmental occurrence of the anthropogenic contaminant trifluoroacetic acid (TFA). Curr. Opin. Green Sustain. Chem. 2023, 41, 100807. [Google Scholar] [CrossRef]
- Pickard, H.M.; Criscitiello, A.S.; Persaud, D.; Spencer, C.; Muir, D.C.G.; Lehnherr, I.; Sharp, M.J.; De Silva, A.O.; Young, C.J. Ice Core Record of Persistent Short-Chain Fluorinated Alkyl Acids: Evidence of the Impact From Global Environmental Regulations. Geophys. Res. Lett. 2020, 47, e2020GL087535. [Google Scholar] [CrossRef]
- Freeling, F.; Scheurer, M.; Koschorreck, J.; Hoffmann, G.; Ternes, T.A.; Nodler, K. Levels and Temporal Trends of Trifluoroacetate (TFA) in Archived Plants: Evidence for Increasing Emissions of Gaseous TFA Precursors over the Last Decades. Environ. Sci. Tech. Let. 2022, 9, 400–405. [Google Scholar] [CrossRef]
- O’Neil, M.J. The Merck Index: An Encyclopedia of Chemicals, Drugs, and Biologicals; RSC Publishing: Cambridge, UK, 2013. [Google Scholar]
- Kutsuna, S.; Hori, H. Experimental determination of Henry’s law constants of trifluoroacetic acid at 278–298 K. Atmos. Environ. 2008, 42, 1399–1412. [Google Scholar] [CrossRef]
- Andersen, M.P.S.; Axson, J.L.; Michelsen, R.R.H.; Nielsen, O.J.; Iraci, L.T. Solubility of Acetic Acid and Trifluoroacetic Acid in Low-Temperature (207–245 K) Sulfuric Acid Solutions: Implications for the Upper Troposphere and Lower Stratosphere. J. Phys. Chem. A 2011, 115, 4388–4396. [Google Scholar] [CrossRef] [PubMed]
- Buckingham, J. Dictionary of Organic Compounds; CRC Press: Boca Raton, FL, USA, 1996; Volume 1. [Google Scholar]
- Bowden, D.J.; Clegg, S.L.; Brimblecombe, P. The Henry’s law constant of trifluoroacetic acid and its partitioning into liquid water in the atmosphere. Chemosphere 1996, 32, 405–420. [Google Scholar] [CrossRef]
- Namazian, M.; Zakery, M.; Noorbala, M.R.; Coote, M.L. Accurate calculation of the pK(a) of trifluoroacetic acid using high-level ab initio calculations. Chem. Phys. Lett. 2008, 451, 163–168. [Google Scholar] [CrossRef]
- Rayne, S.; Forest, K. Theoretical studies on the pK(a) values of perfluoroalkyl carboxylic acids. J. Mol. Struc.-Theochem. 2010, 949, 60–69. [Google Scholar] [CrossRef]
- Ellis, D.A.; Mabury, S.A.; Martin, J.W.; Muir, D.C. Thermolysis of fluoropolymers as a potential source of halogenated organic acids in the environment. Nature 2001, 412, 321–324. [Google Scholar] [CrossRef] [PubMed]
- Luecken, D.J.; Waterland, R.L.; Papasavva, S.; Taddonio, K.N.; Hutzell, W.T.; Rugh, J.P.; Andersen, S.O. Ozone and TFA Impacts in North America from Degradation of 2,3,3,3-Tetrafluoropropene (HFO-1234yf), A Potential Greenhouse Gas Replacement. Environ. Sci. Technol. 2010, 44, 343–348. [Google Scholar] [CrossRef] [PubMed]
- Kazil, J.; McKeen, S.; Kim, S.W.; Ahmadov, R.; Grell, G.; Talukdar, R.; Ravishankara, A. Deposition and rainwater concentrations of trifluoroacetic acid in the United States from the use of HFO-1234yf. J. Geophys. Res. Atmos. 2014, 119, 14059–14079. [Google Scholar] [CrossRef]
- Tao, Y.; VandenBoer, T.C.; Ye, R.X.; Young, C.J. Exploring controls on perfluorocarboxylic acid (PFCA) gas-particle partitioning using a model with observational constraints. Environ. Sci. Process. Impacts 2023, 25, 264–276. [Google Scholar] [CrossRef]
- Lu, Y.; Liu, L.; Ning, A.; Yang, G.; Liu, Y.; Kurtén, T.; Vehkamäki, H.; Zhang, X.; Wang, L. Atmospheric Sulfuric Acid-Dimethylamine Nucleation Enhanced by Trifluoroacetic Acid. Geophys. Res. Lett. 2020, 47, e2019GL085627. [Google Scholar] [CrossRef]
- Holland, R.; Khan, M.A.H.; Driscoll, I.; Chhantyal-Pun, R.; Derwent, R.G.; Taatjes, C.A.; Orr-Ewing, A.J.; Percival, C.J.; Shallcross, D.E. Investigation of the Production of Trifluoroacetic Acid from Two Halocarbons, HFC-134a and HFO-1234yf and Its Fates Using a Global Three-Dimensional Chemical Transport Model. ACS Earth Space Chem. 2021, 5, 849–857. [Google Scholar] [CrossRef]
- Sander, R. Compilation of Henry’s law constants (version 4.0) for water as solvent. Atmos. Chem. Phys. 2015, 15, 4399–4981. [Google Scholar] [CrossRef]
- Berends, A.G.; Boutonnet, J.C.; de Rooij, C.G.; Thompson, R.S. Toxicity of trifluoroacetate to aquatic organisms. Environ. Toxicol. Chem. 1999, 18, 1053–1059. [Google Scholar] [CrossRef]
- Hanson, M.L.; Sibley, P.K.; Ellis, D.A.; Fineberg, N.A.; Mabury, S.A.; Solomon, K.R.; Muir, D.C. Trichloroacetic acid fate and toxicity to the macrophytes Myriophyllum spicatum and Myriophyllum sibiricum under field conditions. Aquat. Toxicol. 2002, 56, 241–255. [Google Scholar] [CrossRef] [PubMed]
- Hanson, M.L.; Solomon, K.R. Haloacetic acids in the aquatic environment. Part I: Macrophyte toxicity. Environ. Pollut. 2004, 130, 371–383. [Google Scholar] [CrossRef] [PubMed]
- Wang, Z.Y.; Wang, Y.H.; Li, J.F.; Henne, S.; Zhang, B.Y.; Hu, J.X.; Zhang, J.B. Impacts of the Degradation of 2,3,3,3-Tetrafluoropropene into Trifluoroacetic Acid from Its Application in Automobile Air Conditioners in China, the United States, and Europe. Environ. Sci. Technol. 2018, 52, 2819–2826. [Google Scholar] [CrossRef]
- Seiber, J.N.; Cahill, T.M. Trifluoroacetic Acid from CFC Replacements: An Atmopsheric Toxicant Becomes a Terrestrial Problem. In Pesticides, Organic Contaminants, and Pathogens in Air: Chemodynamics, Health Effects, Sampling, and Analysis; Taylor & Francis: Abingdon-on-Thames, UK, 2022. [Google Scholar]
- Zhang, L.; Sun, H.W.; Wang, Q.; Chen, H.; Yao, Y.M.; Zhao, Z.; Alder, A.C. Uptake mechanisms of perfluoroalkyl acids with different carbon chain lengths (C2–C8) by wheat (Triticum acstivnm L.). Sci. Total Environ. 2019, 654, 19–27. [Google Scholar] [CrossRef]
- Benesch, J.A.; Gustin, M.S. Uptake of trifluoroacetate by Pinus ponderosa via atmospheric pathway. Atmos. Environ. 2002, 36, 1233–1235. [Google Scholar] [CrossRef]
- Chen, H.; Yao, Y.M.; Zhao, Z.; Wang, Y.; Wang, Q.; Ren, C.; Wang, B.; Sun, H.W.; Alder, A.C.; Kannan, K. Multimedia Distribution and Transfer of Per- and Polyfluoroalkyl Substances (PFASs) Surrounding Two Fluorochemical Manufacturing Facilities in Fuxin, China. Environ. Sci. Technol. 2018, 52, 8263–8271. [Google Scholar] [CrossRef]
- Tian, Y.; Yao, Y.M.; Chang, S.; Zhao, Z.; Zhao, Y.Y.; Yuan, X.J.; Wu, F.C.; Sun, H.W. Occurrence and Phase Distribution of Neutral and Ionizable Per- and Polyfluoroalkyl Substances (PFASs) in the Atmosphere and Plant Leaves around Landfills: A Case Study in Tianjin, China. Environ. Sci. Technol. 2018, 52, 1301–1310. [Google Scholar] [CrossRef]
- Rollins, A.; Barber, J.; Elliott, R.; Wood, B. Xenobiotic monitoring in plants by 19F and 1H nuclear magnetic resonance imaging and spectroscopy: Uptake of trifluoroacetic acid in Lycopersicon esculentum. Plant Physiol. 1989, 91, 1243–1246. [Google Scholar] [CrossRef] [PubMed]
- Cahill, T.M.; Thomas, C.M.; Schwarzbach, S.E.; Seiber, J.N. Accumulation of trifluoroacetate in seasonal wetlands in California. Environ. Sci. Technol. 2001, 35, 820–825. [Google Scholar] [CrossRef] [PubMed]
- Lan, Z.H.; Yao, Y.M.; Xu, J.Y.; Chen, H.; Ren, C.; Fang, X.G.; Zhang, K.; Jin, L.T.; Hua, X.; Alder, A.C.; et al. Novel and legacy per- and polyfluoroalkyl substances (PFASs) in a farmland environment: Soil distribution and biomonitoring with plant leaves and locusts. Environ. Pollut. 2020, 263, 114487. [Google Scholar] [CrossRef] [PubMed]
- Blake, D.; Barry, J.; Cascorbi, H. A note on the effect of trifluoroacetate on the growth of rat liver. Naunyn Schmiedebergs Arch. Pharmacol. 1969, 265, 474–475. [Google Scholar] [CrossRef]
- Fraser, J.M.; Kaminsky, L.S. 2, 2, 2-Trifluoroethanol intestinal and bone marrow toxicity: The role of its metabolism to 2, 2, 2-trifluoroacetaldehyde and trifluoroacetic acid. Toxicol. Appl. Pharmacol. 1988, 94, 84–92. [Google Scholar] [CrossRef]
- Hanson, M.L.; Solomon, K.R. Haloacetic acids in the aquatic environment. Part II: Ecological risk assessment. Environ. Pollut. 2004, 130, 385–401. [Google Scholar] [CrossRef] [PubMed]
- Dekant, W.; Dekant, R. Mammalian toxicity of trifluoroacetate and assessment of human health risks due to environmental exposures. Arch. Toxicol. 2023, 97, 1069–1077. [Google Scholar] [CrossRef]
- Wark, H.; Earl, J.; Chau, D.D.; Overton, J. Halothane Metabolism in Children. Br. J. Anaesth. 1990, 64, 474–481. [Google Scholar] [CrossRef]
- Sutton, T.S.; Koblin, D.D.; Gruenke, L.D.; Weiskopf, R.B.; Rampil, I.J.; Waskell, L.; Eger, E.I. Fluoride Metabolites after Prolonged Exposure of Volunteers and Patients to Desflurane. Anesth. Analg. 1991, 73, 180–185. [Google Scholar] [CrossRef]
- Duan, Y.S.; Sun, H.W.; Yao, Y.M.; Meng, Y.; Li, Y.C. Distribution of novel and legacy per-/polyfluoroalkyl substances in serum and its associations with two glycemic biomarkers among Chinese adult men and women with normal blood glucose levels. Environ. Int. 2020, 134, 105295. [Google Scholar] [CrossRef]
- Neale, R.E.; Barnes, P.W.; Robson, T.M.; Neale, P.J.; Williamson, C.E.; Zepp, R.G.; Wilson, S.R.; Madronich, S.; Andrady, A.L.; Heikkila, A.M.; et al. Environmental effects of stratospheric ozone depletion, UV radiation, and interactions with climate change: UNEP Environmental Effects Assessment Panel, Update 2020. Photochem. Photobiol. Sci. 2021, 20, 1–67. [Google Scholar] [CrossRef]
- Ghantous, H.; Parnerud, I.; Danielsson, B.R.G.; Dencker, L. Distribution of Halothane and the Metabolites Trifluoroacetic-Acid and Bromide in the Conceptus after Halothane Inhalation by Pregnant Mice. Acta Pharmacol. Toxicol. 1986, 59, 370–376. [Google Scholar] [CrossRef] [PubMed]
- Cappon, G.D.; Keller, D.A.; Brock, W.J.; Slauter, R.W.; Hurtt, M.E. Effects of HCFC-123 exposure to maternal and infant rhesus monkeys on hepatic biochemistry, lactational parameters and postnatal growth. Drug Chem. Toxicol. 2002, 25, 481–496. [Google Scholar] [CrossRef] [PubMed]
- Zhao, L.C.; Cheng, Z.P.; Zhu, H.K.; Chen, H.; Yao, Y.M.; Baqar, M.; Yu, H.; Qiao, B.T.; Sun, H.W. Electronic-waste-associated pollution of per- and polyfluoroalkyl substances: Environmental occurrence and human exposure. J. Hazard. Mater. 2023, 451, 131204. [Google Scholar] [CrossRef]
- Zheng, G.M.; Eick, S.M.; Salamova, A. Elevated Levels of Ultrashort- and Short-Chain Perfluoroalkyl Acids in US Homes and People. Environ. Sci. Technol. 2023, 57, 15782–15793. [Google Scholar] [CrossRef] [PubMed]
- Kim, D.H.; Jeong, Y.; Belova, L.; Roggeman, M.; Fernandez, S.F.; Poma, G.; Remy, S.; Verheyen, V.J.; Schoeters, G.; van Nuijs, A.L.N.; et al. Comprehensive investigation of persistent and mobile chemicals and per-and polyfluoroalkyl substances in urine of flemish adolescents using a suspect screening approach. Environ. Pollut. 2022, 312, 119972. [Google Scholar] [CrossRef]
- Benesch, J.A.; Gustin, M.S.; Cramer, G.R.; Cahill, T.M. Investigation of effects of trifluoroacetate on vernal pool ecosystems. Environ. Toxicol. Chem. 2002, 21, 640–647. [Google Scholar] [CrossRef] [PubMed]
- Smit, M.F.; van Heerden, P.D.R.; Pienaar, J.J.; Weissflog, L.; Strasser, R.J.; Krüger, G.H.J. Effect of trifluoroacetate, a persistent degradation product of fluorinated hydrocarbons, on Phaseolus vulgaris and Zea mays. Plant Physiol. Biochem. 2009, 47, 623–634. [Google Scholar] [CrossRef] [PubMed]
- Oehrle, N.W.; Green, L.S.; Karr, D.B.; Emerich, D.W. The HFC/HCFC breakdown product trifluoroacetic acid (TFA) and its effects on the symbiosis between Bradyrhizobium japonicum and soybean (Glycine max). Soil Biol. Biochem. 2004, 36, 333–342. [Google Scholar] [CrossRef]
- Henne, S.; Shallcross, D.E.; Reimann, S.; Xiao, P.; Boulos, S.; Gerecke, A.C.; Brunner, D. Environmental Impacts of HFO-1234yf and Other HFOs. In Ashrae/Nist Refrigerants Conference; ASHRAE: Peachtree Corners, GA, USA, 2012; pp. 182–194. [Google Scholar]
- David, L.M.; Barth, M.; Hoglund-Isaksson, L.; Purohit, P.; Velders, G.J.M.; Glaser, S.; Ravishankara, A.R. Trifluoroacetic acid deposition from emissions of HFO-1234yf in India, China, and the Middle East. Atmos. Chem. Phys. 2021, 21, 14833–14849. [Google Scholar] [CrossRef]
- Xie, G.Y.; Cui, J.N.; Zhai, Z.H.; Zhang, J.B. Distribution characteristics of trifluoroacetic acid in the environments surrounding fluorochemical production plants in Jinan, China. Environ. Sci. Pollut. Res. 2020, 27, 983–991. [Google Scholar] [CrossRef] [PubMed]
- Lopez, S.E.; Salazar, J. Trifluoroacetic acid: Uses and recent applications in organic synthesis. J. Fluor. Chem. 2013, 156, 73–100. [Google Scholar] [CrossRef]
- Scheurer, M.; Nodler, K.; Freeling, F.; Janda, J.; Happel, O.; Riegel, M.; Muller, U.; Storck, F.R.; Fleig, M.; Lange, F.T.; et al. Small, mobile, persistent: Trifluoroacetate in the water cycle—Overlooked sources, pathways, and consequences for drinking water supply. Water Res. 2017, 126, 460–471. [Google Scholar] [CrossRef]
- Lv, K.; Gao, W.; Meng, L.Y.; Xue, Q.; Tian, H.T.; Wang, Y.W.; Jiang, G.B. Phototransformation of perfluorooctane sulfonamide on natural clay minerals: A likely source of short chain perfluorocarboxylic acids. J. Hazard. Mater. 2020, 392, 122354. [Google Scholar] [CrossRef]
- Adlunger, K.; Anke, J.M.; Bachem, G.; Banning, H.; Biegel-Engler, A.; Blondzik, K.; Braun, U.; Eckhardt, A.; Gildemeister, D.; Hilliges, F.; et al. Reducing the Input of Chemicals Into Waters: Trifluoroacetate (TFA) as a Persistent and Mobile Substance with Many Sources; German Environment Agency: Dessau-Roßlau, Germany, 2022. [Google Scholar]
- Behringer, D.; Heydel, F.; Gschrey, B. Persistent Degradation Products of Halogenated Refrigerants and Blowing Agents in the Environment. Type, Environmental Concentrations, and Fate with Particular Regard to New Halogenated Substitutes with Low Global Warming Potential; Final Report; Umweltbundesamt (UBA): Dessau-Roßlau, Germany, 2021. [Google Scholar]
- Ogawa, Y.; Tokunaga, E.; Kobayashi, O.; Hirai, K.; Shibata, N. Current Contributions of Organofluorine Compounds to the Agrochemical Industry. Iscience 2020, 23, 101467. [Google Scholar] [CrossRef] [PubMed]
- Sun, M.; Cui, J.N.; Guo, J.Y.; Zhai, Z.H.; Zuo, P.; Zhang, J.B. Fluorochemicals biodegradation as a potential source of trifluoroacetic acid (TFA) to the environment. Chemosphere 2020, 254, 126894. [Google Scholar] [CrossRef] [PubMed]
- Cui, J.N.; Guo, J.Y.; Zhai, Z.H.; Zhang, J.B. The contribution of fluoropolymer thermolysis to trifluoroacetic acid (TFA) in environmental media. Chemosphere 2019, 222, 637–644. [Google Scholar] [CrossRef]
- Adi, M.A.; Altarawneh, M. Formation of perfluorocarboxylic acids (PFCAs) from thermolysis of Teflon model compound. Environ. Sci. Pollut. Res. 2023, 30, 21360–21367. [Google Scholar] [CrossRef]
- Wang, B.; Yao, Y.; Chen, H.; Chang, S.; Tian, Y.; Sun, H. Per- and polyfluoroalkyl substances and the contribution of unknown precursors and short-chain (C2–C3) perfluoroalkyl carboxylic acids at solid waste disposal facilities. Sci. Total Environ. 2020, 705, 135832. [Google Scholar] [CrossRef]
- Khan, M.Y.; Song, J.O.; Narimani, M.; da Silva, G. Thermal decomposition mechanism and kinetics of perfluorooctanoic acid (PFOA) and other perfluorinated carboxylic acids: A theoretical study. Environ. Sci.-Proc. Impacts 2022, 24, 2475–2487. [Google Scholar] [CrossRef] [PubMed]
- Alinezhad, A.; Shao, H.; Litvanova, K.; Sun, R.Z.; Kubatova, A.; Zhang, W.; Li, Y.; Xiao, F. Mechanistic Investigations of Thermal Decomposition of Perfluoroalkyl Ether Carboxylic Acids and Short-Chain Perfluoroalkyl Carboxylic Acids. Environ. Sci. Technol. 2023, 57, 8796–8807. [Google Scholar] [CrossRef]
- Berasategui, M.; Argüello, G.A.; Paci, M.A.B. Gas-Phase Reaction between CFO and CFC(O)OH: Characterization of CFC(O)OC(O)F. J. Phys. Chem. 2019, 123, 4671–4678. [Google Scholar] [CrossRef]
- Qu, R.J.; Liu, J.Q.; Li, C.G.; Wang, L.S.; Wang, Z.Y.; Wu, J.C. Experimental and theoretical insights into the photochemical decomposition of environmentally persistent perfluorocarboxylic acids. Water Res. 2016, 104, 34–43. [Google Scholar] [CrossRef]
- Liu, J.Q.; Xiang, W.R.; Li, C.G.; Van Hoomissen, D.J.; Qi, Y.M.; Wu, N.N.; Al-Basher, G.; Qu, R.J.; Wang, Z.Y. Kinetics and mechanism analysis for the photodegradation of PFOA on different solid particles. Chem. Eng. J. 2020, 383, 123115. [Google Scholar] [CrossRef]
- Singh, R.K.; Fernando, S.; Baygi, S.F.; Multari, N.; Thagard, S.M.; Holsen, T.M. Breakdown Products from Perfluorinated Alkyl Substances (PFAS) Degradation in a Plasma-Based Water Treatment Process. Environ. Sci. Technol. 2019, 53, 2731–2738. [Google Scholar] [CrossRef] [PubMed]
- Lutze, H.V.; Brekenfeld, J.; Naumov, S.; von Sonntag, C.; Schmidt, T.C. Degradation of perfluorinated compounds by sulfate radicals—New mechanistic aspects and economical considerations. Water Res. 2018, 129, 509–519. [Google Scholar] [CrossRef] [PubMed]
- Trang, B.; Li, Y.L.; Xue, X.S.; Ateia, M.; Houk, K.N.; Dichtel, W.R. Low-temperature mineralization of perfluorocarboxylic acids. Science 2022, 377, 839–845. [Google Scholar] [CrossRef]
- Ellis, D.A.; Martin, J.W.; De Silva, A.O.; Mabury, S.A.; Hurley, M.D.; Sulbaek Andersen, M.P.; Wallington, T.J. Degradation of Fluorotelomer Alcohols: A Likely Atmospheric Source of Perfluorinated Carboxylic Acids. Environ. Sci. Technol. 2004, 38, 3316–3321. [Google Scholar] [CrossRef]
- Metz, B. Safeguarding the Ozone Layer and the Global Climate System: Issues Related to Hydrofluorocarbons and Perfluorocarbons; IPCC/TEAP Special Report; Cambridge University Press: Cambridge, UK, 2005. [Google Scholar]
- Papadimitriou, V.C.; Talukdar, R.K.; Portmann, R.W.; Ravishankara, A.R.; Burkholder, J.B. CF3CF=CH2 and (Z)-CF3CF=CHF: Temperature dependent OH rate coefficients and global warming potentials. Phys. Chem. Chem. Phys. 2008, 10, 808–820. [Google Scholar] [CrossRef]
- Hurley, M.; Wallington, T.; Javadi, M.; Nielsen, O. Atmospheric chemistry of CF3CF=CH2: Products and mechanisms of Cl atom and OH radical initiated oxidation. Chem. Phys. Lett. 2008, 450, 263–267. [Google Scholar] [CrossRef]
- Orkin, V.L.; Martynova, L.E.; Ilichev, A.N. High-Accuracy Measurements of OH Reaction Rate Constants and IR Absorption Spectra: CH2=CF−CF3 and trans-CHF=CH−CF3. J. Phys. Chem. A 2010, 114, 5967–5979. [Google Scholar] [CrossRef]
- Tokuhashi, K.; Takizawa, K.; Kondo, S. Rate constants for the reactions of OH radicals with CF3 CX=CY2 (X=H, F, CF3, Y=H, F, Cl). Environ. Sci. Pollut. Res. 2018, 25, 15204–15215. [Google Scholar] [CrossRef]
- Harnisch, J.; Frische, M.; Borchers, R.; Eisenhauer, A.; Jordan, A. Natural fluorinated organics in fluorite and rocks. Geophys. Res. Lett. 2000, 27, 1883–1886. [Google Scholar] [CrossRef]
- Zhao, S.Y.; Liu, T.Q.; Zhu, L.Y.; Yang, L.P.; Zong, Y.; Zhao, H.T.; Hu, L.H.; Zhan, J.J. Formation of perfluorocarboxylic acids (PFCAs) during the exposure of earthworms to 6:2 fluorotelomer sulfonic acid (6:2 FTSA). Sci. Total Environ. 2021, 760, 143356. [Google Scholar] [CrossRef] [PubMed]
- Scott, B.F.; Macdonald, R.W.; Kannan, K.; Fisk, A.; Witter, A.; Yamashita, N.; Durham, L.; Spencer, C.; Muir, D.C.G. Trifluoroacetate Profiles in the Arctic, Atlantic, and Pacific Oceans. Environ. Sci. Technol. 2005, 39, 6555–6560. [Google Scholar] [CrossRef]
- Lindley, A.A. An inventory of fluorspar production, industrial use, and emissions of trifluoroacetic acid (TFA) in the period 1930 to 1999. J. Geosci. Environ. Prot. 2023, 11, 1–16. [Google Scholar] [CrossRef]
- Rudels, B.; Quadfasel, D. Arctic Ocean Component in the Greenland-Scotland Overflow; International Council for the Exploration of the Sea: København, Denmark, 1991. [Google Scholar]
- Nielsen, O.J.; Scott, B.F.; Spencer, C.; Wallington, T.J.; Ball, J.C. Trifluoroacetic acid in ancient freshwater. Atmos. Environ. 2001, 35, 2799–2801. [Google Scholar] [CrossRef]
- Joudan, S.; De Silva, A.O.; Young, C.J. Insufficient evidence for the existence of natural trifluoroacetic acid. Environ. Sci. Process. Impacts 2021, 23, 1641–1649. [Google Scholar] [CrossRef] [PubMed]
- Ellis, D.; Moody, C.; Mabury, S. The Handbook of Environmental Chemistry Vol. 3, Part N Organofluorines; Springer: Berlin/Heidelberg, Germany, 2002. [Google Scholar]
- Mogelberg, T.E.; Nielsen, O.J.; Sehested, J.; Wallington, T.J.; Hurley, M.D. Atmospheric Chemistry of Cf3cooh—Kinetics of the Reaction with Oh Radicals. Chem. Phys. Lett. 1994, 226, 171–177. [Google Scholar] [CrossRef]
- Carr, S.; Treacy, J.J.; Sidebottom, H.W.; Connell, R.K.; Canosamas, C.E.; Wayne, R.P.; Franklin, J. Kinetics and Mechanisms for the Reaction of Hydroxyl Radicals with Trifluoroacetic-Acid under Atmospheric Conditions. Chem. Phys. Lett. 1994, 227, 39–44. [Google Scholar] [CrossRef]
- Hurley, M.D.; Andersen, M.P.S.; Wallington, T.J.; Ellis, D.A.; Martin, J.W.; Mabury, S.A. Atmospheric chemistry of perfluorinated carboxylic acids: Reaction with OH radicals and atmospheric lifetimes. J. Phys. Chem. A 2004, 108, 615–620. [Google Scholar] [CrossRef]
- Tromp, T.K.; Ko, M.K.W.; Rodriguez, J.M.; Sze, N.D. Potential Accumulation of a Cfc-Replacement Degradation Product in Seasonal Wetlands. Nature 1995, 376, 327–330. [Google Scholar] [CrossRef]
- Kotamarthi, V.R.; Rodriguez, J.M.; Ko, M.K.W.; Tromp, T.K.; Sze, N.D.; Prather, M.J. Trifluoroacetic acid from degradation of HCFCs and HFCs: A three-dimensional modeling study. J. Geophys. Res. Atmos. 1998, 103, 5747–5758. [Google Scholar] [CrossRef]
- Chhantyal-Pun, R.; McGillen, M.R.; Beames, J.M.; Khan, M.A.H.; Percival, C.J.; Shallcross, D.E.; Orr-Ewing, A.J. Temperature-Dependence of the Rates of Reaction of Trifluoroacetic Acid with Criegee Intermediates. Angew. Chem. Int. Ed. 2017, 56, 9044–9047. [Google Scholar] [CrossRef] [PubMed]
- Lifongo, L.L.; Bowden, D.J.; Brimblecombe, P. Photodegradation of haloacetic acids in water. Chemosphere 2004, 55, 467–476. [Google Scholar] [CrossRef] [PubMed]
- Kim, B.R.; Suidan, M.T.; Wallington, T.J.; Du, X. Biodegradability of trifluoroacetic acid. Environ. Eng. Sci. 2000, 17, 337–342. [Google Scholar] [CrossRef]
- Zoumpouli, G.A.; Scheurer, M.; Brauch, H.-J.; Kasprzyk-Hordern, B.; Wenk, J.; Happel, O. COMBI, continuous ozonation merged with biofiltration to study oxidative and microbial transformation of trace organic contaminants. Environ. Sci. Water Res. Technol. 2019, 5, 552–563. [Google Scholar] [CrossRef]
- Visscher, P.T.; Culbertson, C.W.; Oremland, R.S. Degradation of trifluoroacetate in oxic and anoxic sediments. Nature 1994, 369, 729–731. [Google Scholar] [CrossRef]
- Emptage, M.; Tabinowski, J.; Odom, J.M. Effect of fluoroacetates on methanogenesis in samples from selected methanogenic environments. Environ. Sci. Technol. 1997, 31, 732–734. [Google Scholar] [CrossRef]
- Hori, H.; Takano, Y.; Koike, K.; Takeuchi, K.; Einaga, H. Decomposition of environmentally persistent trifluoroacetic acid to fluoride ions by a homogeneous photocatalyst in water. Environ. Sci. Technol. 2003, 37, 418–422. [Google Scholar] [CrossRef]
- Zhou, J.Y.; Saeidi, N.; Wick, L.Y.; Xie, Y.L.; Kopinke, F.D.; Georgi, A. Efficient removal of trifluoroacetic acid from water using surface-modified activated carbon and electro-assisted desorption. J. Hazard. Mater. 2022, 436, 129051. [Google Scholar] [CrossRef] [PubMed]
- Meng, Q.; Cao, Y.; Ma, S.; Wang, M.; Niu, H.; Jiang, W.; Teng, Q.; Jia, N. Waste organic acid treatment with polyethyleneimine grafted polystyrene resin. J. Appl. Polym. Sci. 2023, 140, e53433. [Google Scholar] [CrossRef]
- Lesmeister, L.; Lange, F.T.; Breuer, J.; Biegel-Engler, A.; Giese, E.; Scheurer, M. Extending the knowledge about PFAS bioaccumulation factors for agricultural plants—A review. Sci. Total Environ. 2021, 766, 142640. [Google Scholar] [CrossRef] [PubMed]
- Wu, J.; Martin, J.W.; Zhai, Z.H.; Lu, K.D.; Li, L.; Fang, X.K.; Jin, H.B.; Hu, J.X.; Zhang, J.B. Airborne Trifluoroacetic Acid and Its Fraction from the Degradation of HFC-134a in Beijing, China. Environ. Sci. Technol. 2014, 48, 3675–3681. [Google Scholar] [CrossRef] [PubMed]
- Hu, X.; Wu, J.; Zhai, Z.H.; Zhang, B.Y.; Zhang, J.B. Determination of Gaseous and Particulate Trifluoroacetic Acid in Atmosphere Environmental Samples by Gas Chromatography-Mass Spectrometry. Chin. J. Anal. Chem. 2013, 41, 1140–1146. [Google Scholar] [CrossRef]
- Chen, H.; Zhang, L.; Li, M.Q.; Yao, Y.M.; Zhao, Z.; Munoz, G.; Sun, H.W. Per- and polyfluoroalkyl substances (PFASs) in precipitation from mainland China: Contributions of unknown precursors and short-chain (C2–C3) perfluoroalkyl carboxylic acids. Water Res. 2019, 153, 169–177. [Google Scholar] [CrossRef]
- Scott, B.F.; Spencer, C.; Mabury, S.A.; Muir, D.C.G. Poly and perfluorinated carboxylates in north American precipitation. Environ. Sci. Technol. 2006, 40, 7167–7174. [Google Scholar] [CrossRef]
- Wujcik, C.E.; Zehavi, D.; Seiber, J.N. Trifluoroacetic acid levels in 1994–1996 fog, rain, snow and surface waters from California and Nevada. Chemosphere 1998, 36, 1233–1245. [Google Scholar] [CrossRef]
- Wang, Q.Y.; Wang, X.M.; Ding, X. Rainwater trifluoroacetic acid (TFA) in Guangzhou, South China: Levels, wet deposition fluxes and source implication. Sci. Total Environ. 2014, 468, 272–279. [Google Scholar] [CrossRef]
- Zhai, Z.H.; Wu, J.; Hu, X.; Li, L.; Guo, J.Y.; Zhang, B.Y.; Hu, J.X.; Zhang, J.B. A 17-fold increase of trifluoroacetic acid in landscape waters of Beijing, China during the last decade. Chemosphere 2015, 129, 110–117. [Google Scholar] [CrossRef]
- Zhang, J.B.; Zhang, Y.; Li, J.L.; Hu, J.X.; Ye, P.; Zeng, Z. Monitoring of trifluoroacetic acid concentration in environmental waters in China. Water Res. 2005, 39, 1331–1339. [Google Scholar] [CrossRef]
- Bjornsdotter, M.K.; Yeung, L.W.Y.; Karrman, A.; Jogsten, I.E. Challenges in the analytical determination of ultra-short-chain perfluoroalkyl acids and implications for environmental and human health. Anal. Bioanal. Chem. 2020, 412, 4785–4796. [Google Scholar] [CrossRef] [PubMed]
- Guo, J.; Zhai, Z.; Wang, L.; Wang, Z.; Wu, J.; Zhang, B.; Zhang, J. Dynamic and thermodynamic mechanisms of TFA adsorption by particulate matter. Environ. Pollut. 2017, 225, 175–183. [Google Scholar] [CrossRef]
- Lin, H.J.; Taniyasu, S.; Yamazaki, E.; Wu, R.B.; Lam, P.K.S.; Eun, H.; Yamashita, N. Fluorine mass balance analysis and per- and polyfluoroalkyl substances in the atmosphere. J. Hazard. Mater. 2022, 435, 129025. [Google Scholar] [CrossRef]
- Frank, H.; Klein, A.; Renschen, D. Environmental trifluoroacetate. Nature 1996, 382, 34. [Google Scholar] [CrossRef]
- Jordan, A.; Frank, H. Trifluoroacetate in the environment. Evidence for sources other than HFC/HCFCs. Environ. Sci. Technol. 1999, 33, 522–527. [Google Scholar] [CrossRef]
- Martin, J.W.; Mabury, S.A.; Wong, C.S.; Noventa, F.; Solomon, K.R.; Alaee, M.; Muir, D.C.G. Airborne haloacetic acids. Environ. Sci. Technol. 2003, 37, 2889–2897. [Google Scholar] [CrossRef] [PubMed]
- Zhang, B.Y.; Zhai, Z.H.; Zhang, J.B. Distribution of trifluoroacetic acid in gas and particulate phases in Beijing from 2013 to 2016. Sci. Total Environ. 2018, 634, 471–477. [Google Scholar] [CrossRef]
- Lu, K.; Hofzumahaus, A.; Holland, F.; Bohn, B.; Brauers, T.; Fuchs, H.; Hu, M.; Häseler, R.; Kita, K.; Kondo, Y. Missing OH source in a suburban environment near Beijing: Observed and modelled OH and HO2 concentrations in summer 2006. Atmos. Chem. Phys. 2013, 13, 1057–1080. [Google Scholar] [CrossRef]
- Kanaya, Y.; Cao, R.; Akimoto, H.; Fukuda, M.; Komazaki, Y.; Yokouchi, Y.; Koike, M.; Tanimoto, H.; Takegawa, N.; Kondo, Y. Urban photochemistry in central Tokyo: 1. Observed and modeled OH and HO2 radical concentrations during the winter and summer of 2004. J. Geophys. Res. Atmos. 2007, 112, D21. [Google Scholar] [CrossRef]
- Fang, X.G.; Wang, Q.; Zhao, Z.; Tang, J.H.; Tian, C.G.; Yao, Y.M.; Yu, J.C.; Sun, H.W. Distribution and dry deposition of alternative and legacy perfluoroalkyl and polyfluoroalkyl substances in the air above the Bohai and Yellow Seas, China. Atmos. Environ. 2018, 192, 128–135. [Google Scholar] [CrossRef]
- Pike, K.A.; Edmiston, P.L.; Morrison, J.J.; Faust, J.A. Correlation Analysis of Perfluoroalkyl Substances in Regional US Precipitation Events. Water Res. 2021, 190, 116685. [Google Scholar] [CrossRef]
- Taniyasu, S.; Kannan, K.; Yeung, L.W.Y.; Kwok, K.Y.; Lam, P.K.S.; Yamashita, N. Analysis of trifluoroacetic acid and other short-chain perfluorinated acids (C2–C4) in precipitation by liquid chromatography-tandem mass spectrometry: Comparison to patterns of long-chain perfluorinated acids (C5–C18). Anal. Chim. Acta 2008, 619, 221–230. [Google Scholar] [CrossRef] [PubMed]
- Scott, B.F.; Spencer, C.; Martin, J.W.; Barra, R.; Bootsma, H.A.; Jones, K.C.; Johnston, A.E.; Muir, D.C.G. Comparison of haloacetic acids in the environment of the northern and southern hemispheres. Environ. Sci. Technol. 2005, 39, 8664–8670. [Google Scholar] [CrossRef]
- Freeling, F.; Behringer, D.; Heydel, F.; Scheurer, M.; Ternes, T.A.; Nodler, K. Trifluoroacetate in Precipitation: Deriving a Benchmark Data Set. Environ. Sci. Technol. 2020, 54, 11210–11219. [Google Scholar] [CrossRef]
- Hartz, W.F.; Bjornsdotter, M.K.; Yeung, L.W.Y.; Hodson, A.; Thomas, E.R.; Humby, J.D.; Day, C.; Jogsten, I.E.; Karrman, A.; Kallenborn, R. Levels and distribution profiles of Per- and Polyfluoroalkyl Substances (PFAS) in a high Arctic Svalbard ice core. Sci. Total Environ. 2023, 871, 161830. [Google Scholar] [CrossRef]
- Cahill, T.M. Increases in Trifluoroacetate Concentrations in Surface Waters over Two Decades. Environ. Sci. Technol. 2022, 56, 9428–9434. [Google Scholar] [CrossRef]
- Cahill, T.M.; Seiber, J.N. Regional distribution of trifluoroacetate in surface waters downwind of urban areas in Northern California, USA. Environ. Sci. Technol. 2000, 34, 2909–2912. [Google Scholar] [CrossRef]
- Bjornsdotter, M.K.; Yeung, L.W.Y.; Karrman, A.; Jogsten, I.E. Mass Balance of Perfluoroalkyl Acids, Including Trifluoroacetic Acid, in a Freshwater Lake. Environ. Sci. Technol. 2022, 56, 251–259. [Google Scholar] [CrossRef] [PubMed]
- Nanusha, M.Y.; Frokjaer, E.E.; Liigand, J.; Christensen, M.R.; Hansen, H.R.; Hansen, M. Unravelling the occurrence of trace contaminants in surface waters using semi-quantitative suspected non-target screening analyses. Environ. Poll. 2022, 315, 120346. [Google Scholar] [CrossRef]
- Richey, D.; Driscoll, C.; Likens, G. Soil retention of trifluoroacetate. Environ. Sci. Technol. 1997, 31, 1723–1727. [Google Scholar] [CrossRef]
- Xiang, X.; Zheng, G.; Sheng, Z.; Wu, P. Multiphase mass transfer model on the accumulation of TFA in regional environments. Res. Environ. Sci. 2009, 22, 1108–1112. [Google Scholar]
- Zhao, M.S.; Yao, Y.M.; Dong, X.Y.; Baqar, M.; Fang, B.; Chen, H.; Sun, H.W. Nontarget Identification of Novel Per- and Polyfluoroalkyl Substances (PFAS) in Soils from an Oil Refinery in Southwestern China: A Combined Approach with TOP Assay. Environ. Sci. Technol. 2023, 57, 20194–20205. [Google Scholar] [CrossRef]
- Fismes, J.; Perrin-Ganier, C.; Empereur-Bissonnet, P.; Morel, J.L. Soil-to-root transfer and translocation of polycyclic aromatic hydrocarbons by vegetables grown on industrial contaminated soils. J. Environ. Qual. 2002, 31, 1649–1656. [Google Scholar] [CrossRef]
- Zhao, H.T.; Yang, L.P.; Yang, X.J.; Zhao, S.Y. Behaviors of 6:2 fluorotelomer sulfonamide alkylbetaine (6:2 FTAB) in wheat seedlings: Bioaccumulation, biotransformation and ecotoxicity. Ecotoxicol. Environ. Saf. 2022, 238, 113585. [Google Scholar] [CrossRef] [PubMed]
- Bjornsdotter, M.K.; Hartz, W.F.; Kallenborn, R.; Jogsten, I.E.; Humby, J.D.; Karrman, A.; Yeung, L.W.Y. Levels and Seasonal Trends of C-1-C-4 Perfluoroalkyl Acids and the Discovery of Trifluoromethane Sulfonic Acid in Surface Snow in the Arctic. Environ. Sci. Technol. 2021, 55, 15853–15861. [Google Scholar] [CrossRef] [PubMed]
- Wang, B.; Yao, Y.; Wang, Y.; Chen, H.; Sun, H. Per- and Polyfluoroalkyl Substances in Outdoor and Indoor Dust from Mainland China: Contributions of Unknown Precursors and Implications for Human Exposure. Environ. Sci. Technol. 2022, 56, 6036–6045. [Google Scholar] [CrossRef] [PubMed]
- Yu, N.Y.; Guo, H.W.; Yang, J.P.; Jin, L.; Wang, X.B.; Shi, W.; Zhang, X.W.; Yu, H.X.; Wei, S. Non-Target and Suspect Screening of Per- and Polyfluoroalkyl Substances in Airborne Particulate Matter in China. Environ. Sci. Technol. 2018, 52, 8205–8214. [Google Scholar] [CrossRef] [PubMed]
- Goosey, E.; Harrad, S. Perfluoroalkyl substances in UK indoor and outdoor air: Spatial and seasonal variation, and implications for human exposure. Environ. Int. 2012, 45, 86–90. [Google Scholar] [CrossRef] [PubMed]
- Karaskova, P.; Codling, G.; Melymuk, L.; Klanova, J. A critical assessment of passive air samplers for per- and polyfluoroalkyl substances. Atmos. Environ. 2018, 185, 186–195. [Google Scholar] [CrossRef]
- Guckert, M.; Scheurer, M.; Schaffer, M.; Reemtsma, T.; Nodler, K. Combining target analysis with sum parameters-a comprehensive approach to determine sediment contamination with PFAS and further fluorinated substances. Environ. Sci. Pollut. Res. 2022, 29, 85802–85814. [Google Scholar] [CrossRef]
- Neuwald, I.J.; Hubner, D.; Wiegand, H.L.; Valkov, V.; Borchers, U.; Nodler, K.; Scheurer, M.; Hale, S.E.; Arp, H.P.H.; Zahn, D. Ultra-Short-Chain PFASs in the Sources of German Drinking Water: Prevalent, Overlooked, Difficult to Remove, and Unregulated. Environ. Sci. Technol. 2022, 56, 6380–6390. [Google Scholar] [CrossRef] [PubMed]
- Sadia, M.; Nollen, I.; Helmus, R.; ter Laak, T.L.; Been, F.; Praetorius, A.; van Wezel, A.P. Occurrence, Fate, and Related Health Risks of PFAS in Raw and Produced Drinking Water. Environ. Sci. Technol. 2023, 57, 3062–3074. [Google Scholar] [CrossRef] [PubMed]
- UBA. Ableitung Eines Gesundheitlichen Leitwertes für Trifluoressigsäure (TFA). Available online: https://www.umweltbundesamt.de/sites/default/files/medien/421/dokumente/ableitung_eines_gesundheitlichen_leitwertes_fuer_trifluoressigsaeure_fuer_uba-homepage.pdf (accessed on 22 November 2023).
- Scheurer, M.; Nodler, K. Ultrashort-chain perfluoroalkyl substance trifluoroacetate (TFA) in beer and tea—An unintended aqueous extraction. Food Chem. 2021, 351, 129304. [Google Scholar] [CrossRef] [PubMed]
- Likens, G.; Tartowski, S.; Berger, T.; Richey, D.; Driscoll, C.; Frank, H.; Klein, A. Transport and fate of trifluoroacetate in upland forest and wetland ecosystems. Proc. Natl. Acad. Sci. USA 1997, 94, 4499–4503. [Google Scholar] [CrossRef]
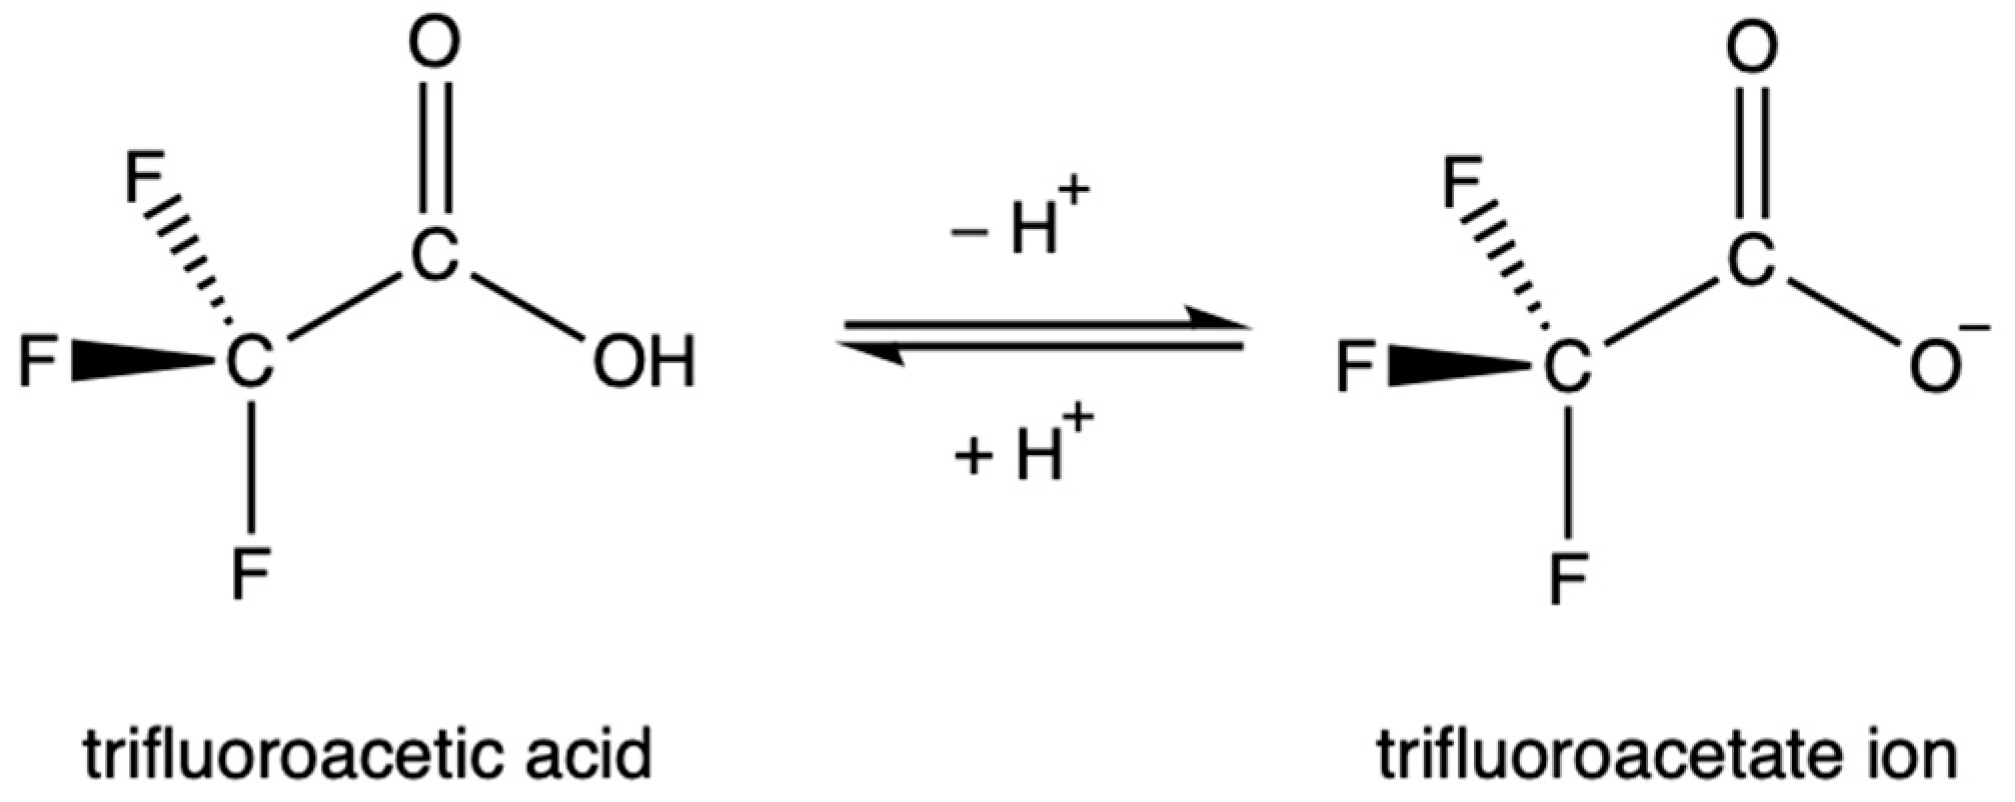

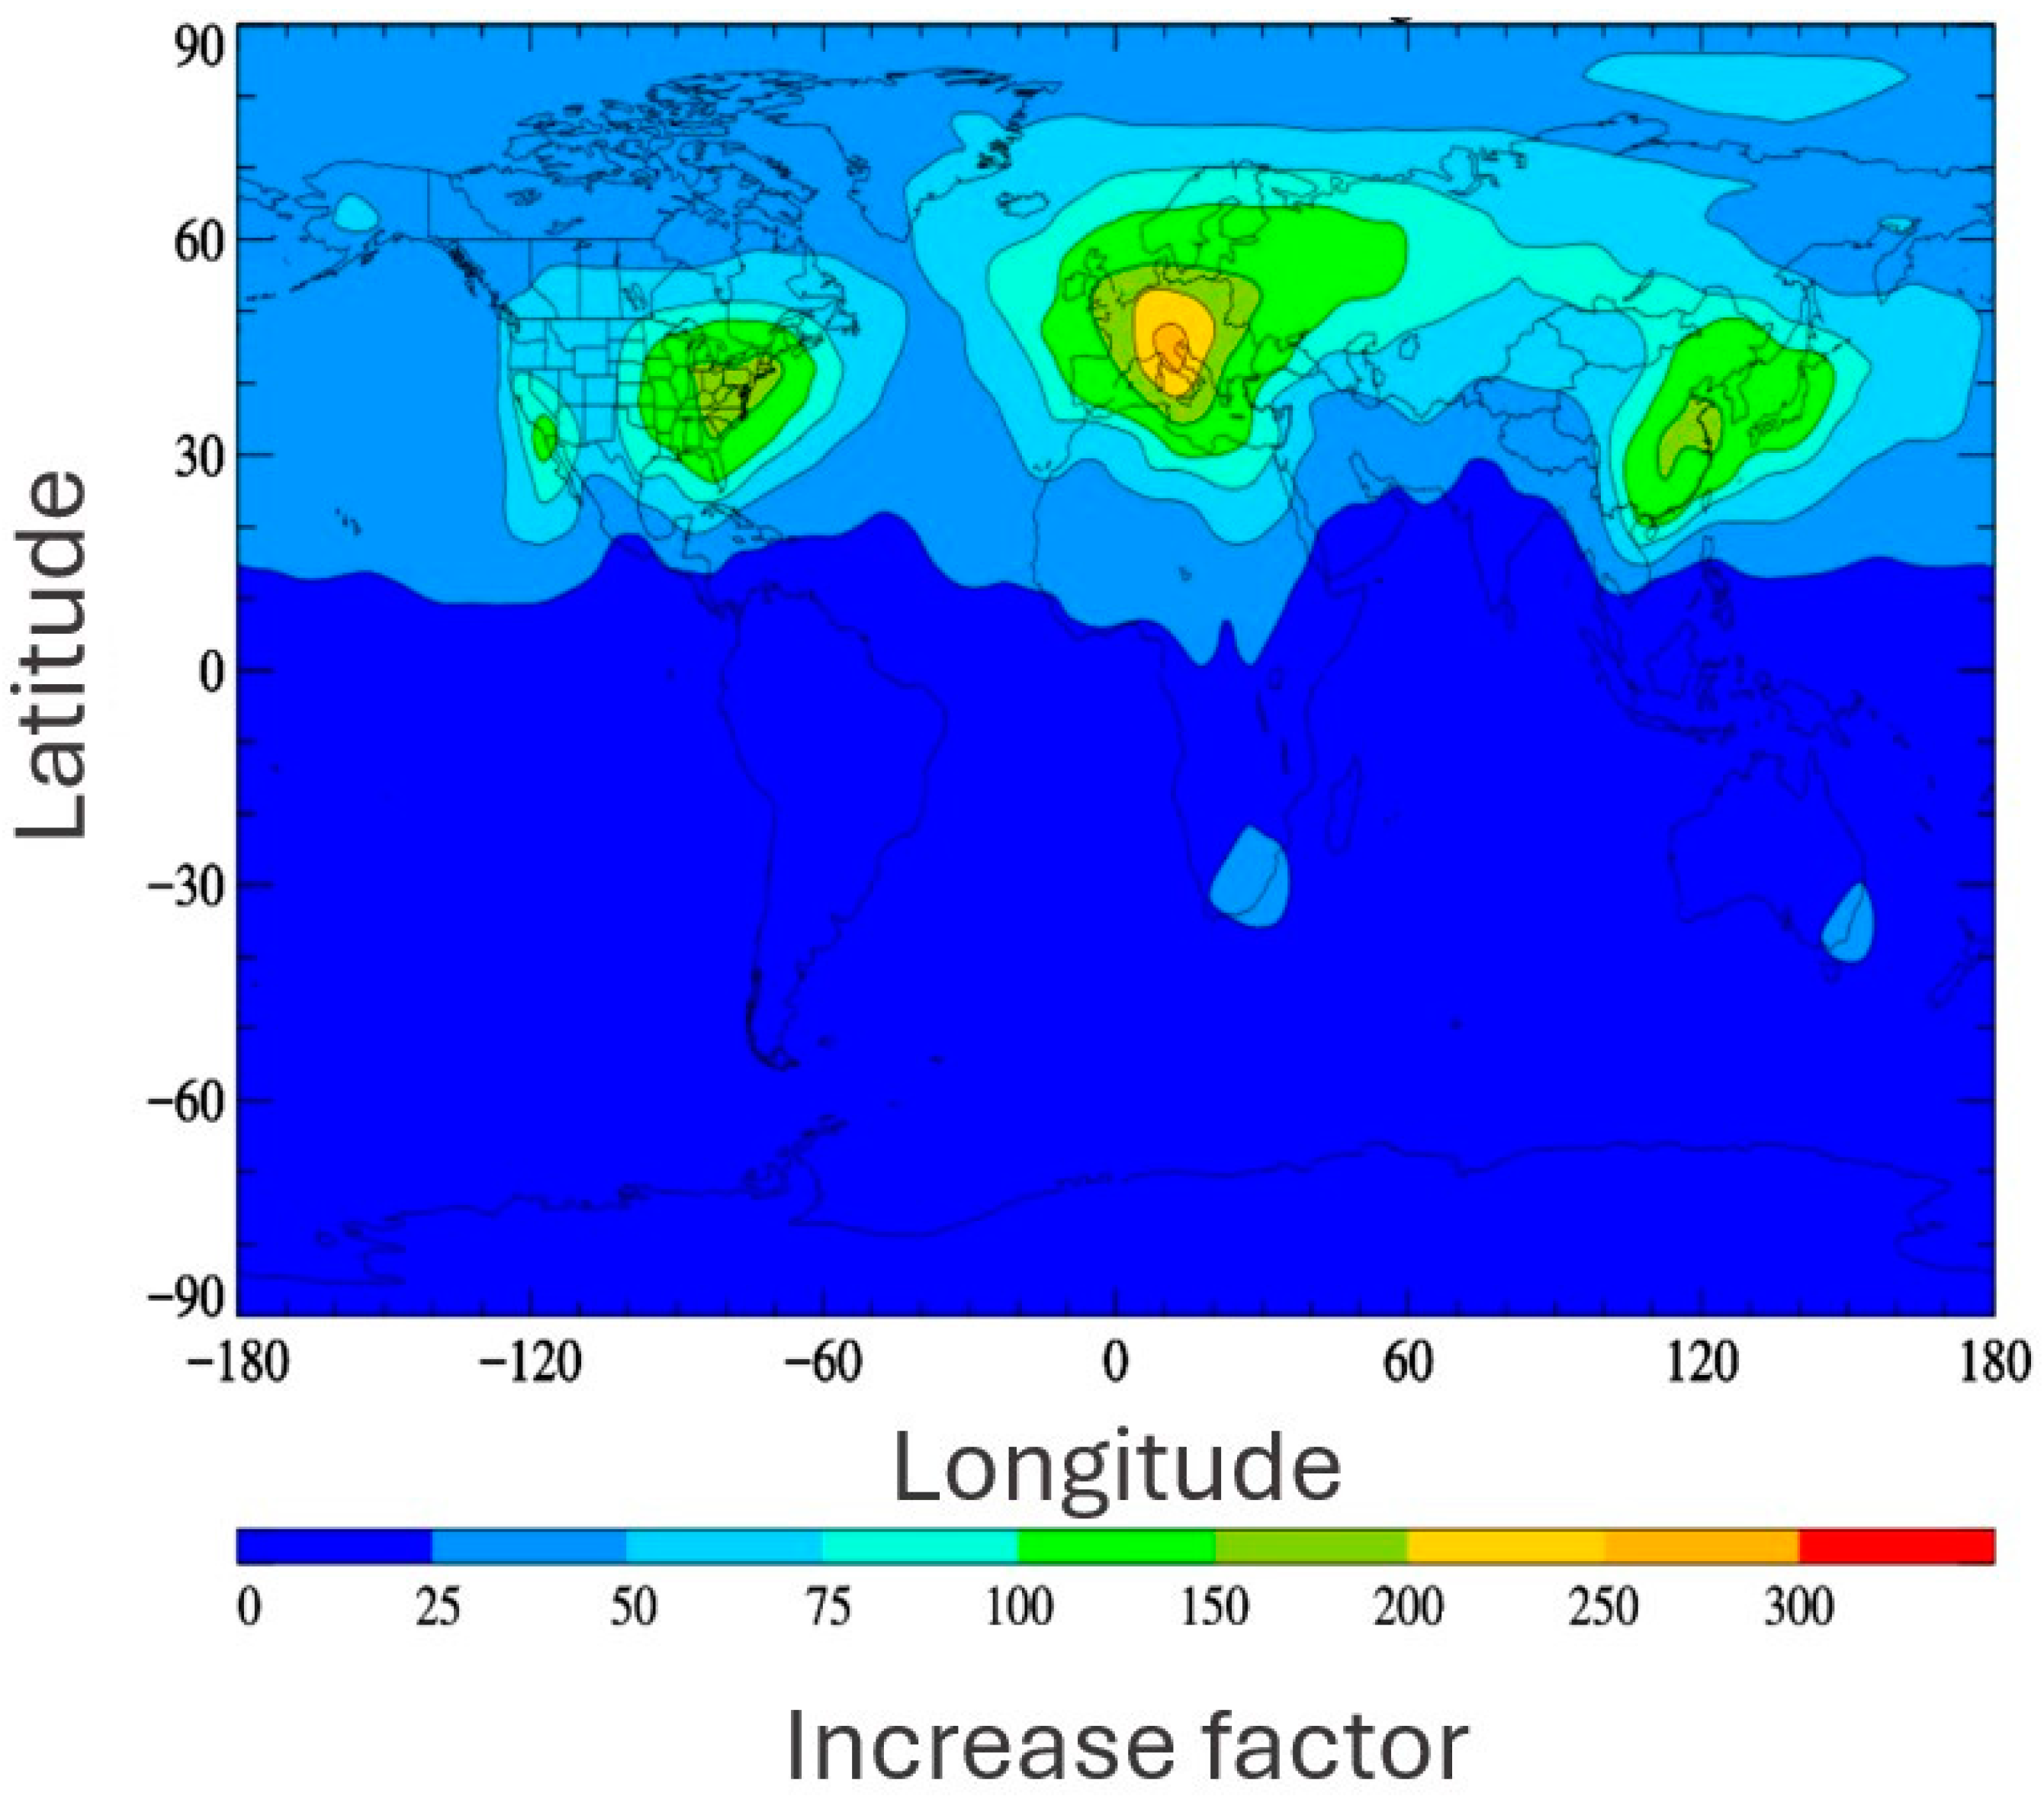
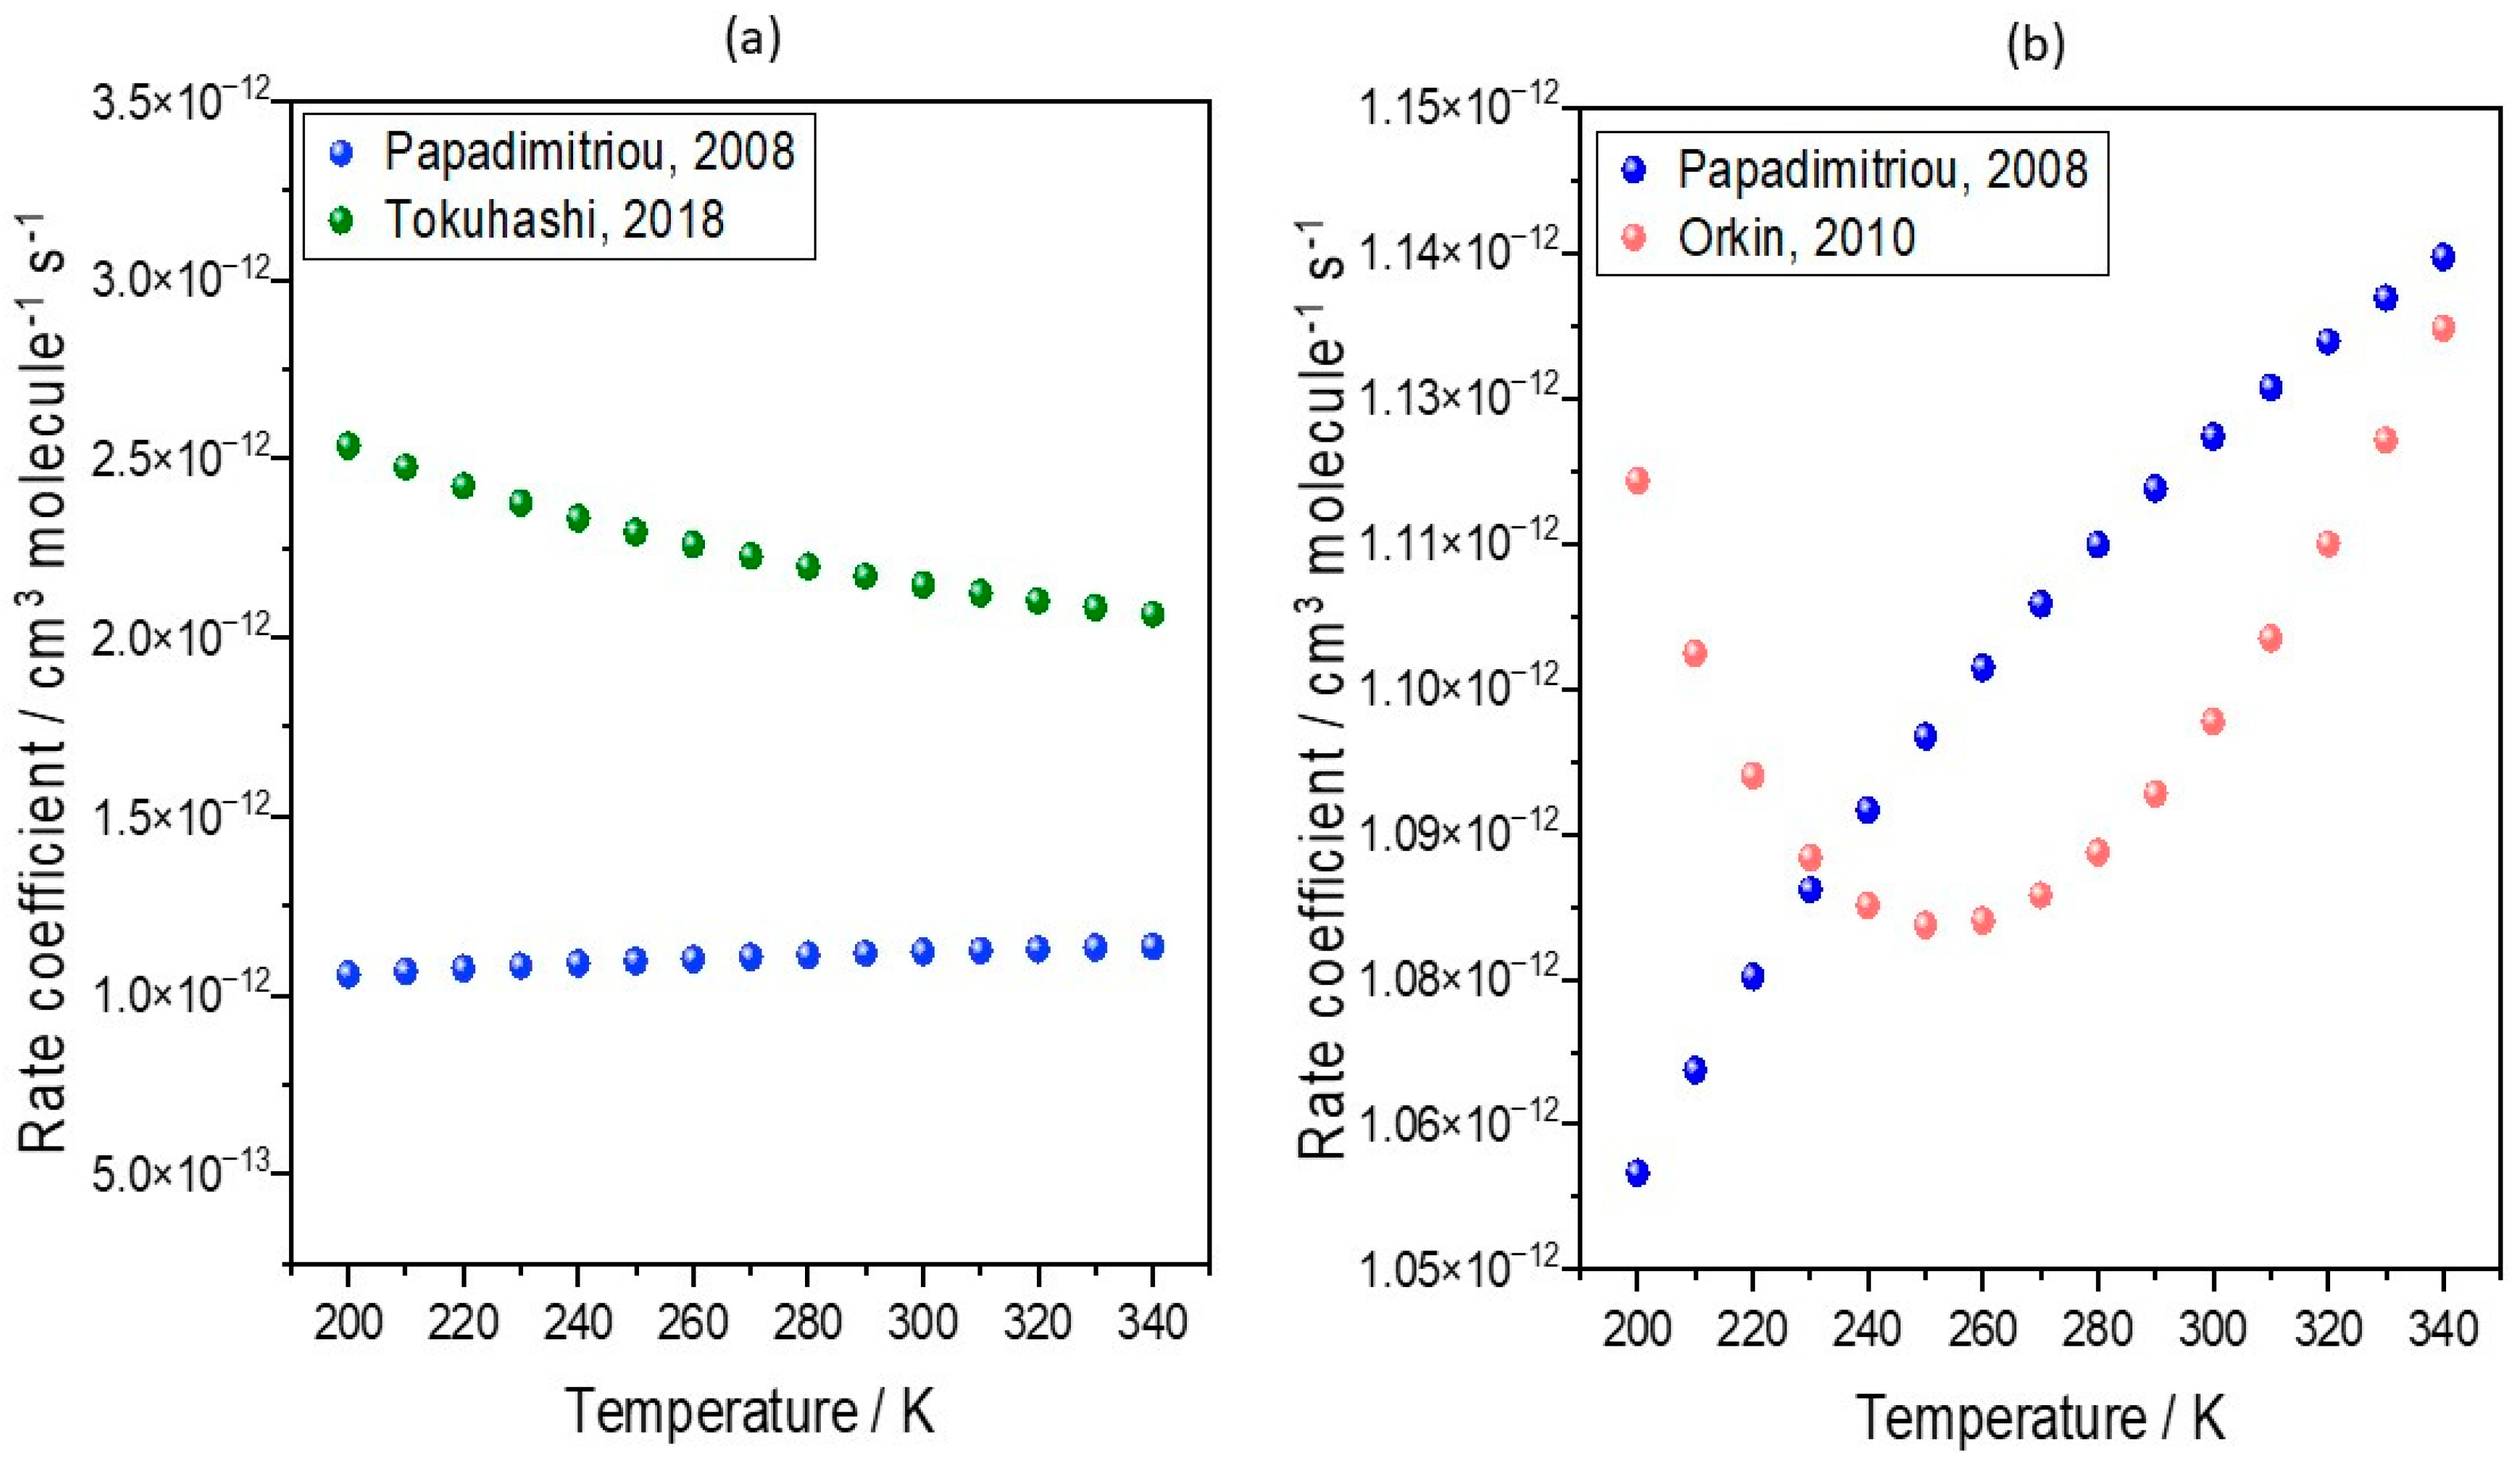
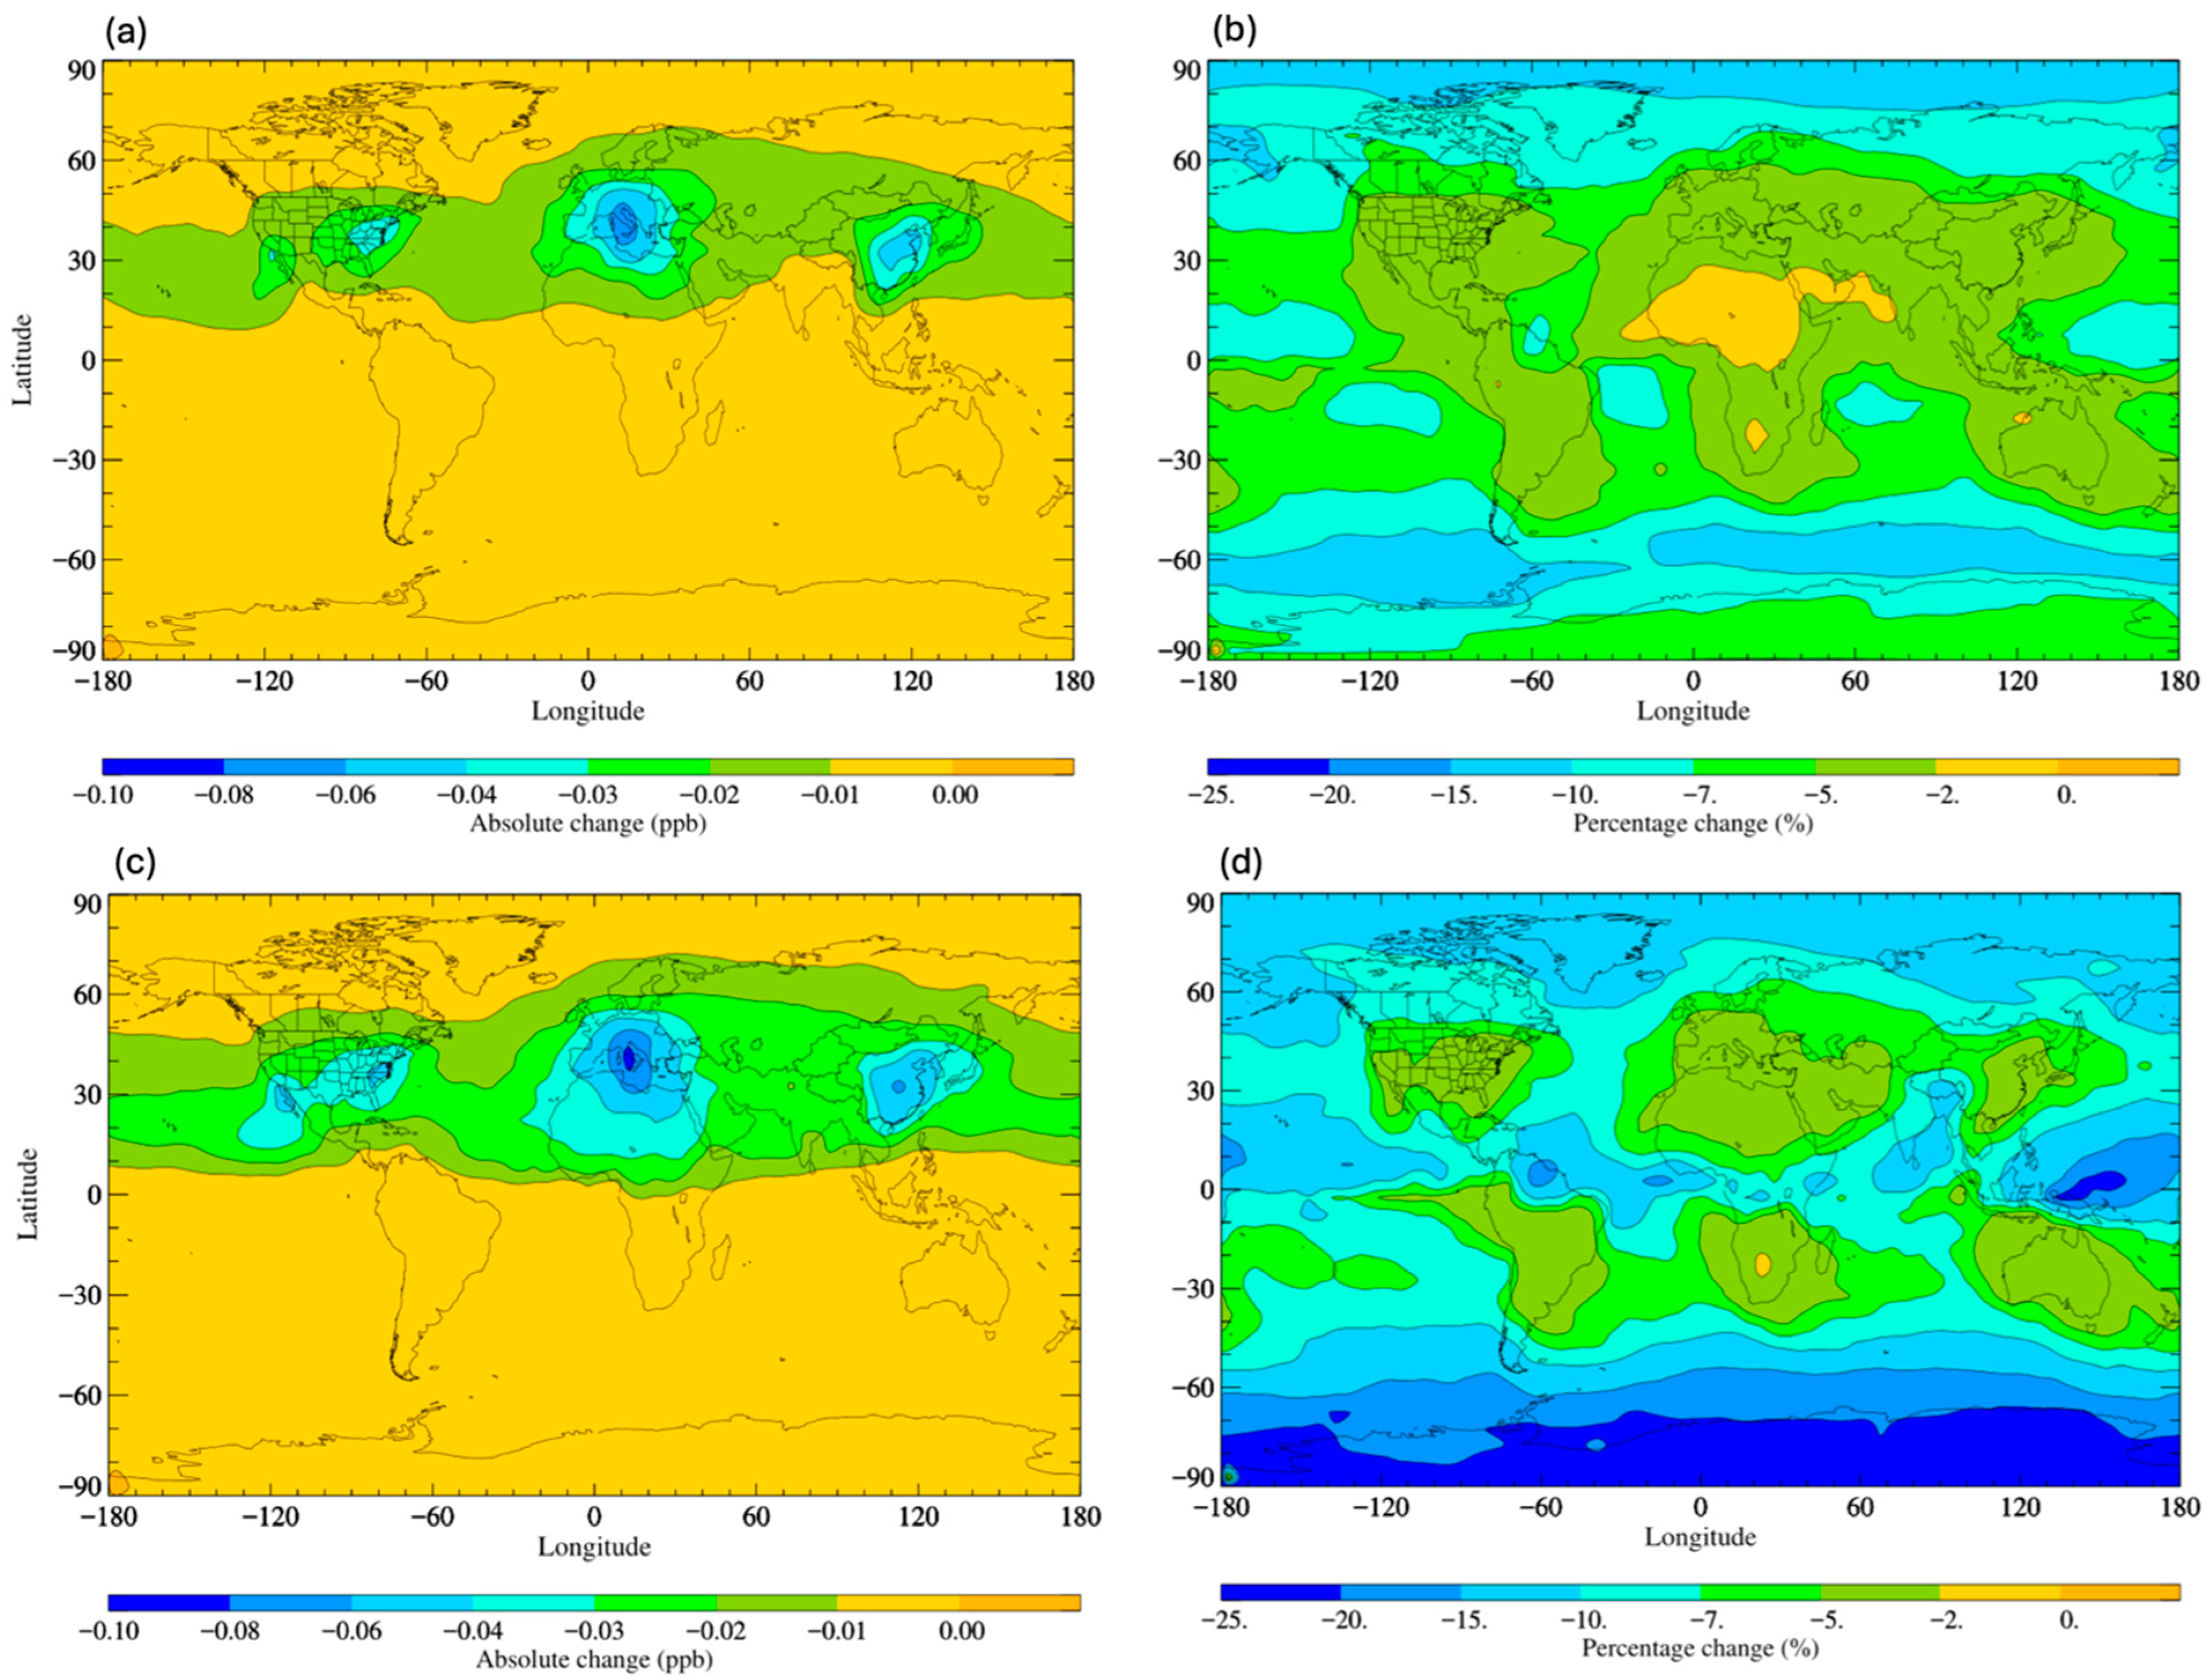
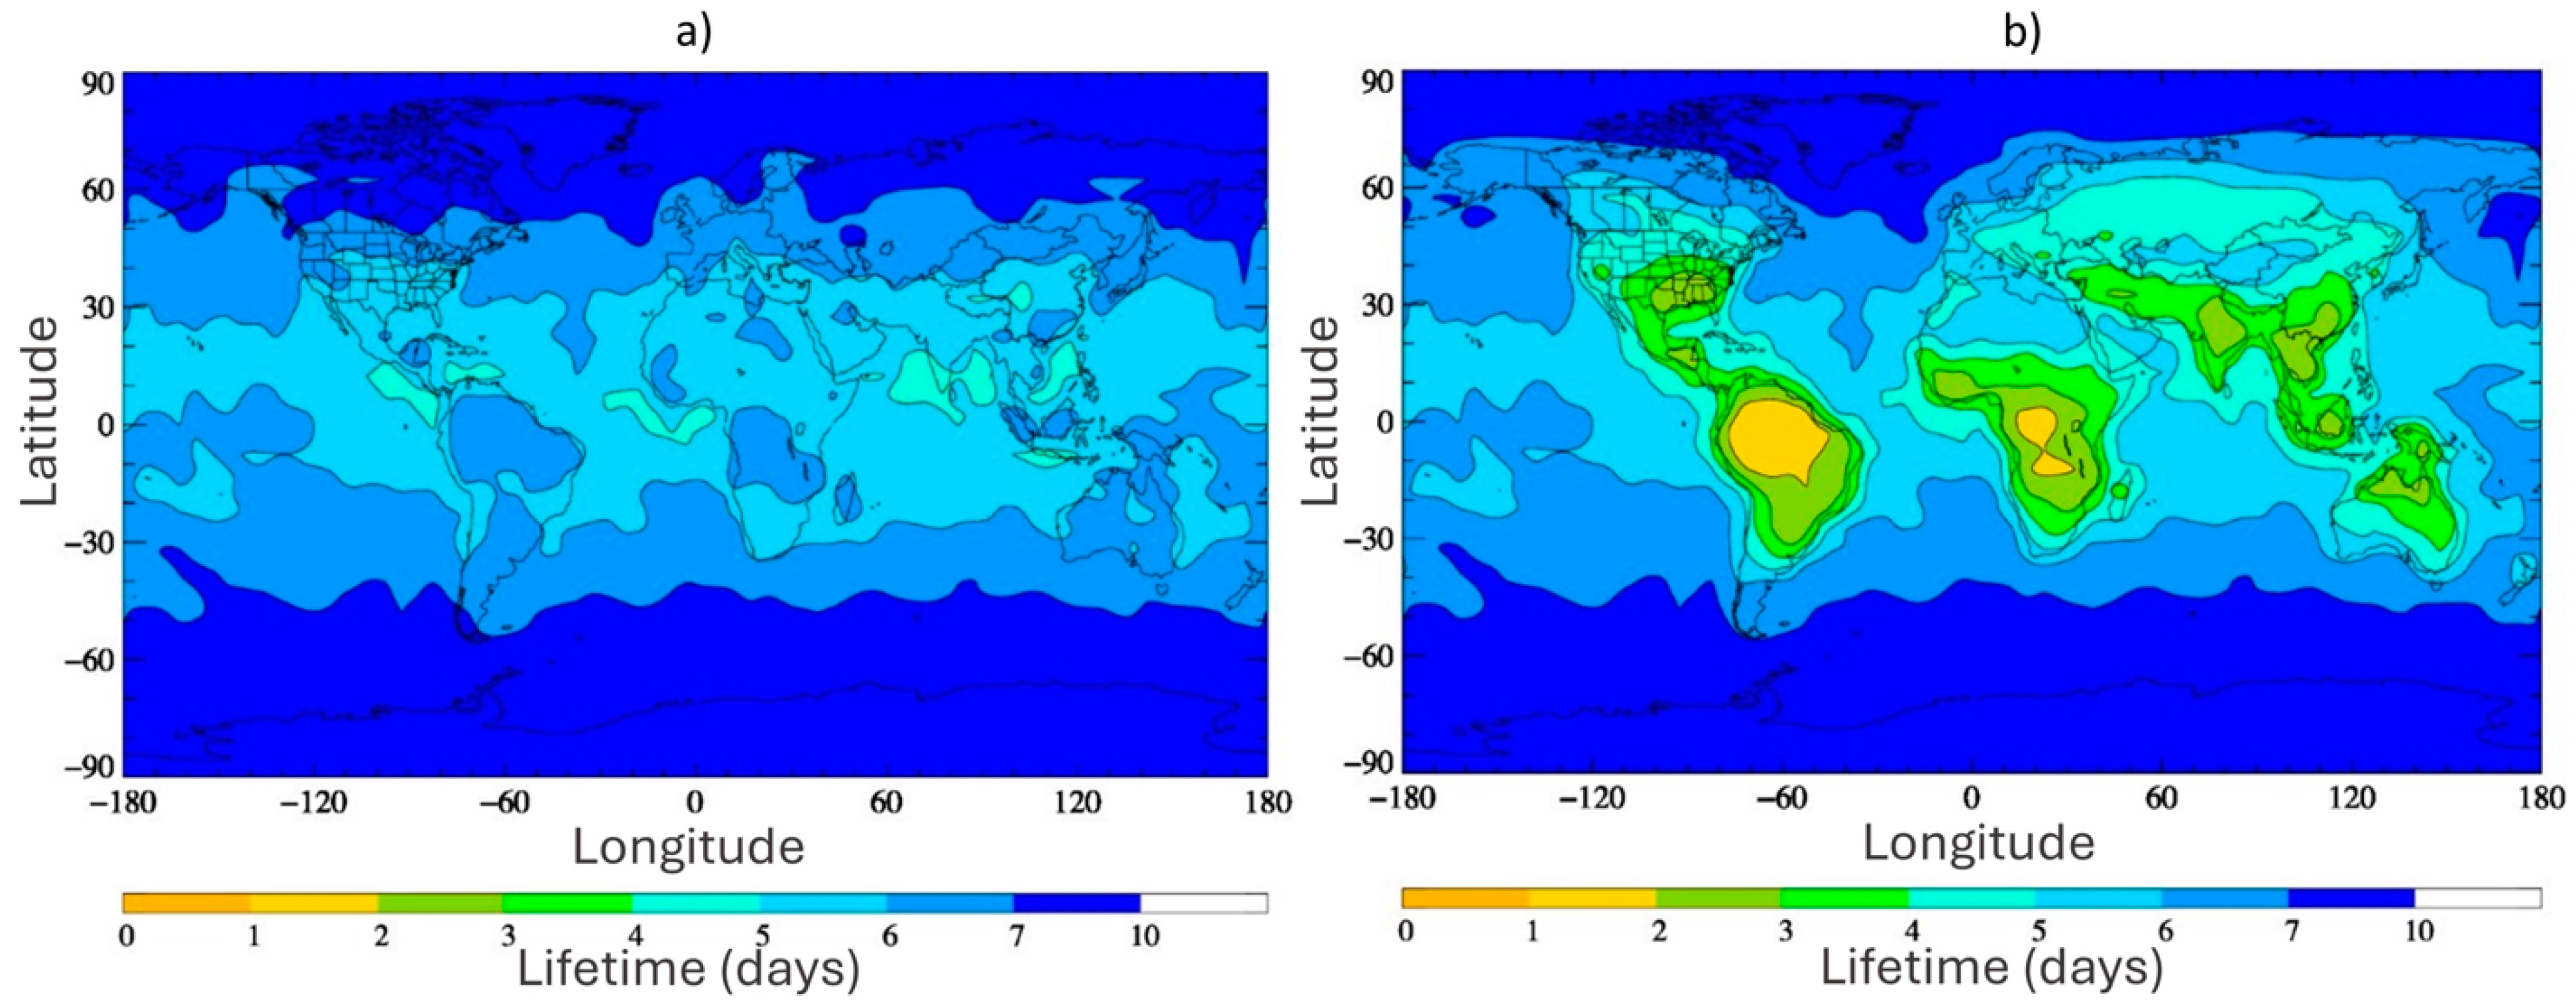
Disclaimer/Publisher’s Note: The statements, opinions and data contained in all publications are solely those of the individual author(s) and contributor(s) and not of MDPI and/or the editor(s). MDPI and/or the editor(s) disclaim responsibility for any injury to people or property resulting from any ideas, methods, instructions or products referred to in the content. |
© 2024 by the authors. Licensee MDPI, Basel, Switzerland. This article is an open access article distributed under the terms and conditions of the Creative Commons Attribution (CC BY) license (https://creativecommons.org/licenses/by/4.0/).