Abstract
Making decisions and building strategies to enhance the supply chain are currently essential if companies want to keep up with modern advances and compete in both the local and global markets. However, the coronavirus pandemic heightened the necessity for decision making and the adoption of strategies for supply chain improvement and transformation to effectively deal with crises and ongoing change. This paper introduces a framework for recovery strategies to characterize the correlation at various stages among the key concerns of the supply chain because of COVID-19, recovery decisions, the areas of development, the strategic recovery plan, and the objectives of the recovery strategies to restore the supply chain (SC). This study used a combination of quantitative and qualitative techniques to identify possible areas for supply chain improvement and rank viable solutions. A combined fuzzy ANP–fuzzy TOPSIS method is proposed to prioritize and rank the areas of improvement. The results indicate that digitization and the utilization of emerging technology play critical roles in supply-chain recovery from disruptions and different current and future SC changes.
1. Introduction
The world is fundamentally changing in the aftermath of the COVID-19 pandemic, a transformation that began before and will continue after the pandemic. If COVID-19 has taught us anything, it is that supply chains must evolve. Companies have planned supply chains such that materials are sourced from low-cost countries, the inventory is kept to a minimum at all times, and suppliers are squeezed to meet forecasts. That worked fine until a virus emerged that spread so rapidly and with such deadly consequences that it brought the entire world to a halt. The current strategy was and remains insufficient.
The problem is that most companies have not fully utilized their accumulated resources because they prioritize benefits over people. As supply-chain experts tasked with putting supply chains back together, companies must follow the steps in the correct order. They must invest in technology, processes, and organizational cultures that place people and the environment ahead of profits. Companies must plan and prioritize long-term solutions in the future. This is the only way for consumers, employers, cultures, and shareholders to prosper. If certain steps outlined here are followed, supply chains will become more flexible and resilient to disruptions. Supply chains will become more adaptable, allowing us to rapidly change direction in almost any situation, including a pandemic. The pandemic has highlighted the urgent need for strategic change and improvement in the supply chain, necessitating clear improvement plans and decision making.
Strategic recovery decisions should be employed for determining and prioritizing the areas of improvement to enable organizations to plan short- and long-term plans toward future supply chain (SC) resilience. For short term recovery, companies typically use fast recovery plans to balance supply and demand, plan demand and supply, and establish new norms while slow recovery plans are used for long-term recovery to minimize disruptions, improve responsiveness, and increase SC agility to unpredictable interruptions. FANP-FTOPSIS is used to evaluate recovery decisions and prioritize the areas of improvement that guarantee the effectiveness of future recovery. The main goal is to identify and evaluate SC recovery strategies to facilitate SC resilience’s new normal and face future crises. The objectives involve developing a recovery strategy framework that addresses pandemic-related SC concerns, strategic recovery decisions, improvement areas, a comprehensive recovery plan, and key recovery objectives.
The combined FANP-FTOPSIS technique is used to establish the relative importance of each criterion, create a system for ranking all options, and choose the best one while taking into account the experts’ subjective assessments and the difficulty of the decision-making process. The proposed framework helps facilitate selection and sort out the best areas for improvement.
The main challenges facing SCs include the demand–supply gap, technology issues, satiability, and enhancing resilience [1]. The pandemic will continue to impact businesses, necessitating technological, societal, and economic changes for competitiveness and future crises [2]. Decision support systems and recovery plans are crucial for managing demand and reducing the impact on SC sectors [3]. Future strategies include supply chain redesign, intelligent workflows, technology adoption, collaboration, diversification, and sustainability [4].
Businesses should review COVID-19 strategies, focusing on partnerships, to ensure the sustainability and survivability of SCs [5]. These include financial responsibilities, employee support, cross-functional group formation, and SC linkage [6]. Constant communication, collaboration, and information sharing are crucial for effective supply chain management [7]. A crisis strategy for SCs was crucial during COVID-19 to manage demand and supply [8]. Proactive decision making and reactive strategies enhance resilience [9]. Adaptation techniques, manufacturing flexibility, supply diversification, and backup supplier development are essential [10]. Decision-makers should evaluate and classify impacts to help recover from disruptions [11].
Previous research has paid little attention to the identification of appropriate strategies and decisions regarding recovery from disasters such as the coronavirus. Additionally, these decisions were not arranged according to the priority of their implementation by decision-makers in the supply chain. The arrangement of these priorities is a necessity to direct future planning and strategies towards the speed of recovery and minimize its impact in the future. What happened during the pandemic is a lesson for experts to make the appropriate decision regarding rearranging their priorities to ensure the continued flow of the supply chain and its stability and resilience against various changes.
Our research contributes by answering three questions: what are the decisions and strategies necessary to recover from crisis? What are the main areas of improvement? And how does one prioritize the implementation of the improvement since a company cannot implement all solutions simultaneously due to resource limitations? The research identifies and ranks recovery decisions required for SC resilience at short- and long-term specific targets for supply chain enhancements. To address complex issues, lessen the effect of subjectivity and ambiguity in the opinions of the experts and respondents, and reduce the pair matrix calculations, the merged fuzzy ANP–fuzzy TOPSIS technique was utilized. This study highlighted the link between the COVID-19 crises and supply chain recovery strategies, emphasizing visibility, technologies, continuity, block chain, and digitization for sustainable supply chains, aiding supply chain managers in mitigating crises. This is because SC recovery strategies improve economic growth, competitiveness, employment, efficiency, and resilience in sustainable logistics.
The remainder of the paper is organized into five main sections. Section 2 reviews the literature related to supply chains and COVID-19 in terms of the main worries, recovery decisions, and FANP and FTOPSIS concepts and applications. Section 3 introduces the framework for recovery strategies to compromise the recovery decisions, planning, objectives, and improvement strategies required to recover supply chains from the current and future crises. Section 4 introduces the combined fuzzy ANP–fuzzy TOPSIS methods used to evaluate the recovery decisions. Section 5 discusses the employment of the proposed method using a numerical analysis. Section 6 analyzes the results and suggests a direction for future research.
2. Literature Review
The coronavirus causes high global challenges resulting from lockdowns forced by governments, social distances, and other personal measures to minimize the spread of the COVID-19 infection [12,13]. It significantly increases the demand for medical equipment and products, causing SCs to stretch further than their capacity [14]. The pandemic eruption has significantly impacted healthcare supply chains, where failure in any part will cause great challenges for the SC health [15]. The multiple challenges resulting from the rise in demand, consumer problems, employee health, value chain, and quality of the finished goods have increased the global challenges [16]. The transportation of COVID-19 vaccines is crucial for ensuring safety, efficiency, and quality while mitigating risks [17]. Government lockdowns, intensified quarantine requirements, export restrictions, and the exchange rate have disrupted the logistics and production systems, SCs, and business operations locally, regionally, and globally [18,19]. SCs faced unprecedented situations as the global pandemic spread, leading to major changes in the GSCs. The situation highlights the vulnerability of supply chains [20].
The unbalances between supply and demand during the pandemic have created unique SC trends. Decisions need to be taken in a rapidly changing environment with unexpected disruptions [21]. COVID-19 shows new trends in SC resilience that should consider the integration of components of resilience, incorporation of transportation in SC modelling and SC model structure, and demonstration of information networks and decision structures [22]. The current major SC challenges include the demand–supply gap, technological issues, satiability, and building SC resilience [1]. The pandemic will continue to affect businesses in the coming years, and economic, societal, and technological changes will become necessary to stay competitive and survive future crises [2].
The COVID-19 pandemic emphasizes the significant role of supply chain risk management practices in enhancing resilience and robustness in the supply chain [23]. Improving supply risk management processes can enhance future supply chain risk and resilience management by synchronizing the supply chain with customer demand changes [24]. The concept of SC viability in risk management is expected to rapidly evolve owing to the growing global impact of the coronavirus [25].
Decision support systems with a recovery plan are necessary to manage the demand, control the effect, and reduce the impact on different SC sectors [3]. The future SC strategies that could help future resilience and overcome SC challenges include redesigning supply chains, creating intelligent workflows, relying on technology and dynamic response adoption, and developing a culture of collaboration, diversification and forward strategy, emphasizing SC sustainability [4].
Steps should be taken to mitigate the effects of COVID-19 on SCs and build resilience against future crises [26]. SC agility allows for timely and effective responsiveness to uncertainties and increases competitiveness [27]. With the COVID-19 pandemic, SCM, agility, entrepreneurship, and strategic management have brought an opportunity to the SCs [28]. During the pandemic, culture significantly affected the changes in prices and demand, and the purchasing probability was less impacted by the pandemic [29]. Cultural factors arose during the pandemic as certain social conditions were abused, leading to the hoarding and smuggling of many food and health products [30]. Strengthening cross-border trade facilities requires cultural understanding and information flow [31].
Supply Chain 4.0 can improve the performance of the industry by offering more opportunities and sustained supply [32]. SC4.0 utilizes industry 4.0 technologies such as smart sensors, big data analytics, 3D printing, IoT, cloud computing, block chain, and others. SC4.0 implementation is motivated by cost optimizations, demand and supply mismatches, and changes in customer requirements [32]. Industry 4.0 technologies can support the sustainable performance of an SC, overcome social challenges, and reduce the reliance on human labor [33]. Industry 4.0 technologies have the potential to satisfy customer needs during the pandemic and control and manage the COVID-19 crisis [34].
For SC survivability and sustainability, businesses require revisit strategies with a focus on partnerships for the period of COVID-19 from several perspectives such as supporting employees, financial obligations, forming cross-functional groups, and linking their SCs [5]. To simplify the decision-making process, remove non-value-adding activities, and create and maintain strong supply chain relationships, it is essential to streamline the flow of money, materials, and knowledge [6]. Continuous interaction, collaboration, and information sharing among partners are required to create an optimal and scalable network, eliminate any redundancy, and manage an efficient supply chain [7].
A disaster strategy for SCs is necessary to deal with variable demand and supply during a COVID-19 pandemic. SC performance strongly depends on the decision-making process and support managers for a proactive plan [8]. Reactive strategies increase the ability of SMEs to achieve SC resilience against the COVID-19 pandemic [9]. Adaptation techniques are required for maintaining SC viability in the face of a pandemic [10]. Strategies like manufacturing flexibility, diversifying the supply, and developing backup suppliers ensure significant constructive consequences for managing the effects of the COVID-19 pandemic in the SC. To recover from SC disruptions, decision-makers should evaluate and classify the impacts and develop strategies to help recover from the pandemic [11].
The analytic network process (ANP) is a general practice of the analytic hierarchy process (AHP) used in multi-criteria decision making analysis (MCDM). Fuzzy-AHP is used to rank the SC capabilities under the COVID effect [35]. The ANP constructs a decision problem as a network. The weights of the structure’s components are measured using a pairwise comparison technique, and the decision’s alternatives are then ranked. A MCDM technique is called the Technique for Order of Preference by Similarity to Ideal Solution (TOPSIS). The foundation of the TOPSIS is the idea that the alternative to be picked should be the one with the least geometric distance from the perfect solution and the one with the longest geometric distance from the ideal solution. The ANP is used to cluster the head selection of wireless sensor networks [36], evaluate housing quality [37], and select the optimal strategy for reducing risks in a SC [38]. The simplified fuzzy TOPSIS method is used to help decision-makers select the linguistic variables [39]. Furthermore, a fuzzy quality function is combined with a fuzzy TOPSIS to solve the problem of configuration management by selecting effective product configurations [40].
The hybrid ANP–TOPSIS technique is used to rank and select the optimal facility-layout [41], for sustainable supplier selection problems and for ranking options and avoiding further comparisons [42], to select knowledge transfer strategies for SMEs and ERP systems [43], to evaluate different criteria in a strategy selection procedure for ranking and the selection of a new product launch strategy [44], to assess supply chain alternatives in light of COVID-19 [45], and to choose the best auto supplier [46]. Hybrid fuzzy ANP–TOPSIS qualitative and quantitative techniques are used to select the best suppliers [47]; reflect the vague nature of the selection process; and help decision-makers select projects [48], evaluate suppliers of carbon based on their performance and management processes [49], and make decisions and select the optimal service apartment location [50].
The ANP is a technique that can both connect the factors’ dependence on one group (inner dependence) and on other groups (outer dependence) as well as analyze the fuzzy interactions between the factors. Complex interrelationships between decision levels and attributes are supported by the ANP. The process has limitations such as needing lengthy brainstorming sessions for attribute identification, time-consuming data acquisition, and more computations than the AHP process. The TOPSIS method is a straightforward, effective, and widely used technique for solving real-world problems. It eliminates uncertainty and ambiguity in the selection process although it cannot consistently check for judgments or weight elicitation. In our study, we considered that the best way to apply expert opinions during the evaluation process was to use the integrated fuzzy ANP–TOPSIS approach. It uses a qualitative methodology; thus, the outcomes show each alternative’s advantages and disadvantages.
Previous studies examining the impact of the coronavirus on the supply chain are numerous. These studies dealt with various fields and topics that covered many of the logistics systems. However, such a pandemic is a suitable opportunity to improve a supply chain’s resilience and ensure its stability in the future. Decision-makers are in urgent need, more than ever, to analyze and study the causes of disruptions in supply chains and develop strategies to solve them or reduce their impact. However, little has been done to investigate the recovery decisions, areas for improvement, and restoration strategies of the supply chains during and after the impact of the coronavirus. Additionally, limited work has focused on return-to-normalcy strategies. In addition, no studies have been found to arrange the recovery decisions based on their implementation priorities. To cover these gaps, this paper will define, analyze, and prioritize the SC recovery strategies using the integrated MCDM method. The proposed merged FANP-FTOPSIS technique used was based on decision-makers’ subjective assessments based on fuzzy notions to reflect the nebulous nature of the selection process. Compared to fuzzy ANP, fuzzy TOPSIS demands less judgment from decision-makers; therefore, the combined technique, which includes fuzzy ANP and fuzzy TOPSIS, is utilized. The fuzzy weights of the criteria and sub-criteria are determined using fuzzy ANP. Areas of improvement are ranked using fuzzy TOPSIS according to the criteria. To illustrate how the suggested method can be used, the integrated approach is applied to a real numerical case.
Supply-chain experts must invest in recovery strategies and prioritize resources and future improvements. These will lead to more flexible, resilient, sustainable, and adaptable supply chains, enabling quick changes in situations such as pandemics. Strategic recovery decisions are crucial for organizations to plan short- and long-term plans for future supply chain resilience. Fast recovery plans balance supply and demand while slow plans minimize disruptions and increase agility. A recovery strategy model is crucial to evaluate recovery decisions, aiming to facilitate resilience and sustainability, establish a new normal, and face future crises.
3. Research Methodology
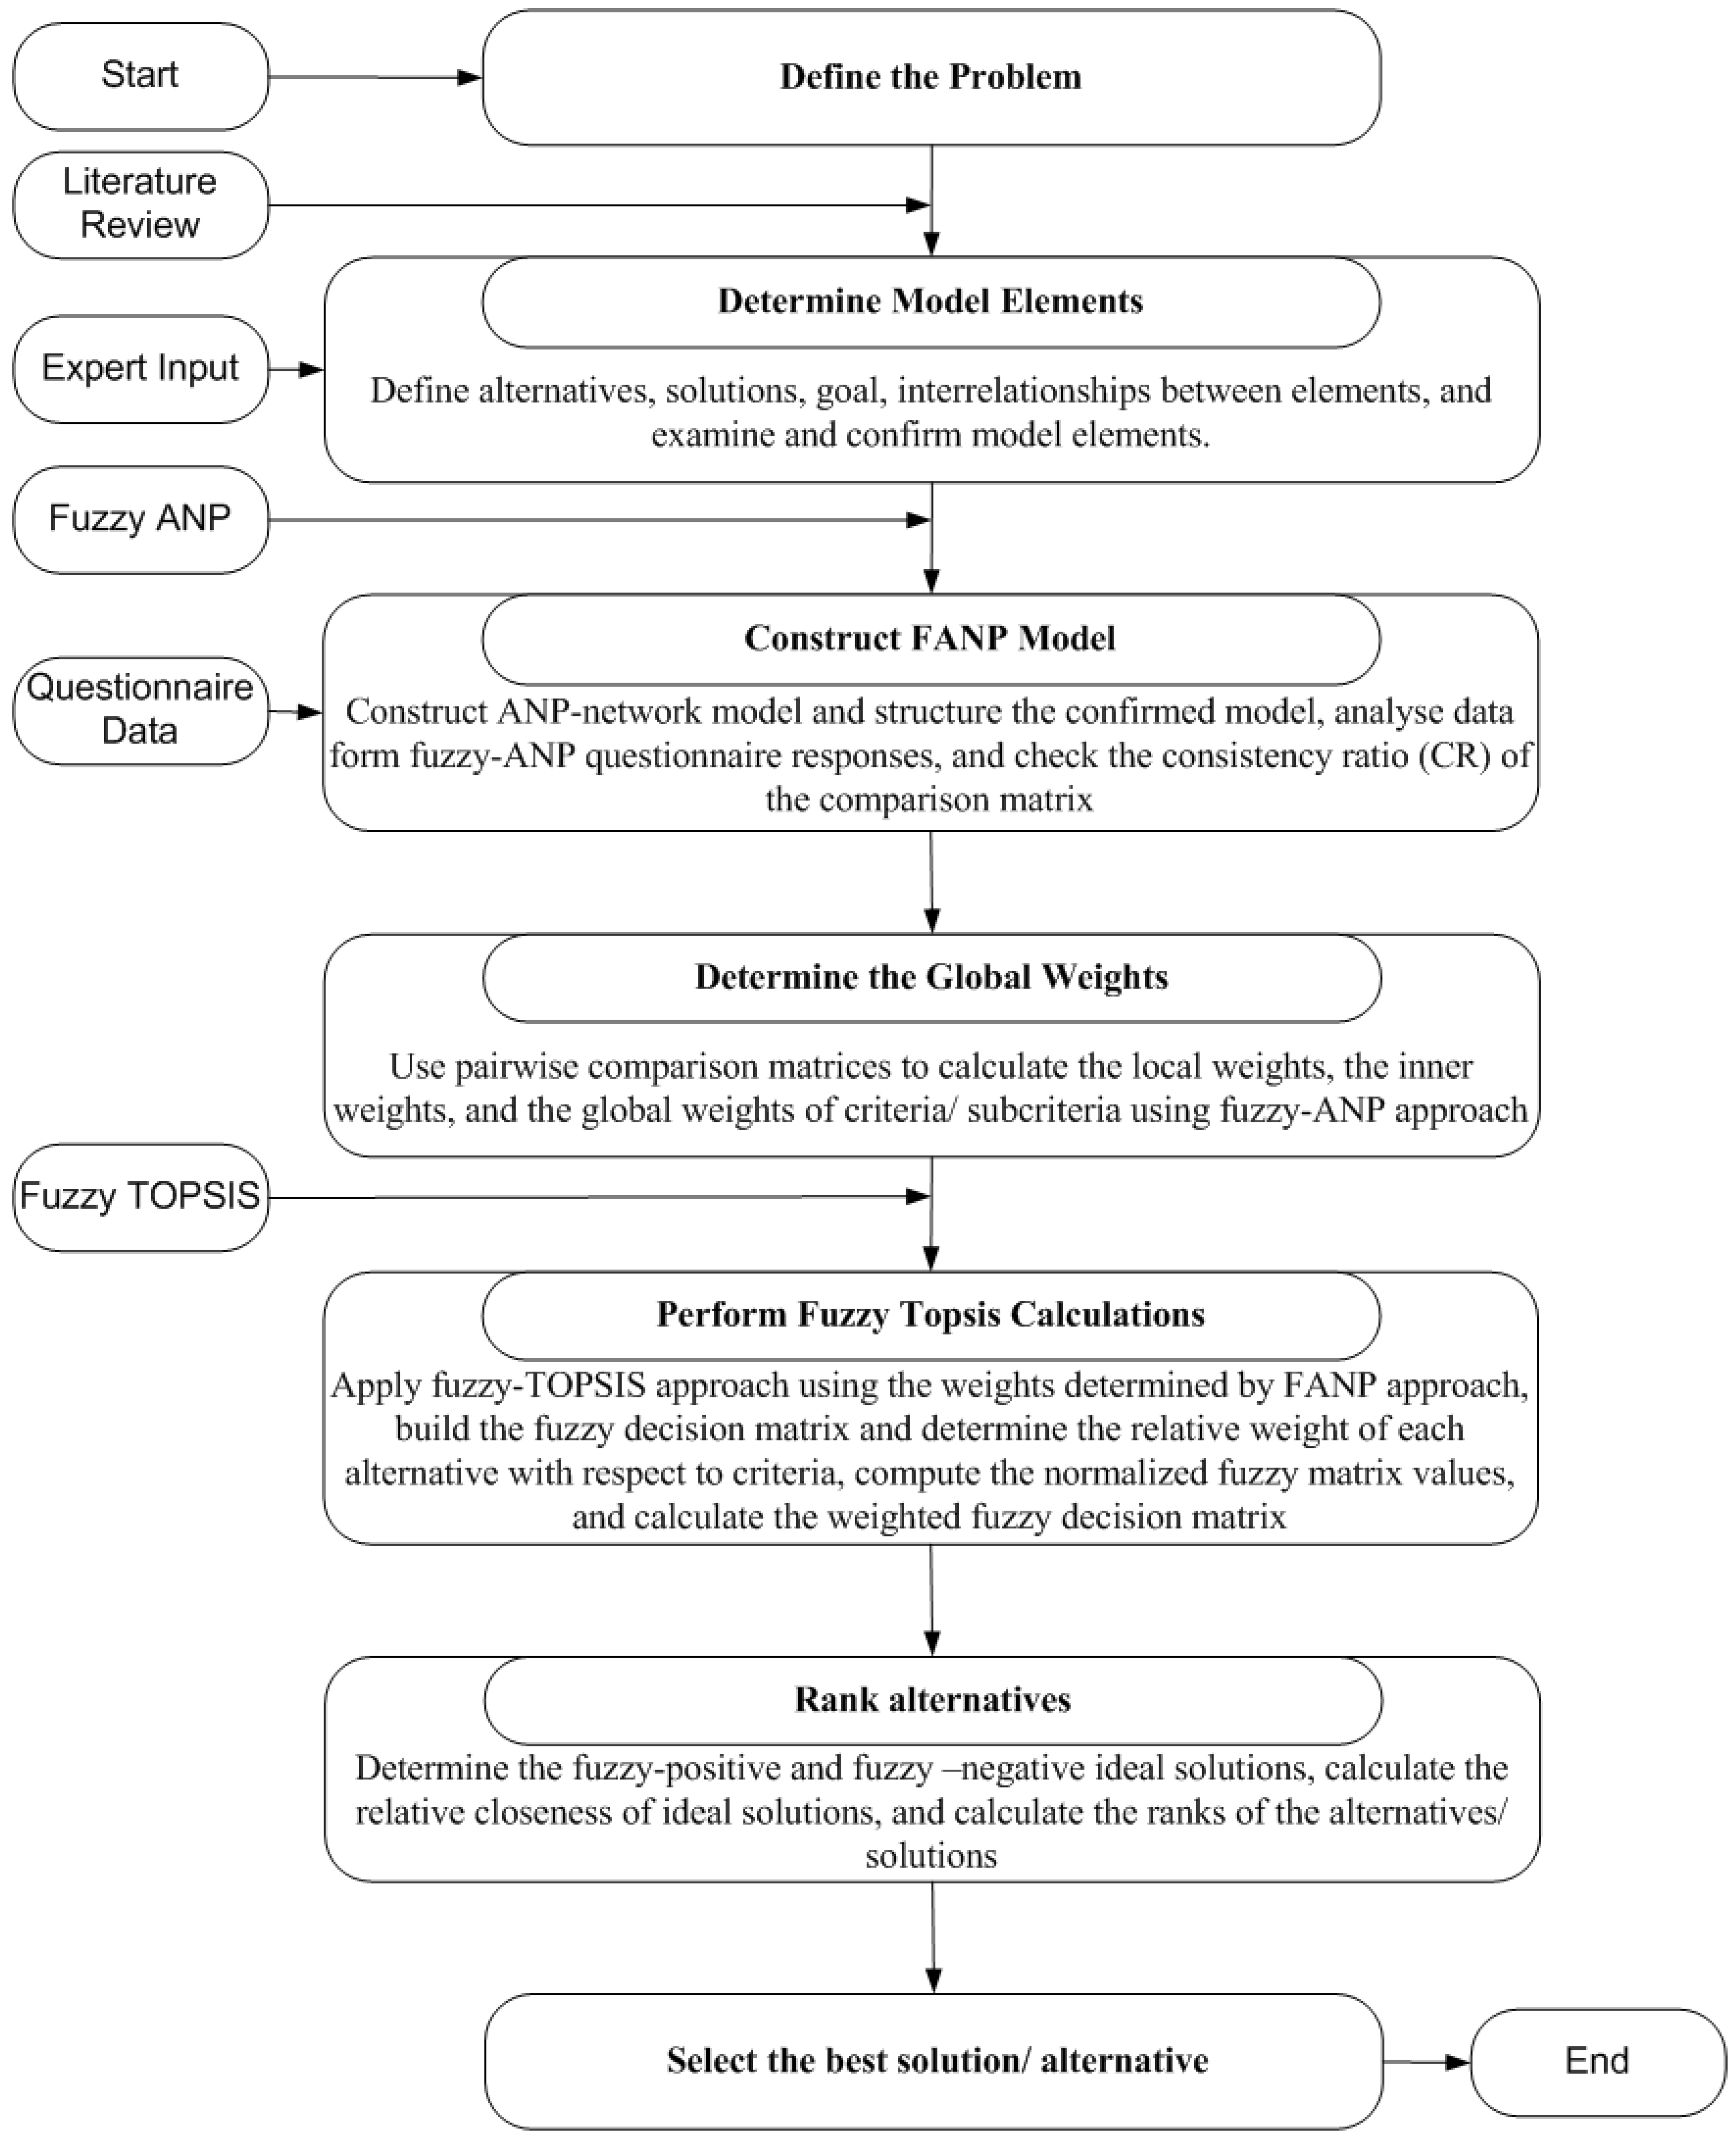
Research methodology, as shown in Figure 1, comprises six main stages, starting with investigations of the previous studies about the impact of COVID-19 on SCs, recovery decisions in the short and long term, and MCDM techniques. The results of stage one, combined with experts’ opinions, are utilized to define the main model components, including SC disruptions, challenges, trends, and areas for improvement. Questionnaire and expert panels are used to determine the criteria and recovery decisions such as enhancing partnerships, adopting SC 4.0, developing SC agility and flexibility, cultural change, and revising SC strategy. Subsequently, a framework for recovery strategies is developed. In stage six, the framework is used to rank and prioritize the implementation of areas of enhancement. Finally, the results are analyzed, and the concluding remarks and future directions are discussed.
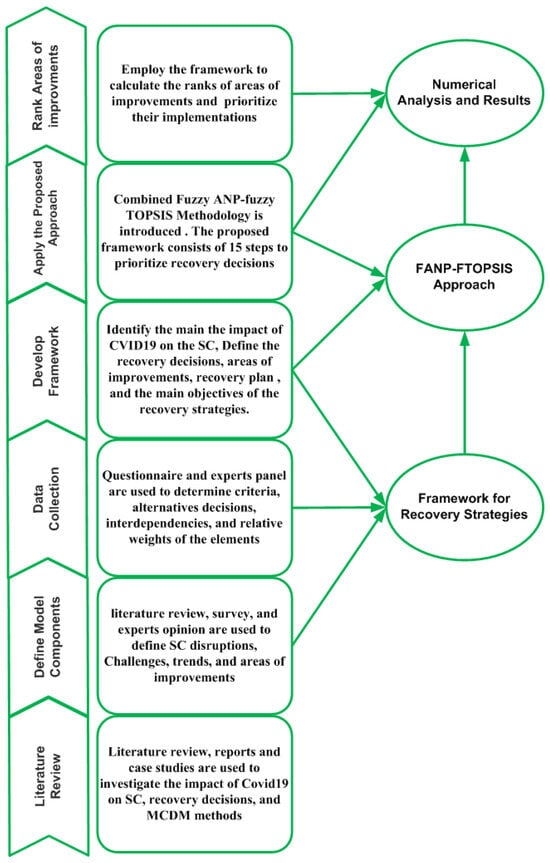
Figure 1.
Research methodology.
To select areas for improvement, a decision-making team was formed. The team included five experts, including senior logistics and supply chain managers, university professors, industry experts, and an external consultant. The experts were from different sectors, including the industrial, pharmaceutical, agricultural, and food sectors, and their experience spanned more than twenty years in the field of supply chain studies. A literature review and a brainstorming session were used to establish the initial requirements (criteria and alternatives). The members of the decision committee decided to dispose of three criteria from the list: disruptions, challenges, and trends. Each criterion comprised several sub-criteria. For the criteria cut-offs, first, each decision-maker filled out a questionnaire to assess the level of importance of each criterion using a 9-point scale, where 9 was the most important and 1 was the least important. Based on all the individual answers, a calculation was performed using the equations and procedures introduced by the proposed methodology.
4. Recovery Strategies
Companies should consider both the long-term viability of their company in addition to short-term disruption when planning their recovery as well as retaining expertise while working from home and allowing for part-time jobs. Disruptions can also be used to force tough business decisions such as reorganization or the abolition of underperforming products and customers. To do so effectively, organizations must first identify all areas where supply chain improvement opportunities exist and then prioritize these potential solutions using a variety of quantitative and qualitative methods. Then, they must use the information to secure funding for the implementation. SC decision-makers should think about how big each change is and conduct a root-cause analysis using the information collected to identify and record the main issues impacting supply chain results, create recovery decisions to concentrate efforts on the prospects with the highest market impact, and change strategies to accomplish specific objectives that become essential to enhance supply-chain collaboration and improve visibility and velocity.
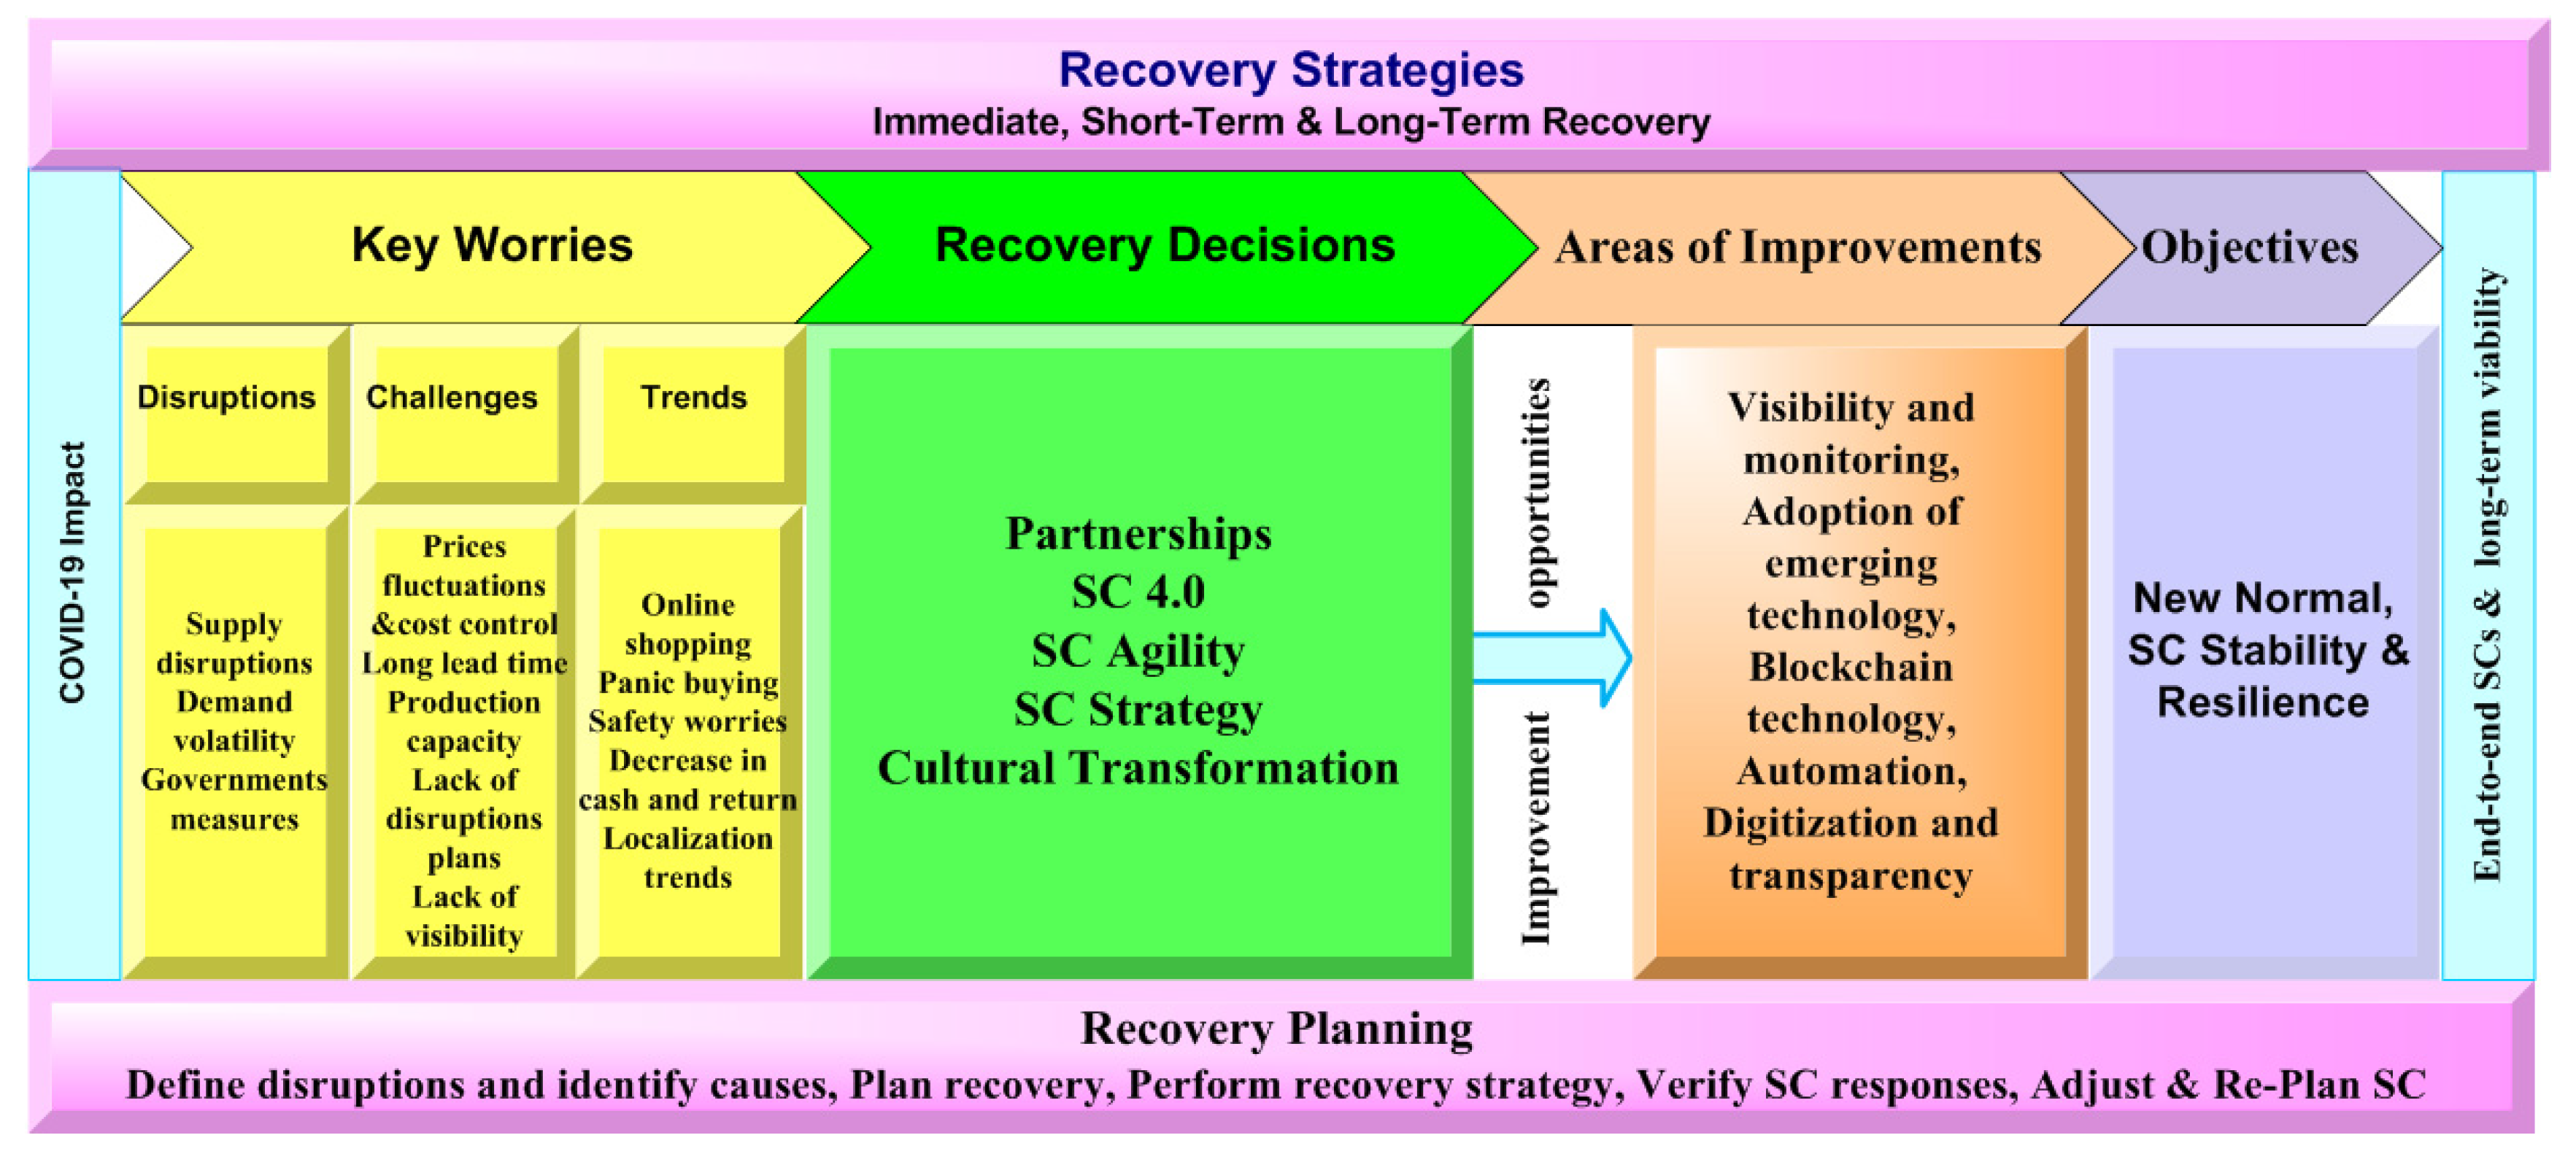
The recovery strategies framework contains, as shown in Figure 2, the main parts that represent the main SC worries that resulted from the pandemic: the strategic recovery decisions, the areas of improvement, the strategic recovery plan, and the key objectives of the recovery decisions. It also shows the interrelationship between these parts in order to restore the supply chain after the occurrence of the pandemic at various stages.
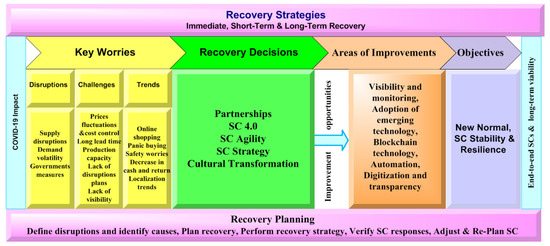
Figure 2.
Recovery strategies: framework.
The supply chain can be subject to disasters, changes, or events that affect it directly and may lead to a disruption in its operations. Crises and interruptions depend on the type, size, and extent of the supply chain and its global spread. The main SC worries resulting from COVID-19 included disruptions, challenges, and SC trends. Each of these worries and their causes are used as criteria and sub-criteria in the numerical analysis. The areas of improvement are arranged in the case study section using the integrated proposed methodology. Details of these factors (key worries and areas for improvement) are discussed in Table 1. The strategic recovery decisions included partnerships, supply chain 4.0, SC agility, SC strategies, and cultural transformation. Recovery strategies are identified in three phases: immediate, short-term, and long-term recovery strategies. Instant recovery represents the action that needs to be taken immediately once the event occurs to reduce the overall shock on the SC. Short- and long-term recovery characterize the actions, plans, and strategies to be considered in both the short and long run to achieve SC stability and responsiveness. The impact of the pandemic on supply chains has not all been bad; however, some things can be positive and represent real opportunities to develop, prepare, and improve the performance of the supply chain to face future crises. The recovery plan consists of five main phases that are required to reach the new normal. These steps comprise defining disruptions and identifying their causes, planning recovery, performing recovery strategies, verifying SC responses, and adjusting and re-planning SCs to quantify various risk reduction strategies for resilience. The main objectives of the SC recovery strategies are to reach a new normal and ensure SC stability and resilience while considering the whole supply chain and long-term viability.

Table 1.
Model elements and definitions.
4.1. Partnerships
The SC is the part of a business that is most affected by the trend toward a globalized environment. The right SC design is needed to handle the changes brought on by globalization. Relations with suppliers, customers, and other partners and the diversification of supply/sources are key to the future success of SCs. Companies are realizing that outsourcing parts of their supply chains can be advantageous. Having a responsive SC requires relying on the organization’s internal strengths, products that must be outsourced, and using innovative technology [13].
The need for partnerships increases as supply chains change and expand. Beyond linking information systems, the extent of integration extends to fully incorporating business processes and organizational structures through the entire value chain of organizations. The main purpose of collaboration is to increase visibility across a supply chain so that better decisions can be taken and, as a result, SC costs can be reduced. When the right tools, processes, and people are in place, cooperation provides decision-makers and executives in the value chain with the expertise they need to make business-critical decisions using the best available information [7].
Typically, a business would look for the cheapest sources for products. In a supply chain, cooperation and data sharing are important. Supplier networks should be built on a common platform to build more resilient supply chains. Partnership management should develop appropriate metrics, communicate those metrics, form relationships, establish positive interactions, and instill trust. Success partnerships include collaborative planning, forecasting, replenishment, creative product design, and cost-cutting innovations [45].
To strengthen partnerships, companies should develop a supply chain strategy that considers social, financial, and geopolitical risks; consider outsourcing and development models with several nodes; increase supply chain redundancy for essential goods; work with partners and industry counterparts to establish data sharing standards; and accept new partnerships.
4.2. SC 4.0
The introduction of digitalization and process automation has changed the entire SCM system. Digital technologies provide significant benefits in terms of inclusive growth patterns, imagination, and entrepreneurship opportunities. Digital technologies are changing the world, allowing the integration of supply chain management as information flows in several directions (known as SC 4.0.). Additionally, automation allows for a faster speed to be achieved. As the data are changed automatically and pattern changes are identified automatically, it is possible to automate warnings and disruptions [32].
Supply Chain 4.0 uses Industry 4.0 technologies to streamline supply chain processes, activities, and relationships, resulting in significant strategic benefits for all supply chain stakeholders. As supply chains produce more data from their operations, improving accuracy will become increasingly important. Supply Chain 4.0 has ushered in a new generation of performance management systems capable of offering real-time and end-to-end insight across supply chains. With delivery times as short as a few hours, Supply Chain 4.0 will be more effective. Forecasting and predictive analytics, which can take into account market conditions, climate, holidays, structure projects, and other variables to provide an accurate prediction of customer demand, are used to make faster deliveries.
SC 4.0 with the use of AI can help organizations convert unstructured real-time data into predictions that can help predict disruptions and vulnerabilities in the near future. This allows supply chain professionals to have reliable and actionable data to respond quickly. Artificial intelligence can be used by supply chain practitioners to optimize orders based on factors like inventory reallocation and prioritization. This helps teams respond more efficiently and save time spent collecting data previously, enabling them to focus on higher-value work [33,34].
The pandemic has demonstrated a variety of ways for companies to effectively collaborate and manage the SC working environment. Supply chains in the future will be much more adaptable and flexible. Real-time planning can allow this versatility by making it easy to respond to changing demand or supply situations. Frozen phases and planning periods can be shortened, and planning can become a continuous process that adapts to evolving requirements.
4.3. SC Agility
In all stages, good decision-making strategies are needed to establish an effective supply chain. To ensure that the supply chain is as lean and cost-effective as possible, it is important to plan ahead of time. Information technology helps build a global supply chain that is both sufficiently agile and versatile to give it a competitive advantage. To achieve and maintain a resilient and agile state, organizations should take several steps, including developing quality improvement, establishing end-to-end visibility, utilizing technologies, planning, building a SC risk mitigation strategy, and moving to partnerships and integration [27].
Developing a more agile supply chain requires the connection of businesses to suppliers and customers to improve forecasting and planning. Data sharing at all levels of the supply chain, increased visibility, and an interconnected network can help improve resilience [28].
Business agility has never been more critical, and this is especially true in supply chains. The value of supply chain flexibility has become even more apparent as a result of COVID-19. COVID-19 has intensified the need to address the importance of flexibility in the supply chain. Agility helps manufacturers achieve supply-chain success by minimizing supply costs, improving picking skills, increasing inventory accuracy, and minimizing shrinkage by responding to change and disruptions. Supply chain agility is characterized by a company’s ability to quickly recognize changes, opportunities, and threats; quickly access relevant data; make resolute decisions about how to react; quickly execute those decisions; and adjust supply chain tactics and operations to the degree needed to enforce its strategy [32].
The world is now painfully aware that the COVID-19 pandemic would put huge obstacles in the way of even the best-run SCs. Some supply chains can recover faster than others due to their strength and agility. An agile SC is better able to add value to the company and make it better prepared to manage its SC during a crisis. COVID-19 effect raises the need for supply chain agility to increase a company’s ability to rapidly change supply chain tactics and processes.
4.4. SC Strategy
Execution improvements in the supply chain require a clear plan, the creation of a digital supply chain replica, a network of real-time visibility, and SC automation. When a SC moves beyond stabilization, there is a lot of confusion, and it is difficult to make strategic adjustments. Organizations must build a supply chain strategy that mitigates the risks raised by crises such as COVID-19.
To keep supply chain costs down while preserving operational flexibility and reliability, one must consider supply chain strategy and goals to ensure the right business plan. Supply chain strategy should be appropriate for the industry and resilient to adversity, and you must consider partnering with contingency suppliers and logistics companies who can take over your supplier or delivery needs if necessary. Furthermore, efficient decision making is important for business continuity when supply chains are disrupted [5].
A strong SC strategy that could deal with crises should have a clear statement of business strategy, strategic priorities, and decision-making support; re-evaluate the business model and competitive advantages; and distinguish between the services and customers [8]. As businesses continue to move toward intelligent and self-correcting supply chains, there are five strategies to consider: an effective plan, supply network, SC modelling, emerging technologies, and the establishment of new data sharing channels. Furthermore, businesses adopting a resilient supply chain strategy should be prepared to invest in cultural change as resilience necessitates constructive behavior, major process growth, and effective communication and collaboration [38].
Several concepts that foster strategic and resilient supply chains should be integrated into the organizational cultures of each of these businesses, including the following: funding and training all parties involved; dealing with real-world disruptions that prompt the creation of strategic responses; access to disruption-related information to ensure business continuity and performance; and constant, transparent, and collaborative communication between workers, management, and vendors.
4.5. Cultural Transformation
A cultural shift may be necessary in some cases to achieve end-to-end visibility and build a transparent organization. Culture refers to the sum of an organization’s principles and traditions; the group’s customs, morals, and objectives; and how employees act in the organization without direct supervision. To build organizational cultures, organizations should accept reform and enable the free exchange of ideas; promote open communication in all directions; be hospitable, participatory, and respectful of all individuals; remove silos and concentrate on processes; promote creativity; and improve the capabilities (skills) of the workers [4].
Cultural differences between countries can affect every part of the global supply chain. A lack of cultural knowledge and practical application of that awareness can be harmful to the supply chain’s health. Contract, time and schedule, supplier selection, and communication are all important factors. Logistics companies are responsible for facing several cultural challenges in each region where these goods flow. People must understand and accept cultural differences to form successful working relationships. Miscommunications, financial losses, and contract losses may occur if cultural differences are not accepted. Coping with cultural differences among people is one of the most difficult challenges faced in logistics.
Anyone working in logistics or the supply chain would almost certainly face cultural difficulties as a result of the globalized world. To cope with cultural differences, one must think and act without discrimination. People should be trained to work with people of various personalities. Organizations should create multi-cultural teams to deal with business issues. These teams create unity, can execute projects across continents, are more innovative, and make better decisions because they embrace others [29].
When it comes to foreign companies, language and different units of measurement are not the only problems that come up. Miscommunication between global partners can result in severe supply chain disruptions. Working in multi-cultural teams will help make better global decisions. To avoid cultural complexities, culture must be cherished and accepted when working in a global environment. Cultural change considerations are critical in light of the emerging challenges companies face in managing global supply chains and collaborating with suppliers from different cultures. The activities of supply chain managers tend to be strongly linked to the collection of national culture values. These cultural drivers act as a road map for developing and implementing high-performing international supply chains [43].
As a consequence, a positive supply chain culture can be argued to save money for a company. Passionate supply chain professionals have lower turnover, are more effective at reducing transaction costs, and are better at incorporating innovation into their organizations from their supply partners. Many of these benefits, which derive from a company’s positive values and community, result in increased savings [13,45].
Recovery decisions represent the efficacy and efficiency of various reactive steps to recover SCs with the least amount of money at the operational stage. Recovery decisions should characterize the transition to the new SC normal and resilience. Recovery decisions help SC decision-makers cope with disruptions by comparing alternative recovery strategies based on crucial criteria, adapting to the current COVID-19 pandemic, and considering how organizations will recover and thrive after the crisis has passed.
5. Combined Fuzzy ANP–Fuzzy TOPSIS Approach
By combining FANP and FTOPSIS methodologies, the suggested framework enables businesses to prioritize their alternatives based on their relative relevance and ranks the solutions from the start while considering the ambiguity of the expert subjective assessment. Considering the intricate links between the variables involved in the decision, the suggested framework improves decision-making effectiveness and enables decision-makers to choose solutions wisely based on their significance and commercial impact.
Figure 3 shows the combined FANP-FTOPSIS approach procedures. The methodology represents the combined MCDM technique using the fuzzy ANP–fuzzy TOPSIS approach. The model consists of seven main stages, including the following: defining the problem, determining model elements, constructing an FANP model, calculating the global weights using the FANP method, performing fuzzy-TOPSIS computations using the weights calculated from the FANP approach, ranking alternatives, and selecting the best alternative. Next, one must apply the fuzzy-TOPSIS approach using the weights determined through the FANP approach, build the fuzzy decision matrix, determine the relative weight of each alternative with respect to criteria, compute the normalized fuzzy matrix values, and calculate the weighted fuzzy decision matrix. In FTOPSIS, when calculating the weighted fuzzy decision matrix, the normalized values remain triangular fuzzy numbers, global weights of criteria are taken from the fuzzy-ANP method, and the weighted normalized values and the next steps are determined using the proposed FTOPSIS steps. The proposed combined fuzzy ANP–fuzzy TOPSIS model consists of 15 steps. The steps are used to rank the set of feasible solutions and select the best solution. The merged multi-criteria decision-making process is used to rank-order the recommended solutions under the impact of COVID-19 and crises in general. The fuzzy ANP–fuzzy TOPSIS approach is used to deal with complicated problems, reduce the impact of the subjectivity and vagueness of experts and respondent opinions, and minimize the pair matrix calculations.

Figure 3.
The combined FANP-FTOPSIS approach.
The fuzzy approach is used to solve problems with uncertainty, especially in complex systems with multiple interdependencies and interrelationships. Experts’ opinions and evaluations are usually based on their experience, field of expertise, region or location, and type of SC. Vagueness in experts’ subjective evaluations requires additional analysis as it is difficult to calculate. Thus, a fuzzy approach is used to measure the ambiguity associated with subjective judgments. The following fuzzy-ANP method and fuzzy-TOPSIS steps summarize the model methodology.
5.1. Fuzzy-ANP Method
To determine the interrelationships between and relative importances of the criteria, the fuzzy-ANP method is utilized to obtain the weight of each criterion using pairwise comparison. The fuzzy set theory emulates human thinking; it was integrated with the fuzzy-ANP approach. The fuzzy-ANP method consists of the following steps [42,43,44]:
- Determine and examine the model alternatives and criteria.
- Build the ANP network model and structure of the confirmed model.
- Retrieve data from fuzzy-ANP questionnaire responses. The respondents used a 1–9 scale to assess the relative importance values of model elements. Experts’ responses are transformed into TFN using Equations (1)–(4). denoted the integrated TFN and represent the response of expert with respect to the th element toward the th element and can be denoted as TFN using the following equation where is the lower TFN bound; is the middle TFN bound, and is the upper TFN bound.Here, .
- Check the consistency ratio () of the comparison matrix, which influences the effectiveness evaluation and is considered acceptable when . The initial suggestion is to reevaluate the issue and update the verdicts if CR and CI surpass the threshold values. represents the consistency index; denotes the random index; represents the largest Eigen value of the matrix; and is the number of criteria.Here, is the number respondent.
- Use the pairwise comparison matrices to determine the local weights of criteria and sub-criteria. The introduced TFN values denote the expert opinion and represent the measures of all results.Logarithmic least squares are used to calculate the weight of every comparison matrix.The following equation is used to defuzzify the fuzzy weights:denotes the weight of criterion in the fuzzy pairwise comparison matrix; next, the super matrix calculations are used to determine the relative weights. represents the inner interdependency of the criteria.
- Use the pairwise comparison matrices to determine the local weights of sub-criteria. Calculate the local interdependency matrices of each sub-criterion with respect to their criteria. This step calculates the local weights of the sub-criteria with respect to their main criterion based on the equations described in the previous step.
- Determine the global weights of sub-criteria. Global weights are calculated by multiplying the local weight by the interdependency (inner/internal) weights associated with each sub-criterion.
5.2. Fuzzy TOPSIS
Fuzzy TOPSIS is considered an appropriate method to solve decision-making problems within a fuzzy environment. The steps and equations in this methodology have been adopted from [42,48,49] with modifications. The following steps summarize the fuzzy-TOPSIS method steps.
- Determine the weights of the evaluation criteria.
- Build the fuzzy decision matrix () and determine the relative weight of each alternative with respect to criteria . Here, elements represent the matrix rating of criterion for alternative .Here, and is the number of respondents, and is the performance of criterion for alternative assessed by expert .
- Compute the normalized fuzzy matrix values as shown in Equation (18).Next, the normalized process is accomplished using Equation (19).Here,TOPSIS require the normalization of the fuzzy decision matrix to prevent the effect of outliers.
- Calculate the weighted fuzzy decision matrix. The normalized values remain triangular fuzzy numbers. Weights are taken from the fuzzy-ANP method. The weighted normalized values are determined using the following equation:: weight of criteria as calculated using the ANP and .
- Determine the fuzzy-positive and fuzzy-negative ideal solutions ( and ). and are based on the weights of the normalized fuzzy-decision matrix; has a normalized positive value and should be . Next, and are calculated as follows:
- Calculate distance for each alternative from .
- Calculate the relative closeness of ideal solutions where . The equation solves the similarities between ideal solutions.
- Rank the order of alternatives. The larger the index is, the closer it is to the positive ideal solution. Rank-order the alternatives according to their values and select the best solution.
6. Numerical Analysis
This section deals with the numerical calculations to rank-order the areas of improvement based on their relative importance and impact on SCs using the proposed combined fuzzy ANP–fuzzy TOPSIS approach. The following steps summarize the applications of the approach steps described in the previous section.
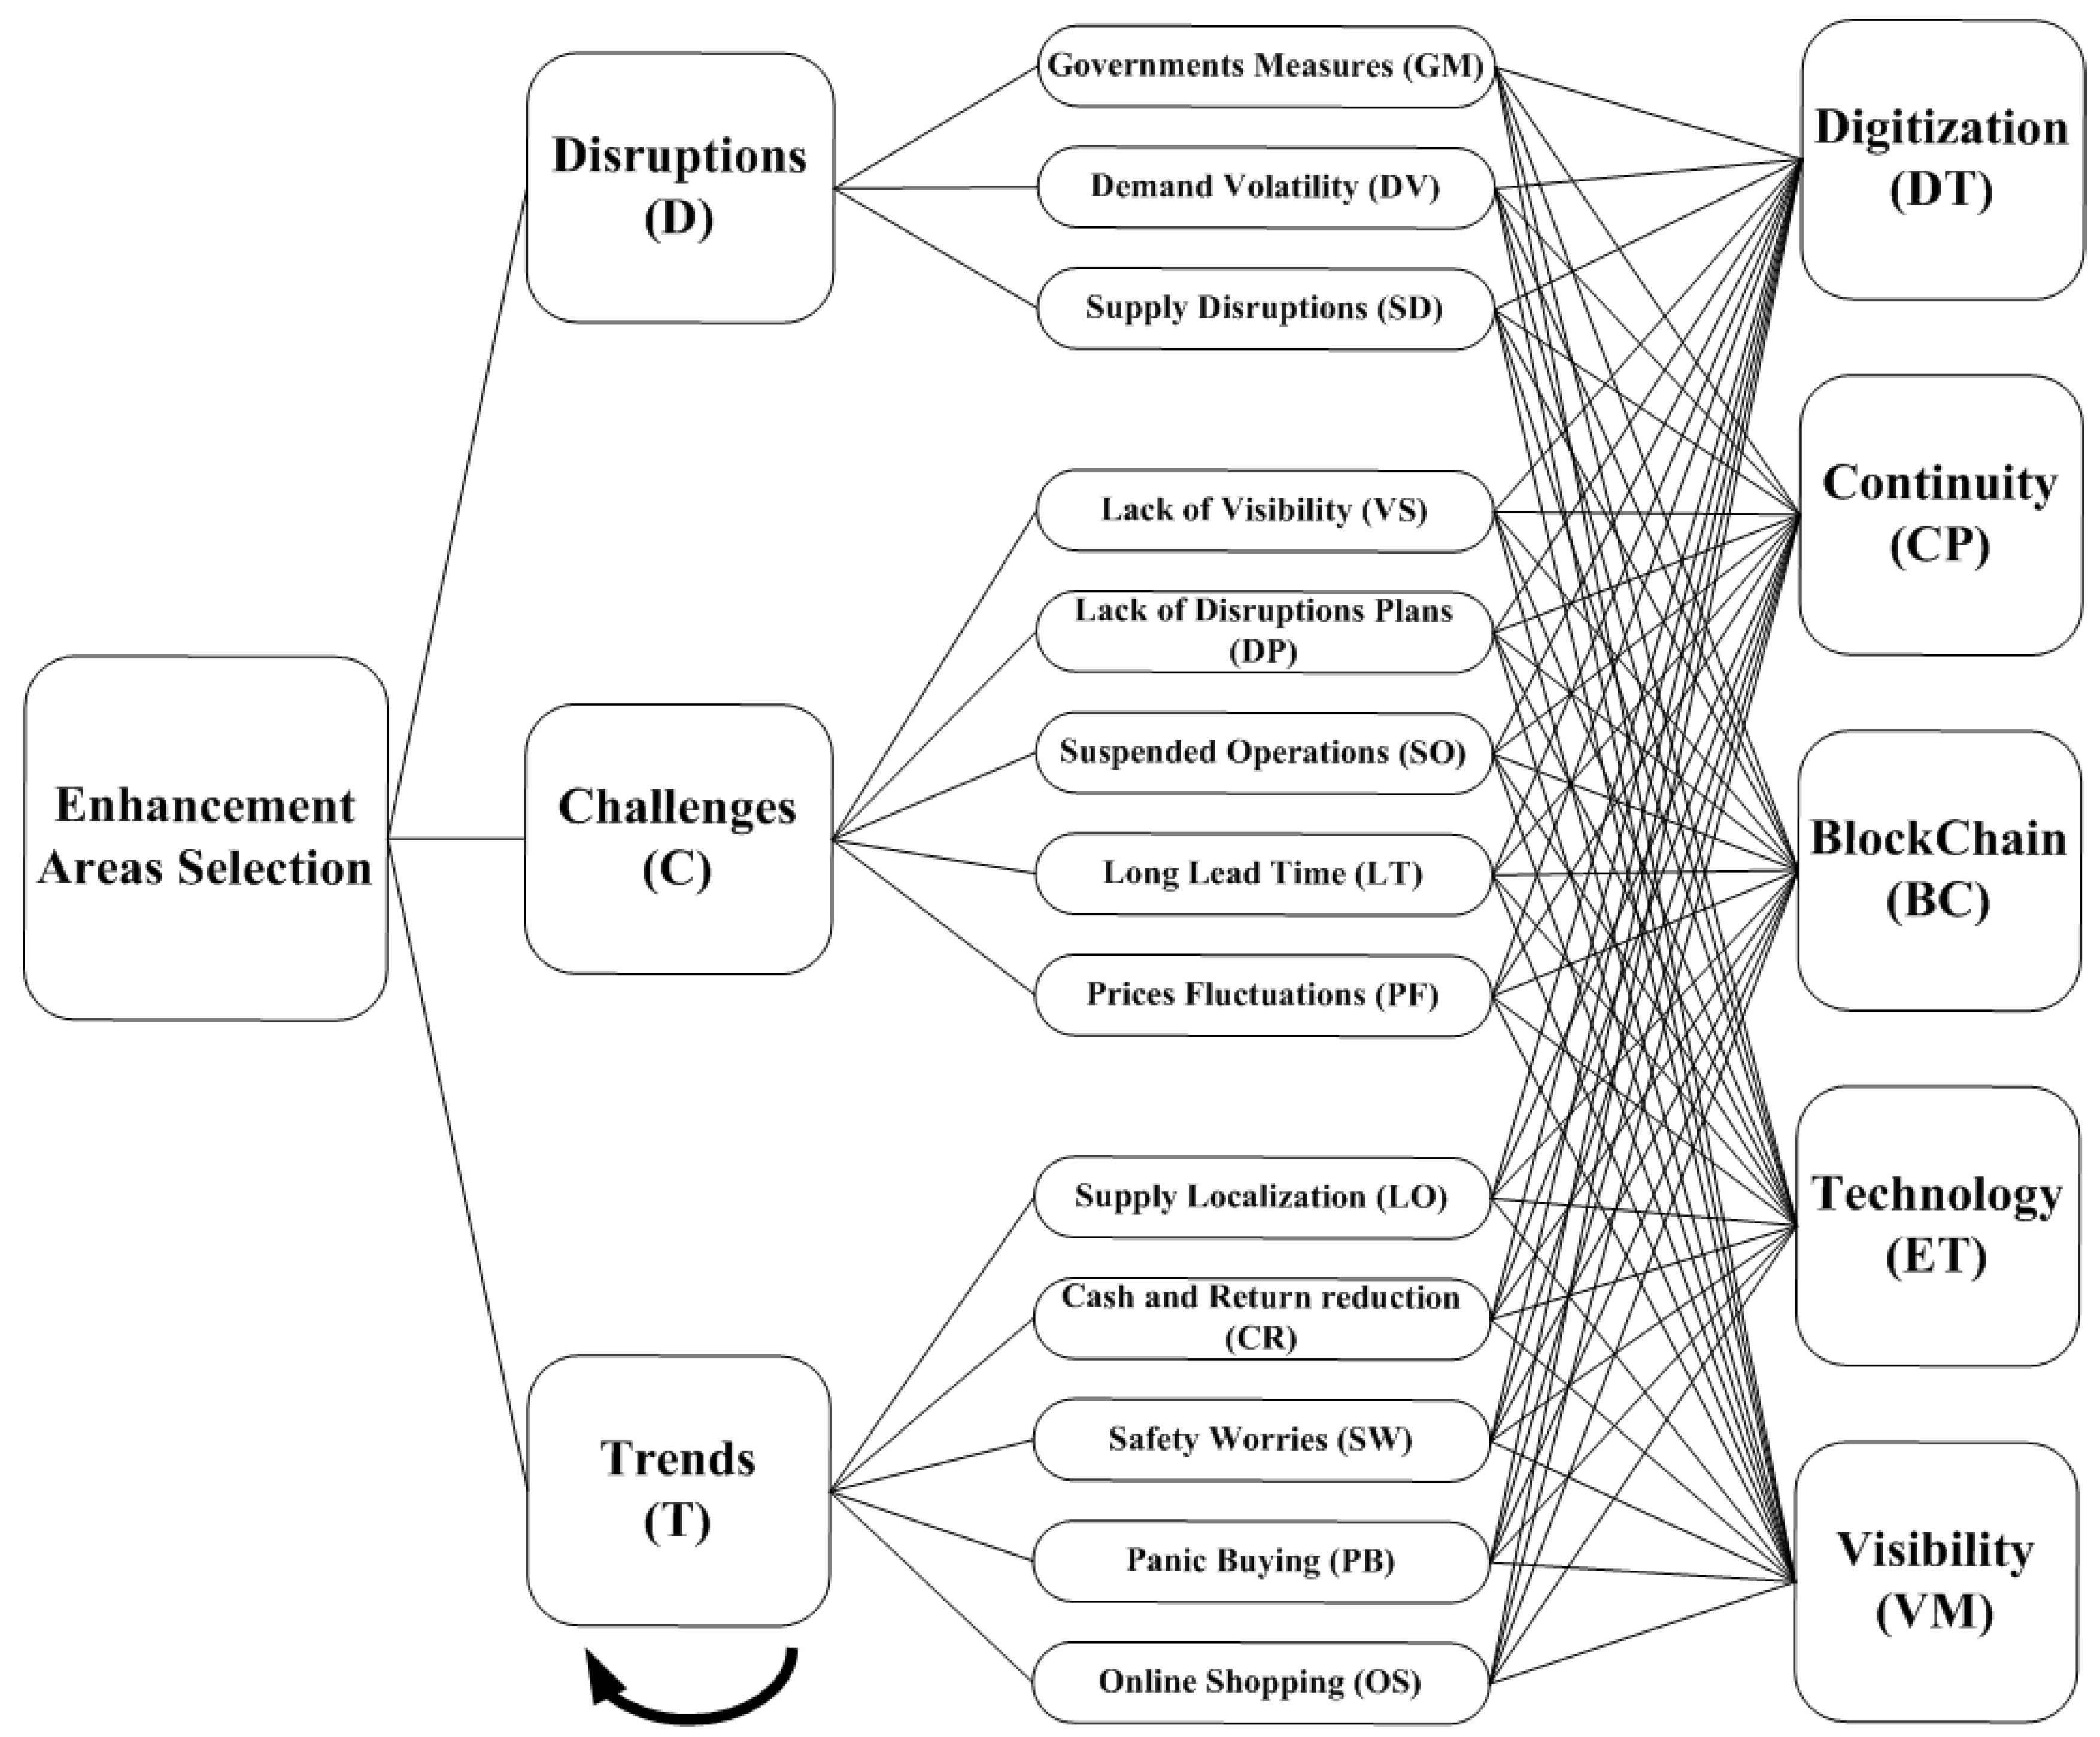
- A group of experts is formed (three professors and two executive specialists in the field of SCs). The experts determine the goal, criteria, and alternatives of the model. The expert team utilizes the literature review and the analytical model (recovery strategies model) to determine the decision criteria and alternatives, as shown in Table 1. After analyzing all the inputs, the experts reduce the model elements to five alternatives, three main criteria, and thirteen sub-criteria.
Figure 4 shows the elements of the fuzzy ANP model network and their interdependency. The model elements were examined and confirmed by the expert group in this study. The goal was enhancement area selection (level I), and there were three main criteria (level II), and each criterion was linked to several sub-criteria (level III). There were five alternatives representing areas of improvement (Level IV), which will be compared based on the main and sub-criteria to achieve the goal. The lines and arrows in the figure represent the interrelationships between all the elements, which will be taken into account when comparing the alternatives.

Figure 4.
ANP network structure of the model.
- 2.
- Based on the respondents’ evaluations of the criteria with respect to the goal, matrix A, represented in Table 2, shows the nine respondents’ relative weights using a 1–9 scale.
Table 2. Respondents’ evaluations of criteria with respect to goal.
Responses are transformed into TFN values using Equations (1–4). For example, the following calculations represent the transformations of the D-C values into TFN values, where and D-C values represent the relative weights of criteria disruptions with respect to criteria challenges evaluated by respondent .
The same processes are used in the following calculations to transfer the respondent evaluations to TFN values.
- 3.
- The comparison matrix is calculated using Equations (1)–(5). Table 3 shows the comparison matrix of the criteria and the goal matrix. The consistency ratio is calculated using Equations (5)–(7). CR = 0.06 ˂ 0.1, which indicates the consistency of the matrix.
Table 3. Criteria–goal matrix.
The same CR calculations are performed for other comparison matrices.
- 4.
- Weights of criteria with respect to the goal are presented in Table 4. Internal weights of each criterion are shown in Table 5, Table 6 and Table 7.
Table 4. Calculations of the fuzzy criteria–goal matrix.
Table 5. Criterion D internal interdependency matrix.
Table 6. Criterion C internal interdependency matrix.
Table 7. Criterion T internal interdependency matrix.
Table 8 shows the normalized relative weights of decision criteria.
Table 8.
Standardized relative impacts of decision criteria.
Subsequently, the following calculations represent the weights of criteria based on their internal interdependencies. The calculations indicate that disruptions are the most important factors in the selection of the best improvement area, followed by the challenges and the SC trends. It is clear that inner interdependencies adjust the weights of the main criteria from (0.63, 0.12, 0.25) to (0.394, 0.324, 0.282). The results indicate the noted cause of inner interdependencies in the ranks of the criteria.
- 5.
- This step calculates the local interdependency matrices of each sub-criterion with respect to their main criteria as shown in Table 9, Table 10 and Table 11.
Table 9. Sub-criteria: local weights for criterion D.
Table 10. Sub-criteria: local weights for criterion C.
Table 11. Sub-criteria: local weights for criterion T.
- 6.
- The global weight of criteria is calculated using Equations (13) and (14). Table 12 shows the global weight of each sub-criterion.
Table 12. Global weights of sub-criteria.
The following steps use TOPSIS to continue the calculations and rank the alternatives. The positive ideal and negative ideal solutions are calculated using this method
- 7.
- The relative weights of alternatives with respect to the sub-criteria are filled by the respondents and the FTN values are calculated using Equation (17).
- 8.
- Table 13 shows the fuzzy decision matrix of alternatives with respect to sub-criteria.
Table 13. Fuzzy decision matrix.
- 9.
- Table 14 shows the normalized fuzzy matrix values.
Table 14. Normalized fuzzy matrix values.
- 10.
- Calculations of the weighted normalized fuzzy matrix decisions are made using Equations (21) and (22), as shown in Table 15.
Table 15. The weighted normalized matrix.
- 11.
- Calculations of fuzzy-positive and fuzzy-negative ideal solutions (FPIS: & FNIS: ) are made.
- 12.
- Table 16 shows the calculations of distances for each alternative. Next, we calculate the separation measures for each alternative from the ideal positive and ideal negative solution. The final results of the calculations are presented in Table 16.
Table 16. Distances and ranks of the alternatives.
- 13.
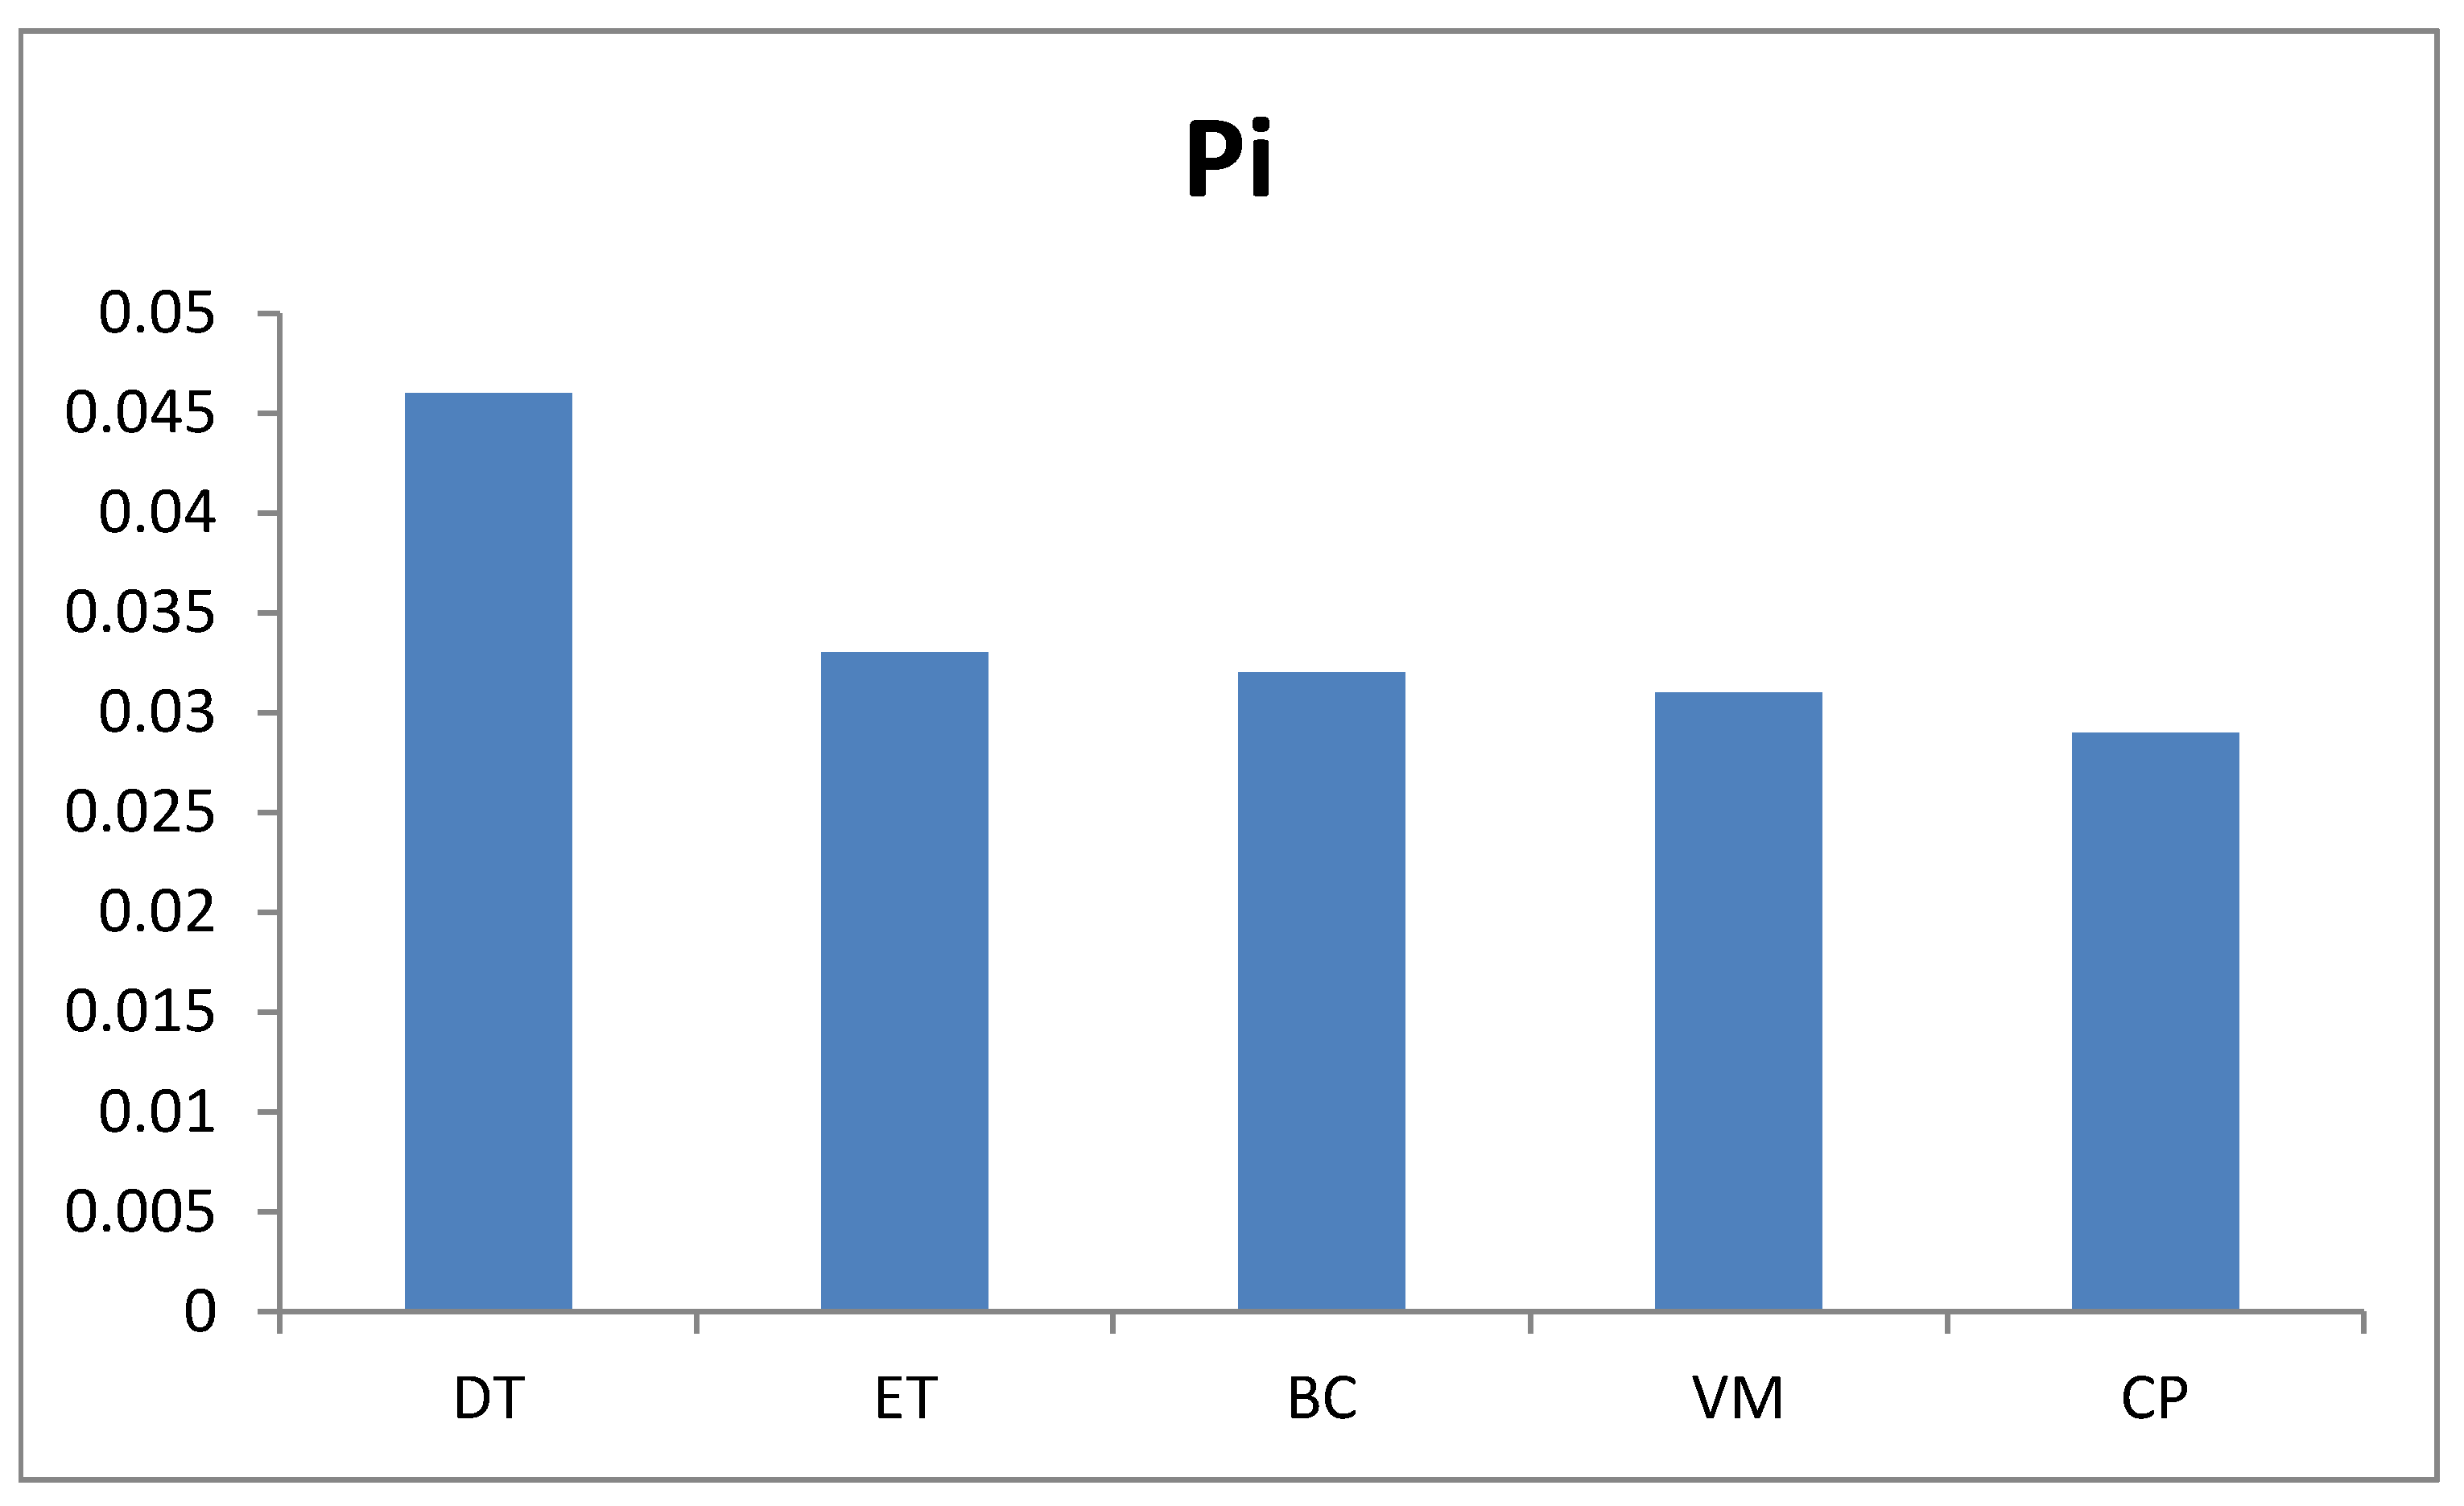
- The relative closeness Pi to the ideal solution is calculated for each alternative. We use Equation (28) to calculate the closeness coefficient and rank the alternatives. Figure 5 represents the ranking of SC enhancement areas to resist future crises like COVID-19 based on the merged fuzzy ANP–fuzzy TOPSIS method.
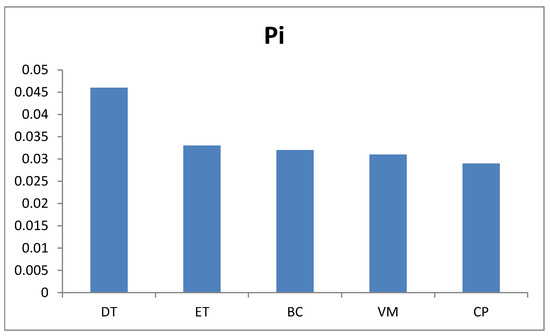 Figure 5. Final ranks of the areas of improvements.
- 14.
- The ranking of the alternatives is conducted (DT-ET-BC-VM-CP).
7. Discussion of Results
Table 16 shows the results of the fuzzy TOPSIS. The evaluation of the improvement areas of the SCs with crises is realized according to the Pi (closeness coefficient) values. The ranks of the projects are DT > ET > BC > VM > CP from the best (most preferable) to the least. If the best area is to be selected, then DT (digitization and transparency) should be chosen. The ranking for the optimal SC areas of enhancements is as follows: digitization and transparency, adoption of emerging technology, utilizing block chain technology, visibility and monitoring, and business continuity planning.
Digitization and transparency were selected as the best ways to face the COVID-19 pandemic and other crises as they allow the visibility of the entire SC, coordination, collaboration between partners, and monitoring of all SC processes and operations. Utilizing emerging technology was ranked second as an effective supply chain resilience plan relies on technology. Businesses should invest in technology that can be tailored to meet their particular requirements to improve supply chain risk management and reduce the overall cost of their bill of materials.
Subsequently, the results were checked with the experts, who agreed with the ranking results provided by the MCDM hybrid fuzzy ANP–fuzzy TOPSIS technique. According to Table 16, the priorities of areas for improvement have been arranged. Therefore, it is clear that the ranking for the best areas is DT-ET-BC-VM-CP. Based on the survey results, experts’ opinions, and some managers and executives of SC organizations, alternative DT is the best, followed by ET and VM and then BC and CP. Almost all results are the same except for BC and VM, as they prefer VM over BC.
It has become imperative to take decisions and develop strategies to improve the supply chain to keep pace with recent developments and to remain in the circle of local and global competition. Changes in supply chains are coming hastily as a result of changes in technology, the nature and structure of relationships, globalization, trade wars, competition over the sources of supplies and their limitations, and demands for instability. This change requires setting a clear path for areas for improvement. However, with the pandemic, the need to make decisions and adopt strategies for change and improvement in the supply chain increased to face crises and continuous changes.
A merged fuzzy ANP–fuzzy TOPSIS technique has been used to rank and prioritize the areas that need improvement. Expert opinion and data from the survey results have been combined in a numerical study of the proposed method. Instead of attempting to complete them all at once, you must prioritize the improvements that will bring the most value to the SC in question and address the most urgent business issues as you go. The results demonstrate that the supply chain’s resilience to disruptions and other recent and impending SC changes depends on digitization and the application of emerging technologies.
8. Conclusions
To handle crises and constant change, the pandemic made it more important than ever to make decisions and develop strategies for supply chain optimization and transformation. This paper has ranked potential areas for supply chain improvement and potential solutions using a combination of quantitative and qualitative methodologies. A model has been presented to discuss recovery strategies. The framework identifies the crucial recovery decisions that must be made for the supply chain to return to normal. These strategies have been condensed into five recuperation choices, which stand for the most significant advancements. The framework outlines the three main concerns that the supply chains have as a result of the pandemic, the top five recovery decisions chosen by experts to ensure both short- and long-term recovery strategies, the goals of each option in terms of SC stability and resilience, and the key areas for enhancement and improvement that can help the SC as a whole catch a long-term solution.
The effectiveness and efficiency of various reactive procedures to recover the SCs with the least amount of money at the operational stage are represented by recovery decisions. Resilience and the shift to the new SC normal should be characterized by recovery decisions. Recovery decisions assist SC decision-makers in dealing with disruptions by evaluating various recovery plans in the light of important criteria, adjusting for the present COVID-19 pandemic, and considering how an organization will recover and grow when the crisis has passed.
This research has identified the key areas for improvement, the decisions and strategies required to recover from a crisis, and how to prioritize implementing improvements since a company’s resources cannot support the implementation of all solutions at once. This paper has identified and ranked the recovery choices needed for supply chain improvements at both the short- and long-term specific targets for SC resilience. The merged fuzzy ANP–fuzzy TOPSIS approach has been used to handle complex issues, minimize the impact of subjectivity and ambiguity in the opinions of the experts and respondents, and minimize the pair matrix calculations.
In a numerical study of the suggested technique, data from the survey results and expert opinion were all considered. You must prioritize the improvement decisions that will add the most value to the SC in question and tackle the most pressing business problems as you move forward rather than trying to execute them all at once. The findings show that digitalization and the use of developing technology are crucial to the supply chain’s ability to rebound from disruptions and other current and upcoming SC changes.
When preparing for recovery, businesses should both take into account their long-term survival in addition to any immediate disruption as well as retain expertise while working from home and allowing for part-time employment. Hard business decisions, including reorganization or the elimination of ineffective products and clients, can also be forced by disruption. To do so effectively, firms must first identify all areas where supply chain improvement opportunities exist and then prioritize these potential solutions using several quantitative and qualitative methodologies. Subsequently, they must make use of the knowledge to obtain financing for implementation. SC decision-makers should consider the magnitude of a change before conducting a root-cause analysis to identify and document the key problems affecting supply chain performance.
This paper has confirmed the relationship between crises such as the COVID-19 pandemic and SC crisis recovery strategies and emphasized the role of visibility, technologies, continuity, block chain, and digitization in supporting sustainable supply chains in the face of disruption, challenges, and emerging trends. The study results will help supply chain managers create and effectively implement crisis recovery strategies.
This study was narrowed to a limited number of experts to assess alternatives and define criteria. Additional experts may be employed with expertise from various industries to enhance the credibility and applicability of the findings. Additional examples or case studies are needed to demonstrate the applicability and effectiveness of the proposed methodology in addressing real-world supply chain disruptions in different industries. Therefore, future investigations could address recovery strategies in specific areas of the supply chain, in a specific geographic area, or in a specific field such as the food and drug supply chain. Further investigation could examine recovery strategies concentrating on the agri-food industry in the Middle East and North Africa area of the global supply chain. Future work may involve sensitivity analysis to dynamically assess risk management and emergency response strategies during COVID-19, encompassing pre-event prevention, mid-event response, and post-event recovery and reconstruction phases, involving various risks and stakeholders [51]. Additional research could examine crises, areas of improvement, recovery strategies, or recovery decisions different from those mentioned in the study. Additionally, other MCDM methods can be used to evaluate improvement decisions, such as Fuzzy PROMETHEE, Fuzzy ELECTRE, Fuzzy VIKOR, or a combination of these methods, and then compare the results for different methods.
Author Contributions
Conceptualization, G.M.M.; Methodology, G.M.M. and M.Z.M.; Validation, G.M.M.; Formal analysis, M.Z.M.; Resources, M.Z.M.; Data curation, G.M.M.; Writing—original draft, G.M.M.; Writing—review & editing, G.M.M. All authors have read and agreed to the published version of the manuscript.
Funding
This research received no external funding.
Institutional Review Board Statement
The study was conducted in accordance with the Declaration of Helsinki, and approved by the Yarmouk University Institutional Review Board (IRB) NO: IRB/2023/432 on 6-11-2023.
Informed Consent Statement
Informed consent was obtained from all subjects involved in the study.
Data Availability Statement
Data is contained within the article.
Conflicts of Interest
The authors declare no conflict of interest.
References
- Ivanov, D. Lean resilience: AURA (Active Usage of Resilience Assets) framework for post-COVID-19 supply chain management. Int. J. Logist. Manag. 2022, 33, 1196–1217. [Google Scholar] [CrossRef]
- Verma, S.; Gustafsson, A. Investigating the emerging COVID-19 research trends in the field of business and management: A bibliometric analysis approach. J. Bus. Res. 2020, 118, 253–261. [Google Scholar] [CrossRef]
- Govindan, K.; Mina, H.; Alavi, B. A decision support system for demand management in healthcare supply chains considering the epidemic outbreaks: A case study of coronavirus disease 2019 (COVID-19). Transp. Res. E Logist. Transp. Rev. 2020, 138, 101967. [Google Scholar] [CrossRef]
- Sharma, A.; Adhikary, A.; Borah, S.B. COVID-19′s impact on supply chain decisions: Strategic insights from NASDAQ 100 firms using Twitter data. J. Bus. Res. 2020, 117, 443–449. [Google Scholar] [CrossRef]
- Al-Mansour, J.F.; Al-Ajmi, S.A. Coronavirus’ COVID-19′-supply chain disruption and implications for strategy, economy, and management. J. Asian Fin. Econ. Bus. 2020, 7, 659–672. [Google Scholar] [CrossRef]
- Gunasekaran, A.; Patel, C.; Tirtiroglu, E. Performance measures and metrics in a supply chain environment. Int. J. Oper. Prod. Manag. 2001, 21, 71–87. [Google Scholar] [CrossRef]
- Shareef, M.A.; Dwivedi, Y.; Ahmed, J.U.; Kumar, U.; Mahmud, R. Stakeholders conflict and private–public partnership chain (PPPC): Supply chain of perishable product. Int. J. Logist. Manag. 2022, 33, 1218–1245. [Google Scholar] [CrossRef]
- Alkahtani, M.; Omair, M.; Khalid, Q.S.; Hussain, G.; Ahmad, I.; Pruncu, C. A COVID-19 supply chain management strategy based on variable production under uncertain environment conditions. Int. J. Environ. Res. Public Health 2021, 18, 1662. [Google Scholar] [CrossRef] [PubMed]
- Ali, M.H.; Suleiman, N.; Khalid, N.; Tan, K.H.; Tseng, M.L.; Kumar, M. Supply chain resilience reactive strategies for food SMEs in coping to COVID-19 crisis. Trends Food Sci. Technol. 2021, 109, 94–102. [Google Scholar] [CrossRef] [PubMed]
- Frederico, G.F. Towards a Supply Chain 4.0 on the post-COVID-19 pandemic: A conceptual and strategic discussion for more resilient supply chains. RAMJ 2021, 15, 94–104. [Google Scholar] [CrossRef]
- Taqi, H.M.M.; Ahmed, H.N.; Paul, S.; Garshasbi, M.; Ali, S.M.; Kabir, G.; Paul, S.K. Strategies to manage the impacts of the COVID-19 pandemic in the supply chain: Implications for improving economic and social sustainability. Sustainability 2020, 12, 9483. [Google Scholar] [CrossRef]
- Rowan, N.J.; Laffey, J.G. Challenges and solutions for addressing critical shortage of supply chain for personal and protective equipment (PPE) arising from coronavirus disease (COVID19) pandemic–case study from the Republic of Ireland. Sci. Total Environ. 2020, 725, 138532. [Google Scholar] [CrossRef]
- Magableh, G.M. Supply chains and the COVID-19 pandemic: A comprehensive framework. Eur. Manag. Rev. 2021, 18, 363–382. [Google Scholar] [CrossRef]
- Novak, J.I.; Loy, J. A critical review of initial 3D printed products responding to COVID-19 health and supply chain challenges. Emerald Open Res. 2020, 1. [Google Scholar] [CrossRef]
- Mirchandani, P. Health care supply chains: COVID-19 challenges and pressing actions. Ann. Intern. Med. 2020, 173, 300–301. [Google Scholar] [CrossRef]
- Hensel, A.; Bauer, R.; Heinrich, M.; Spiegler, V.; Kayser, O.; Hempel, G.; Kraft, K. Challenges at the time of COVID-19: Opportunities and innovations in antivirals from nature. Planta Med. 2020, 86, 659–664. [Google Scholar] [CrossRef]
- Lin, H.L.; Ma, Y.Y.; Lin, C.T. An evaluation system for COVID-19 vaccine transportation quality based on fuzzy analytic hierarchy process. Mathematics 2023, 11, 3914. [Google Scholar] [CrossRef]
- Butt, A.S. Strategies to mitigate the impact of COVID-19 on supply chain disruptions: A multiple case analysis of buyers and distributors. Int. J. Logist. Manag. 2021. [Google Scholar] [CrossRef]
- Magableh, G.M.; Mistarihi, M.Z. Causes and effects of supply chain nervousness: Mena case study. Acta Logist. 2022, 9, 223–235. [Google Scholar] [CrossRef]
- Veselovská, L. Supply chain disruptions in the context of early stages of the global COVID-19 outbreak. Probl. Perspect. Manag. 2020, 18, 490–500. [Google Scholar] [CrossRef]
- Nikolopoulos, K.; Punia, S.; Schäfers, A.; Tsinopoulos, C.; Vasilakis, C. Forecasting and planning during a pandemic: COVID-19 growth rates, supply chain disruptions, and governmental decisions. Eur. J. Oper. Res. 2021, 290, 99–115. [Google Scholar] [CrossRef]
- Golan, M.S.; Jernegan, L.H.; Linkov, I. Trends and applications of resilience analytics in supply chain modeling: Systematic literature review in the context of the COVID-19 pandemic. Environ. Syst. Decis. 2020, 40, 222–243. [Google Scholar] [CrossRef]
- El Baz, J.; Ruel, S. Can supply chain risk management practices mitigate the disruption impacts on supply chains’ resilience and robustness? Evidence from an empirical survey in a COVID-19 outbreak era. Int. J. Prod. Econ. 2021, 233, 107972. [Google Scholar] [CrossRef]
- Schiele, H.; Hoffmann, P.; Köerber, T. Synchronicity management: Mitigating supply chain risks by systematically taking demand changes as starting point—A lesson from the COVID-19 crisis. IEEE Eng. Manag. Rev. 2020, 49, 55–62. [Google Scholar] [CrossRef]
- Shahin, A.; Balouei Jamkhaneh, H.; Shahin, R. Supply chain risk management under COVID-19: A review and Research Agenda. In Developments in Information & Knowledge Management for Business Applications; Springer: Cham, Switzerland, 2022; Volume 4, pp. 561–580. [Google Scholar] [CrossRef]
- Knut, A.; Azcue, X.; Barribal, E. Supply-Chain Recovery in Coronavirus Times–Plan for Now and the Future; McKinsey & Company: Chicago, IL, USA, 2020. [Google Scholar]
- Li, X.; Goldsby, T.J.; Holsapple, C.W. Supply chain agility: Scale development. Int. J. Logist. Manag. 2009, 20, 408–424. [Google Scholar] [CrossRef]
- Ketchen, D.J., Jr.; Craighead, C.W. Research at the intersection of entrepreneurship, supply chain management, and strategic management: Opportunities highlighted by COVID-19. J. Manag. 2020, 46, 1330–1341. [Google Scholar] [CrossRef]
- Habel, J.; Jarotschkin, V.; Schmitz, B.; Eggert, A.; Plötner, O. Industrial buying during the coronavirus pandemic: A cross-cultural study. Ind. Mark. Manag. 2020, 88, 195–205. [Google Scholar] [CrossRef]
- Yoosefi Lebni, J.; Abbas, J.; Moradi, F.; Salahshoor, M.R.; Chaboksavar, F.; Irandoost, S.F.; Nezhaddadgar, N.; Ziapour, A. How the COVID-19 pandemic effected economic, social, political, and cultural factors: A lesson from Iran. Int. J. Soc. Psychiatry 2020, 67, 298–300. [Google Scholar] [CrossRef]
- Renzaho, A.M.N. The need for the right socio-economic and cultural fit in the COVID-19 response in Sub-Saharan Africa: Examining demographic, economic political, health, and socio-cultural differentials in COVID-19 morbidity and mortality. Int. J. Environ. Res. Public Health 2020, 17, 3445. [Google Scholar] [CrossRef]
- Ali, I.; Aboelmaged, M.G.S. Implementation of supply chain 4.0 in the food and beverage industry: Perceived drivers and barriers. Int. J. Prod. Perform. Manag. 2021, 71, 1426–1443. [Google Scholar] [CrossRef]
- Acioli, C.; Scavarda, A.; Reis, A. Applying Industry 4.0 technologies in the COVID–19 sustainable chains. Int. J. Prod. Perform. Manag. 2021, 70, 988–1016. [Google Scholar] [CrossRef]
- Javaid, M.; Haleem, A.; Vaishya, R.; Bahl, S.; Suman, R.; Vaish, A. Industry 4.0 technologies and their applications in fighting COVID-19 pandemic. Diabetes Metab. Syndr. 2020, 14, 419–422. [Google Scholar] [CrossRef] [PubMed]
- Mistarihi, M.Z.; Magableh, G.M. Prioritization of supply chain capabilities using the FAHP technique. Sustainability 2023, 15, 6308. [Google Scholar] [CrossRef]
- Farman, H.; Javed, H.; Jan, B.; Ahmad, J.; Ali, S.; Khalil, F.N.; Khan, M. Analytical network process based optimum cluster head selection in wireless sensor network. PLoS ONE 2017, 12, e0180848. [Google Scholar] [CrossRef] [PubMed]
- Hussey, L.K. Analytic Network Process (ANP) for Housing Quality Evaluation: A Case Study in Ghana. Master’s Thesis, The University of Western Ontario, London, ON, Canada, 2014. [Google Scholar]
- Hosseini, L.; Tavakkoli-Moghaddam, R.; Vahdani, B.; Mousavi, S.M.; Kia, R. Using the analytical network process to select the best strategy for reducing risks in a supply chain. J. Eng. 2013, 2013, 375628. [Google Scholar] [CrossRef]
- Sodhi, B.; Prabhakar, T.V. A simplified description of Fuzzy TOPSIS. arXiv 2012, arXiv:1205.5098. [Google Scholar]
- Chang, S.H.; Tseng, H.E. Fuzzy TOPSIS decision method for configuration management. Int. J. Ind. Eng. 2008, 15, 304–313. [Google Scholar]
- Zha, S.; Guo, Y.; Huang, S.; Tang, P. A hybrid MCDM approach based on ANP and TOPSIS for facility layout selection. Trans. Nanjing Univ. Aeronaut. Astronaut. 2018, 35, 1027–1037. [Google Scholar]
- Abdel-Basset, M.; Mohamed, M.; Smarandache, F. A hybrid neutrosophic group ANP-TOPSIS framework for supplier selection problems. Symmetry 2018, 10, 226. [Google Scholar] [CrossRef]
- Cahyadi, I. A combined ANP, TOPSIS and MCGP approach to select knowledge transfer strategy: A case study in Indonesian SMEs ERP system implementation. IOP Conf. Ser. Mater. Sci. Eng. 2019, 505, 012001. [Google Scholar] [CrossRef]
- Liao, C.N.; Lin, C.H.; Fu, Y.K. Integrative model for the selection of a new product launch strategy, based on ANP, TOPSIS and MCGP: A case study. Technol. Econ. Dev. Econ. 2016, 22, 715–737. [Google Scholar] [CrossRef]
- Magableh, G.M.; Mistarihi, M.Z. Applications of MCDM approach (ANP-TOPSIS) to evaluate supply chain solutions in the context of COVID-19. Heliyon 2022, 8, e09062. [Google Scholar] [CrossRef]
- Shahroudi, K.; Rouydel, H. Using a multi-criteria decision making approach (ANP-TOPSIS) to evaluate suppliers in Iran’s auto industry. Int. J. Appl. Oper. Res. Open Access J. 2012, 37–48. [Google Scholar]
- Govindaraju, R.; Akbar, M.I.; Gondodiwiryo, L.; Simatupang, T. The Application of a Decision-Making Approach Based on Fuzzy ANP and TOPSIS for Selecting a Strategic Supplier; Bandung Institute of Technology: Bandung, Indonesia, 2015. [Google Scholar]
- Mohaghar, A.; Fathi, M.R.; Faghih, A.; Turkayesh, M.M. An integrated approach of Fuzzy ANP and Fuzzy TOPSIS for R&D project selection: A case study. Aust. J. Basic Appl. Sci. 2012, 6, 66–75. [Google Scholar]
- Kuo, R.J.; Hsu, C.W.; Chen, Y.L. Integration of fuzzy ANP and fuzzy TOPSIS for evaluating carbon performance of suppliers. Int. J. Environ. Sci. Technol. 2015, 12, 3863–3876. [Google Scholar] [CrossRef]
- Chang, K.L.; Liao, S.K.; Tseng, T.W.; Liao, C.Y. An ANP based TOPSIS approach for Taiwanese service apartment location selection. Asia Pac. Manag. Rev. 2015, 20, 49–55. [Google Scholar] [CrossRef]
- Lin, H.L.; Ma, Y.Y.; Lin, C.T. Evaluating pallet investment strategy using fuzzy analytic network process: A case in Chinese chain supermarkets. Mathematics 2021, 9, 3210. [Google Scholar] [CrossRef]
Disclaimer/Publisher’s Note: The statements, opinions and data contained in all publications are solely those of the individual author(s) and contributor(s) and not of MDPI and/or the editor(s). MDPI and/or the editor(s) disclaim responsibility for any injury to people or property resulting from any ideas, methods, instructions or products referred to in the content. |
© 2024 by the authors. Licensee MDPI, Basel, Switzerland. This article is an open access article distributed under the terms and conditions of the Creative Commons Attribution (CC BY) license (https://creativecommons.org/licenses/by/4.0/).