Abstract
Surging electricity demand, its limited supply, and the pandemic crisis are just some of the key factors that resulted in changes in electricity prices on the power exchanges. This topic brings about a notable economic influence on both producers and consumers. The main purpose of this paper is to explore power price volatility during the four-year period from 1 January 2018 to 31 December 2021, in 28 power exchanges in Europe, measured using daily velocity data. In addition, based on the fixed and chain base index numbers, as well as their relative merits, this paper was designed to measure the gap and convergence in trends. Considering that the price volatility varies depending on the observation period, this paper performs a comparative analysis of electricity price volatility on a daily, monthly, quarterly, and annual level for all examined countries. The obtained results indicate that electricity price volatility is higher on a daily basis. Related to this, convergent trends are demonstrated on all 28 observed markets, and there is a growing trend of hourly spot prices in the analyzed four-year period. The results of this paper also confirm a higher power price volatility during the pandemic period in 2020 and 2021 compared to the prepandemic period during 2018 and 2019.
1. Introduction
An investigation into the effects of global issues, including the pandemic and wars, on energy policies is crucial to understanding the relationship between the supply shock and the energy sector’s green transitions [1]. Exploring the power markets in Europe suggests that European countries have different economic structures and, as such, the integration process should be accompanied by a process of convergence [2]. Given the multidimensional nature of the convergence process, the differences in the market electricity prices can lead to a slowdown in catching up with the most developed countries, so re-engineering the economy is necessary. The liberalization of the electricity markets and intensive competitive conditions began in Europe three decades ago. Before transformation, the markets had a monopolistic structure. There is clearly a rising demand for clean and renewable energy, which consequently raises concerns about energy security for all countries.
The authors of [3] showed that there will be a 45% growth in global energy demand from 2015 to 2030 and it is expected to grow by more than 300% by 2100. The first wave of the COVID-19 pandemic affected energy sectors in many ways; there was a significant decline in global energy demand and the demand for oil and gas, as well as a decrease in oil and gas prices [4]. In the first half of 2020, the largest annual drop in demand of the global gas market was identified. Conversely, the influence of the COVID-19 pandemic on the energy industry was also identified, particularly on energy firms. Some authors pointed out that US oil and gas energy firms had heterogeneous reactions to the pandemic [5]. The authors of [6] noted that the COVID-19 pandemic had influenced the returns of most energy firms in Greece, and another study [7] confirmed a significant negative effect on the overall performance of energy firms.
This paper highlights the changes in power exchange prices during the COVID-19 pandemic crisis period and investigates the observed gaps in comparison to the period before the crisis, as well as deficiencies in the general business environment in selected countries. The significance of this research arises from the current debate on whether the growing trend of power prices should move towards a long-term intense energy crisis under the influence of the risk of war. This paper has direct practical implications for evaluating price policies in Europe. It represents a significant contribution to understanding the market movements that are greatly influenced by numerous economic and noneconomic factors. The obtained empirical results suggest significant policy implications on the supply and use of energy, from both economic and managerial perspectives, considering the high energy prices. In this regard, this paper highlights the necessity for energy transition and promoting energy security. The assessment of energy policies covers energy efficiency, renewables, energy markets, prices, and taxes, as well as their regulation and competition. In this regard, policymakers should establish mechanisms to stabilize the market and to reduce the risk of price volatility spillover, which can empower sustainable development [8].
This paper is organized as follows: After the Introduction, Section 2 gives a summary of the theoretical background and a review of the literature on the electricity market structure and the influence of the COVID-19 pandemic on market movements. Section 3 describes the materials and methods. Section 4 presents the empirical results and discussion surrounding the results. Section 5 provides the conclusions and gives energy policy recommendations.
2. Background and Literature Review
The short-term electricity market structure, known as spot markets, includes day-ahead markets (DAMs) and intraday markets (IDMs). There are variations in the structures of these markets. While DAMs are based on forecasts, which can include errors in their nature, IDMs have been globally used [9]. Day-ahead markets are structured marketplaces utilized for electricity trading and balancing activities one day before the delivery date of that electricity. In addition, these markets are operated by a transmission system operator and they include auctions which are simultaneously conducted 24 h a day. Therefore, the economic actors can adjust their own transactions to maximize their profits [10]. Day-ahead markets are growing due to institutions, regulations, software, and web applications [11]. Some of the main reasons that day-ahead markets are needed are as follows: establishing a reference price for electrical energy; providing participants selling and buying energy options for the next day, in addition to their bilateral agreements; supplying a balanced system to the system operator the day before; and the opportunity to manage any constraints the day before.
The asymmetric relationship between COVID-19 cases and fossil energy prices has been noted. The analysis in [12] indicates that COVID-19 has influenced oil and natural gas prices in highly volatile quantiles. The research in [13] indicates that the volatility dynamics of the diesel market in Turkey started rising with the first COVID-19 cases and peaked at the end of May 2020. The impact of the number of COVID-19 cases and deaths led to an increase in the volatility of the daily oil price from 8% to 22% [14]. The analysis in [15] stated that a threshold effect of COVID-19 infections influenced the oil prices. The influence of the COVID-19 pandemic was analyzed as a case study in Germany and other EU countries [16]. The presented study analyzed the response of the electricity system to various circumstances and how the flexibility of the system contributed to having a stable electricity response. The occurrence of the pandemic demonstrated that, in the case study of Germany, it is possible to integrate an increasing share of RESs (renewable energy sources) into the changing electricity system, as well as to secure a supply on a continuously high level.
The study from India focused on the influence of market concentration on electricity prices during the COVID-19 pandemic [17]. The impact of the COVID-19 pandemic on the analysis of pricing and energy load was assessed for the Iberian electricity market [18], Spanish energy market [19,20,21], in Italy [22], in Poland [23], in Italy, the Czech Republic, and China, contrastively [24], as well as in Australia [25].
The nonstorable feature of electricity makes this commodity and its prices more volatile than others [26]. The evaluation of power price volatility in the USA was presented in the analysis of California’s restructuring disaster [27]. Subsequent research for the USA and Canadian power markets showed that electricity prices possess certain volatility and other systematic properties that can be characterized by the type and method of electricity delivery [28]. Also, the Canadian electricity market is one of the most volatile power markets worldwide according to the case of Ontario [29]. The authors of [30] analyzed intraday patterns, information arrival, and calendar effects on high-frequency volatility in the Australian electricity markets. The British electricity spot market was analyzed in [31,32], emphasizing the fact that the introduction of price-cap regulation achieved the goal of lowering the price level at the cost of higher price volatility. Volatility of electricity prices in Denmark and Sweden indicates that electricity prices are more stable in the Swedish price areas as hydropower is a more stable energy source [33]. The situation in Southeast Europe indicates that consequence can be seen in terms of energy poverty, both in heating and electricity consumption [34], considering the industry energy consumption in terms of sustainability [35,36].
Important insights of the European power markets presented in [37] show that large changes in volatility affect future volatilities for a relatively longer period of time in Nordic countries, Ireland, and the UK, while changes in current volatility have a less profound effect on future volatilities in the Czech Republic, Russia, and Turkey. Also, the authors of [38] examined 15 power markets in Europe and their outcomes revealed that, compared to more established European markets, power price volatility is greater in the emerging SEE marketplaces.
The documented literature is more focused on fluctuations of oil and gas prices during the pandemic. Some papers provide power price analyses during the pandemic. The motivation for the research lies in the fact that there are no studies that quantify price volatility before and during the COVID-19 pandemic, measured by daily velocity based on daily average power price levels. This research will close a measurement gap by comparing the prepandemic and COVID-19 periods for volatility in European markets. This study’s inspiration comes from the need to learn more about electricity price levels during a certain time period, thereby filling the existing gap in the literature. A comprehensive analysis that quantifies the specific changes in electricity price volatility across a wide range of the European power markets, comparing the prepandemic and the pandemic period, with a detailed methodological approach using daily velocity, has not been previously conducted. While the existing literature touches upon the impact of COVID-19 on energy markets and mentions general volatility, a detailed, quantified analysis of daily electricity price volatility across multiple European power exchanges before and during the pandemic would provide a detailed understanding of market reactions to external shocks. By employing daily velocity measurements based on daily average power price levels, the study introduces a new approach to analyzing price volatility. This methodology allows for a more granular examination of volatility dynamics, capturing short-term fluctuations that might be overlooked by other measures. Understanding the volatility dynamics during such an unprecedented event as the COVID-19 pandemic provides valuable insights for policymakers, market operators, and energy companies. It can inform future strategies for market stabilization, energy policy adjustments, and risk management practices in anticipation of similar global crises.
Recognizing the aim of the research, this paper will concentrate on testing the following hypotheses:
H1.
The growth in electricity prices was higher during the COVID-19 pandemic (2021) in all European countries, compared to the period before the pandemic (2018).
H2.
There were convergent trends in electricity prices in 28 analyzed power exchanges in Europe.
H3.
The volatility of electricity prices was higher with daily velocity based on daily average power price level.
3. Materials and Methods
Power price dynamics is important to understand because it is usually used as a reference price for financial contracts [39]. The behavior of the price process is determined by price fluctuations over a period, so one of the basic price characteristics is volatility. Essential components of risk management are volatility processes [40], and uncertainty dispersion of the future prices is determined by these fluctuations.
The aim of this paper is to evaluate power prices before and after the COVID-19 pandemic. Accordingly, hourly spot prices were used in the four-year period from 1 January 2018 to 31 December 2021. The primary focus of the presented study is to examine the effects of the COVID-19 pandemic as a distinct external shock on the volatility dynamics of prices in the European power markets. The intention was to isolate the pandemic’s impact, allowing for a clearer analysis of its effects without the confounding influences of subsequent geopolitical events. Market clearing prices for each hour are in EUR/MWh. The analysis captures power exchange prices of 28 markets in Europe. For markets with different zones, such as Denmark, Italy, Norway, and Sweden, prices are calculated as average prices, each representing an individual market. Data on hourly prices are available on the official websites of power exchanges. Furthermore, this paper uses the IBM SPSS Statistics 26 computer package for quantitative data analysis.
In the literature, price volatility has been measured quite often as the standard deviation of logarithmic or arithmetic returns [41,42]. One extreme spike, either upward or downward, could, however, completely dominate the standard deviation. For instance, there may be a significant impact on the first six and last two hours if only one day is removed [42]. Some authors employed the historical volatility concept to analyze the volatility of electricity market prices [43,44,45]. Classical generalized autoregressive conditional heteroscedasticity models—GARCH [46,47,48], most often used for describing the volatility dynamics of commodities, cannot capture the extraordinary characteristics of electricity prices and their volatilities [49].
For that matter, the authors of [50] used the methodology for measuring electricity price volatility by the price velocity, the daily average of the absolute value of price change per hour. Also, the authors used daily velocity based on the overall average price (DVOA) and daily velocity based on daily average power price (DVDA) [29]:
where is the overall average price in the studied period, and is the average daily price in the ith day, as follows [51]:
Mathematically, N is the number of days in the corresponding time period; I is the index of the day i = 1,2,…, N; j is the index of the time period j = 1,2,…, M; M is the number of time periods during one day and for hourly prices M = 24; is the power price at the jth time period in the ith day; and is the power price at the time spot preceding the studied period. In this paper, the authors also use extended models of forecasting electricity spot prices [40] as well as asymmetric volatility metrics in day-ahead power markets in Europe [37], defined by a comparison of volatility in European markets [38] to employ price uncertainty across 28 power markets:
For temporal comparisons incorporating long time series data on prices, fixed and chain base index numbers and their relative advantages are appropriate. One may choose to compare each year with the base year since the economic time series are often computed using that year as the base period. It is from this process that fixed base index numbers are derived. The second option compares the current period with the base period via a sequence of link comparisons, where each link comparison yields an index for a specific year using the base year as the previous year. This results in chain base index numbers [52].
A chain index is an index number in which the value of any given period is related to the value of its immediately preceding period (resulting in an index for the given period expressed against the preceding period = 100). The consecutive values of the index numbers form a chain from the first to the last period. This is distinct from the fixed-base index, where the value of every period in a time series is directly related to the same value of one fixed-base period [53].
Chain base indices are used to determine the electricity price changes in consecutive years. The obtained relative numbers show how much the average price of electricity on power exchanges has changed in one year compared to the previous year. These values are obtained by dividing the value of the ith period by the value of the previous i − 1 period , and then multiplying this ratio by 100 [52]:
The average rate of change is a constant that replaces a series of individual rates. It is an average and relative change in the value of the power price for the observed time period 2018–2021. The average rate of change is calculated using the geometric mean of the chain base indices and can be used to predict the development of the phenomenon for the periods following the last in the observed time series [52]:
Fixed-base indices express the percentage of change in the occurrence level for a certain period in relation to its level of one fixed-base period. The index with a constant base, in fact, represents the percentage of the average power price in the current period, compared to the average price in the base year. The base period in the research is the starting year of the analysis, i.e., 2018, due to it being a prepandemic year. Base indices are interpreted as percentages by subtracting 100 from them [52]:
The presented analysis, inspired by [41,42] when it comes to modelling the distribution of day-ahead electricity returns, acknowledges the complexity and the unique characteristics of electricity price dynamics in European day-ahead markets. The standard deviation is a widely recognized measure of volatility, capturing the average degree of variation or dispersion of a set of values from the mean. While it is true that this measure can be influenced by outliers, extreme values that deviate significantly from the average, this sensitivity is not merely a limitation but also a reflection of the real-world phenomena it seeks to quantify. Electricity markets are particularly prone to significant price spikes and drops due to their inherent characteristics, such as nonstorability of the product, inelastic supply and demand in the short term, and regulatory influences. Therefore, when a single large price movement occurs, it is often the result of significant, value-relevant events such as sudden changes in demand, outages of power plants, or regulatory interventions. This paper aims to explore the volatility dynamics of prices in the European power markets during the external shock, recognizing that these markets are subject to high volatility due to various factors, here focused on the pandemic itself. The use of standard deviation in our analysis is justified by its ability to capture these fluctuations, providing a straightforward and intuitive measure of market volatility.
4. Results and Discussion
This section presents the dynamics of electricity price volatility. Based on Figure 1, it can be noted that there are convergent trends in all 28 power exchanges. Namely, in all observed markets there is a growing trend of hourly spot prices in the four-year period dating from 1 January 2018 to 31 December 2021. This confirms H2.
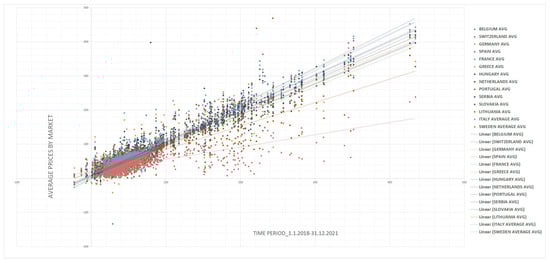
Figure 1.
Power price trends in 28 markets.
A detailed analysis of daily data shows that an accelerated growth of electricity prices was registered and followed by a higher growth trend in the second half of the observed period, i.e., during 2020 and 2021, compared to the growth achieved in 2018 and 2019 (Figure 2).
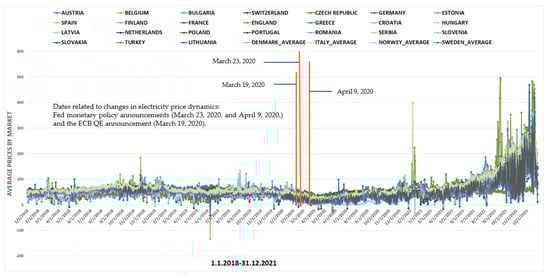
Figure 2.
Oscillations of daily power prices in 28 European markets. Key dates are marked according to monetary policy announcements [54].
The data presented in Table 1 indicate how many units of occurrence in the i time period appear for every hundred units of occurrence in the i − 1 period. Based on the calculated average annual rate of change, the highest value of this indicator was registered in the Bulgarian market (39.68%), while it was only 5.54% in the Turkish power exchange. The obtained results indicate that in the observed period, the average electricity prices in Turkey grew by 5.54% per year, while the growth on the stock exchange in Bulgaria was almost 40%.

Table 1.
Chain base indices by country.
Table 2 contains the calculation of fixed-base indices for the analyzed group of countries in the observed period. It is possible to note the order of the countries with the highest growth of electricity prices compared to the base year 2018, as follows: Bulgaria (272.49), Romania (239.87), Austria (230.68), Hungary (223.25), Croatia (220.74). Scandinavian countries had the lowest growth in average electricity prices (Sweden 129.11, Norway 145.69, Finland 154.58, Denmark 195.06) at the end of 2021 compared to the average electricity price in 2018.
Table 2.
Fixed base indices per country—2018 is the base period.
Based on the recalculated values of the fixed and chain base indices, it can be stated that H1 was confirmed, i.e., that in all analyzed European countries, the growth of electricity prices was higher in the period during the COVID-19 pandemic (2021) than before the pandemic (2018). Table 2 shows that the values of the index in 2021, in all countries, are greater than 100 (the value in 2018). Specifically, in half of the analyzed countries (14), the values of the indices are over 200, which indicates that prices doubled compared to 2018.
Further research includes descriptive statistics of daily power prices on exchanges, as given in Table 3. Based on this analysis, it can be seen that the maximum value of average daily electricity prices in the period 1 January 2018–31 December 2021 was listed in the power exchange in England (value 496.56208, point 1354, on 14 September 2021). On the other hand, the minimum value of average daily prices in the observed period was recorded in the Belgian power exchange (value −133.56083, point 523, 6 July 2019). The largest difference between the maximum and the minimum price of electricity in the analyzed period was recorded in the same exchange (value 566.54750, maximum price 432.98667; minimum price −133.56083). On the other hand, the smallest difference between the maximum and the minimum price was noted in the power exchange in Turkey, where the value was only 88.38833 (maximum value 91.10750 on 20 October 2018; minimum value 2.71917 on 4 May 2019). In order to measure price volatility, a comparative overview of prices on an annual and daily level is given, where the radars in Figure 3 show that electricity price volatility was higher on a daily basis, which confirms H3 (electricity price volatility was more pronounced on a daily level).
Table 3.
Descriptive statistics.
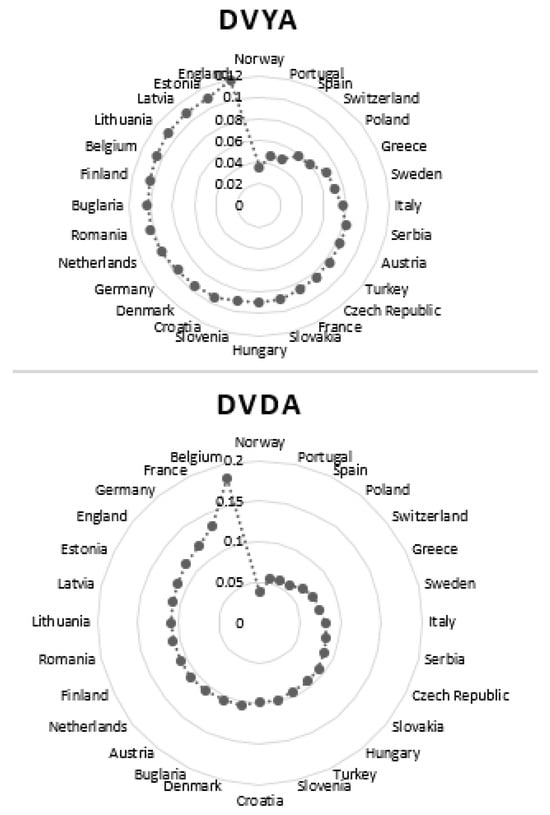
Figure 3.
Electricity price volatility on an annual and daily level (DVYA: price volatility on a yearly basis; DVDA: price volatility on a daily basis).
Volatility dynamics can also be measured on a quarterly basis. The results of these analysis are shown in Figure 4, which implies that during 2021, the largest oscillations in electricity prices were registered in power exchanges in Europe.
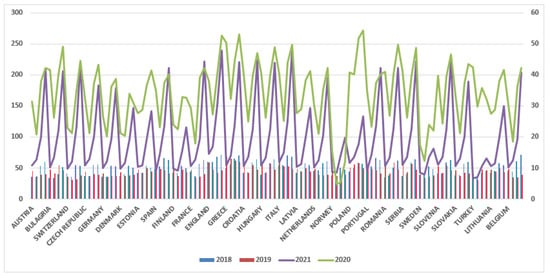
Figure 4.
Quarterly price volatility in 28 countries per year.
A comprehensive approach also requires a monthly in-depth analysis. Specifically, Figure 5a,b show monthly price changes in January, March, September, and December in the selected period (2018–2021) per country. It can be seen that the intensity of price changes was highest in December, given that the seasonal character is evident, i.e., that in the winter months there is an increased demand for electricity by industry and households. The level of electricity consumption changes during the day, with higher consumption during the daytime hours and lower consumption during the night. Consequently, it affects electricity prices that differ and change on an hourly basis. The same principle is present in the seasonal pattern, that is, the consumption of electrical energy is higher during strong winters. We emphasize the months in which high monthly volatility is presented (January, March, September, and December). Also, according to the results of the analysis, it is concluded that there is no high volatility present in each month, and it would be wrong to conclude that the monthly price volatility is high in all months during the year.
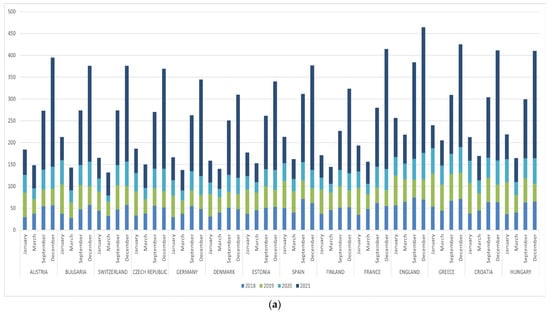
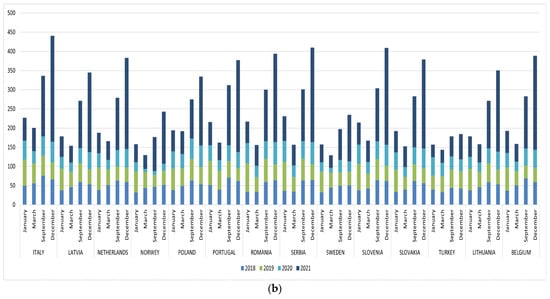
Figure 5.
(a) Monthly price changes in January, March, September, and December in the period 2018–2021 by country. (b) Monthly price changes in January, March, September, and December in the period 2018–2021 by country.
According to [54], the COVID-19 crisis elicited an unprecedented multilateral response by different central banks around a short period. Starting in March 2020, the Fed and 20 other central banks introduced unconventional monetary policy measures to respond to the severe recession caused by the COVID-19 pandemic. Therefore, coordinated monetary policies affected tail risk perceptions, and the volatility of energy prices was higher in March 2020 (the period of elevated market distress) compared to the period from April 2020 until the approval of COVID-19 vaccines. In short, unconventional monetary policies successfully shifted the structure of risk, and the spillover effects were more pronounced. The channel of cross-border transmission of risk, if present, should occur through the domestic effects of unconventional monetary policies.
5. Conclusions and Energy Policy Recommendations
The conducted research shows that in all European markets (Austria, Belgium, Bulgaria, Croatia, Czech Republic, Denmark, England, Estonia, Finland, France, Germany, Greece, Hungary, Italy, Latvia, Lithuania, Netherlands, Norway, Poland, Portugal, Romania, Serbia, Slovakia, Slovenia, Spain, Sweden, Switzerland, Turkey) there was a growing trend in hourly power prices in the four-year period dating from 1 January 2018 to 31 December 2021. In addition, this growth was more pronounced in the second half of the observed period, i.e., during the COVID-19 pandemic in 2020 and 2021, compared to the growth achieved during 2018 and 2019 in the prepandemic years. The base period of the research was the starting year in the analysis, i.e., 2018, because it was the year in which there was no shock caused by the crisis. In comparison to the base year 2018, the biggest increase in power prices occurred in 2021 in Bulgaria (272.49). On the other hand, Scandinavian countries (Sweden 129.11, Norway 145.69, Finland 154.58, Denmark 195.06) had the lowest price growth in 2021 compared to the average price of electricity in 2018. Measurements of the average annual rate of change in electricity prices in the power exchanges showed that the lowest value of this indicator was registered in the Turkish power exchange (5.54%). The used methodology, while facilitating a clear analysis of volatility, may not fully encapsulate the complexity of market behaviors and extreme events, representing a limitation in capturing the nuanced dynamics of price fluctuations.
This is an important topic for further research because it opens possible directions of thinking and points out the importance of energy management in conditions of high prices. Further analysis should seek answers to questions such as the following: What are the effects of rising market prices on energy production and consumption in Europe? Comparative studies would be particularly welcome as they could result in a more holistic picture of measuring volatility dynamics by examining the links between market conditions and companies’ behavior. In addition, behavioral economics provides a theoretical framework that can be applied to almost any form of economic behavior [55]. This is important and can be useful for studying the ways in which economic actors make choices in the reality that is characterized by high electricity prices.
Future investigations will also include the application of the nonlinear panel ARDL (PNARDL) model [56] that can further enrich the analysis by providing a more detailed understanding of how power prices respond asymmetrically to economic expansions and contractions triggered by the pandemic. Specifically, this approach can allow for the examination of whether and how different phases of the business cycle, influenced by the pandemic, have differential impacts on the volatility of power prices. The PNARDL model’s ability to capture and quantify these asymmetries would offer deeper insights into the resilience or sensitivity of power markets to economic shocks, such as the COVID-19 pandemic and subsequent recovery phases. By applying this model, the paper could explore whether power prices exhibit similar persistence during economic downturns, or if there are notable decreases in volatility during periods of economic recovery, thereby offering a more detailed characterization of the market dynamics in response to the pandemic. In the end, future research can also be focused on the impact of the geopolitical factors on the volatility of energy prices, and on comparing the dynamics of price changes in the period 2022–2025. This would give a comprehensive view of the impact of shocks on the supply and demand side in this turbulent market. In addition, the proposed different price levels can be tested on another sample of countries, such as BRICS countries that strive for energy efficiency.
Energy policy issues require more cohesion between counties. The analyzed group of countries face exceptionally high energy prices regardless of their economic development, location, or market arrangements. Volatility dynamics of prices might affect the medium- to long-term objectives of energy policy. In addition, the presented volatility dynamics of prices in 28 markets is caused by different factors, but all point to the need to accelerate the implementation of the European Green Deal. Growing uncertainty and the volatility dynamics of prices in the power markets risk creating real energy poverty and undermining the support for the green transition in European countries. It is important to emphasize the necessity to (a) improve energy security, (b) ensure affordable energy, and (c) protect the economy and the green transition. Therefore, in the short and medium term, energy policy tools that can be used to address rising prices are (a) reducing value-added tax rates or other taxes on energy, (b) adopting targeted measures to support poor and vulnerable consumers, and (c) introducing temporary measures to support households and small businesses. On the one hand, these measures mitigate the impact of the rising prices by distributing the cost to all taxpayers. On the other hand, they do not address the root causes. In the long term, the rules governing power markets need to be revised. With current regulations, the price of gas indeed determines the price of electricity in the European Union. This model should be supplemented and corrected to achieve the goals of the Green Deal.
Certain nations, such as Spain and France, want to drastically change the way that spot wholesale energy pricing is determined. The short-term marginal operational costs of supplying electricity, which are frequently the variable cost of gas-fired generation, are currently reflected in pricing. Alternatively, some nations would prefer that wholesale rates represent the average cost of producing electricity from renewable sources over the long term. This might have fundamental effects on operating and investment incentives as well as supply security, emissions, and energy costs. Potential abuse of market power is one of the reasons for notable price volatility. In Spain, the notion that the current market arrangements are not completely competitive is based on the nuclear moratorium, which was adopted in the 1980s, and the scarcity of places for further hydroelectric projects. Therefore, in the future, green transformation can be challenging due to a lack of market competition. The existing form of electricity market architecture is being opposed by Germany and a few other Member States. Growing volumes of low-carbon capacity are already under long-term contracts with average long-term costs that are covered by consumer fees. This could lead to a significant restructure of the European electricity market to guarantee the least expensive transition.
Taking everything into account, the following conclusion may be drawn: increased energy costs might be encouraging more people to favor decarbonization. One strategy to lower electricity costs is, for example, to use renewable energy. This means that policymakers should focus on pro-decarbonization in the electricity sector. The current price volatility dynamics highlight the need for a strong and coordinated strategy to better manage the clean energy transformation and unlock its enormous potential. An appropriate policy framework should balance maintaining affordable access to energy with the double aim of protecting vulnerable consumers and ensuring industrial competitiveness. Strong government leadership may be crucial to facilitate private investment in low-cost clean energy and to modernize the energy market.
Author Contributions
Conceptualization, Z.Z.S.; methodology, Z.B.; software, Z.Z.S. and P.M.; validation, Z.B.; formal analysis, Z.Z.S.; investigation, Z.B. and M.N.R.; resources, Z.B. and M.N.R.; data curation, Z.B.; writing—original draft preparation, Z.Z.S.; writing—review and editing, P.M.; visualization, C.B. and E.S.; supervision, C.B. and E.S.; project administration, A.P. and R.P.; funding acquisition, A.P. and R.P. All authors have read and agreed to the published version of the manuscript.
Funding
This research received no external funding.
Data Availability Statement
The data presented in this study are available on request from the corresponding author.
Acknowledgments
This research was financially supported by the Ministry of Science, Technological Development, and Innovation of the Republic of Serbia (Contract No. 451-451-03-65/2024-03).
Conflicts of Interest
The authors declare no conflicts of interest.
References
- Xing, X.; Cong, Y.; Wang, Y.; Wang, X. The Impact of COVID-19 and War in Ukraine on Energy Prices of Oil and Natural Gas. Sustainability 2023, 15, 14208. [Google Scholar] [CrossRef]
- Stojanović, B.; Kostić, Z. Convergence of Economic Performance in the European Union. In Researching Economic Development and Entrepreneurship in Transitional Economies; Ateljević, J., Trivić, J., Eds.; KarlFranzens-Universität Graz: Graz, Austria, 2015; pp. 55–66. [Google Scholar]
- Brown, M.A.; Sovacool, B.K.; Curry, J.; McGrath, R.T.; Norton, B.; Orlando, T.; Deitchman, B. Climate Change and Global Energy Security: Debate and Book Signing; Georgia Institute of Technology: Atlanta, GA, USA, 2011. [Google Scholar]
- Agency IEA. Global Energy Review 2020—The Impacts of the COVID-19 Crisis on Global Energy Demand and CO2 Emissions. Available online: https://www.iea.org/reports/global-energy-review-2020 (accessed on 23 December 2022).
- Iyke, B.N. COVID-19: The reaction of US oil and gas producers to the pandemic. Energy Res. Lett. 2020, 1, 13912. [Google Scholar] [CrossRef]
- Polemis, M.; Soursou, S. Assessing the impact of the COVID-19 pandemic on the Greek energy firms: An event study analysis. Energy Res. Lett. 2020, 1, 17238. [Google Scholar] [CrossRef]
- Fu, M.; Shen, H. COVID-19 and corporate performance in the energy industry. Energy Res. Lett. 2020, 1, 12967. [Google Scholar] [CrossRef]
- Tang, C.; Aruga, K.; Hu, Y. The Dynamic Correlation and Volatility Spillover among Green Bonds, Clean Energy Stock, and Fossil Fuel Market. Sustainability 2023, 15, 6586. [Google Scholar] [CrossRef]
- Acaroğlu, H.; García Márquez, F.P. Comprehensive Review on Electricity Market Price and Load Forecasting Based on Wind Energy. Energies 2021, 14, 7473. [Google Scholar] [CrossRef]
- Girish, G.P. Spot electricity price forecasting in Indian electricity market using autoregressive-GARCH models. Energy Strategy Rev. 2016, 11, 52–57. [Google Scholar] [CrossRef]
- Day Ahead Market Web Application, User Guide. Available online: https://www.epias.com.tr/wpcontent/uploads/2017/09/ENG-DAM-User-Guide_vol_5.pdf (accessed on 9 March 2022).
- Wang, K.H.; Su, C.W. Asymmetric link between COVID-19 and fossil energy prices. Asian Econ. Lett. 2021, 1, 18742. [Google Scholar] [CrossRef]
- Ertuğrul, H.M.; Güngör, B.O.; Soytaş, U. The Effect of the COVID-19 Outbreak on the Turkish Diesel Consumption Volatility Dynamics. Energy Res. Lett. 2020, 1, 17496. [Google Scholar] [CrossRef]
- Devpura, N.; Narayan, P.K. Hourly oil price volatility: The role of COVID-19. Energy Res. Lett. 2020, 1, 13683. [Google Scholar] [CrossRef]
- Narayan, P.K. Oil price news and COVID-19—Is there any connection? Energy Res. Lett. 2020, 1, 13176. [Google Scholar] [CrossRef]
- Halbrügge, S.; Schott, P.; Weibelzahl, M.; Buhl, H.U.; Fridgen, G.; Schöpf, M. How did the German and other European electricity systems react to the COVID-19 pandemic? Appl. Energy 2021, 285, 116370. [Google Scholar] [CrossRef]
- Pradhan, A.K.; Rout, S.; Khan, I.A. Does market concentration affect wholesale electricity prices? An analysis of the Indian electricity sector in the COVID-19 pandemic context. Util. Policy 2021, 73, 101305. [Google Scholar] [CrossRef]
- Bento, P.M.R.; Mariano, S.J.P.S.; Calado, M.R.A.; Pombo, J.A.N. Impacts of the COVID-19 pandemic on electric energy load and pricing in the Iberian electricity market. Energy Rep. 2021, 7, 4833–4849. [Google Scholar] [CrossRef]
- Abadie, L.M. Current expectations and actual values for the clean spark spread: The case of Spain in the COVID-19 crisis. J. Clean. Prod. 2021, 285, 124842. [Google Scholar] [CrossRef]
- Norouzi, N.; Zarazua de Rubens, G.Z.; Enevoldsen, P.; Behzadi Forough, A. The impact of COVID-19 on the electricity sector in Spain: An econometric approach based on prices. Int. J. Energy Res. 2021, 45, 6320–6332. [Google Scholar] [CrossRef]
- Santiago, I.; Moreno-Munoz, A.; Quintero-Jiménez, P.; Garcia-Torres, F.; Gonzalez-Redondo, M.J. Electricity demand during pandemic times: The case of the COVID-19 in Spain. Energy Policy 2021, 148, 111964. [Google Scholar] [CrossRef]
- Ghiani, E.; Galici, M.; Mureddu, M.; Pilo, F. Impact on Electricity Consumption and Market Pricing of Energy and Ancillary Services during Pandemic of COVID-19 in Italy. Energies 2020, 13, 3357. [Google Scholar] [CrossRef]
- Malec, M.; Kinelski, G.; Czarnecka, M. The Impact of COVID-19 on Electricity Demand Profiles: A Case Study of Selected Business Clients in Poland. Energies 2021, 14, 5332. [Google Scholar] [CrossRef]
- Ghanem, S.; Fandi, G.; Krepl, V.; Husein, T.; Rzek, O.; Muller, Z.; Kyncl, J.; Tlustý, J.; Smutka, L. The Impact of COVID-19 on Electricity Prices in Italy, the Czech Republic, and China. Appl. Sci. 2021, 11, 8793. [Google Scholar] [CrossRef]
- Mwampashi, M.M.; Nikitopoulos, C.S.; Konstandatos, O.; Rai, A. Wind generation and the dynamics of electricity prices in Australia. Energy Econ. 2021, 103, 105547. [Google Scholar] [CrossRef]
- Huisman, R.; Huurman, C.; Mahieu, R. Hourly electricity prices in day-ahead markets. Energy Econ. 2007, 29, 240–248. [Google Scholar] [CrossRef]
- Borenstein, S. The trouble with electricity markets: Understanding California’s restructuring disaster. J. Econ. Perspect. 2002, 16, 191–211. [Google Scholar] [CrossRef]
- Nakamura, M.; Nakashima, T.; Niimura, T. Electricity markets volatility: Estimates, regularities and risk management applications. Energy Policy 2006, 34, 1736–1749. [Google Scholar] [CrossRef]
- Zareipour, H.; Bhattacharya, K.; Canizares, C.A. Electricity market price volatility: The case of Ontario. Energy Policy 2007, 35, 4739–4748. [Google Scholar] [CrossRef]
- Higgs, H.; Worthington, A.C. Systematic features of high-frequency volatility in Australian electricity markets: Intraday patterns, information arrival and calendar effects. Energy J. 2005, 26, 23–42. [Google Scholar] [CrossRef]
- Green, R.J.; Newbery, D.M. Competition in the British electricity spot market. J. Political Econ. 1992, 100, 929–953. [Google Scholar] [CrossRef]
- Tashpulatov, S.N. Estimating the volatility of electricity prices: The case of the England and Wales wholesale electricity market. Energy Policy 2013, 60, 81–90. [Google Scholar] [CrossRef]
- Dong, S.; Hailong, L.; Wallin, F.; Avelin, A.; Zhang, Q.; Yu, Z. Volatility of electricity price in Denmark and Sweden. Energy Procedia 2019, 158, 4331–4337. [Google Scholar] [CrossRef]
- Rajić, M.N.; Milovanović, M.B.; Antić, D.S.; Maksimović, R.M.; Milosavljević, P.M.; Pavlović, D.L. Analyzing energy poverty using intelligent approach. Energy Environ. 2020, 31, 1448–1472. [Google Scholar] [CrossRef]
- Milovanović, M.B.; Antić, D.S.; Rajić, M.N.; Milosavljević, P.M.; Pavlović, A.; Fragassa, C. Wood resource management using an endocrine NARX neural network. Eur. J. Wood Wood Prod. 2018, 76, 687–697. [Google Scholar] [CrossRef]
- Rajić, M.N.; Maksimović, R.M.; Milosavljević, P.; Pavlović, D. Energy management system application for sustainable development in wood industry enterprises. Sustainability 2019, 12, 76. [Google Scholar] [CrossRef]
- Erdogdu, E. Asymmetric volatility in European day-ahead power markets: A comparative microeconomic analysis. Energy Econ. 2016, 56, 398–409. [Google Scholar] [CrossRef]
- Božić, Z.; Dobromirov, D.; Arsić, J.; Radišić, M.; Ślusarczyk, B. Power Exchange Prices: Comparison of Volatility in European Markets. Energies 2020, 13, 5620. [Google Scholar] [CrossRef]
- De Jonghe, C.; Meeus, L.; Belmans, R. Power exchange price volatility analysis after one year of trilateral market coupling. In Proceedings of the 5th International Conference on the European Electricity Market IEEE, Lisboa, Portugal, 28–30 May 2008. [Google Scholar]
- Ziel, F.; Steinert, R.; Husmann, S. Forecasting day ahead electricity spot prices: The impact of the EXAA to other European electricity markets. Energy Econ. 2015, 51, 430–444. [Google Scholar] [CrossRef]
- Mandelbrot, B. The variation of some other speculative prices. J. Bus. 1967, 40, 393–413. [Google Scholar] [CrossRef]
- Sapio, S. Modelling the distribution of day-ahead electricity returns: A comparison. Quant. Financ. 2012, 12, 1935–1949. [Google Scholar] [CrossRef]
- Alvarado, F.; Rajaraman, R. Understanding price volatility in electricity markets. In Proceedings of the 33rd Annual Hawaii International Conference on System Sciences, Maui, HI, USA, 4–7 January 2000; pp. 1–5. [Google Scholar]
- Benini, M.; Marracci, M.; Pelacchi, P.; Venturini, A. Day-ahead market price volatility analysis in deregulated electricity markets. In Proceedings of the IEEE Proceedings of PES Summer Meeting, Chicago, IL, USA, 21–25 July 2002; Volume 3, pp. 1354–1359.
- Simonsen, I. Volatility of power markets. Phys. A Stat. Mech. Its Appl. 2005, 335, 10–20. [Google Scholar] [CrossRef]
- Koopman, S.J.; Oms, M.; Carnero, A.M. Periodic Seasonal Reg-ARFIMA–GARCH Models for Daily Electricity Spot Prices. J. Am. Stat. Assoc. 2007, 102, 16–27. [Google Scholar] [CrossRef]
- Tully, E.; Lucey, B.M. A power GARCH examination of the gold market. Res. Int. Bus. Financ. 2007, 21, 316–325. [Google Scholar] [CrossRef]
- Baur, D.G.; McDermottc, T.K. Is gold a safe haven? International evidence. J. Bank. Financ. 2010, 34, 1886–1898. [Google Scholar] [CrossRef]
- Auer, B.R. How does Germany’s green energy policy affect electricity market volatility? An application of conditional autoregressive range models. Energy Policy 2016, 98, 621–628. [Google Scholar] [CrossRef]
- Li, Y.; Flynn, P.C. Deregulated power prices: Comparison of diurnal patterns. Energy Policy 2004, 32, 657–672. [Google Scholar] [CrossRef]
- Li, Y.; Flynn, P.C. Deregulated power prices: Comparison of volatility. Energy Policy 2004, 31, 1591–1601. [Google Scholar] [CrossRef]
- Selvanathan, E.A.; Rao, D.S. Fixed and Chain Base Index Numbers. In Index Numbers; Palgrave Macmillan: London, UK, 1994; pp. 111–139. [Google Scholar]
- Eurostat, Statistic Explained. Available online: https://ec.europa.eu/eurostat/statistics-explained/index.php?title=Glossary:Chain_index (accessed on 26 July 2022).
- Cortes, G.S.; Gao, G.P.; Silva, F.B.; Song, Z. Unconventional Monetary Policy and Disaster Risk: Evidence from the Subprime and COVID-19 Crises. J. Int. Money Financ. 2022, 122, 102543. [Google Scholar] [CrossRef] [PubMed]
- Radukić, S.; Mastilo, Z.; Kostić, Z.; Mastilo, D. Measuring the Market Power in the Context of the Behavioural Economics and Industrial Organization. In Modelling Economic and Social Behaviour; Lucas, A., Sanches, J., de la Poza Plaza, E., Gimenez, P.M., Celani, A., Eds.; Nova Science Publishers, Inc.: Hauppauge, NY, USA, 2020; pp. 245–260. [Google Scholar]
- Sadik-Zada, E.R.; Niklas, B. Business cycles and alcohol consumption: Evidence from a nonlinear panel ARDL approach. J. Wine Econ. 2021, 16, 429–438. [Google Scholar] [CrossRef]
Disclaimer/Publisher’s Note: The statements, opinions and data contained in all publications are solely those of the individual author(s) and contributor(s) and not of MDPI and/or the editor(s). MDPI and/or the editor(s) disclaim responsibility for any injury to people or property resulting from any ideas, methods, instructions or products referred to in the content. |
© 2024 by the authors. Licensee MDPI, Basel, Switzerland. This article is an open access article distributed under the terms and conditions of the Creative Commons Attribution (CC BY) license (https://creativecommons.org/licenses/by/4.0/).