Abstract
The isoflavones in the cotyledon of soybean seeds mimic human estrogen in structure, conferring them complex effects on health. Their regulation represents a major challenge for the sustainable breeding of new varieties with lower levels of potential endocrine disruptors. To develop a rapid, nondestructive, and eco-friendly analysis method, this study explores how sample grinding affects the results of near-infrared spectroscopy (NIRS) and the preprocessing methods. The prediction of the daidzein and genistein content would help the specific reduction in isoflavones in the cotyledon without harming seed development. The potential of a nonlinear approach (artificial neural network) is also compared with the more conventional partial least squares (PLS) regression. The isoflavone content of cotyledons from 529 soybean samples (65 genotypes) was quantified by HPLC, and the NIR spectra of these samples were collected using a Brucker multi-purpose analyzer. The spectra of whole and ground cotyledons were also collected for 155 samples. The results show that grain fragmentation improves the model calibration, although spectral preprocessing can harmonize this effect. Although the best PLS regression in cross-validation did not suffice to quantify the daidzein and genistein percentages, the artificial neural network (ANN) approach allowed us to develop much more reliable models than PLS. The performance of ANNs in external validation is remarkable in terms of both precision and applicability (R2 = 0.89 and a ratio of prediction to deviation of 2.92), making ANNs suitable in the breeding context for screening soybean grains regarding their isoflavone content.
1. Introduction
Soybeans are an excellent source of protein and are rich and balanced in essential amino acids, making them ideal for a healthy diet. Soy foods (tofu, soy milk, etc.) are a major sustainable alternative to meat products. They are usually made from fractionated seeds, using only the cotyledons []. Soybeans can also accumulate isoflavones in greater amounts than other legumes, making soy production the main source of isoflavones in alimentation []. Since their discovery in the 1940s, the impact of isoflavones on health has been extensively explored and widely detailed in the scientific literature []. With a structure closely mirroring human estradiol, soy isoflavones can bind to estrogen receptors [], producing agonist or antagonistic effects that can have a variety of beneficial and adverse effects on health. On the positive side, isoflavones help prevent and treat hormonal cancers, menopausal symptoms, osteoporosis, and cardiovascular diseases [,,,,,,]. However, despite these positive health aspects, isoflavones are endocrine disruptors and can adversely affect fertility in young individuals and disrupt the proper functioning of the thyroid [,,]. Thus, the consumption of isoflavones is not recommended for children and pregnant women. Reports have raised concerns among the population, urging industry to label products and develop more restrictive regulations [,]. To offer a more sustainable variety of soybeans, breeders are developing a soybean line with lower isoflavone levels in the cotyledons.
Apart from their impact on health, isoflavones play a critical role in plant development and physiology. Roots exude isoflavones into the soil, triggering a symbiotic association with Rhizobium japonicum, which fixes atmospheric nitrogen []. As phytoalexins, isoflavones are also involved in defending against microbial pathogens and in signaling abiotic stress []. Isoflavone molecules have a common skeleton of 3-phenylchromen-4- []. Soybean seeds have 12 isoflavone molecules: three aglycones (daidzein, genistein, and glycitein), each with four decoration forms (Figure 1). The three aglycones appear mainly in the malonyl form (≈90%) and glycosyl form (≈10%) []. The acetyl or free aglycone forms are the only traces that may increase with seed degradation, either through fermentation or the influence of heat on the tissues [,]. Although the coat’s seed is devoid of isoflavones, cotyledons are the main reservoir in absolute quantities (predominantly conjugated daidzein and genistein). Despite constituting only 2–3% of the entire seed, the embryo axis accumulates 4 to 10 times more isoflavones than the cotyledon (mainly glycitein and daidzein), although the accumulation of isoflavones in these two parts of the seed is not correlated [,]. The challenge for soybean breeders is to reduce the isoflavone content in cotyledons used for human consumption without affecting the isoflavones of the embryo axis, which are required for proper plant development. Therefore, the isoflavone content in cotyledons should be specifically phenotyped to distinguish cotyledon-specific genistein from daidzein.
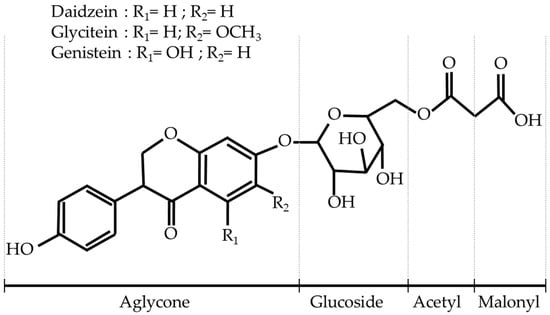
Figure 1.
Aglycone and conjugation diversity of isoflavones in soybean seeds.
Isoflavones are commonly quantified after separation by HPLC, followed by mass spectrometry or UV detection. Capillary electrophoresis and/or testing by enzyme-linked immunosorbent assay may also be applied [,,,]. These methods are widely used to quantify each isoflavone separately in various media such as seeds, tofu, milk, or flour. However, such techniques require training, equipment, time, and environmentally harmful chemicals and supplies. Thus, the exponential cost of HPLC methods for the environment and for breeders makes them unsuited for the significant sample output from plant-breeding programs.
In contrast, near-infrared spectroscopy (NIRS) is a versatile tool that can predict both the quantitative and qualitative properties from a wide range of matrices. It is applied in quality control for industrial processes and the quantification of macro and micro components in both raw materials and final products [,]. The strength of NIRS lies in its rapid, nondestructive analysis, environmental compatibility due to its solvent-free operation, user-friendly interface, and cost-effectiveness. Since the 2000s, NIRS applications for soybeans have been numerous and thoroughly documented. Today, industry and breeders apply classic chemometric tools to process NIR spectra for the quality control of soybean seeds [,]. The major parameters targeted by NIRS are protein, oil, moisture, and seed viability [,,]. Two decades of calibration improvements, with new samples added each year, have made prediction models for single seeds or bulk samples remarkably robust and accurate [,].
Isoflavone phenotyping by NIRS has been widely investigated (Table 1). The different studies vary significantly in database size, analytical instruments, soybean matrixes, spectra preprocessing, statistical approaches, modeling tools, and validation methods. Despite varying results for the coefficient of determination (R2), the root-mean-square error (RMSE), and the ratio of prediction to deviation (RPD), the overall conclusion is that NIRS is promising for rapidly and reliably predicting isoflavone content. However, grey areas remain for modeling in a breeding context.
First, the seed is consistently considered as a single entity, neglecting the independent contribution of the cotyledon and embryo axis to isoflavone content. Thus, NIRS prediction for isoflavones intended for food processing should be specific to each part of the seed. The primary aim of this study is to investigate the feasibility of predicting cotyledon isoflavone content from whole-seed spectra. Comparing the predictive capabilities of the seed and cotyledon spectra should validate this objective. Differences between whole or ground (higher homogeneity) matrices can affect the quality of the calibration [,]. Ground and peeled matrices enhance calibration quality due to better homogeneity [] (although this point is still debated []). Thus, we compare the calibration performed on whole and ground cotyledons with the calibration performed on the overall seed matrix. In addition, prior studies have not investigated how the preprocessing method affects the results (Table 1). Savitsky–Golay, multiplicative scatter correction (MSC), standard normal variate (SNV), normalization of the mean, or raw spectra are commonly used to predict isoflavones from soybean spectra. However, the emphasis of these techniques is optimizing the calibration, leaving the direct applicability of the spectral transformation less explored. Calibrating NIRS thus also requires comparing matrix spectra.
Second, since breeders want to reduce cotyledon isoflavones in food without affecting plantlet symbiosis, which is linked to isoflavones in the embryo axis, we should consider the diverging composition of these two seed parts. As described above, the 12 isoflavones can be classified into 3 subtypes based on their aglycone structure. Daidzein is present in both the cotyledon and embryo axis, whereas genistein is more specific to the cotyledon and glycitein than to the embryo axis. Contrary to quantification by NIRS of the total isoflavone content, aglycone profiling remains poorly investigated, making it challenging to reduce genistein specifically. From an NIRS perspective, the ability to phenotype the percentage of daidzein and genistein is as important as phenotyping their absolute quantities to reduce cotyledon-specific isoflavones. Although several studies have aimed to predict the content of each conjugation of each aglycone, the performance varies without explanation and no attempt has been made to predict the aglycone percentage [,,]. Rectifying this situation is the second objective of the present work.
Third, the use of nonlinear approaches such as artificial neural networks (ANNs) remains under-investigated, even in the studies using the largest and most complete database [] or in the most recent work published confirming the results of Berhow’s team []. RPDs between two and three open the possibility of using Berhow’s calibration for rough screening []. Unfortunately, neither of these two studies explores the possibilities offered by ANNs or tests the direct applicability of the prediction method on whole seeds.
The present work seeks to fill the remaining grey areas (or thresholds) by developing an NIRS-based calibration method adapted to soybean breeders for the rapid phenotyping of isoflavone concentration in cotyledons (Figure 2).
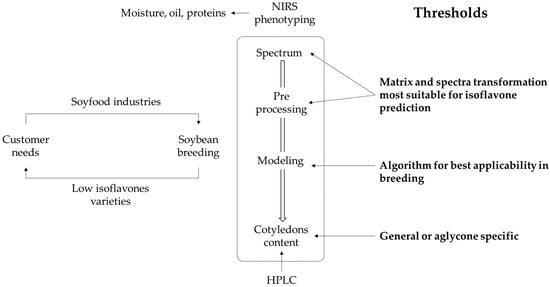
Figure 2.
Issues limiting the development of prediction models based on NIRS of isoflavone content for soybean breeding.

Table 1.
Properties and results of published work modeling isoflavone content from soybean seeds NIRS (SNV: standard normal variate; SG: Savitsky–Golay derivative; MSC: multiplicative scatter correction; ANN: artificial neural network; PLS: partial least squares regression; MPLS: modified partial least squares regression; MLR: multiple linear regression).
| Coulomb et al., 2004 [] | Sato et al., 2008 [] | Baianu et al., 2012 [] | Zhang et al., 2017 [] | Berhow et al., 2020 [] | Amanah et al., 2022 [] | |
|---|---|---|---|---|---|---|
| Collection size | 500 | 48 | 50 | 269 | 3159 | 310 |
| Number of cultivars | 162 | 20 | 50 | / | / | 65 |
| NIRS system | FOSS NIR System 6500 | InfraAlyzer 500 | FT-NIR Perkin Elmer Spectrum | Foss NIRS DS 2500 with standard 1.5 m 210/7210 bundle fiberoptic probe | FT-NIR Perkin Elmer Spectrum | FT-IR Nicolet 6700 |
| Matrix analyzed by NIRS | Whole seeds | Whole and ground seeds | Cut in half seed | Whole seeds | Ground seeds | Individual seed and ground seeds |
| Replicate spectrum | 1 | 1 | 3 | 2 | 1 | 21 |
| Spectrum range | 400 to 2500 nm | 1100 to 2500 nm | 800 to 2500 nm | 400 to 2500 nm | 1000 to 2500 nm | 2500 to 25,000 nm |
| Preprocessing | SNV detrend and 1st SG | 1st. 2nd and 3rd SG | MSC | SNV | 1st SG | 1st and 2nd SG. MSC and SNV |
| Variable predicted | Total isoflavones | Each and total isoflavones | Total isoflavones | Each and total isoflavones | Each aglycones and total isoflavones | Total isoflavones |
| Isoflavone content range | 1.74 to 10.35 mg/g | 1.33–6.33 mg/g dry matter | 0.3–6.0 mg/g | 0.247–2.512 mg/g | 0.27–9.55 mg/g | 0.72–4.33 mg/g |
| Modeling tool | ANN | MLR and PLS | PLS | MPLS | MLR | PLS |
| Validation set | External 25% | External 25% of database | Cross Validation | Cross Validation | External 25% | External 30% |
| R² from prediction set | 0.74 | 0.82 from whole seeds and 0.95 from ground seeds | 0.997 | 0.77 | 0.8 | 0.80 from whole seeds and 0.92 from ground seeds |
| RMSE from prediction set | 0.74 mg/g | 0.66 mg/g dry matter from whole seeds and 0.40 mg/g dry matter from ground seeds | 0.017% | 0.122 mg/g | 0.616 mg/g | 0.30 from whole seeds and 0.33 g/mg from ground seeds |
| RPD from prediction set | 1.85 | 1.78 from whole seeds and 2.93 from ground seeds | / | 3.58 | 2.13 | 2.56 from whole seeds and 2.33 from ground seeds |
2. Materials and Methods
2.1. Soybean Materials
The soybean seeds (Glycine max) used in this study came from six experimental fields cultivated over four years. The collection includes 529 soybean samples from various experiments spanning from 2017 to 2022 (Table 2). Locations 1–3 are in southern France; locations 4 and 5 are in northern France; and location 6 is in southern Germany.
Table 2.
Repartition of samples by origins and year of cultivation.
Overall, the collection has a genetic diversity of 65 cultivars, mainly taken from the current and former RAGT and LIDEA commercial ranges and enhanced with exotic worldwide material. The genotypes making up the sample collection are representative of those grown at all European latitudes. The addition of non-European varieties is motivated by the need to improve the versatility and robustness of the models.
The days required for complete soybean development can vary significantly from one variety to another []. The maturity group for late varieties is indicated by Roman numerals from I to X. For varieties earlier than I, we added zeroes until “0000” for the earliest. The maturity groups in the database range from 0000 to III.
Most samples came from genotypes with yellow seed coats (76%). Of these, two-thirds had a black hilum, while the remainder had a yellow hilum. Some of the genotypes in this study had mottled seed coats with frequent dark patches of varying size. Most of these colored seeds had a black hilum, while only a fifth had a yellow hilum. All genotypes in this study had yellow cotyledons. Seed quality varied according to the origin of the soybean lots. A minority of whole-bean samples contained some pod debris.
Most of the samples (65%) came from the “SOJAMIP” experiment described in [] and developed by INRAE at Auzeville (southern France) over two years (2017–2018) [].
Of the 529 samples, 155 were investigated to collect spectra from whole cotyledons and ground cotyledons. These are exclusively from location 1 and were collected during the 2017 and 2018 experiments. They are composed of six genotypes, four of which are in the maturity groups I and II, with the remaining two in the maturity group 000.
2.2. Sample Extraction and HPLC Analysis
The reference analysis for isoflavone content was performed using HPLC analysis of ground cotyledons. After 72 h of freeze-drying, 30 g of seeds were processed following the method of Ref. []. A 2 min 140 °C heat shock followed by manual beating broke up and separated the seeds, allowing extraction of whole cotyledons. The cotyledons were then ground into powder using a ball mill for 1 min 30 s at 30 shakes/s (Figure 3).
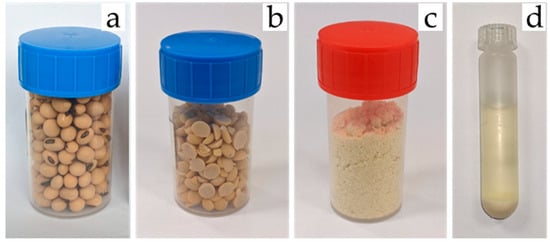
Figure 3.
The four stages of sample transformation for isoflavone extraction and HPLC analysis: (a) whole seeds; (b) whole cotyledons; (c) ground cotyledons; (d) diluted ground cotyledon in extraction solvent.
Extraction of isoflavones and HPLC analysis followed the method described in Ref. []. An aliquot of 300 mg of ground cotyledons was diluted in 7 mL of methanol/water (80:20). The extraction by agitation for two hours at room temperature [Figure 3d] was followed by centrifugation at 3000 rpm for 10 min. A volume of 275 µL of the supernatant was deposited in a 0.2 µm filtering plate and centrifuged 1 min at 2000 rpm. The sample was then filtered down to the analysis plate, which was then sealed.
The HPLC device consisted of a Thermo Scientific Dionex Ultimate 3000. A gradient mobile phase composed of two eluents ran through the system. The first eluent was Milli-Q® filtrated water with 0.05% trifluoroacetic acid (Fisher Scientific, Bordeaux, France). The second eluent was acetonitrile RS HPLC (Carlo Erba Reagents, Heudebouville, France). The static phase used to separate molecules was a C18 analytical column (Turbo Gold 80 ODS-3 33 × 4.6 mm, 80 Å, made by CIL Cluzeau, 33220 Sainte-Foy-La-Grande, France). The isoflavones were detected by a UV diode array detector at 260 nm. The software Chromeleon (version 2.7.10) associated with the device allowed recovery of the 12 individual isoflavone peaks (Figure 4). The concentration of each isoflavone was calculated from the dilution ratio of the extraction and by external calibration through a standard range of daidzein, glycitein, and genistein and their glycosylated forms provided by ChromaDex Standards (Longmont, CO, USA).
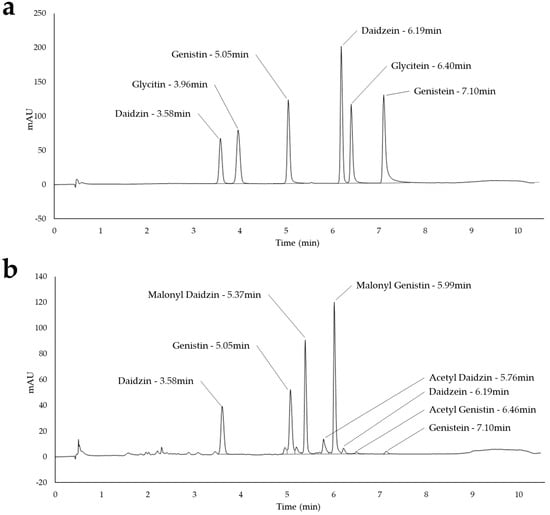
Figure 4.
HPLC chromatograms for (a) the six standards and (b) extraction from the cotyledon sample.
2.3. Expression of Isoflavone and Aglycone Contents
The total isoflavone content (mg/g of seed dry weight) of the 12 isoflavones is the sum of their individual concentration. Next, for each aglycone sub-type (daidzein and genistein), the aglycone equivalent was calculated (molecular weight without considering the acetyl, malonyl, and glucosyl decorations) and expressed in absolute values (mg aglycone equivalent per gram of seed dry weight) or relative values (percentages). Aglycone decorations have no estrogenic power and are not heritable traits for selection. The literature highlights the need to estimate isoflavones in aglycone equivalent for reproducible monitoring in the agri-food sector []. Nevertheless, to allow comparison with similar studies, we focused on content in mg/g of seed dry weight.
Twenty percent of the samples were tested twice to verify repeatability. The RMSE between the two measurements was divided by the calculated mean content to obtain the percent error of the reference analysis method.
2.4. Acquisition of Near-Infrared Reflectance Spectra
The NIR reflectance spectra were acquired using a Bruker multi-purpose analyzer equipped with a rotating bucket. Each sample was analyzed with 60 g of whole, untreated seed; triplicates were made over three different days of acquisition. The device measured 64 scans in reflectance mode from 12,500 to 3600 cm−1 with a wavelength step of 0.25 nm. Outliers in the spectrum dataset were controlled by analyzing the F residuals and Hoteling T2 values. The limits of acceptability were set at 5% for these indicators.
NIRS of whole cotyledons followed the method described for whole seeds. Acquisition of NIR reflectance spectra from ground cotyledons differs only in the sample container: approximately 4 g of ground cotyledons was analyzed inside a static quartz cup. The preprocessing method and the parameters of partial least squares regression (PLSR) development are the same for all the matrices.
2.5. Data Processing and Chemometrics
2.5.1. Descriptive Analysis of Isoflavone and Aglycone Contents
The variables were tested for normality (Shapiro–Wilk, alpha risk 5%). Correlation between the variables was calculated using the Pearson method for a normal distribution. The Spearman method was used for non-normal variables. The significance of the coefficients was tested by t-test (alpha risk 5%). The same methodology was used to determine correlations between loadings and between weights of the PLS models to measure the prediction specificity of the variables associated with cotyledon isoflavones. Co-variations were also verified by correlation tests between two quantitative variables or by an analysis of variance between a quantitative variable and qualitative sample parameters such as year of origin, location of origin, or color of seed coat.
2.5.2. Preprocessing of NIR Spectra
Most preprocessing described in the literature and noted in Table 1 was applied individually, with and without smoothing, by a window of 3.75 nm moving average. We analyzed the first and second Savitsky–Golay derivatives (SG1 and SG2), an SNV transformation with zero, one, or two detrending transformations, and MSC. These spectral preprocessing methods were tested on the three matrices (whole seeds, whole cotyledons, and ground cotyledons). The objective of the final application was to select the method that produces the best PLSR results on the whole-seed spectra and apply it to the remaining database samples. The effect of preprocessing was determined via cross-validation [].
2.5.3. Development of PLSR Models to Quantify Total Isoflavone Content, Daidzein and Genistein Contents, and Percentages
To predict aglycone content, the proposed approach was more ambitious than the published methods in two ways. First, it assessed whether percentages could be predicted with the same accuracy as absolute aglycone contents (daidzein and genistein). Second, it determined which wavelengths were specific to the loadings of the model designed to predict isoflavones or each aglycone. Models were developed based on the preprocessed spectra. The PLSR was based on the absorbance of the 2307 absorbance variables to predict isoflavone, daidzein, and genistein contents and daidzein and genistein percentages. The weights of predictors and responses were initially defined as constant and equal. The first 20 factors were investigated as maximum components, and the factor choice was made at the maximum explained variance. The model inputs were determined by the nonlinear iterative partial least squares algorithm with maximum iterations set at 100. The maximum increase in residual variance was set at 6.0%.
2.5.4. Development of ANN Models to Quantify Total Isoflavone Content
We compared the accuracy of the ANN model and the PLS regression model to predict the total isoflavone contents (mg/g). A successful indirect NIRS technique to analyze isoflavone content must enable breeding programs to phenotype unknown material with calibration models. Thus, a realistic assessment of the predictive potential of candidate models requires a sample set dedicated to validation (i.e., not involved in the model’s development). We thus selected the Kennard–Stone sampling method because it withholds a representative set of samples for calibration []. Repartition of the samples was performed based on the average of the triplicate reflectance spectra from each sample. To fairly compare PLSR with the ANN method, both were constructed and externally tested with the same samples. The training set for calibrating the ANN was determined using the Kennard–Stone method and comprised 70% of the samples from the database. The same algorithm assigned half of the remaining samples to the internal validation set needed to calibrate the model (i.e., 15% of the samples in the database). The remaining 15% were designated as the test set for prediction. The PLSR used the same subsets for external validation (15% of the samples). PLSR calibration was performed using the training and validation sets sampled for the ANN (85% of the samples). The ANN structure contained 2307 input neurons (one for each input variable) and one neuron for the output variable. Two to twenty neurons were added as a hidden layer to find the best ANN architecture over 500 iterations with three replicates. The Akaike fitness criterion determined the number of neurons in the hidden layer. The logistic, hyperbolic tangent, and linear activation functions were tested for managing the hidden layer and output values. The network was trained with the conjugate gradient algorithm over 500 iterations with the training set, and the weights were automatically randomized by the software. The validation set was used to retrain the network over 50 iterations based on the output error function (the sum of squares method). Following the development and retraining phase, the model was evaluated on the test set, which consisted of samples unknown to the model.
2.5.5. Evaluation of the Performance of Each Predictive Model
The performance of prediction models frequently involves the measurement of a few selected parameters. The quality of the linear regression between the predicted and reference data is given by R2, which gives the fraction of the reference variance explained by the model. The RMSE is a measure of the error and is often used to assess the accuracy of a model. It is defined as
and can be expressed as a percentage when divided by the average value of the reference data. The applicability of the prediction model can then be approached by the RPD [,], which is the standard deviation of the reference values divided by the RMSE of prediction and indicates the suitability of the model for screening classes or for the routine quantitative determination of new samples. The use of a prediction model for rough screening is appropriate for RDP values above two. Above three, the RPD indicates the applicability is sufficient to allow quantitative analysis and quality control.
2.5.6. Software
The NIR spectra were obtained using OPUS (version 8.5.29), and the descriptive statistics were produced by Xlstat (version 2023.2.0). Removing outlier spectra, principal component analysis (PCA), spectral preprocessing, and PLSR model development were performed using Unscrambler X by CAMO (version 10.4–64 bit). Kennard–Stone repartition was performed using MATLAB R2020a with update 7 (9.8.01721703). Finally, the ANN was developed using Alyuda NeuroIntelligence © (version 2.2).
3. Results and Discussion
3.1. Total Isoflavone, Daidzein, and Genistein Content in Cotyledons Determined by HPLC
The average percent errors of HPLC analysis for total isoflavone (mg/g), total isoflavone (mg/g eq. aglycones), daidzein content (mg/g eq. aglycones), genistein content (mg/g eq. aglycones), daidzein proportion (%), and genistein proportion (%) between two extractions are 9.1%, 9.4%, 9.5%, 9.1%, 2.4%, and 1.9%, respectively.
The complete database comprises 529 samples, with total isoflavone contents ranging from 0.26 to 8.56 mg/g and averaging 2.63 mg/g. The range for cotyledon contents corresponds to the range of seed content reported in the literature for NIRS calibrations of isoflavones (Table 1). Samples with contents below 2.5 mg/g are overrepresented, and samples with contents above 4 mg/g are underrepresented. The distribution is not homogenous, and the skewness is positive. All expressions of isoflavone content, specifically aglycone content, and proportions correlate significantly with each other, with p values significantly less than 0.05.
Fermentation or temperature changes can degrade aglycone conjugations and influence the ratio between total content mg/g and aglycone equivalent content mg/g []. Thus, significant differences between these two isoflavone expressions must be monitored for samples degraded by harvesting or storage. Overall, the two expressions of total isoflavone content, as mg/g or as mg aglycone equivalent, are almost linear to each other (R2 = 0.998). Samples from location 1 spent several years in outdoor storage and were exposed to seasonal temperature variations. Using the Student’s t-test to determine the ratio of conjugate content to aglycone equivalent content at different collection sites confirms this hypothesis. The ratio for samples from location 1 was significantly less than that of samples from other locations (mean was 1.74 and 1.84, respectively, p < 0.0001). Because these storage conditions led to a discrepancy between the two possible expressions of isoflavones (in aglycone equivalence or not), we must monitor for bias in the prediction of the content of these samples. Samples from location 6 were low quality because this crop was damaged by rain and moth attacks. However, location made no difference in terms of mg/g or aglycone equivalent mg/g ratio.
The samples have an average daidzein content of 40%, whereas genistein is predominant in most samples. The percent contents of daidzein and genistein are dependent variables with a high correlation coefficient (R = 0.905). Conversely, total content correlates less with the proportions of the two aglycones: daidzein with R = 0.499 and genistein with R = 0.303. The maturity group, expressed by a score ranging from 0 to 6 (for groups 0000 to III of the panel), is not correlated with the total isoflavone content (R = 0.024), or with the percent of daidzein (R = 0.129), or genistein (R = 0.102).
The analyses of the isoflavone content reference span multiple years of analytical campaigns. As samples were harvested and collected from the collections, eight sessions of sample transformation and HPLC extraction and analysis were conducted consecutively between 2021 and 2023. Isoflavone concentration in soybean cotyledons is determined by genetic and environmental factors. According to an analysis of variance, the isoflavone content in cotyledons does not significantly affect the hilum and coat colorations. The sample characteristics depend considerably on the environment in which they were collected. The variations observed in all samples studied are comparable to those described in the literature for a panel of diversified varieties and cultivation sites [].
Of the 529 samples, 29.3% were separated, and whole and ground cotyledons were scanned. This database is characterized by fewer samples with high isoflavone levels (Table 3). With respect to the database a with 529 samples, the database b contains half as many samples with greater than 2 mg/g. Consequently, the variability in the database b is significantly reduced, as is the average isoflavone content of the samples. The proportions of genistein and daidzein in the samples are comparable between the two databases in terms of both average and range, although they vary less.
Table 3.
Descriptive statistics of isoflavones content of cotyledons from (a) all samples (n = 529) and (b) from the set of samples analyzed using all their cotyledon spectra and their ground-cotyledon spectra (n = 155).
The sets sampled for the ANN and PLS training are like all sets regarding total mean content, standard deviation, and quartiles (Table 3 and Table 4). The descriptive statistics of the training sets are likewise equivalent to the results of the ANN validation set and the ANN and PLS test set. Sets sampled with the Kennard–Stone method using averaged whole-seed spectra are representative in terms of cotyledon isoflavone content.
Table 4.
Descriptive statistics of total isoflavones (mg/g) in cotyledons from Kenard–Stone-sorted set as training, validation, and test for PLS and ANN regressions.
3.2. Raw and Preprocessed Near-Infrared Spectra
As highlighted by Ref. [], the diversity in growing conditions contributes to the robustness and applicability of NIRS prediction models for isoflavone content. This study involves the greatest number of different environments to date. The year and location of origin affect the variability in whole-seed spectra, as shown by the distribution of samples produced by the PCA (Figure 5). Samples from location 6 in 2021 stand out due to their degraded seed quality caused by harvest conditions.
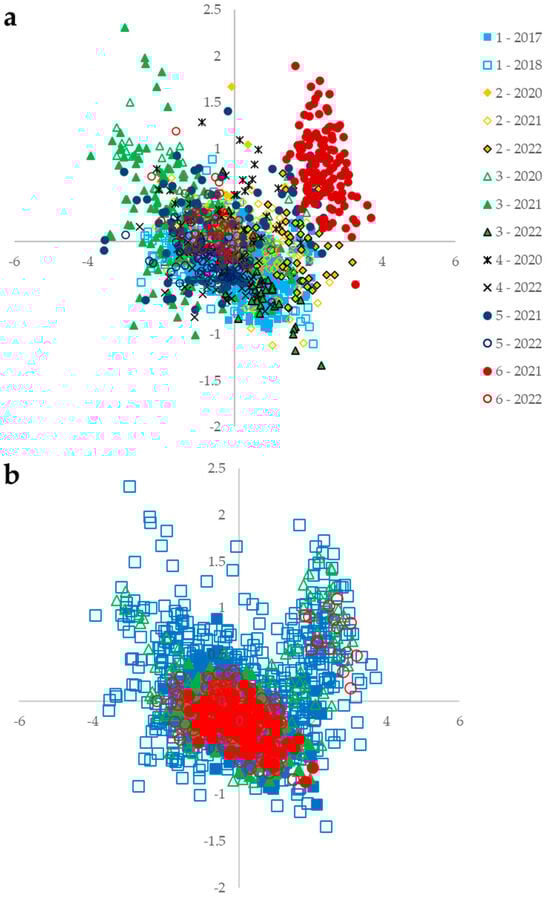
Figure 5.
PCA of whole-seed spectra from all sets with the first component plotted horizontally (84% of variability) and the second component plotted vertically (11% of variability). (a) Origin location and year are given by color and symbol (squares, triangles, etc.). (b) The samples from which the whole-cotyledon and ground-cotyledon spectra were collected are shown by filled symbols. Sets for PLSR and ANN are shown by color and symbol. The training sets for PLS and ANN are blue squares, the validation set for ANN is green triangles, and the test sets for PLS and ANN are red circles.
The external validation and test sets for PLS and ANN (red circles in Figure 5b) are also representative of the overall variability in whole-seed NIR spectra of the training set. Samples with spectra of whole cotyledons and ground cotyledons (filled symbols on the PCA in Figure 5) are concentrated in the center of the PCA. The variability in their spectra is limited compared with all the samples surveyed. The distribution of samples on the PCA based on maturity groups or coat and hilum color is evenly spread over the spectra’s PCA. The genetic features of earliness or seed appearance have no effect on the outcome of the NIRS measurement in this study.
In terms of absolute absorbance, the spectra of the three matrices are well differentiated as functions of wavelength (Figure 6). Ground cotyledons absorb less NIR radiation, and whole cotyledons absorb more NIR than do whole seeds. The differences in absorbance between matrices are corrected by preprocessing (Figure 7). The spectra of the three matrices share common trends. These observations for the three matrices and their specific variations can be seen in the spectra after treatment with SG1, SNV with or without detrending, and MSC (Figure 6). However, processing with SG2 does not allow the matrices to be clearly distinguished, nor does it produce the variations described above.
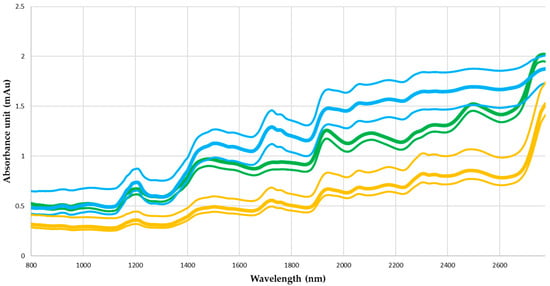
Figure 6.
Average, maximum, and minimum absorbance spectra from whole seeds (green curves), whole cotyledons (blue curves), and ground cotyledons (yellow curves).
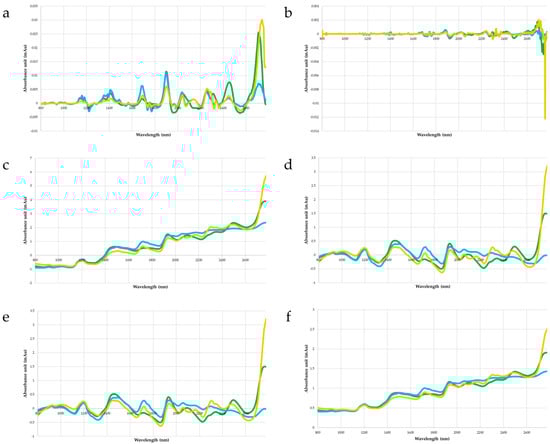
Figure 7.
Average absorbance spectrum from whole seeds (green curves), whole cotyledons (blue curves), and ground cotyledons (yellow curves) after smoothing by moving average with a 3.75-nm window and spectra transformation: (a) SG1, (b) SG2, (c) SNV, (d) SNV follow by detrending, (e) SNV follow by twice detrending, and (f) MSC.
3.3. Development of PLS Models for Predicting Total Isoflavone Content
3.3.1. Comparison of Preprocessing of Infrared Spectra (Whole Seeds, Whole Cotyledons, and Ground Cotyledons)
The matrices exert the greatest influence on the calibration results. For each pretreatment, R2, RMSE, percent error, and RDP for the whole-cotyledon spectra are improved with respect to the whole seeds, and the same is true for ground cotyledons compared with whole cotyledons (Table 5). Without pretreatment, predictions based on whole-cotyledon spectra are more accurate than predictions based on whole-seed spectra. This result may be explained by the presence of embryo axis isoflavones within seeds, which may interfere with the quantification of cotyledon isoflavones. Grinding the NIRS sample improves model performance, corroborating previous results [,]. Grinding the cotyledons increases the surface area of interaction between infrared light and the sample constituents, thus promoting more accurate data acquisition. At the same time, grinding homogenizes samples, reducing potential variations between samples (density, thickness, etc.).
Table 5.
(a) Calibration and (b) cross-validation results of PLSR based on whole-seed, whole-cotyledon, and ground-cotyledon spectra (each n = 155 samples, 465 spectra) with different preprocessing to predict isoflavone concentration (mg/g) (RS: raw spectra; MA: moving average; SG1: first derivative of Savitsky–Golay, SG2: second derivative of Savitsky–Golay; SNVD1: standard normal variate and single detrending; SNVD2: standard normal variate and double detrending; MSC: multiplicative scatter correction).
In addition, the preprocessing correlates strongly with the matrices analyzed to calibrate the prediction models. Without pretreatment or with moving average alone, predictions based on whole-cotyledon spectra are more accurate than those based on whole-seed spectra, and predictions based on ground-cotyledon spectra are more accurate than those based on whole-cotyledon spectra (Table 5). These results for cross-validation without preprocessing corroborate the external validations based on preprocessed spectra []. Using ground-matrix spectra significantly improves R2 and decreases the prediction error compared with the results obtained from whole matrices. Reference [] described the same phenomenon at longer wavelengths, with the caveat that grinding slightly increases the error level. However, the similarities with the literature stop at the calibration results and cross-validation of spectra without pretreatment. Pretreatment has a stronger influence on the cross-validation results than does the matrix that is analyzed.
The use of preprocessing seems to harmonize cross-validation results between the three matrices. The choice of preprocessing becomes the dominant factor in the cross-validation performance of the models, and the matrix involved becomes secondary. For all matrices, smoothing the spectra by applying a moving average improves cross-validation predictions for all preprocessing. The use of SG1 and SG2 severely degrades model predictions, independent of the matrix analyzed by NIRS. This result conflicts with the preprocessing recommended by Refs. [,,], despite the fact that these studies cover the same wavelength range as the present study. In the absence of moving-average smoothing, MSC preprocessing has only a small effect on model quality. As reported by Refs. [,], transforming spectra by SNV improves model prediction accuracy, and even more so with preliminary moving-average smoothing. The best calibration and cross-validation results based on whole-seed spectra were obtained by applying a moving average, followed by an SNV transformation and double detrending. This preprocessing scheme was retained and used for the next results of this study.
3.3.2. Modeling and Specific Wavelengths Selected for Aglycone (Daidzein and Genistein) Content and Proportion Prediction
The prediction of isoflavone content in aglycone equivalents gives similar results for R2, percent error, and RPD as the predictions of aglycone content (including decorations, Table 6). This result is attributed to the strong correlation between the two variables. The question of whether to consider aglycone conjugations is not a major issue for the development of NIRS prediction models for soybean breeding. The conclusions are the same for the following models of this study for predicting aglycone-equivalent content.
Table 6.
Cross-validation results from PLS regressions of whole-seed spectra (n = 529 samples, 1587 spectrum) to predict various isoflavone properties.
The cross-validation of the prediction of total daidzein content produces results comparable to those for the total content of all isoflavones, with a slightly larger error. In contrast, the total genistein content has a lower R2 and RPD. This difference in prediction between the two aglycones can be put into perspective by the fact that daidzein is present throughout the seed, whereas genistein is more specific to the cotyledons. Given that the models in this study are specific to cotyledon levels, the possibility of isoflavones in the embryo axis disrupting the predictions should be explored. The cross-validation of daidzein and genistein proportions produces very poor results. R2 and RPD are insufficient to reliably differentiate between samples dominated by daidzein in their cotyledons from those containing a majority of genistein. With the resources allocated by this study, profiling the type of isoflavones in soybean cotyledons is not recommended. In addition, no wavelengths stood out as specific to daidzein content or genistein content in the model loadings. Figure 8 shows the wavelengths emphasized by the four models (loadings) for predicting content in daidzein, genistein, and total isoflavones. The wavelengths most actively addressed by the models are 1430, 1660, 2130, 2290, 2360, and 2460 nm. These correspond to the second overtone regions of CH and H2O; the first overtone region of CH3; and the band combination regions of CH, CH2, and CH3, respectively [].
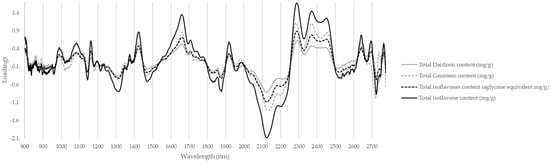
Figure 8.
Loadings by wavelength of PLS models predicting total isoflavone content (mg/g and mg aglycone equivalent per gram), daidzein content (mg/g), and genistein content (mg/g).
3.4. Nonlinear Modeling of Total Isoflavone Content in Whole Seeds with Artificial Neural Networks with External Validation
The best fitness scores are obtained with a hidden layer of two neurons for all combinations of hidden layer activation and output functions. The ANN architecture was therefore chosen for model development. Calibration and test performances depend on the functions used for the hidden layer and the output (Table 7). The results of the retraining validation set are less variable, with only the linear function for the hidden layer producing inferior results. Overall, building the ANN model (70% of samples for training and 15% for internal validation) and testing it on an external set (15% of samples) produces the best results when using a logistic function for the hidden layer activation and hyperbolic tangent or linear functions for the output activation function. With R2 = 0.89 and RPD = 2.92 for the external validation, the ANN results of this study are better than those of the external validations of Refs. [,,] for models developed from whole-seed spectra. In the literature, only models developed from cotyledon powder spectra or cross-validations produce better results [,,]. According to Ref. [], an RPD value of this level (i.e., 2.92) means that the model may be used for content screening and possibly quality control for a soybean breeding program. This applicability is estimated by considering the complex nature of bulk soybean seeds and the low concentration of the molecule investigated. The high genetic and cultural diversity of the plant material facilitates model inclusiveness thanks to variations in morphology and seed quality within the samples. In the future, the addition of such diversity with high-content samples, which is lacking in this study, would improve future calibrations.
Table 7.
Results of training, validation, and test set from ANN models of preprocessed whole-seed spectra (moving average + SNV + double detrending) to predict isoflavone concentration (mg/g).
Calibration of the PLS regression on the training set (85% of samples) gives R2 = 0.76 and RMSE = 0.72, for 27% relative error and an RPD of 2.03. The linear prediction model produces the following results for external validation: R2 = 0.80, RMSE = 0.62, 27% relative error, and RPD = 2.15. The ANN results are better than those for the PLS for both calibration and external validation, regardless of the activation function chosen for the hidden layer and the output (Table 7). Regarding the relative error, using nonlinear methods gives a precision up to double that of HPLC between two extractions. In comparison, the relative error of PLS is three times greater than the reference analysis. As pointed out by Ref. [], a low sample density at one end of the distribution can strongly influence the RPD estimate. The difference in RPD between the PLS and ANN is mostly explained by the better management of high-content samples by the nonlinear approach (Figure 9). A fair comparison of the two approaches requires excluding the upper half of the range and only considering samples with an isoflavone content less than 4 mg/g. On this reduced set, the RPD of the ANN and PLS predictions are 1.73 and 1.50, respectively. Although ANN retains its superiority on this reduced set, neither RPD result is satisfactory for discriminating content between low grades. This change in perspective highlights the fact that the use of the prediction models in this study should be directed toward detecting high levels rather than precise quantification. Each approach makes it possible to differentiate between the lowest values (below Q1 of the test set) and the highest values (above Q3 of the test set). No confusion between the two extreme classes occurs for the 237 predictions. The results of the ANN models vary in the same way as those for PLS according to the choice of preprocessing for whole-seed spectra (Table 5). In addition, the ANN models were tested on preprocessing, and the predicted target was investigated in the same way as for PLS. The results are not shown, but the conclusions remain the same as for the nonlinear approach: relevant preprocessing is the same as for PLS; the prediction results for percent of daidzein or genistein are poor; and no loadings stand out for aglycone or other.
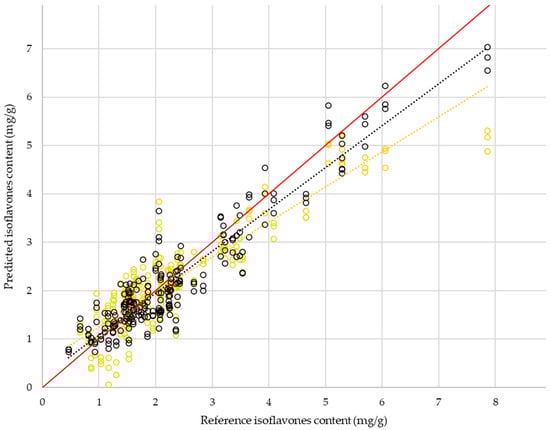
Figure 9.
Distribution of predicted isoflavone content by HPLC reference from external validation of PLS models (orange circles) and ANN models (black circles) made from whole-seed spectra with preprocessing by moving average, SNV, and double detrending.
4. Conclusions
This work demonstrates that it is possible to predict cotyledon content of isoflavones from whole-soybean spectra with satisfactory accuracy, making this technique applicable for sustainable screening. More accurate calibrations are generated with whole-cotyledon spectra, and even more so with ground-cotyledon spectra. Spectral preprocessing harmonizes cross-validation results between matrices, making it an essential element in the development of reliable models for unprocessed seeds. These results highlight the value of smoothing by moving average in combination with other preprocessing techniques. SNV transformation, potentially followed by detrending, seems to be the most relevant preprocessing option for isoflavone prediction. The models generated are homologous between the two expressions of total isoflavone (mg/g and mg equivalent aglycone per gram) and have similar cross-validation results. This research also highlights the non-specificity of PLS and ANN models for predicting daidzein and genistein contents. Furthermore, the accuracy with which the models predict daidzein and genistein proportions (%) is insufficient, so aglycone profiling is not recommended. The nonlinear approach is a major improvement for the development of prediction models and should be prioritized for future calibrations. With a logistic function for the activation of the hidden layer and a linear function for the output, the prediction models demonstrate spectacular results for external validation, with an error twice that of the reference analysis. This work also supports the selection of soybean varieties that are more suitable from a health standpoint, as well as the use of NIRS, which is more environmentally friendly than any other analytical alternative for isoflavone quantification.
Author Contributions
Conceptualization, J.B., C.L.-G., M.B. and A.A.; methodology, J.B., M.B. and C.L.-G.; software, J.B. and C.L.-G.; formal analysis, J.B.; investigation, J.B. and A.A.; resources, P.J.; data curation, J.B.; writing—original draft preparation, J.B.; writing—review and editing, J.B., M.B., A.A. and C.L.-G.; visualization, J.B.; supervision, C.L.-G. and M.B.; project administration, J.D. and P.J.; funding acquisition, J.D. and P.J. All authors have read and agreed to the published version of the manuscript.
Funding
This project was funded by ANRT (Association Nationale de la Recherche et de la Technologie) France (grant Cifre n° 2021/0425), LIDEA FRANCE, RAGT 2N and INP-PURPAN.
Institutional Review Board Statement
Not applicable.
Informed Consent Statement
Not applicable.
Data Availability Statement
Data are unavailable due to privacy considerations.
Acknowledgments
Special acknowledgements are due to all the technicians and interns who took part in sample preparation, even for just an afternoon. Their invaluable contribution has enabled the construction of the database that has made this research possible. Clara Migairou and Ines Venzac are thanked for their help with the HPLC characterization of isoflavones in the samples. Pierre Maury, Philippe Debaeke, Amandine Gras, and Roman Ferrant are also warmly acknowledged for having produced and supplied all the plant material used in this study.
Conflicts of Interest
The authors J.B. and P.J. are employed by LIDEA FRANCE. The funders had a role in the design of the study and in the sample collection, but not for data collection. The funders had no role in analyses or interpretation of data, in the writing of the manuscript, or in the decision to publish the results.
References
- Choi, M.-S.; Rhee, K.C. Production and Processing of Soybeans and Nutrition and Safety of Isoflavone and Other Soy Products for Human Health. J. Med. Food 2006, 9, 1–10. [Google Scholar] [CrossRef]
- Bhagwat, S.; Haytowitz, D.B.; Holden, J.M. USDA Database for the Isoflavone Content of Selected Foods; U.S. Department of Agriculture: Beltsville, MD, USA, 2008.
- Messina, M. Soybean Isoflavone Exposure Does Not Have Feminizing Effects on Men: A Critical Examination of the Clinical Evidence. Fertil. Steril. 2010, 93, 2095–2104. [Google Scholar] [CrossRef]
- Kim, I.-S. Current Perspectives on the Beneficial Effects of Soybean Isoflavones and Their Metabolites for Humans. Antioxidants 2021, 10, 1064. [Google Scholar] [CrossRef]
- Ivashkevich, A. The Role of Isoflavones in Augmenting the Effects of Radiotherapy. Front. Oncol. 2023, 12, 800562. [Google Scholar] [CrossRef]
- Sahin, I.; Bilir, B.; Ali, S.; Sahin, K.; Kucuk, O. Soy Isoflavones in Integrative Oncology: Increased Efficacy and Decreased Toxicity of Cancer Therapy. Integr. Cancer Ther. 2019, 18, 1534735419835310. [Google Scholar] [CrossRef]
- Pejčić, T.; Zeković, M.; Bumbaširević, U.; Kalaba, M.; Vovk, I.; Bensa, M.; Popović, L.; Tešić, Ž. The Role of Isoflavones in the Prevention of Breast Cancer and Prostate Cancer. Antioxidants 2023, 12, 368. [Google Scholar] [CrossRef]
- Chen, L.-R.; Chen, K.-H. Utilization of Isoflavones in Soybeans for Women with Menopausal Syndrome: An Overview. Int. J. Mol. Sci. 2021, 22, 3212. [Google Scholar] [CrossRef]
- Harahap, I.A.; Suliburska, J. An Overview of Dietary Isoflavones on Bone Health: The Association between Calcium Bioavailability and Gut Microbiota Modulation. Mater. Today Proc. 2022, 63, S368–S372. [Google Scholar] [CrossRef]
- Yamagata, K.; Yamori, Y. Potential Effects of Soy Isoflavones on the Prevention of Metabolic Syndrome. Molecules 2021, 26, 5863. [Google Scholar] [CrossRef]
- Mikulić, M.; Krstonošić, M.A.; Sazdanić, D.; Cvejić, J. Health Perspectives on Soy Isoflavones. In Phytochemicals in Soybeans; CRC Press: Boca Raton, FL, USA, 2022; ISBN 978-1-00-303029-4. [Google Scholar]
- Reinwald, S.; Weaver, C.M. Soy Isoflavones and Bone Health: A Double-Edged Sword? J. Nat. Prod. 2006, 69, 450–459. [Google Scholar] [CrossRef]
- Wuttke, W.; Jarry, H.; Seidlová-Wuttke, D. Isoflavones—Safe Food Additives or Dangerous Drugs? Ageing Res. Rev. 2007, 6, 150–188. [Google Scholar] [CrossRef]
- Sleiman, H.K.; de Oliveira, J.M.; Langoni de Freitas, G.B. Isoflavones Alter Male and Female Fertility in Different Development Windows. Biomed. Pharmacother. 2021, 140, 111448. [Google Scholar] [CrossRef]
- Lee, A.; Beaubernard, L.; Lamothe, V.; Bennetau-Pelissero, C. New Evaluation of Isoflavone Exposure in the French Population. Nutrients 2019, 11, 2308. [Google Scholar] [CrossRef]
- UFC Perturbateurs Endocriniens dans les Produits à Base de Soja: L’UFC-Que Choisir saisit l’Anses et la DGCCRF. Available online: https://www.quechoisir.org/action-ufc-que-choisir-perturbateurs-endocriniens-dans-les-produits-a-base-de-soja-l-ufc-que-choisir-saisit-l-anses-et-la-dgccrf-n66983/ (accessed on 24 July 2023).
- Mierziak, J.; Kostyn, K.; Kulma, A. Flavonoids as Important Molecules of Plant Interactions with the Environment. Molecules 2014, 19, 16240–16265. [Google Scholar] [CrossRef] [PubMed]
- Dakora, F.D.; Phillips, D.A. Diverse Functions of Isoflavonoids in Legumes Transcend Anti-Microbial Definitions of Phytoalexins. Physiol. Mol. Plant Pathol. 1996, 49, 1–20. [Google Scholar] [CrossRef]
- Křížová, L.; Dadáková, K.; Kašparovská, J.; Kašparovský, T. Isoflavones. Molecules 2019, 24, 1076. [Google Scholar] [CrossRef] [PubMed]
- Sakthivelu, G.; Akitha Devi, M.K.; Giridhar, P.; Rajasekaran, T.; Ravishankar, G.A.; Nikolova, M.T.; Angelov, G.B.; Todorova, R.M.; Kosturkova, G.P. Isoflavone Composition, Phenol Content, and Antioxidant Activity of Soybean Seeds from India and Bulgaria. J. Agric. Food Chem. 2008, 56, 2090–2095. [Google Scholar] [CrossRef] [PubMed]
- Toda, T.; Sakamoto, A.; Takayanagi, T.; Yokotsuka, K. Changes in Isoflavone Compositions of Soybean Foods during Cooking Process. Food Sci. Technol. Res. 2000, 6, 314–319. [Google Scholar] [CrossRef]
- Qu, S.; Kwon, S.J.; Duan, S.; Lim, Y.J.; Eom, S.H. Isoflavone Changes in Immature and Mature Soybeans by Thermal Processing. Molecules 2021, 26, 7471. [Google Scholar] [CrossRef] [PubMed]
- Berger, M.; Rasolohery, C.A.; Cazalis, R.; Daydé, J. Isoflavone Accumulation Kinetics in Soybean Seed Cotyledons and Hypocotyls: Distinct Pathways and Genetic Controls. Crop Sci. 2008, 48, 700–708. [Google Scholar] [CrossRef]
- Artigot, M.-P.; Daydé, J.; Berger, M. Expression of Key Genes of the Isoflavonoid Pathway in Hypocotyls and Cotyledons during Soybean Seed Maturation. Crop Sci. 2013, 53, 1096–1108. [Google Scholar] [CrossRef]
- Bustamante-Rangel, M.; Delgado-Zamarreño, M.M.; Pérez-Martín, L.; Carabias-Martínez, R. QuEChERS Method for the Extraction of Isoflavones from Soy-Based Foods before Determination by Capillary Electrophoresis-Electrospray Ionization-Mass Spectrometry. Microchem. J. 2013, 108, 203–209. [Google Scholar] [CrossRef]
- Kim, S.-H.; Jung, W.-S.; Ahn, J.-K.; Kim, J.-A.; Chung, I.-M. Quantitative Analysis of the Isoflavone Content and Biological Growth of Soybean (Glycine max L.) at Elevated Temperature, CO2 Level and N Application. J. Sci. Food Agric. 2005, 85, 2557–2566. [Google Scholar] [CrossRef]
- Aguiar, C.L.; Haddad, R.; Eberlin, M.N.; Carrão-Panizzi, M.C.; Tsai, S.M.; Park, Y.K. Thermal Behavior of Malonylglucoside Isoflavones in Soybean Flour Analyzed by RPHPLC/DAD and Eletrospray Ionization Mass Spectrometry. LWT-Food Sci. Technol. 2012, 48, 114–119. [Google Scholar] [CrossRef]
- Bensaada, S.; Raymond, I.; Breton, M.; Pellegrin, I.; Viallard, J.-F.; Bennetau-Pelissero, C. Development of an Assay for Soy Isoflavones in Women’s Hair. Nutrients 2022, 14, 3619. [Google Scholar] [CrossRef]
- Agelet, L.E.; Hurburgh, C.R. A Tutorial on Near Infrared Spectroscopy and Its Calibration. Crit. Rev. Anal. Chem. 2010, 40, 246–260. [Google Scholar] [CrossRef]
- Manley, M. Near-Infrared Spectroscopy and Hyperspectral Imaging: Non-Destructive Analysis of Biological Materials. Chem. Soc. Rev. 2014, 43, 8200–8214. [Google Scholar] [CrossRef]
- Baianu, I.; Guo, J.; You, T.; Nelson, R. Near Infrared Reflectance Spectroscopy (NIRS) Determination of Isoflavone Contents for Selected Soybean Accessions. Nat. Preced. 2012; preprint. [Google Scholar] [CrossRef]
- Zhu, Z.; Chen, S.; Wu, X.; XING, C.; Yuan, J. Determination of Soybean Routine Quality Parameters Using Near-Infrared Spectroscopy. Food Sci. Nutr. 2018, 6, 1109–1118. [Google Scholar] [CrossRef]
- Shi, D.; Hang, J.; Neufeld, J.; Zhao, S.; House, J.D. Estimation of Crude Protein and Amino Acid Contents in Whole, Ground and Defatted Ground Soybeans by Different Types of near-Infrared (NIR) Reflectance Spectroscopy. J. Food Compos. Anal. 2022, 111, 104601. [Google Scholar] [CrossRef]
- Karn, A.; Heim, C.; Flint-Garcia, S.; Bilyeu, K.; Gillman, J. Development of Rigorous Fatty Acid Near-Infrared Spectroscopy Quantitation Methods in Support of Soybean Oil Improvement. J. Am. Oil Chem. Soc. 2017, 94, 69–76. [Google Scholar] [CrossRef]
- Kusumaningrum, D.; Lee, H.; Lohumi, S.; Mo, C.; Kim, M.S.; Cho, B.-K. Non-Destructive Technique for Determining the Viability of Soybean (Glycine max) Seeds Using FT-NIR Spectroscopy. J. Sci. Food Agric. 2018, 98, 1734–1742. [Google Scholar] [CrossRef]
- Armstrong, P.R.; Tallada, J.G.; Huburgh, C.; Hildebrand, D.F.; Specht, J.E. Development of Single-Seed Near-Infrared Spectroscopic Predictions of Corn and Soybean Constituents Using Bulk Reference Values and Mean Spectra. Am. Soc. Agric. Biol. Eng. 2011, 54, 1529–1535. [Google Scholar] [CrossRef]
- Hacisalihoglu, G.; Gustin, J.L.; Louisma, J.; Armstrong, P.; Peter, G.F.; Walker, A.R.; Settles, A.M. Enhanced Single Seed Trait Predictions in Soybean (Glycine max) and Robust Calibration Model Transfer with Near-Infrared Reflectance Spectroscopy. J. Agric. Food Chem. 2016, 64, 1079–1086. [Google Scholar] [CrossRef]
- Sato, T.; Equchi, K.; Hatano, T.; Nishiba, Y. Use of Near-Infrared Reflectance Spectroscopy for the Estimation of the Isoflavone Contents of Soybean Seeds. Plant Prod. Sci. 2008, 11, 481–486. [Google Scholar] [CrossRef]
- Amanah, H.Z.; Tunny, S.S.; Masithoh, R.E.; Choung, M.-G.; Kim, K.-H.; Kim, M.S.; Baek, I.; Lee, W.-H.; Cho, B.-K. Nondestructive Prediction of Isoflavones and Oligosaccharides in Intact Soybean Seed Using Fourier Transform Near-Infrared (FT-NIR) and Fourier Transform Infrared (FT-IR) Spectroscopic Techniques. Foods 2022, 11, 232. [Google Scholar] [CrossRef]
- Xu, R.; Hu, W.; Zhou, Y.; Zhang, X.; Xu, S.; Guo, Q.; Qi, P.; Chen, L.; Yang, X.; Zhang, F.; et al. Use of Near-Infrared Spectroscopy for the Rapid Evaluation of Soybean [Glycine max (L.) Merri.] Water Soluble Protein Content. Spectrochim. Acta Part A Mol. Biomol. Spectrosc. 2020, 224, 117400. [Google Scholar] [CrossRef]
- dos Santos, L.R.; Zangirolami, M.d.S.; Silva, N.O.; Valderrama, P.; Março, P.H. Rapid Non-Invasive Assessment of Quality Parameters in Ground Soybean Using near-Infrared Spectroscopy. Pesq. Agropec. Bras. 2018, 53, 97–104. [Google Scholar] [CrossRef]
- Zhang, G.; Li, P.; Zhang, W.; Zhao, J. Analysis of Multiple Soybean Phytonutrients by Near-Infrared Reflectance Spectroscopy. Anal. Bioanal. Chem. 2017, 409, 3515–3525. [Google Scholar] [CrossRef]
- Berhow, M.; Singh, M.; Bowman, M.J.; Price, N.P.J.; Vaughn, S.F.; Liu, S.X. Quantitative NIR Determination of Isoflavone and Saponin Content of Ground Soybeans. Food Chem. 2020, 317, 126373. [Google Scholar] [CrossRef]
- Williams, P. The RPD Statistic: A Tutorial Note. NIR News 2014, 25, 22–26. [Google Scholar] [CrossRef]
- Coulomb, S.; Berger, M.; Levasseur-Garcia, C.; Didier, K.; Farkas, E.; Dayde, J. Soybean Segregation According to Isoflavone Content Using an Alternative Method: Near Infrared Spectroscopy. In Proceedings of the IV International Soybean Processing and Utilization Conference, Foz do Iguassu, Brazil, 29 February–5 March 2004. [Google Scholar]
- Boehm, J.D., Jr.; Abdel-Haleem, H.; Schapaugh, W.T., Jr.; Rainey, K.; Pantalone, V.R.; Shannon, G.; Klein, J.; Carter, T.E., Jr.; Cardinal, A.J.; Shipe, E.R.; et al. Genetic Improvement of US Soybean in Maturity Groups V, VI, and VII. Crop Sci. 2019, 59, 1838–1852. [Google Scholar] [CrossRef]
- Schoving, C. Analyse Écophysiologique et Modélisation Dynamique des Intéractions Génotype x Environnement x Conduite de Culture Chez le Soja. Ph.D. Thesis, Institut National Polytechnique de Toulouse, Toulouse, France, 2020. [Google Scholar]
- Uifălean, A.; Farcaş, A.; Ilieş, M.; Hegheş, S.C.; Ionescu, C.; Iuga, C.A. Assessment of Isoflavone Aglycones Variability in Soy Food Supplements Using a Validated HPLC-UV Method. Clujul Med. 2015, 88, 373–380. [Google Scholar] [CrossRef]
- Kennard, R.W.; Stone, L.A. Computer Aided Design of Experiments. Technometrics 1969, 11, 137–148. [Google Scholar] [CrossRef]
- Piao, Y.-Z.; Eun, J.-B. Physicochemical Characteristics and Isoflavones Content during Manufacture of Short-Time Fermented Soybean Product (cheonggukjang). J. Food Sci. Technol. 2020, 57, 2190–2197. [Google Scholar] [CrossRef]
- Lee, J.-S.; Kim, H.-S.; Hwang, T.-Y. Variation in Protein and Isoflavone Contents of Collected Domestic and Foreign Soybean (Glycine max (L.) Merrill) Germplasms in Korea. Agriculture 2021, 11, 735. [Google Scholar] [CrossRef]
- Harris, P.; Altaner, C. Workshop on Commercial Application of IR Spectroscopies to Solid Wood; Wood Technology Research Centre, University of Canterbury: Christchurch, New Zealand, 2013; ISBN 978-0-473-26662-2. [Google Scholar]
- Esbensen, K.H.; Geladi, P.; Larsen, A. The RPD Myth…. NIR News 2014, 25, 24–28. [Google Scholar] [CrossRef]
Disclaimer/Publisher’s Note: The statements, opinions and data contained in all publications are solely those of the individual author(s) and contributor(s) and not of MDPI and/or the editor(s). MDPI and/or the editor(s) disclaim responsibility for any injury to people or property resulting from any ideas, methods, instructions or products referred to in the content. |
© 2024 by the authors. Licensee MDPI, Basel, Switzerland. This article is an open access article distributed under the terms and conditions of the Creative Commons Attribution (CC BY) license (https://creativecommons.org/licenses/by/4.0/).