Abstract
Nowadays, attention to the environment is increasingly emphasized by the scientific community. Different measures have been adopted to ensure a lower environmental impact and increase the sustainability of industrial processes. This work fits well with these principles, as it focuses on the determination of pollutants in waste lubricating oils derived from the industrial and automotive sectors to quantify their concentration for potential recovery and subsequent reuse. Modern waste oils, especially those derived from industrial processes, contain pollutants and metals (most importantly, silicon). It is of utmost importance to determine the silicon content in the collected waste oils to verify the possibility of recycling them since high concentrations can badly affect the industrial operations in which they can be involved. One of the most applied analytic methods for controlling the content of metals is the ASTM D5185-18, Standard Test Method for Multielement Determination of Used and Unused Lubricating Oils and Base Oils by Inductively Coupled Plasma Atomic Emission Spectrometry (ICP-AES). However, this method was certified for 50 mg/kg of maximum silicon content. To extend this range, CONOU, because of its duty to monitor waste oil quality, organized an interlaboratory comparison to verify the applicability of ASTM D5185-18 and also to samples of used oils containing higher concentrations of silicon. This work describes the details of the employed methodology and the results of the interlaboratory comparison that showed the applicability of ASTM D5185-18 also to samples containing silicon concentrations higher than 1000 ppm.
1. Introduction
Lubricants are produced from base stocks obtained through refining petroleum. These are combined with additives to enhance specific properties. A lubricant is a substance able to reduce friction between mechanical components and moving surfaces and, consequentially, they are contained in any mechanical machinery where there are two or more moving parts in contact with one another. Thermal stability, low freezing point, and high oxidation stability are some of the properties required for a good lubricant.
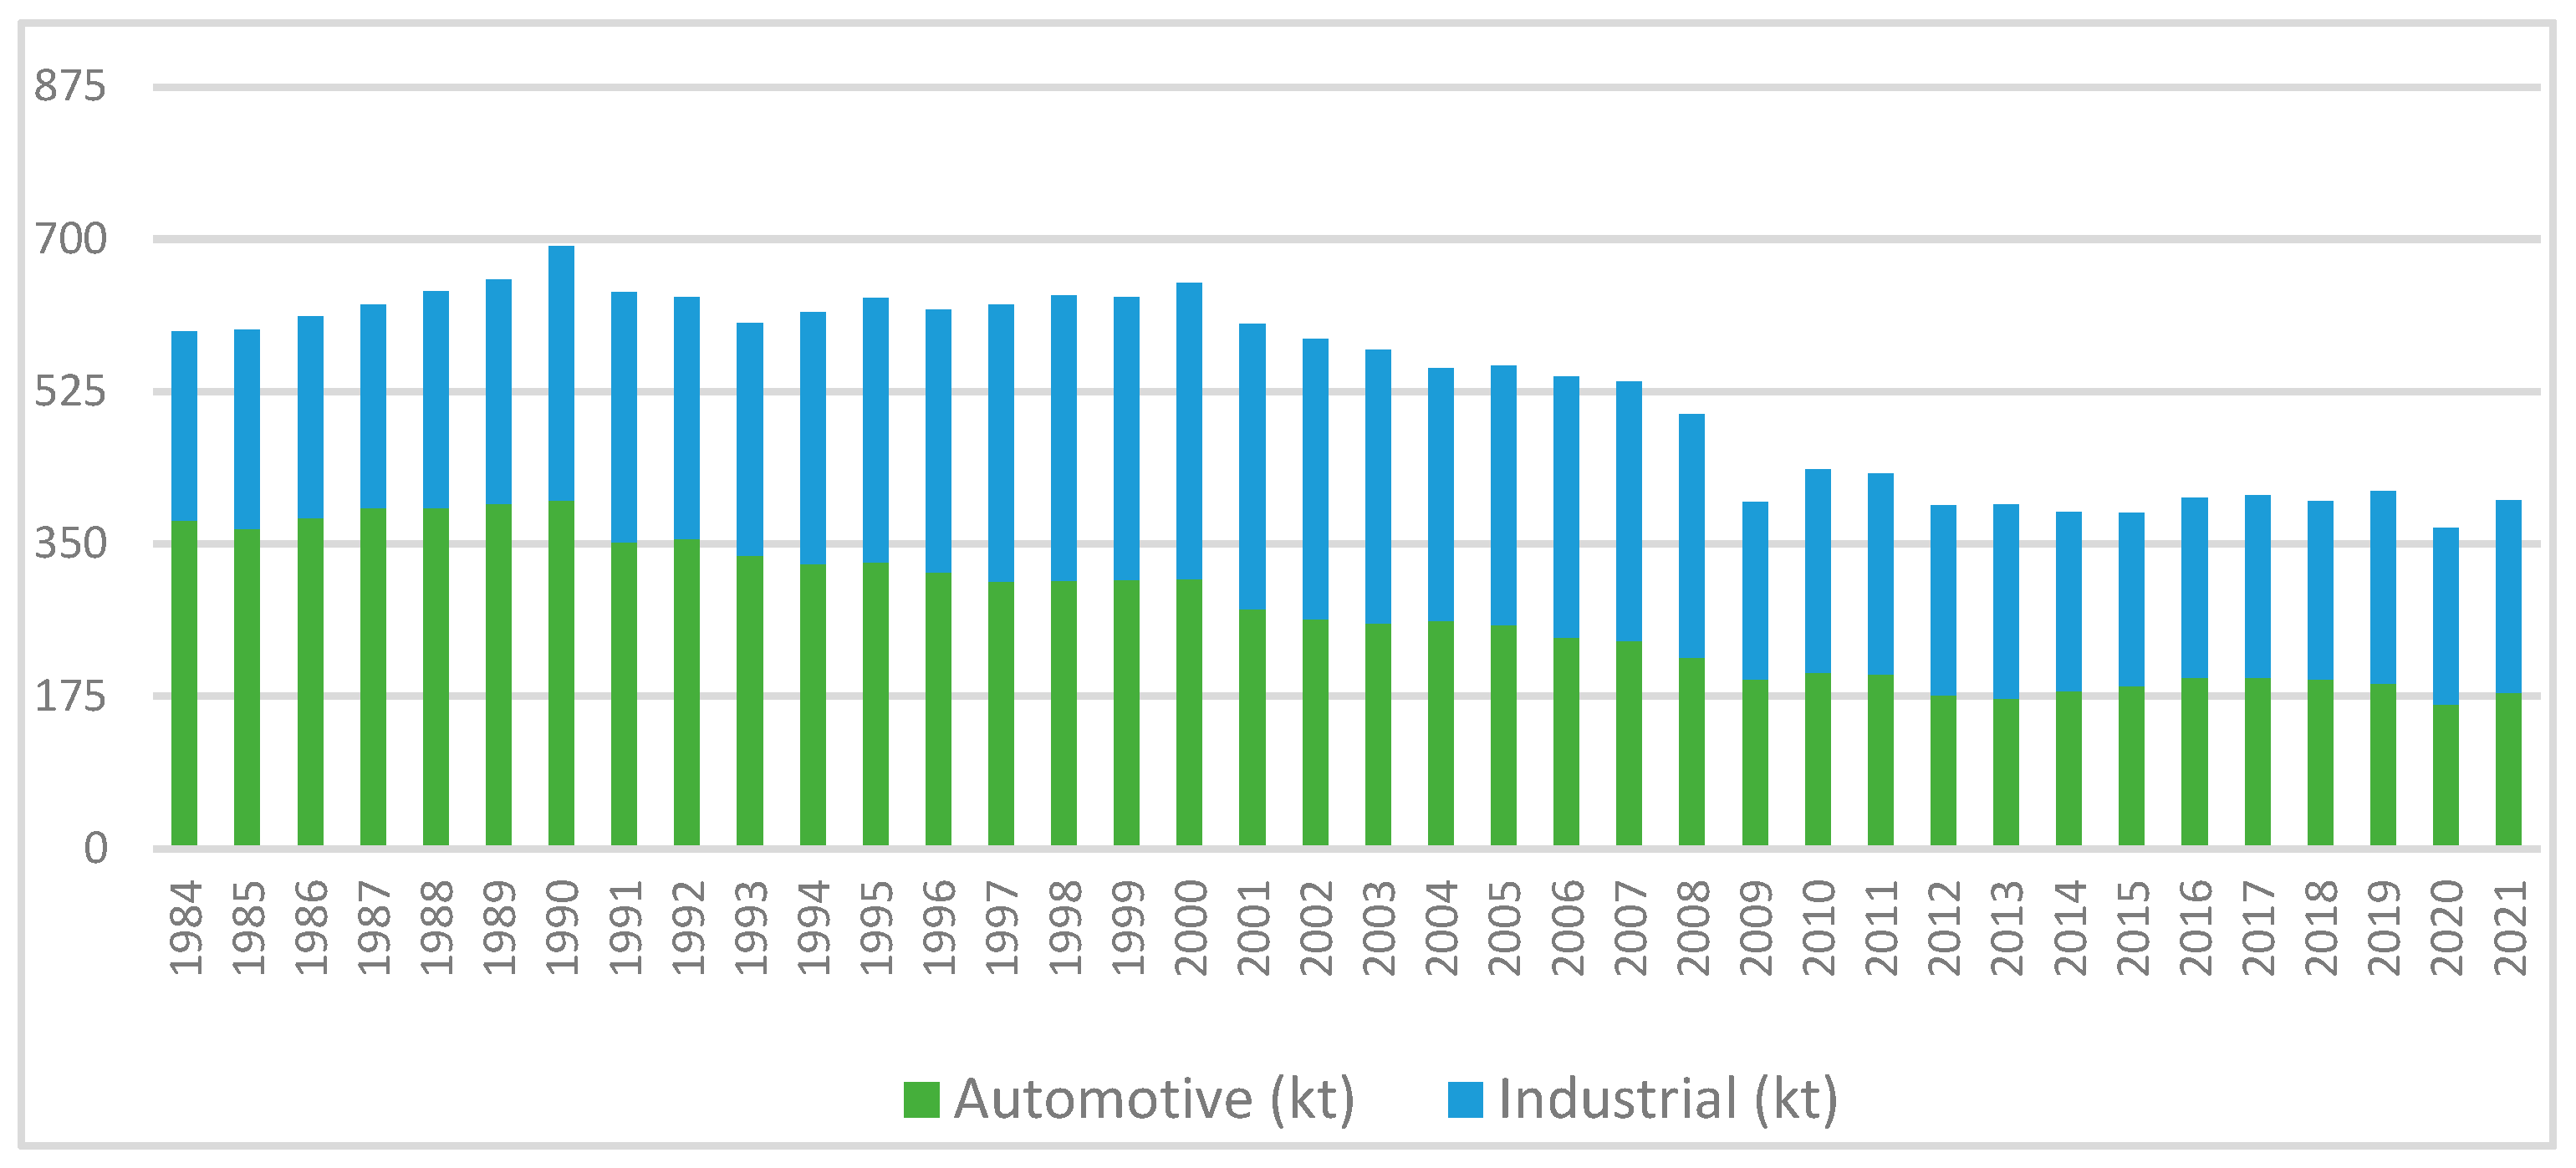
Their characteristics, notably base stock type and additive mix, vary widely according to the usage they have been designated to [1,2,3]. In recent years, due to the development of industrialization and the increase in transport, the request for lubricants has progressively increased, too. Currently, the lubricant market is USD 157.6 billion, but it is expected to reach USD 182.6 billion in 2025 [4]. Generally, lubricants lose their characteristics throughout use, becoming unsuitable to perform their original function. Subsequently, they are replaced and disposed of as waste oil [5]. Several reasons can be responsible for the degradation process of lubricant oil, for example, oxidation, contamination from water or soot, and metal wear [6,7,8,9,10]. Waste oil is considered a dangerous environmental contaminant since it contains polycyclic aromatic hydrocarbon (PAH) and several persistent organic pollutants (POPs), and it must be safely handled and disposed of to avoid environmental harm [11,12]. If spilled on the ground, waste oils may flow downwards, poisoning aquifers. Conversely, it usually floats if dispersed on water, generating an impermeable film. This prevents the delivery of oxygen, potentially leading to the death of underlying ecosystems. Lastly, if burned improperly, waste oils release toxic byproducts into the atmosphere that may cause poisoning and disease. Considering these environmental problems, their recycling into fuels to be used in internal combustion engines and different chemicals is becoming a process of outermost importance to minimize their harmful impact on the environment [13,14]. Among the possible uses, recycled oils can be employed to increase the asphalt binding capacity or to power an electric heater, thanks to its high calorific value [15,16]. Such hazards were long known before current trends in environmental awareness. The disposal of waste oils was first addressed by the EU in 1975 through Council Directive 75/439/EEC. This law established regulations for permitted disposal options. It also ranked them by environmental impact, with re-refining deemed as the most sustainable. Following this directive, CONOU (formally COOU) was established in Italy in 1982 (DPR 23/08/1982 n. 691/82) [17]. Its mission is to oversee the safe collection and disposal of waste oils, as well as raise public awareness of the risks associated with their uncontrolled and/or accidental environmental release. The Italian lubricant market has been one of the biggest in Europe since 1984. However, since then, significant quantitative and qualitative changes have occurred. In 1984, the Italian market was 594 kton and this amount steadily trended upward until 1990, when it reached a peak of 692 kton. The market remained stable until 2000 when it began decreasing down to about 400 kton, and this value has plateaued for the last 12 years. The decrease was rooted in both structural and conjectural changes. Namely, technological improvements, such as an increase in drain oil interval, reduction of leakage in industrial applications, as well as several economic crises, have occurred since the second half of 2007 (see Figure 1).

Figure 1.
Trend of the waste oil market divided by origin.
In terms of quality, the market, driven by OEMs’ more challenging requirements, has transitioned to more performing base stocks and innovative technologies to meet new technological targets. Furthermore, the composition of the market is completely different from the past with the ratio between automotive and industrial usage shifting from 63%/37% in 1984 to 45%/55% in 2020 (see Figure 2).
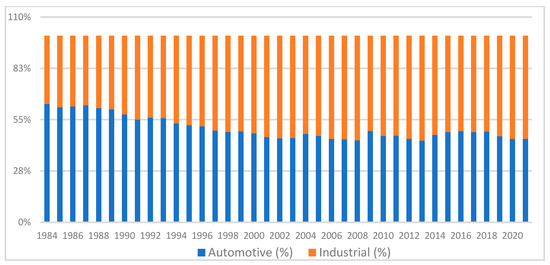
Figure 2.
Percentage breakdown of the waste oil market.
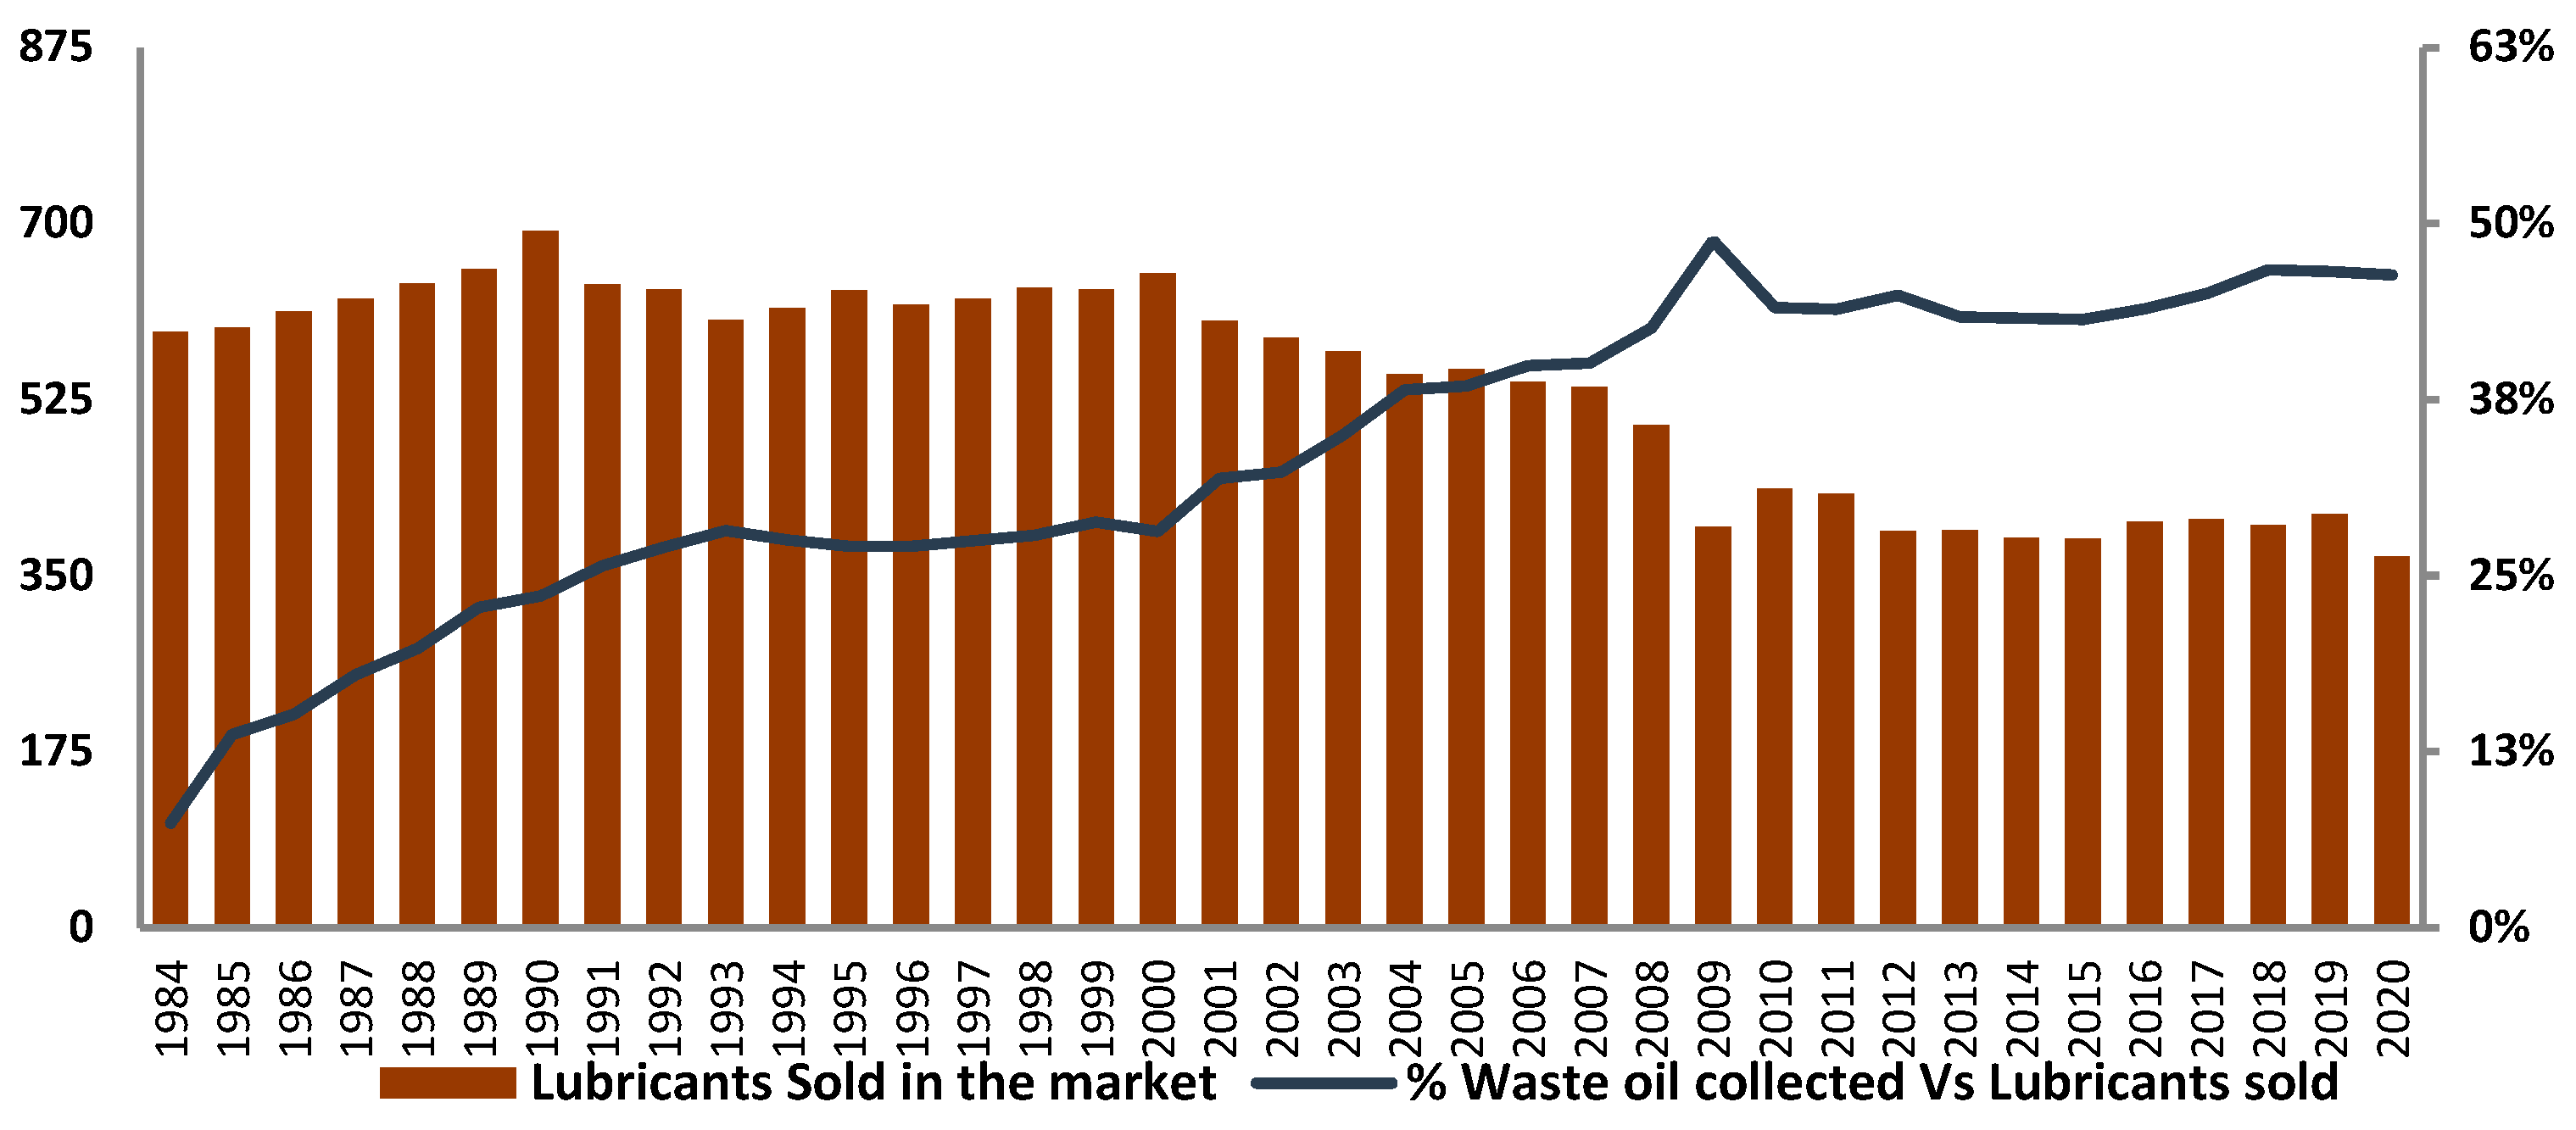
As a result, the waste oil composition is completely different as well and was not considered when re-refinery plants were set up. The inversion of ratios between automotive and industrial applications has increased the percentage of new pollutants arising from specific industrial processes. In different areas, according to the local industrial framework, specific waste oils are collected. In Italy, the permitted waste oil disposal destination is either re-refining, energy recovery, or thermal destruction. The choice of which system to use is determined by compliance with pollutant limits set by law (DM 392/96). Lawmakers anticipated the technological evolution of re-refining plants and thus granted local authorities the power to amend all these limits. The sole exception is the amount of polychlorinated biphenyls (PCBs), which is fixed at 50 ppm. In Italy, CONOU is responsible for handling all of the collected waste oils; the market has been stable at around 46% in recent years, about 6 points above the European average for the ratio between collected and new lubricants sold (see Figure 3).
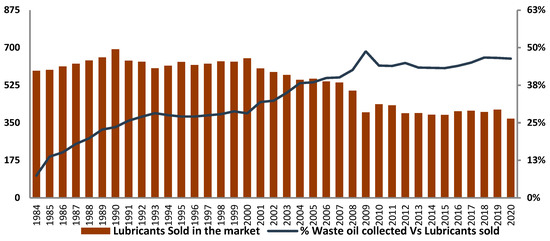
Figure 3.
Trend of the lubricants market in relation to collected waste oils.
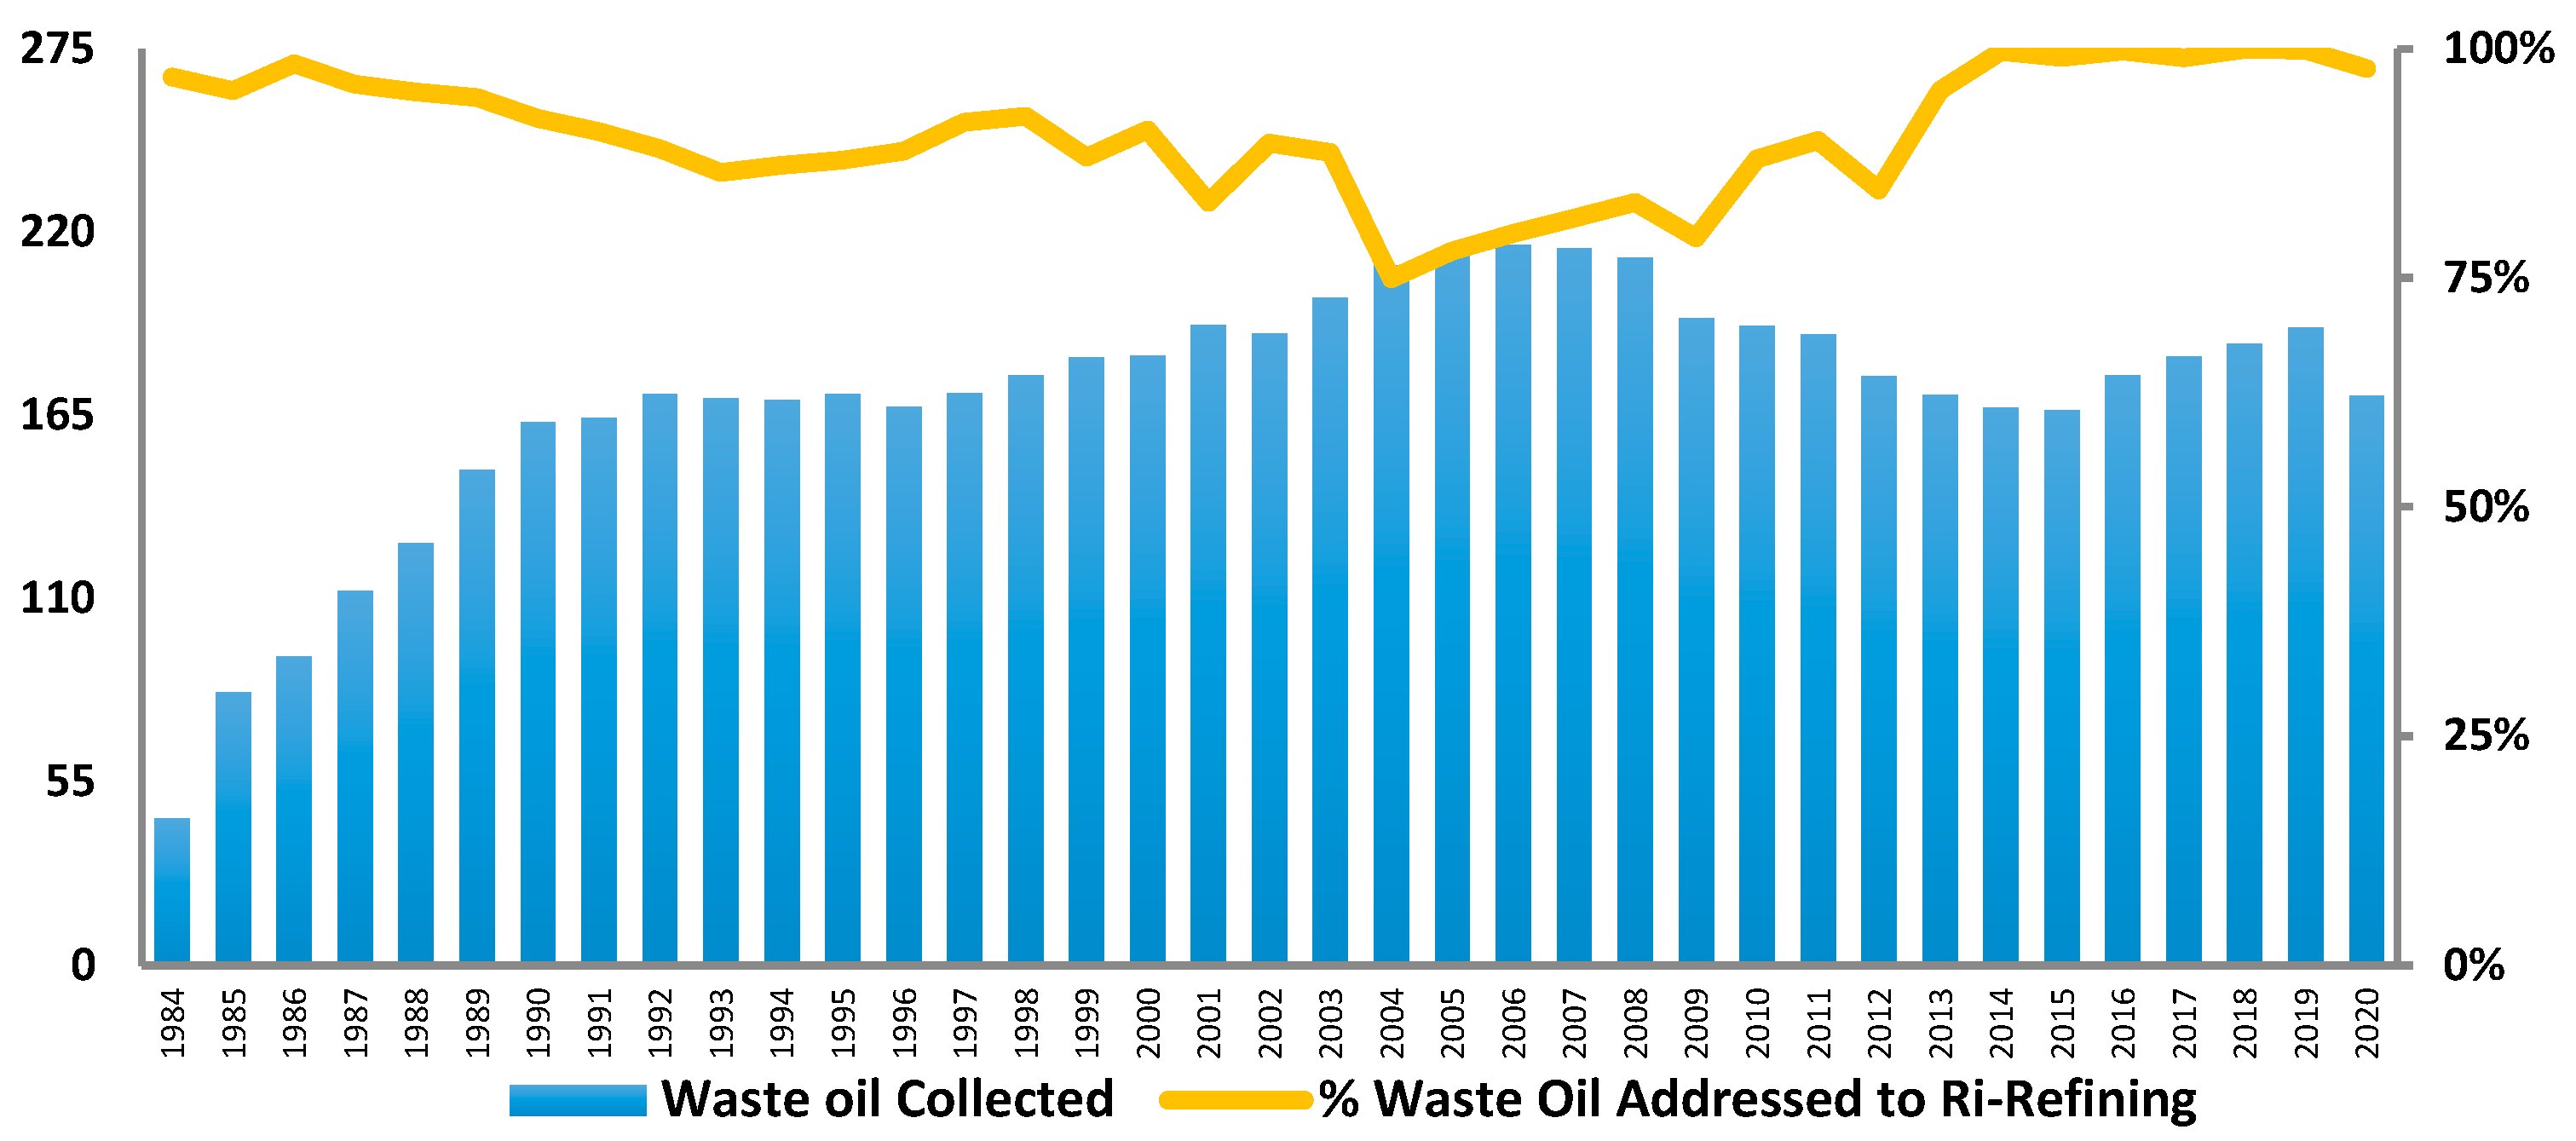
Almost all the collected waste oils (98% in 2020) are re-refined, exceeding the average European value of 61% and the newly set EU target of 85% by the end of 2025 (see Figure 4).
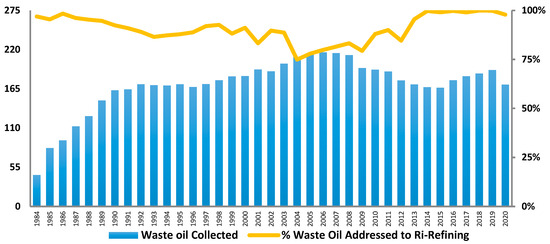
Figure 4.
Trend of used oils in relation to the percentage of waste oils sent to the regeneration process.
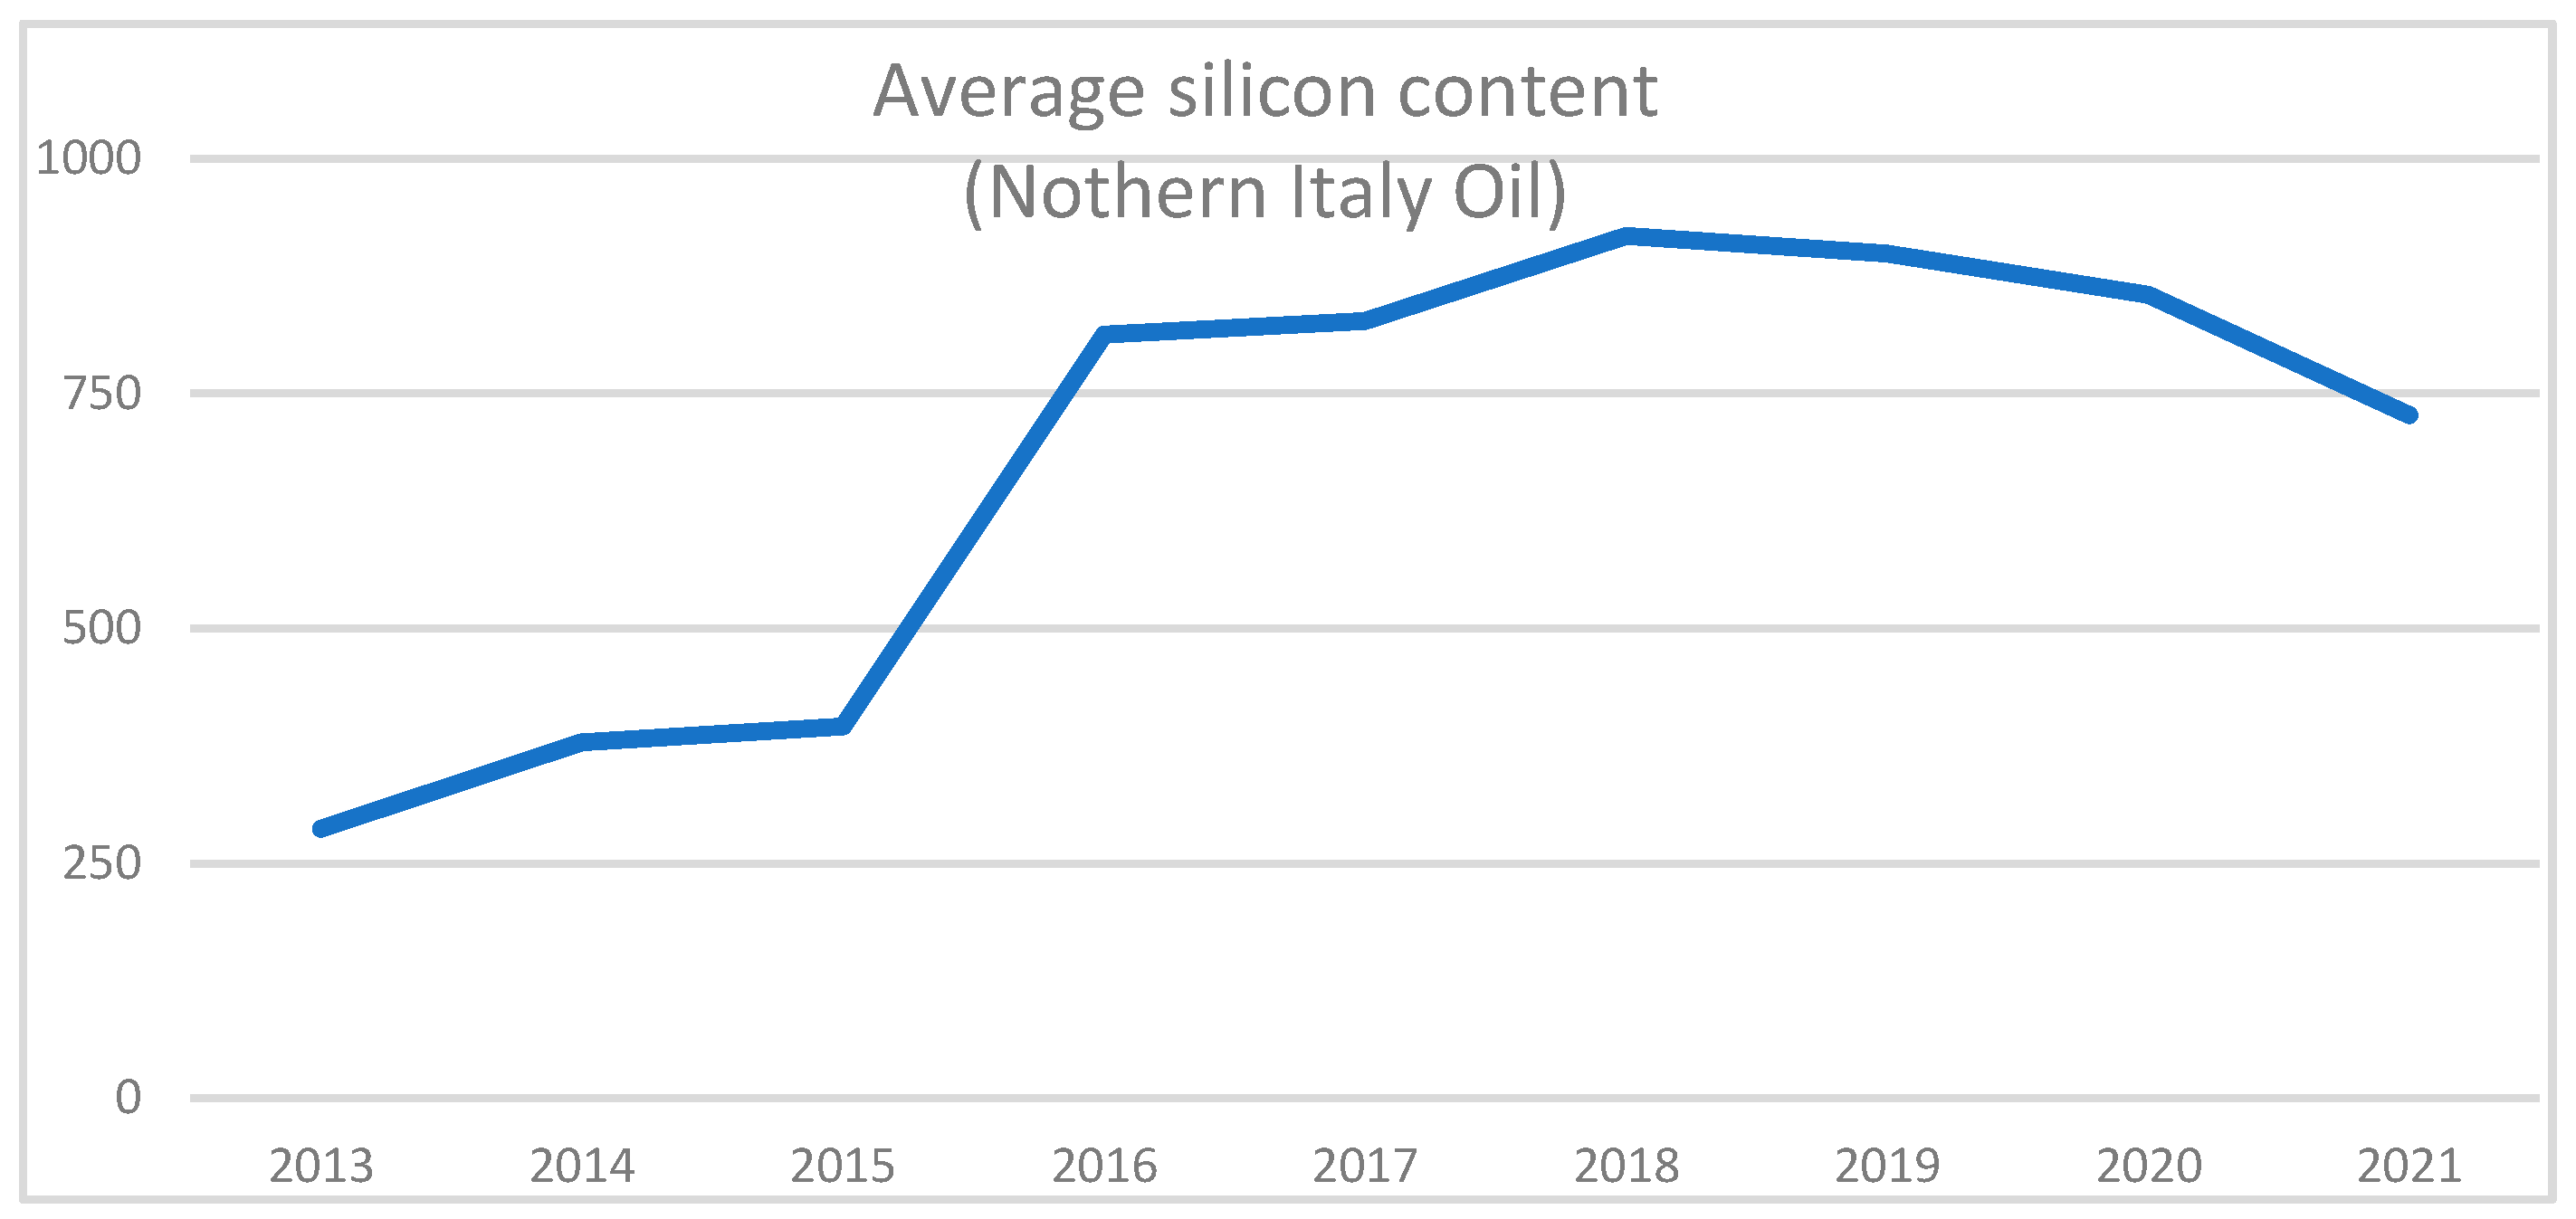
Over the years, thanks to the re-refining plants’ improvement and local authorities’ limit derogation, the amount of waste oils that can be re-refined has increased, including oils from metalworking emulsion or bilge oils. However, as plants become more sophisticated, they become more sensitive to parameter variation, and the waste oil recovered from emulsions may contain metals processed by the plants; these metals can reduce re-refining efficiency. A clear example is given by the oil coming from emulsions used in the aluminum die-casting process, where aluminum alloys have a high percentage of silicon [18]. Even though silicon is not a metal, it was identified like other metal elements, given its characteristics; also as a pollutant, it is considered in the same way as other metals from a regulatory point of view. High amounts of silicon (more than 1000 ppm in weight) are now frequently found in waste oils collected in northern Italy (see Figure 5), even though only a few dozen ppm of silicon is generally added to lubricant formulations.

Figure 5.
Average silicon content trend in waste oils.
The high silicon content is now affecting re-refining processes, particularly the hydro-finishing apparatus, which operates at extreme conditions of temperature and pressure. The process involves mixing the oil from the deasphalting column with hydrogen that has been compressed at 130 bar and heated to 350 °C before being flowed into the catalytic reactor [19]. Metals, sulfur, and nitrogen compounds react with a nickel–molybdenum catalyst with a high surface/volume ratio to increase the reaction rate. This is after the deasphalting process where not all compounds are retained. Under these operating conditions, silicon may vitrify on the catalyst, covering its active surface and the resulting reduction in efficiency shortens maintenance intervals. The phenomenon is ever more significant with increasing requirements of waste oil collection and maximization of the percentage addressed to re-refining. It is fundamental to discriminate the possibility of reusing the spent lubricants in subsequent processes by determining its amount since, if the silicon content exceeds a limit value, lubricants cannot be recycled. The method identified by CONOU for the determination of metals in waste oils is the ASTM D5185-18 [20]. Based on this method, a protocol was developed for the Consortium’s Control Analysis laboratories. From the observation of the method reported in the ASTM procedure, it emerged that the reproducibility for the silicon analysis refers only to a low concentration range (8–50 ppm). To broaden the field of application of the standardized method ASTM D5185-18 [20], the Multielement Determination of Used and Unused Lubricating Oils and Base Oils by Inductively Coupled Plasma Atomic Emission Spectrometry (ICP-AES) for the determination of wear and contaminants in used lubricating oils and for silicon contents higher than those validated in the aforementioned method (max 50 ppm), a CONOU–CeSMA analysis protocol was drawn up and evaluated using the interlaboratory comparison approach. It involved 9 laboratories, and experts in this sector, using this method. The aim of this work is focused on the application of the ASTM D5185-18 regulation even in cases where the silicon concentration exceeds 50 ppm, particularly for concentrations greater than 1000 ppm. Silicon determination is crucial because, as previously mentioned, it is possible to discriminate the possibility of the regeneration and the reuse of waste lubricant oils in subsequent processes, based on the concentration of the contained pollutants. To verify the reproducibility of silicon measurement for the typical concentrations of waste oils, the consortium decided to organize an Interlaboratory Control Circuit (Si-Oil) or “Ring Test” (RT). In this paper, the results of this Ring Test have been reported verifying that the ASTM D5185-18 method can also be used for concentrations of silicon in waste oils above 50 ppm.
2. Materials and Methods
2.1. The CONOU Protocol for Analyses
The Ring Test (RT) was organized to validate the method reported in the ASTM D5185-18 [20] standard for the analysis of waste oil samples containing silicon in high concentrations (10–900 ppm). The interlaboratory circuit was organized involving 9 laboratories. An equal share of 240 samples was distributed to the laboratories to carry out the analyses. The silicon content was unknown and included in the range of 10–1000 ppm. To ensure accuracy, each laboratory had to carry out the ICP-AES analysis three times, along with the sample preparation. Typically, when starting an RT, a reference material is chosen. This material contains known concentrations of the element or elements to be analyzed, within the established range. In this scenario, considering real matrices and due to the unavailability of any reference material, it was decided to use a shared value. As there are no reference materials, it was preferred to use matrices that consist of real exhausted oils. In these “real samples”, the analyte is contained in the matrix and allows a more realistic evaluation than in artificially prepared samples. The quality of the results is influenced by the homogeneity of the samples. It has been observed that samples that are not homogenized before sampling led to metal values that are inconsistent with the results obtained by homogenizing the sample before sampling. Hence, the homogenization of the sample before sampling is also recommended in the RT procedure. The protocol used in the interlaboratory circuit for the analysis of metals is described below.
2.2. Reagents
Material and reagents needed for the RT were required at each laboratory for the analyses are as follows: 50 mL glass volumetric flasks class A; magnets coated in PTFE (polytetrafluoroethylene) and xylene (mixture of isomers, RPE grade (analytical purity grade) or equivalent); reference oil, White Oil 75 Cst. CONOSTAN code 150-075-002 (RefOil); multielement standard, “oil-based metal calibration standard”, 900 ppm of silicon and other elements—CONOSTAN Standard S-21 (CON1); Item: 150-021-015; Organometallic Silicon Standard, 5000 ppm in oil—CONOSTAN 5000 ppm Standard, Si (CON2); Item: 150-500-145. For an accurate test, it is necessary to use reagent-grade chemicals with high purity standards to ensure the scientific precision and reliability of chemical analyses. Where possible, these materials and reagents should conform to specifications set by organizations such as ASTM International (American Society for Testing and Materials) or ACS (American Chemical Society).
When internal standardization is needed, it is necessary to use oil-soluble cadmium, cobalt, or yttrium (or any other metal suitable for the purpose). The exhausted oils samples do not contain the used standard metal; therefore, these metals cannot be considered contaminants. As for the dilution, the solvent must be free of the analyte to be determined and able to completely solubilize all standards and samples. The solvents commonly used for the test are mixed xylenes, kerosene, and ortho-xylene.
2.3. Procedure for the Preparation of the Samples
Samples preparation was made according to ASTM D5185-18 [20] and the procedure is described as follows:
- A total of 1 g of product obtained from the sample, previously homogenized for 5 min at 15,000 rpm, was placed in a 50 mL volumetric flask;
- Then, 4 g of RefOil were added to the sample;
- Next, 1 mL of internal standard solution (CONOSTAN Cobalt 5000 ppm viscosity 20Cst. code 150-500-275), obtained by diluting 20 g of pure standard in 1 L of xylene, was added to the volumetric flask;
- Xylene RPE was used to make up to volume;
- After stirring and complete dissolution of the sample, the contents of the flask were directly analyzed through the ICP-AES technique, recording the analytical results, obtained by comparison with the calibration lines previously prepared in the same way, as reported below.
In the case of very concentrated samples, the oil samples can be diluted taking care to respect the oil/solvent ratio of 1:10. For the calibration of the instrument, a certified organic metal standard CON1 was used, containing 900 mg/kg of 21 elements, working in such a way as to obtain the following instrument calibration standards: diluted standard in the range from 1 to 50 mg/kg for cadmium, chromium, nickel, and vanadium; diluted standard in the range from 1 to 300 mg/kg for silicon; and concentrated standard for the range from 301 to 900 mg/kg for silicon. The calibration line was checked on 4 points in linear mode, after taking 5 readings of samples, to verify the correct alignment. In the case of misalignment of even a single point by more than ±5%, the line must be reconstructed starting from a diluted standard of fresh preparation. Two laboratories were then designated to entrust the preparation and distribution of the samples to be analyzed. The task for the preparation and distribution of the test material was assigned to SGS Italia S.p.A. and AmSpec Italia S.r.l., as part of their respective Presidium Service activities at the consortium depots of Pieve Fissiraga (180 samples) and Casalnuovo di Napoli (60 samples). The total samples were 240, taken for 2 months. There were 9 laboratories involved in the RT. The data of the 9 laboratories were collected by CeSMA for the statistical data analysis with the identification and comparison of parameters, such as repeatability, reproducibility, accuracy, and reliability. In this work, the standard ISO 13528: 2015 [21] has been adopted as a reference document for the statistical method and test reported therein.
2.4. Statistical Methods
2.4.1. Robust Statistics: Mean and Standard Deviation
The first statistical analysis conducted on the data collected in the RT was robust statistics, according to ISO 13528: 2015 [21]. Robust statistics (mean and standard deviation) are characterized by good performance with data from different probability distributions and unaffected by outliers. In other words, a robust statistic is resistant to errors in the results, and its value can be considered as a shared value, which is used in the absence of a reference material. Based on what is reported in ISO 13528: 2015 [21], robust statistics on a series of measures can be calculated, and the different steps are shown below.
- (1)
- Considering p measures (x1, x2,….xp), they are first placed in increasing order from minor to major, obtaining the ordered sequence: x(1), x(2),…. x(p).
- (2)
- The median (x*) of the measures xi (i = 1, 2, ….p), is calculated.
- (3)
- s* as the median of the values is calculated, with i = 1, 2, …., p; s* = 1.483 average of .
- (4)
- An iterative procedure is started to progressively update the x* and s* values, according to the following steps:
- (5)
- is calculated.
- (6)
- For each of the xi, i = 1, 2, …, p, are calculated according to the relation
- (7)
- The new values of x* and s* are calculated with the following relations:
The iterative procedure is repeated until convergence is achieved, which is when no change in the third significant digit is obtained between two consecutive iterations.
2.4.2. Huber’s Test
Huber’s test is one of the most effective statistical means of eliminating anomalous data. It is applied using the following series of steps:
- (1)
- The median of the data xi is calculated by sorting them in ascending order (xm), according to AMC (2001) [22].
- (2)
- The differences (Di) between the single values and the median (xm) are calculated:
- (3)
- The differences (Di) are ordered, in absolute value, in an increasing sense;
- (4)
- The median (Dm) of the differences is calculated.
- (5)
- The differences in Di with respect to Dm are compared by applying the relation:
- (a)
- : acceptable value.
- (b)
- : unacceptable value (outlier).
2.4.3. Cochran Test
The Cochran test is usually used to identify anomalous dispersion in a group of data, by comparing their variances. Given a set of p standard deviations, calculated for the same number n of replicates, the C-statistic of the Cochran test is calculated from the relation:
where is the maximum value of the squared standard deviations (variances). The value of C is compared with the coefficients tabulated as a function of p and n, which refer to 5% and 1% of the Cochran statistic. At this point, 3 cases can occur:
- (1)
- The value of C is less than or equal to the critical value of 5%: the data are correct;
- (2)
- The value of C is higher than the critical value of 5%, but it is lower than the value referred to as 1%: the data are labeled as deviant (straggler) but are maintained;
- (3)
- The value of C is higher than the critical value of 1%: in this case, the data are to be considered an outlier and must be discarded.
2.4.4. z-Scores
Another useful parameter adopted in the interlaboratory comparison activity is represented by the z-score. This parameter is similar to the score assigned to each participating laboratory, and it is related to the measurement of a specific sample. To calculate the z-scores for each laboratory, the following relation is used for each analyzed sample:
- :
- sample i z-score for laboratory j
- :
- mean of the values obtained for sample i by the laboratory j
- :
- consensus value across all laboratories for sample i (robust mean)
- :
- robust standard deviation for sample i
The conventional interpretation of z scores is as follows:
- A result that gives |z| ≤ 2.0 is considered to be acceptable;
- A result that gives 2.0 < |z| < 3.0 is considered a warning signal;
- A result that gives |z| ≥ 3.0 is considered to be unacceptable (or an action signal).
Participants should check their measurement procedures if warning signals appear, as this may indicate an emerging or recurrent problem.
3. Results and Discussion
3.1. Robust Means
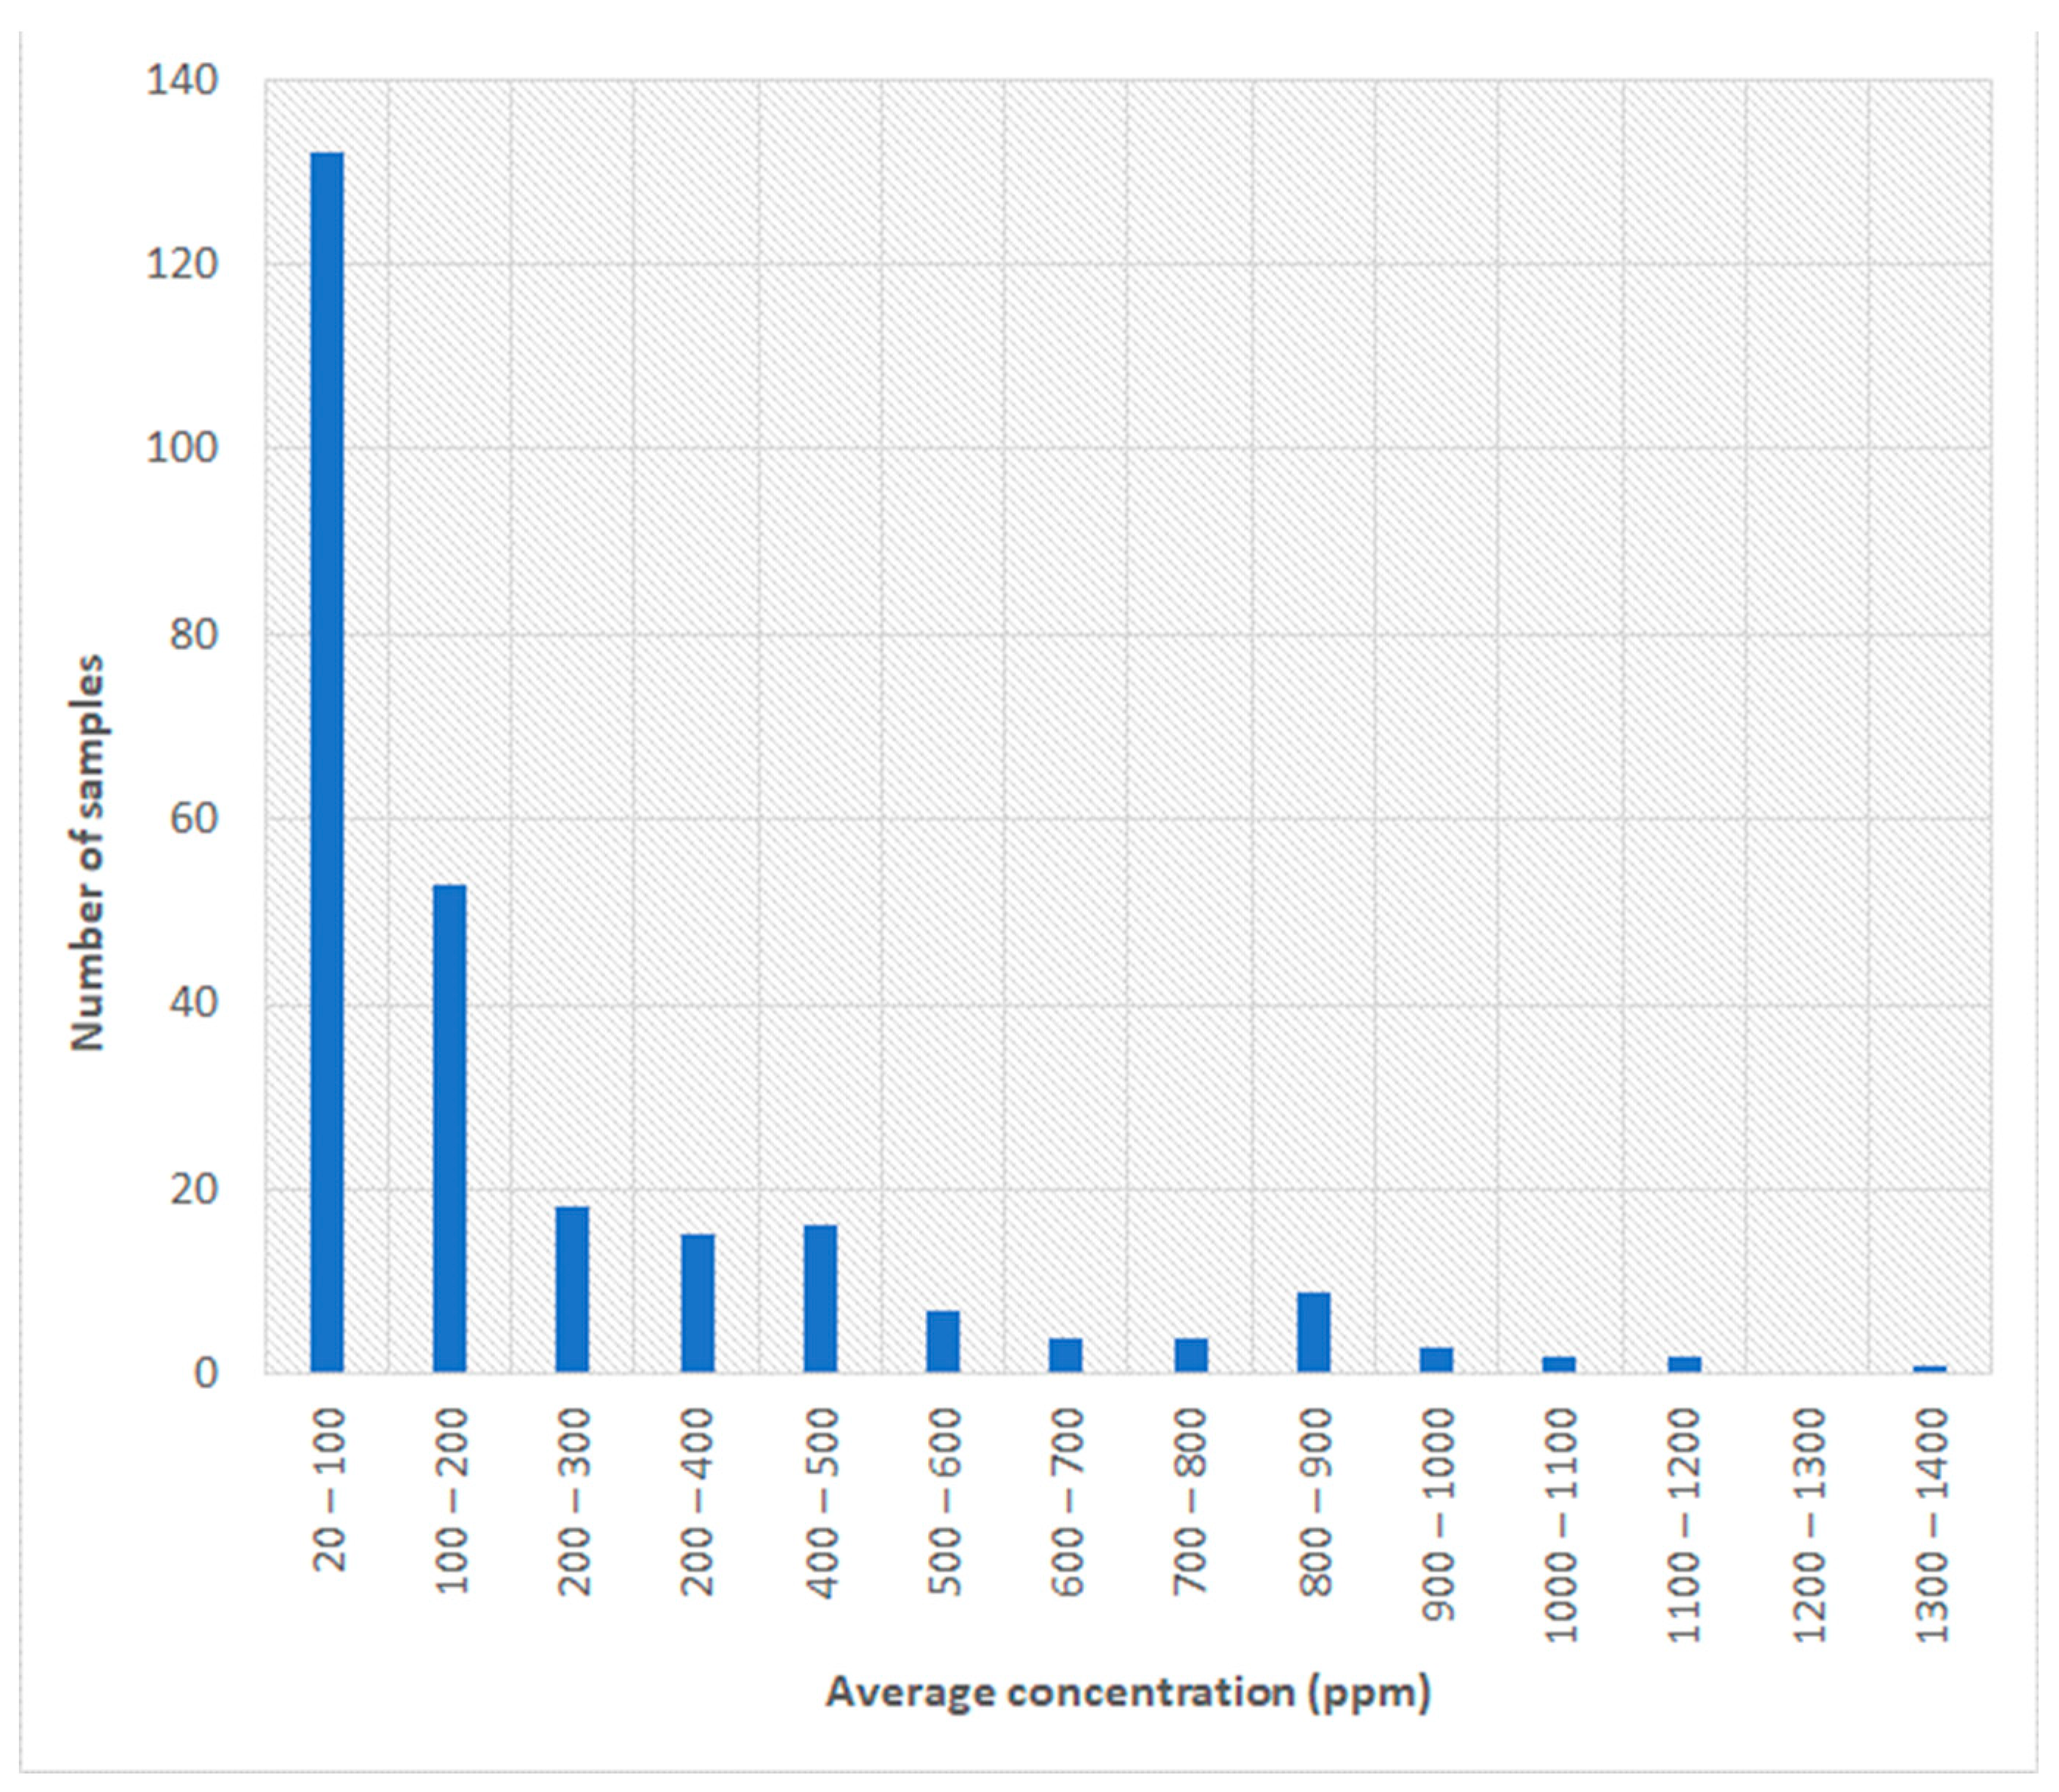
The average silicon content detected in the 240 samples was equal to 254 ± 61 ppm. For a statistical evaluation of the average silicon content in the oils sent for regeneration at the refineries of Pieve Fassiraga and Casalnuovo di Napoli, the data were revised to obtain 310 ± 75 ppm for the oils treated in Pieve Fassiraga and 83 ± 18 ppm for the oils sent at the Casalnuovo di Napoli refinery. The maximum determined value is 1360 ± 372 ppm, considering all the RT. The results highlight an average concentration 3.5 times higher for oils collected in the north of Italy, compared to oils collected in the south of Italy. In Figure 6, the real distribution of the results obtained for the silicon analysis was depicted, reporting the number of samples included in each range of average concentration.
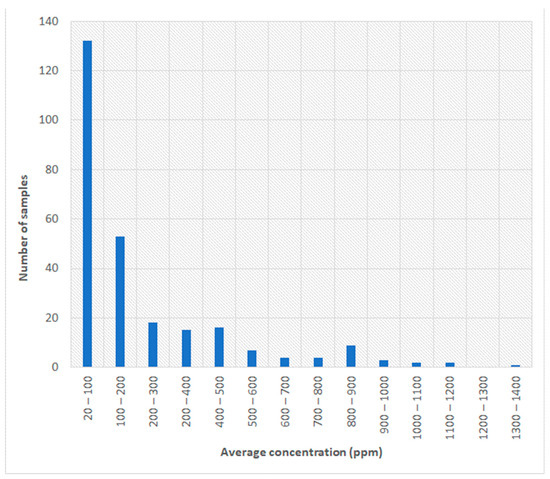
Figure 6.
Real distribution for the silicon analysis.
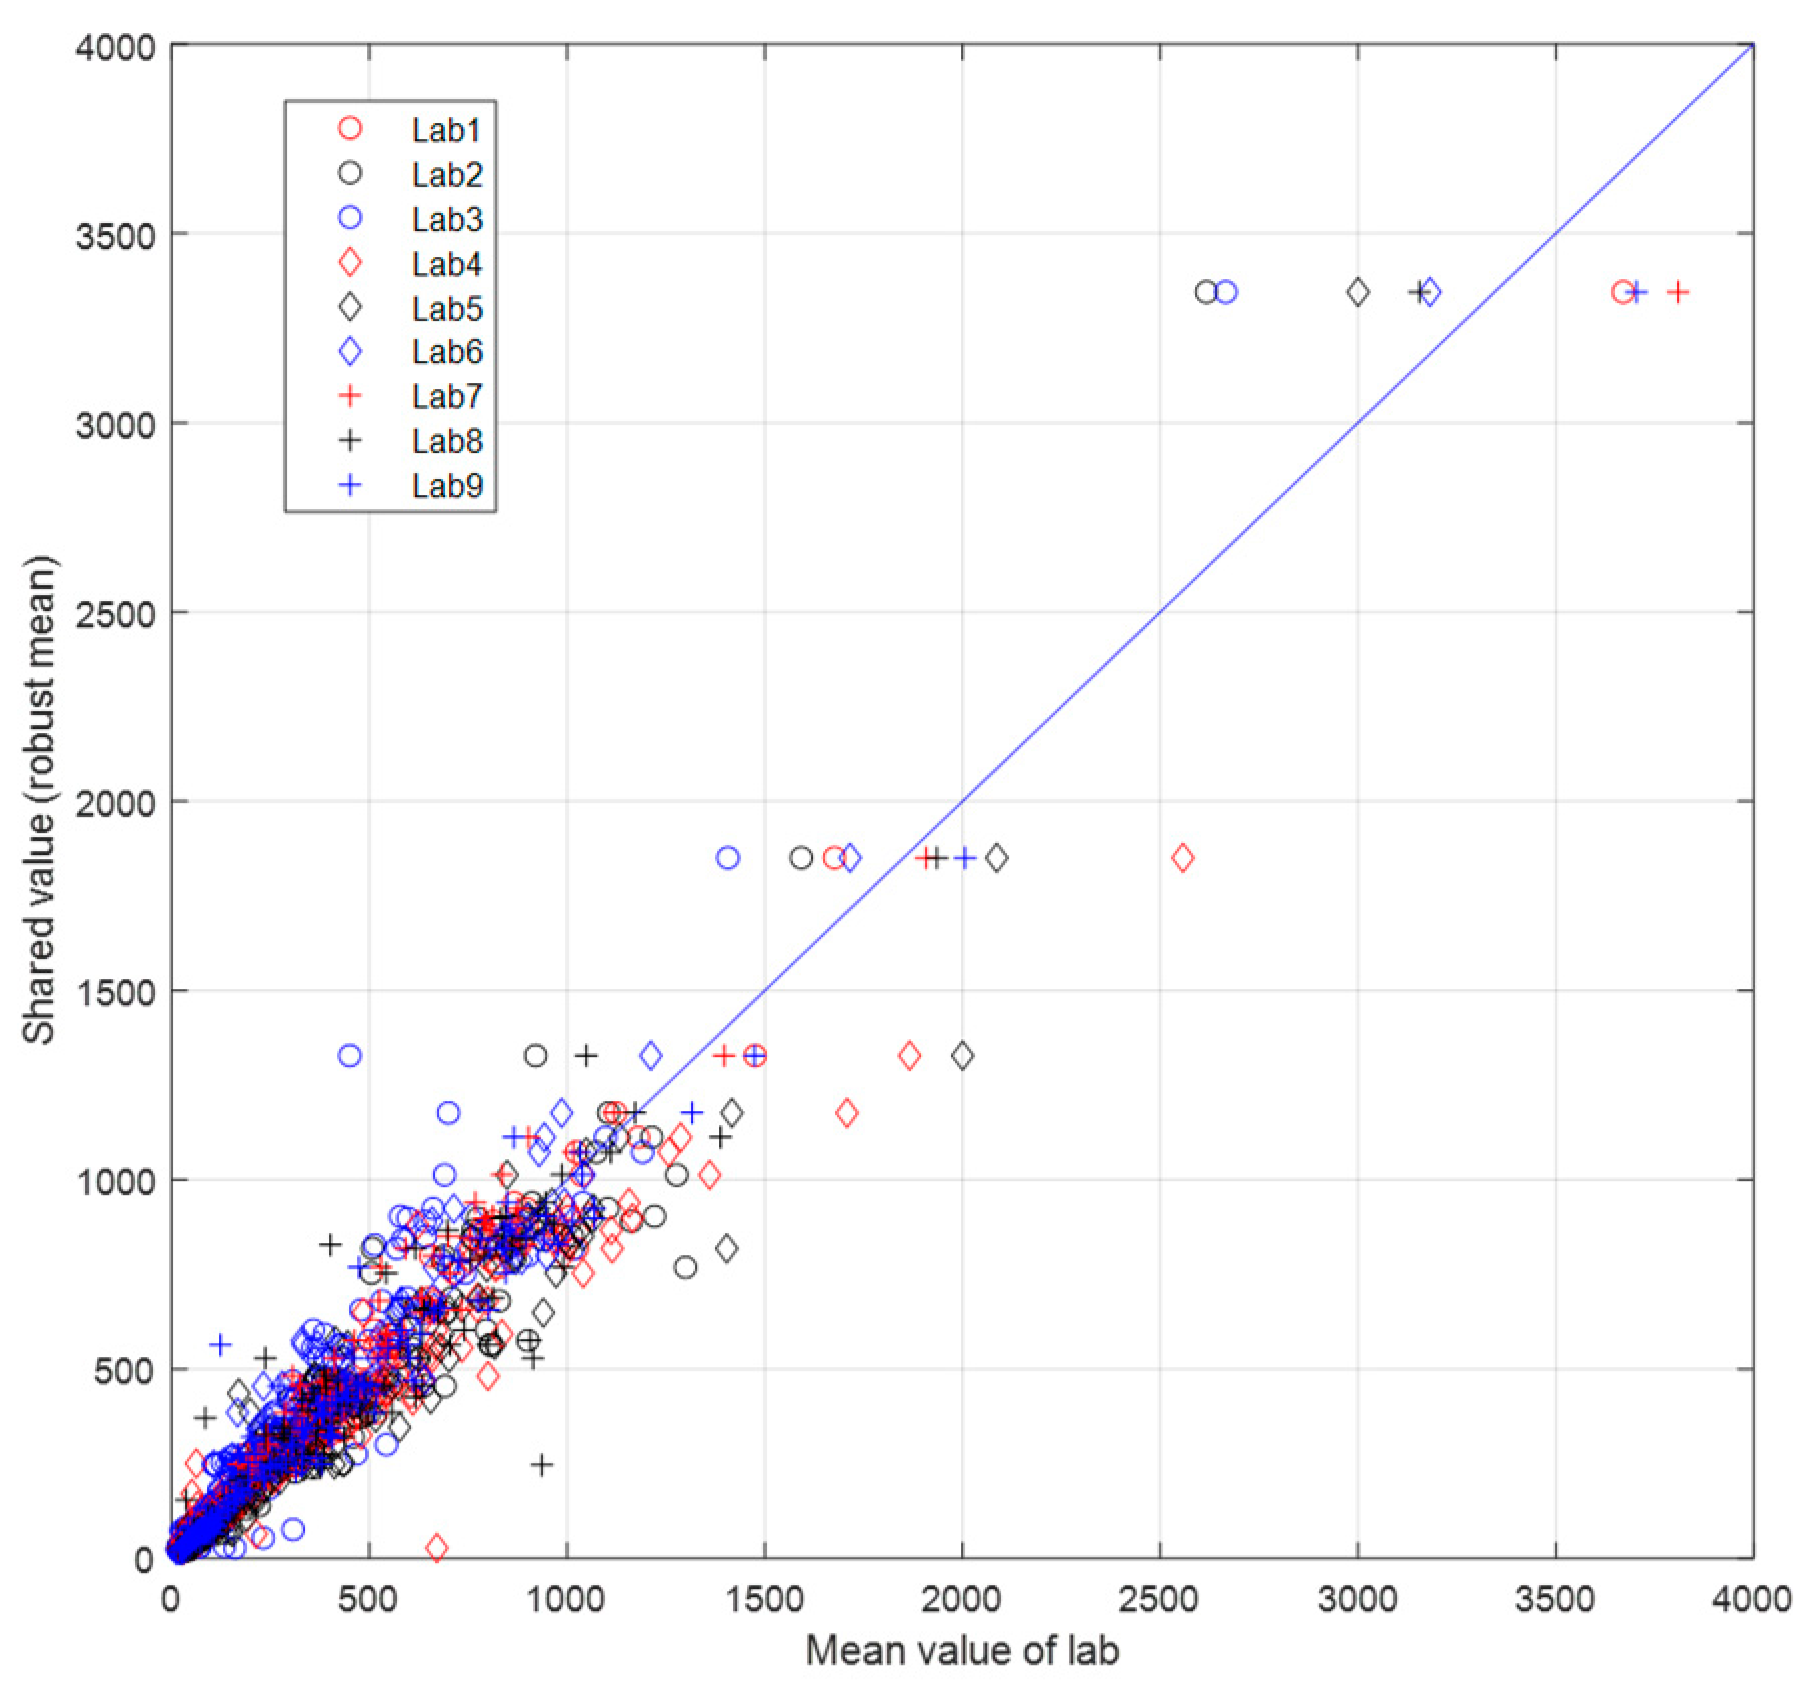
A more detailed statistical elaboration is reported as follows. Figure 7 shows the robust average values for the individual samples (shared value) as a function of the average values determined by the various laboratories.
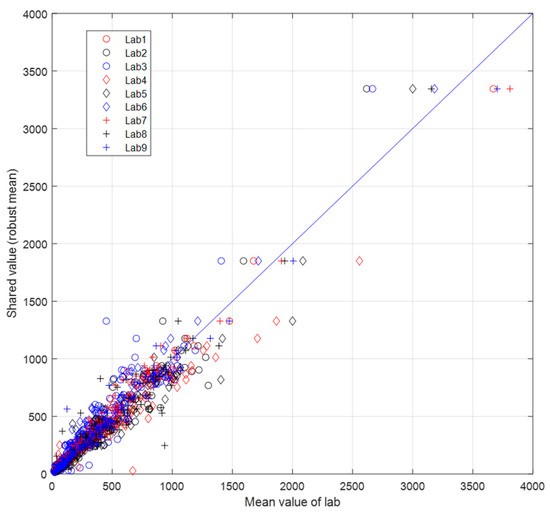
Figure 7.
Shared value (robust mean)/mean value lab.
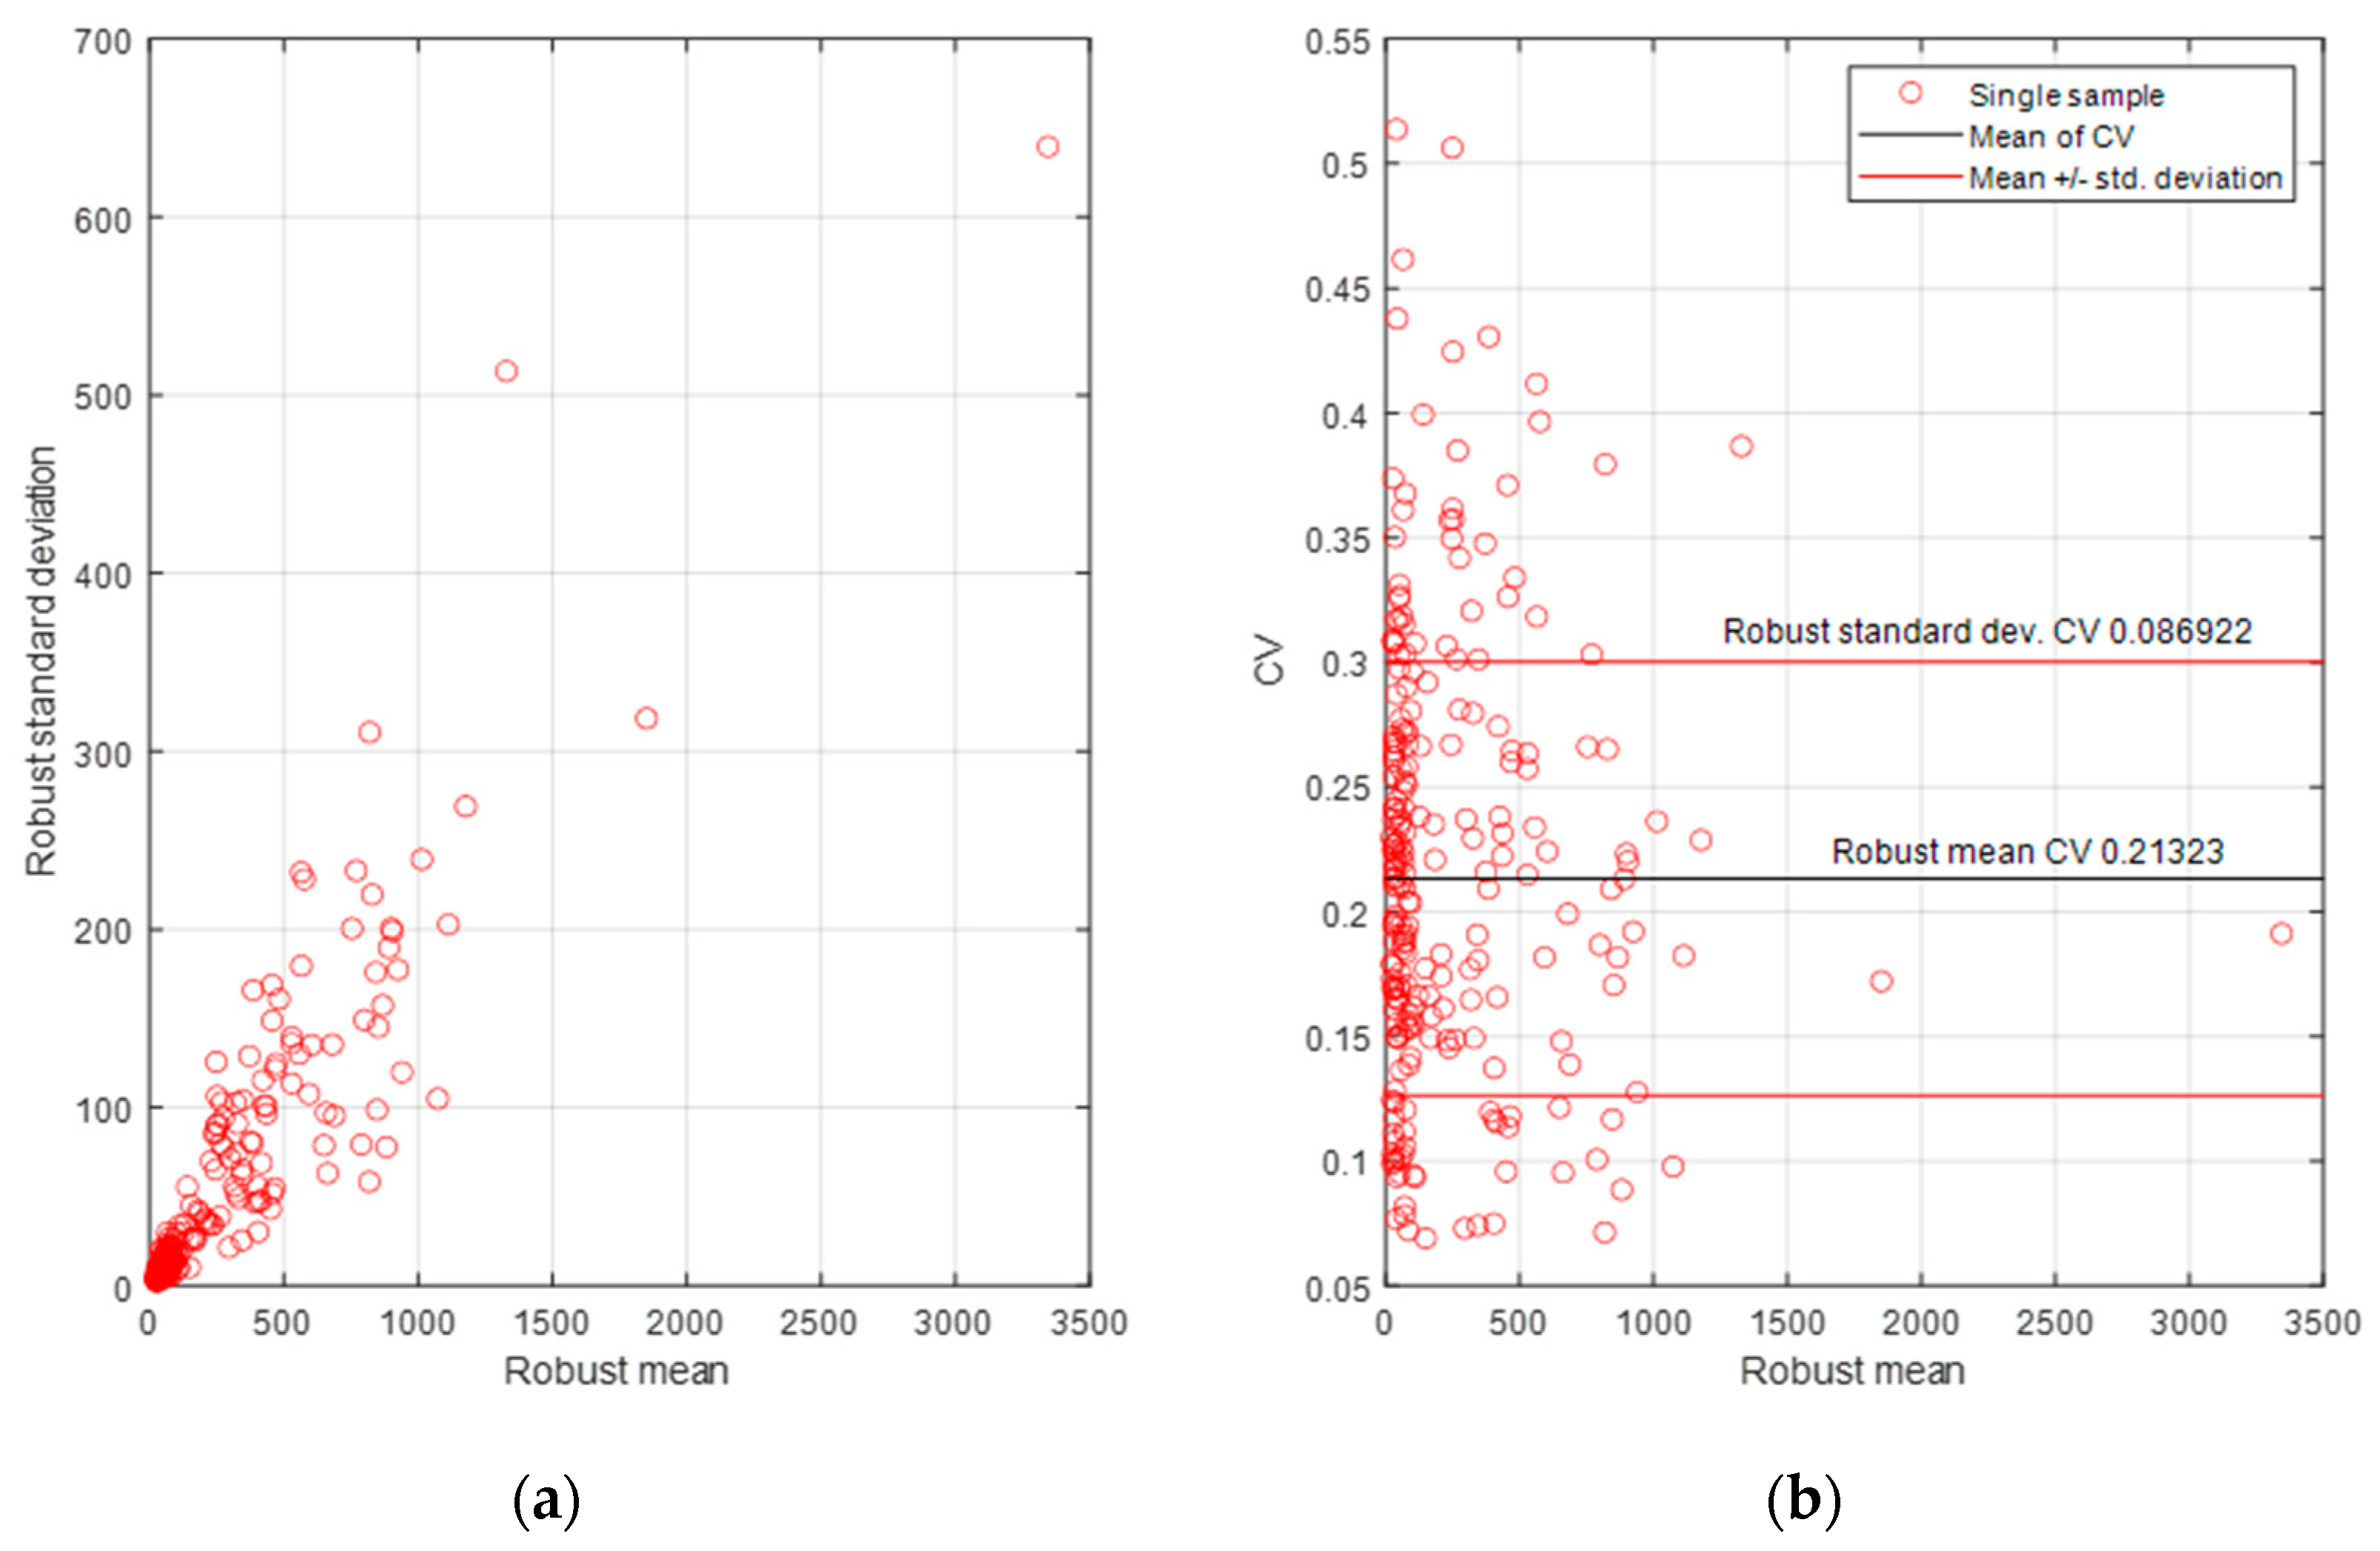
By observing Figure 7, it is evident that most of the measurements are close to the diagonal, indicating good reproducibility of the method. However, there are a few outliers that are excluded from the algorithm used to calculate the robust average. Figure 8 shows the robust standard deviations (a) and the variation coefficient (CV, standard deviation/mean) as a function of the robust mean values. The differences increase linearly with the values of the robust average, while the variation coefficients gather around an average value of 24%. The developed protocol CONOU–CeSMA proved to be reliable, and it was demonstrated that it can be involved as a method for silicon determination and also for high concentration. The performances are in line with what was reported by the ASTM D5185-18 method [20], even for silicon concentrations of 50 ppm in which a variation +/− coefficient of 26% was obtained.
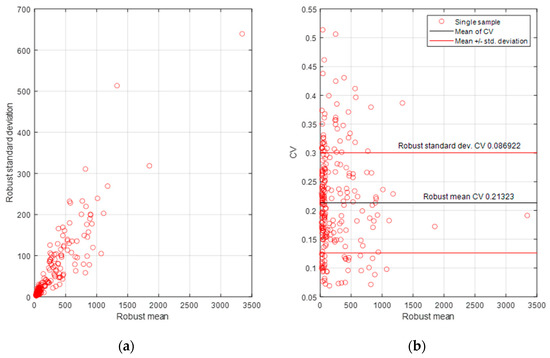
Figure 8.
(a) Standard deviation vs. robust mean; (b) coefficient of variation vs. robust mean.
3.2. z-Scores
The comparison of the performances of the different laboratories was made through the z-score parameter, according to ISO 13528: 2015 [21]. This parameter measures how much the average value obtained by a laboratory differs from the shared value. The z-score value decreases as the laboratory mean value approaches the shared value. Table 1 shows the average values for the individual laboratories, demonstrating the excellent results achieved.

Table 1.
Average z-scores on all samples.
In particular, all of the individual laboratories have average z-score values lower than 3, meaning that their performances are acceptable. Most of the laboratories have z-scores lower than 1, indicating excellent performance. The average z-score value for all laboratories is close to 1 [21].
3.3. Huber’s Test
Huber’s test [22] is one of the most effective statistical means for detecting anomalous data. The test was applied to the data provided by the nine laboratories, and Table 2 shows the percentage of outliers in each laboratory.
Table 2.
Outlier (%) on total samples.
The analysis of the table shows that the increasing order of the percentage of outliers for the different laboratories is the same as that obtained in the case of the z-scores, confirming once again the good performance of all the involved laboratories. Hence, it can be concluded that this test can also be used as a performance index of the different laboratories, even if the z-score signals a warning only for laboratory 5.
3.4. Repeatability and Reproducibility
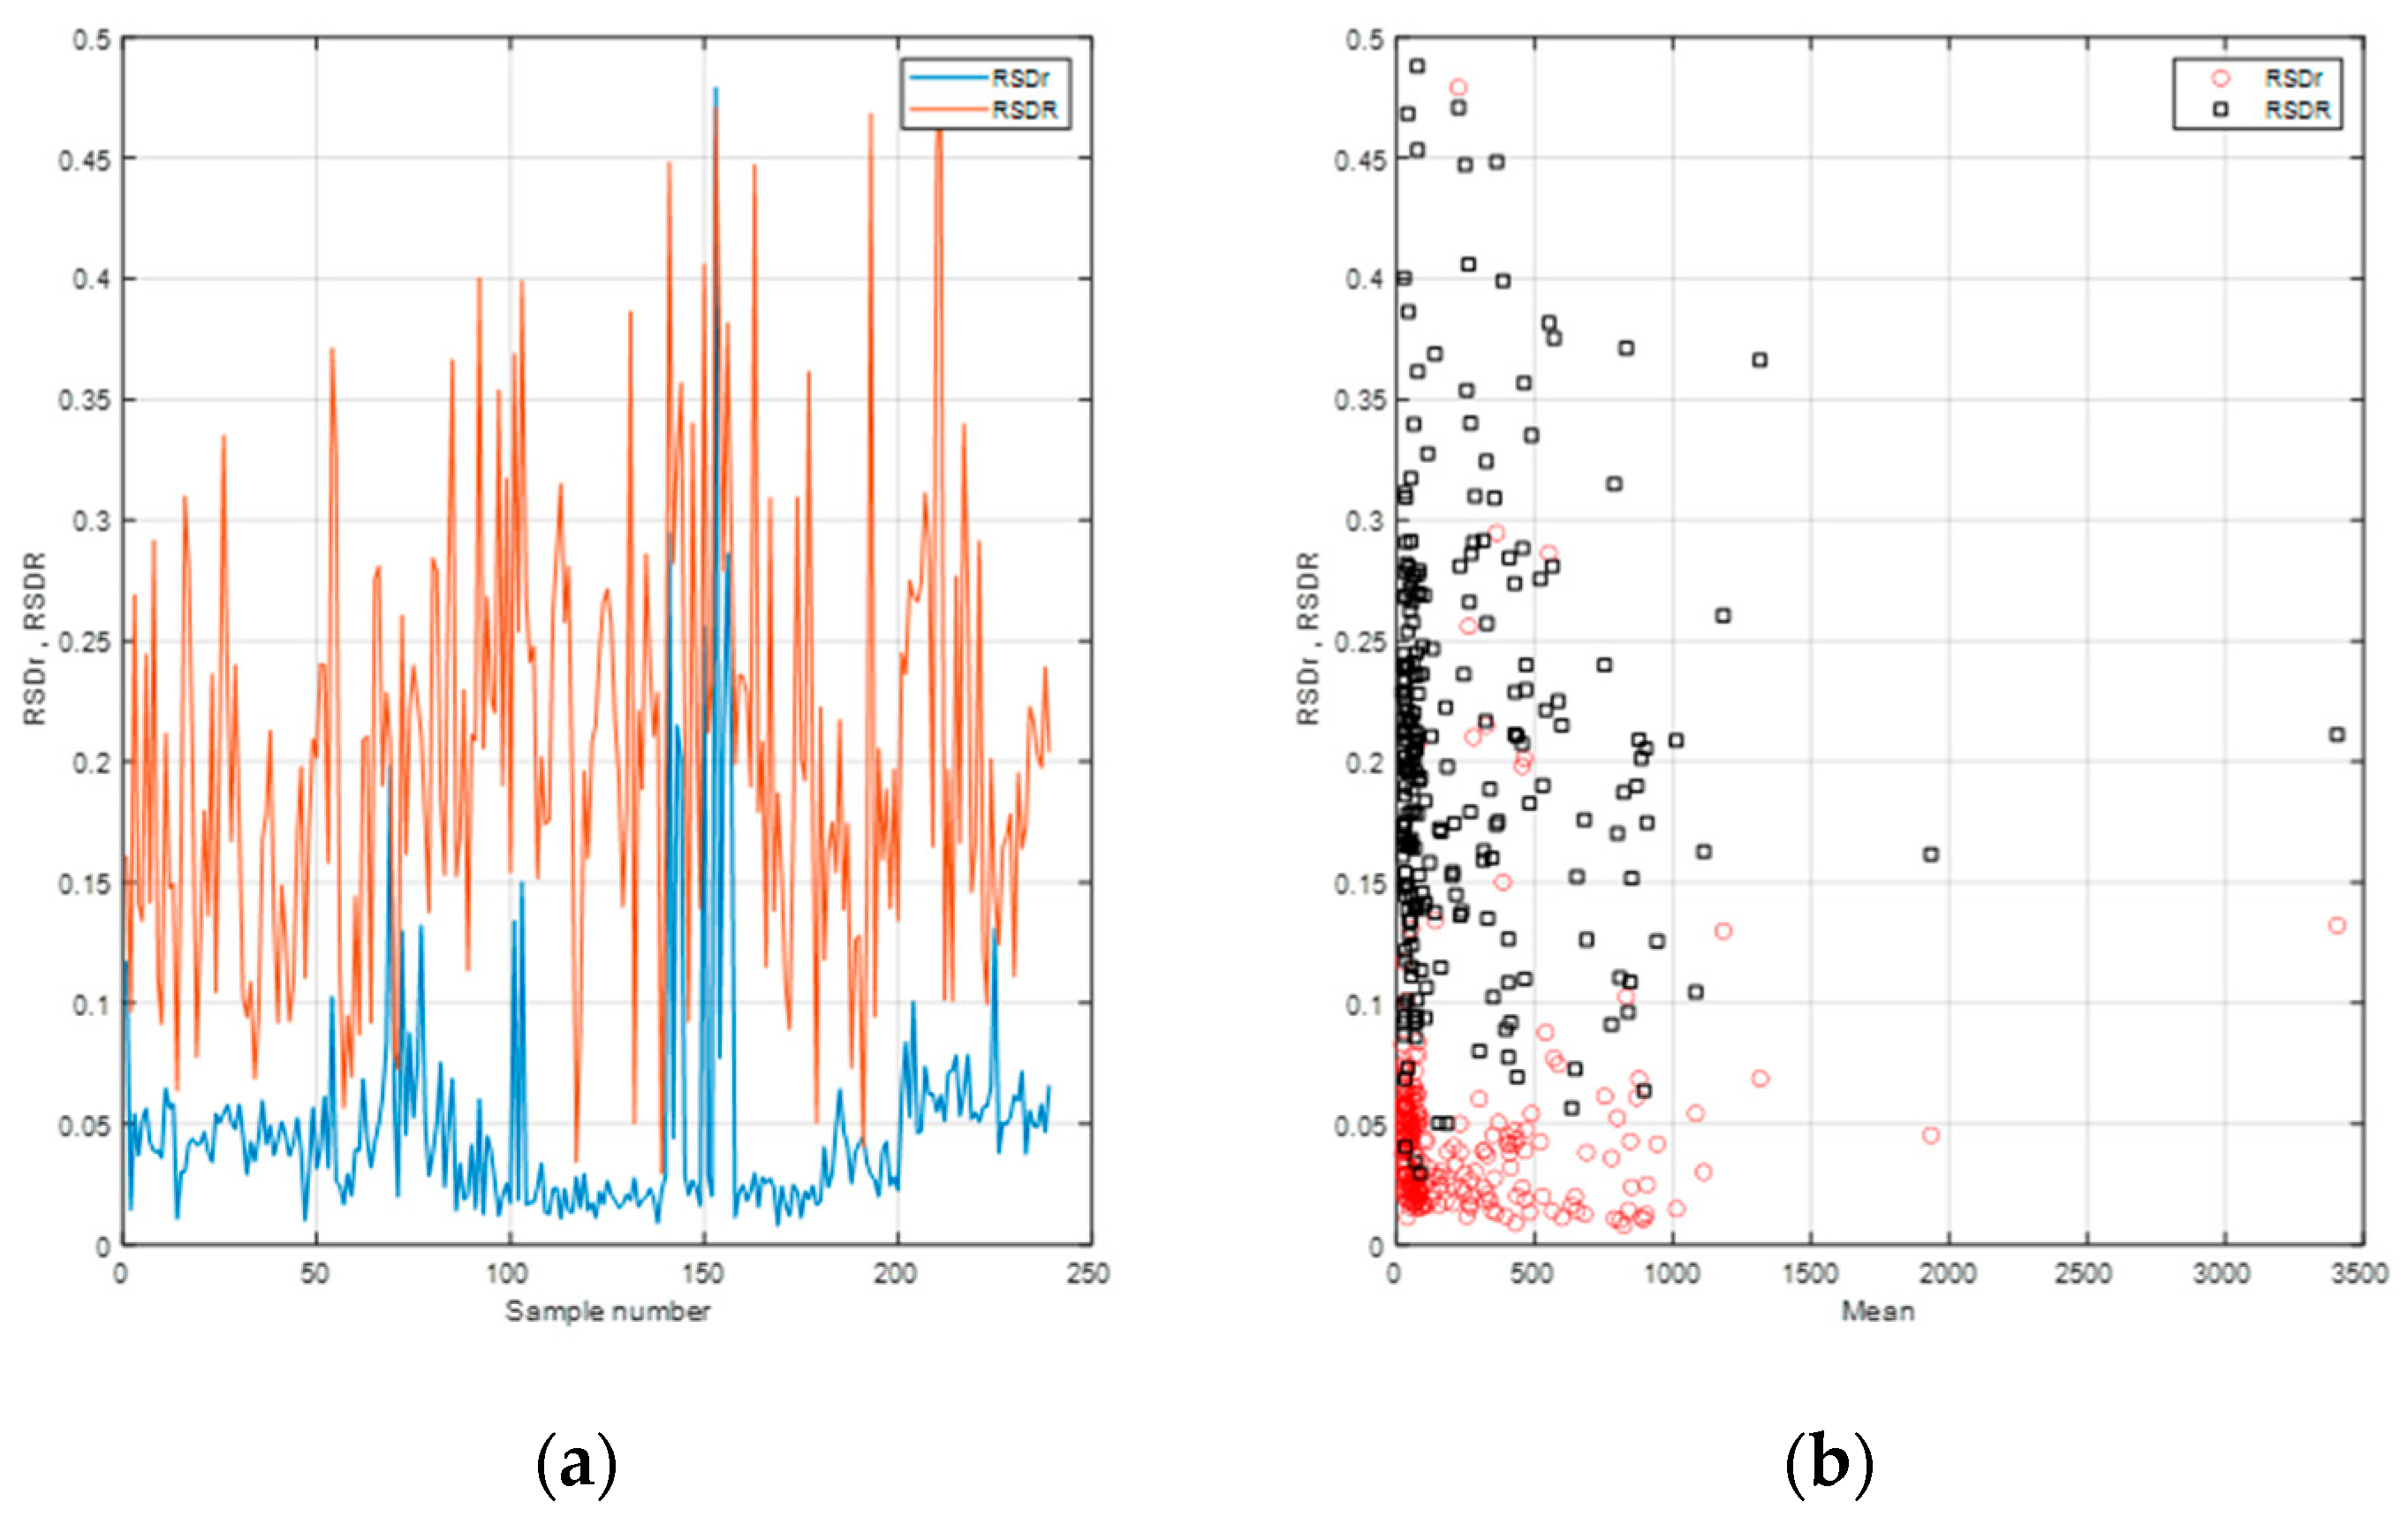
The repeatability and reproducibility of the analyses were calculated according to ISO 5725-2: 2019 [23]. The outlier values were excluded; hence, the analysis was made on 6039 values instead of 6480. The overall number can still be considered more than enough to determine the repeatability and the reproducibility of the method. Figure 9 shows the calculated values for the individual samples as a function of the mean value of the silicon concentration (shared value), in ppm, of RSDr (relative standard deviation of repeatability) and of RSDR (relative standard deviation of reproducibility).
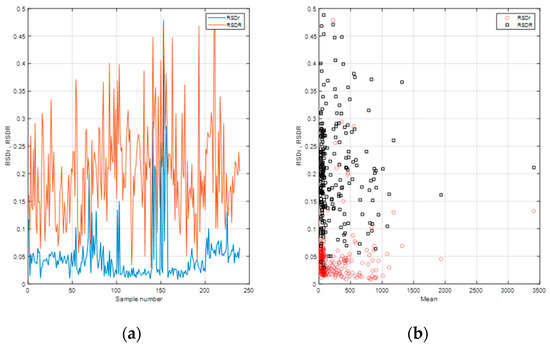
Figure 9.
RSDr and RSDR as a function of the sample (a) and of the mean values (b) of determined silicon concentration.
The distribution of relative standard deviation does not vary significantly with the concentration of silicon. An average value for both RSDr and RSDR, applicable within the measurement range, can be calculated, and they are reported in Table 3.
Table 3.
Average RSDr and RSDR values.
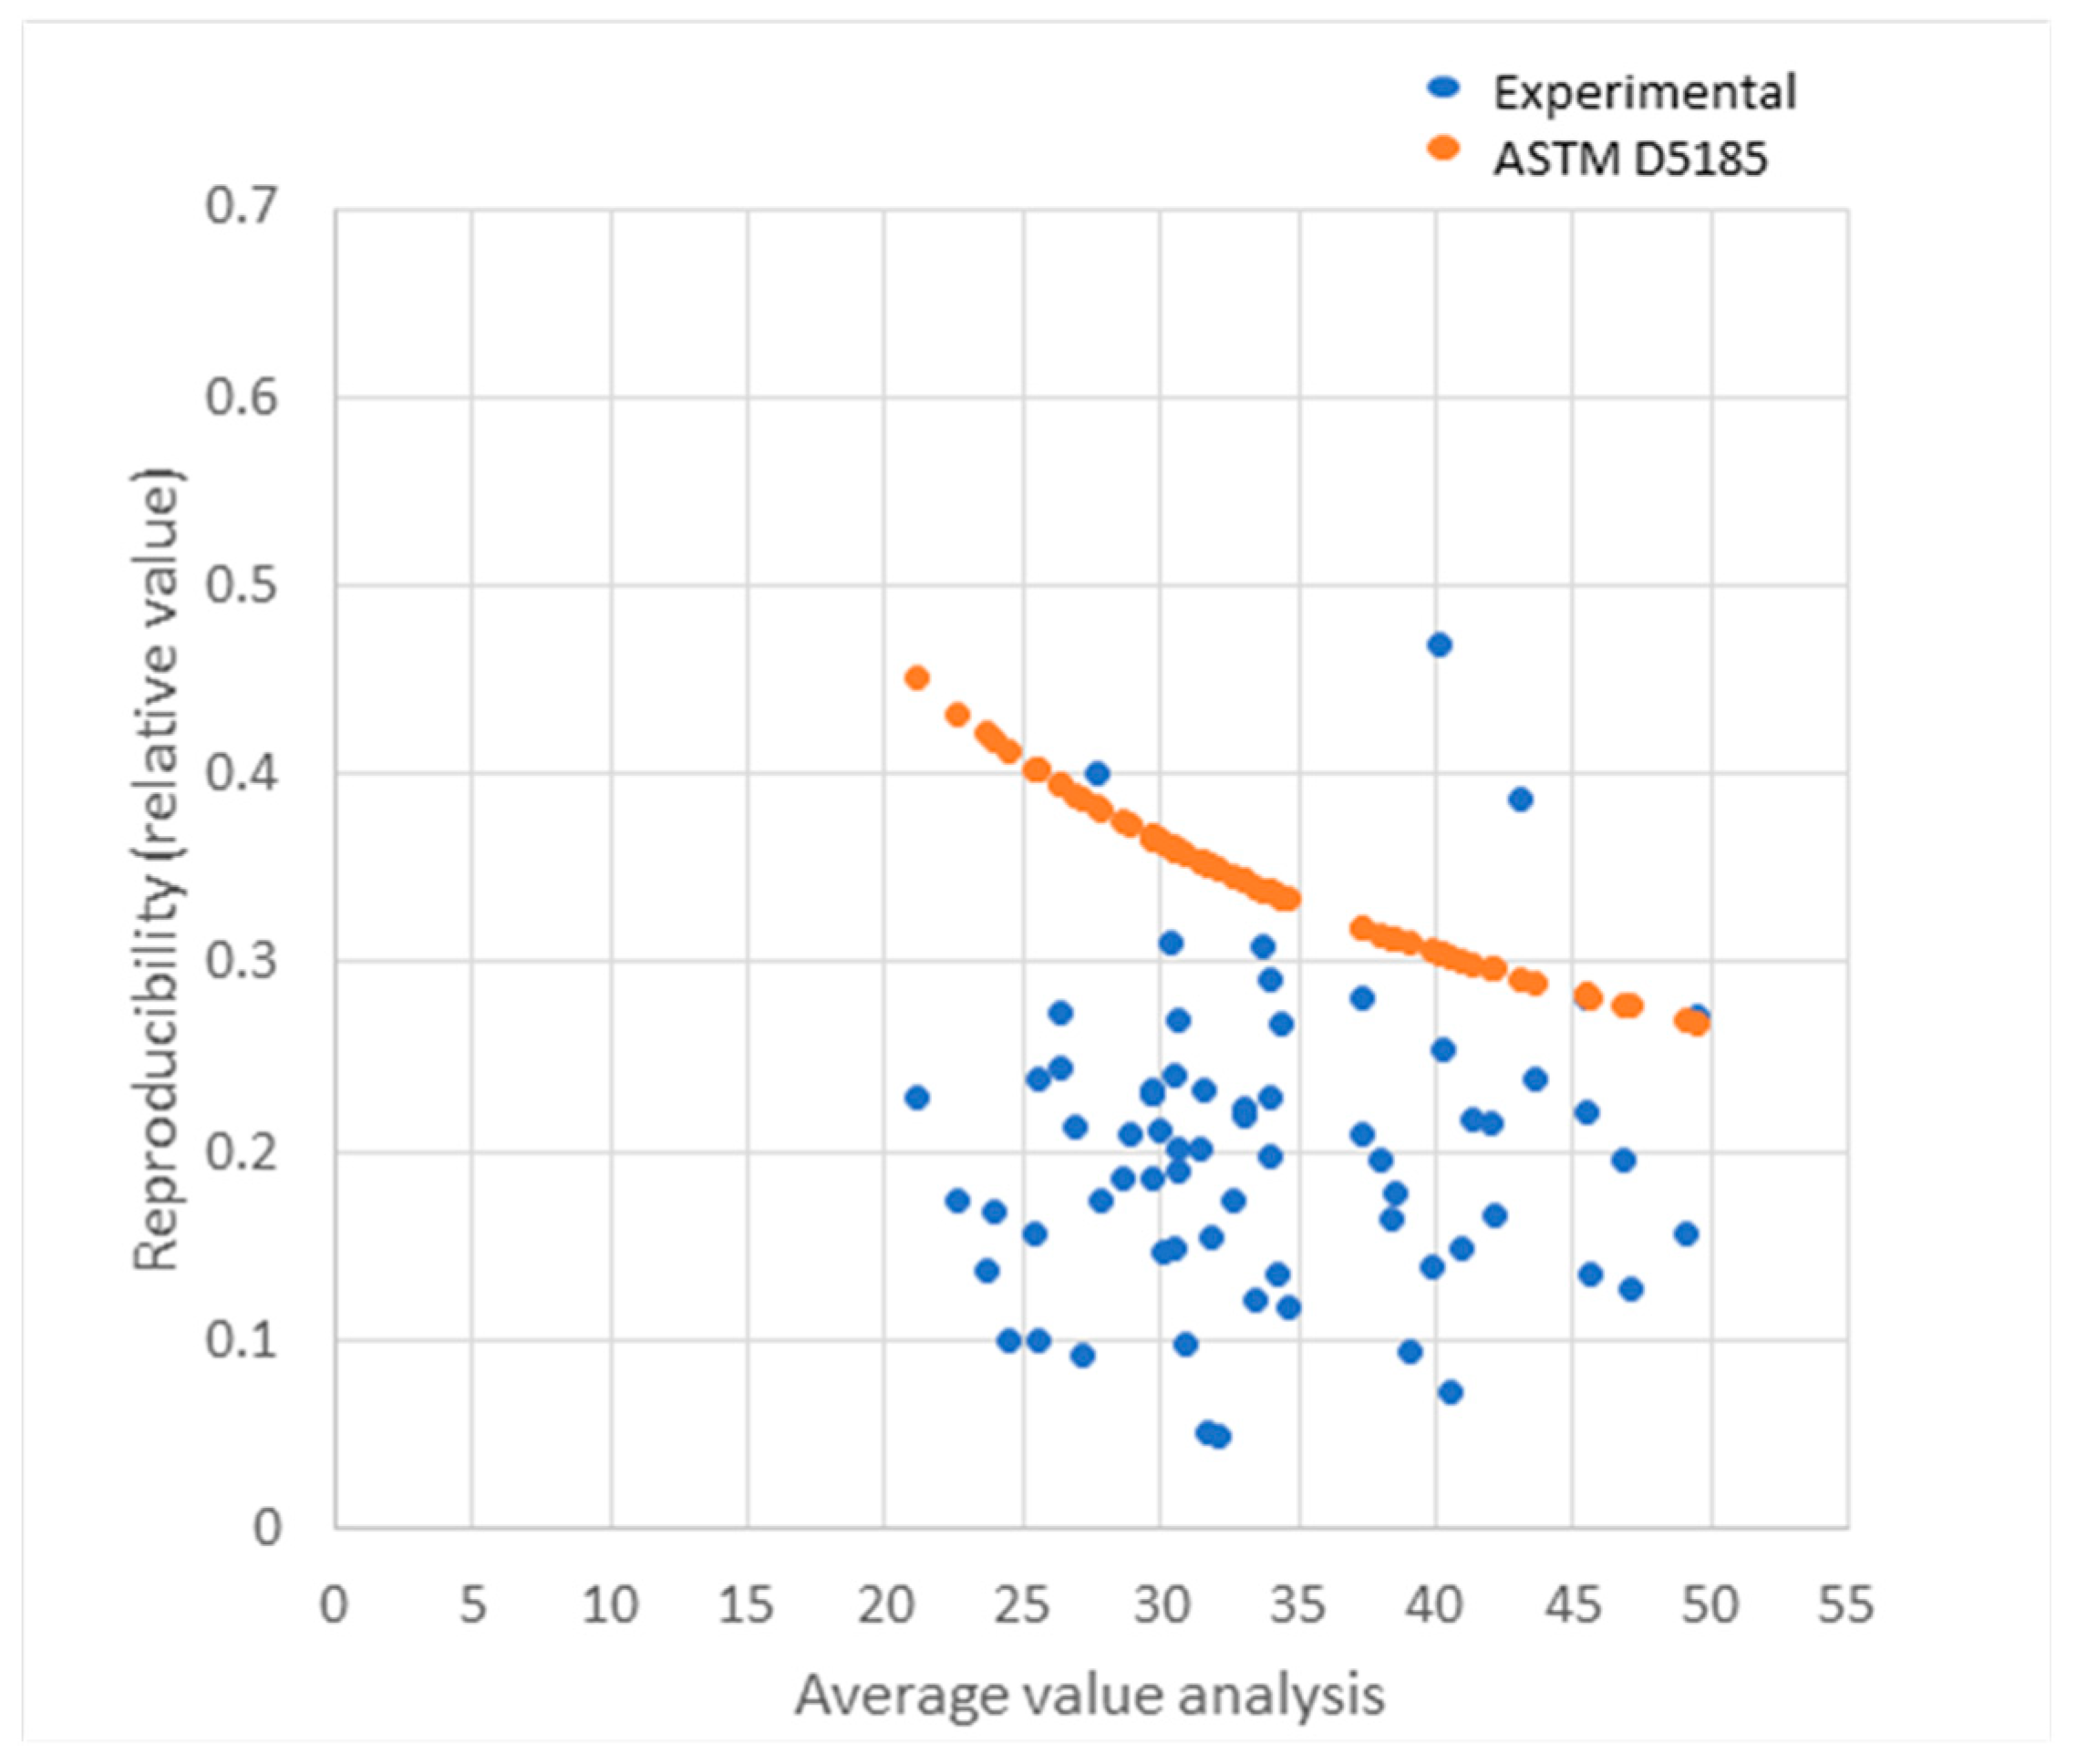
The average RSDR value is consistent with the method, which indicated 0.26 for a value of 50 ppm. All the results reported up to this point were based on the analysis of all samples regardless of the range of silicon concentrations. The following results, on the other hand, are intended to define the repeatability and reproducibility associated with the two different concentration ranges found for silicon. In particular, two different silicon concentration ranges have been investigated: low concentration (8–50 ppm) and high concentration (50–2000 ppm). In the following graph (Figure 10), the reproducibility (relative value) concerning the average value for the concentration range of 8–50 ppm was reported. The reproducibility of the analyses was calculated according to ISO 5725-2: 2019 standard [23].
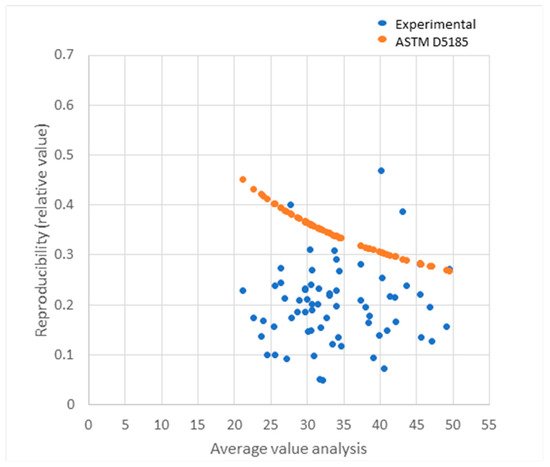
Figure 10.
Reproducibility (relative value) with respect to the average value (8–50 ppm).
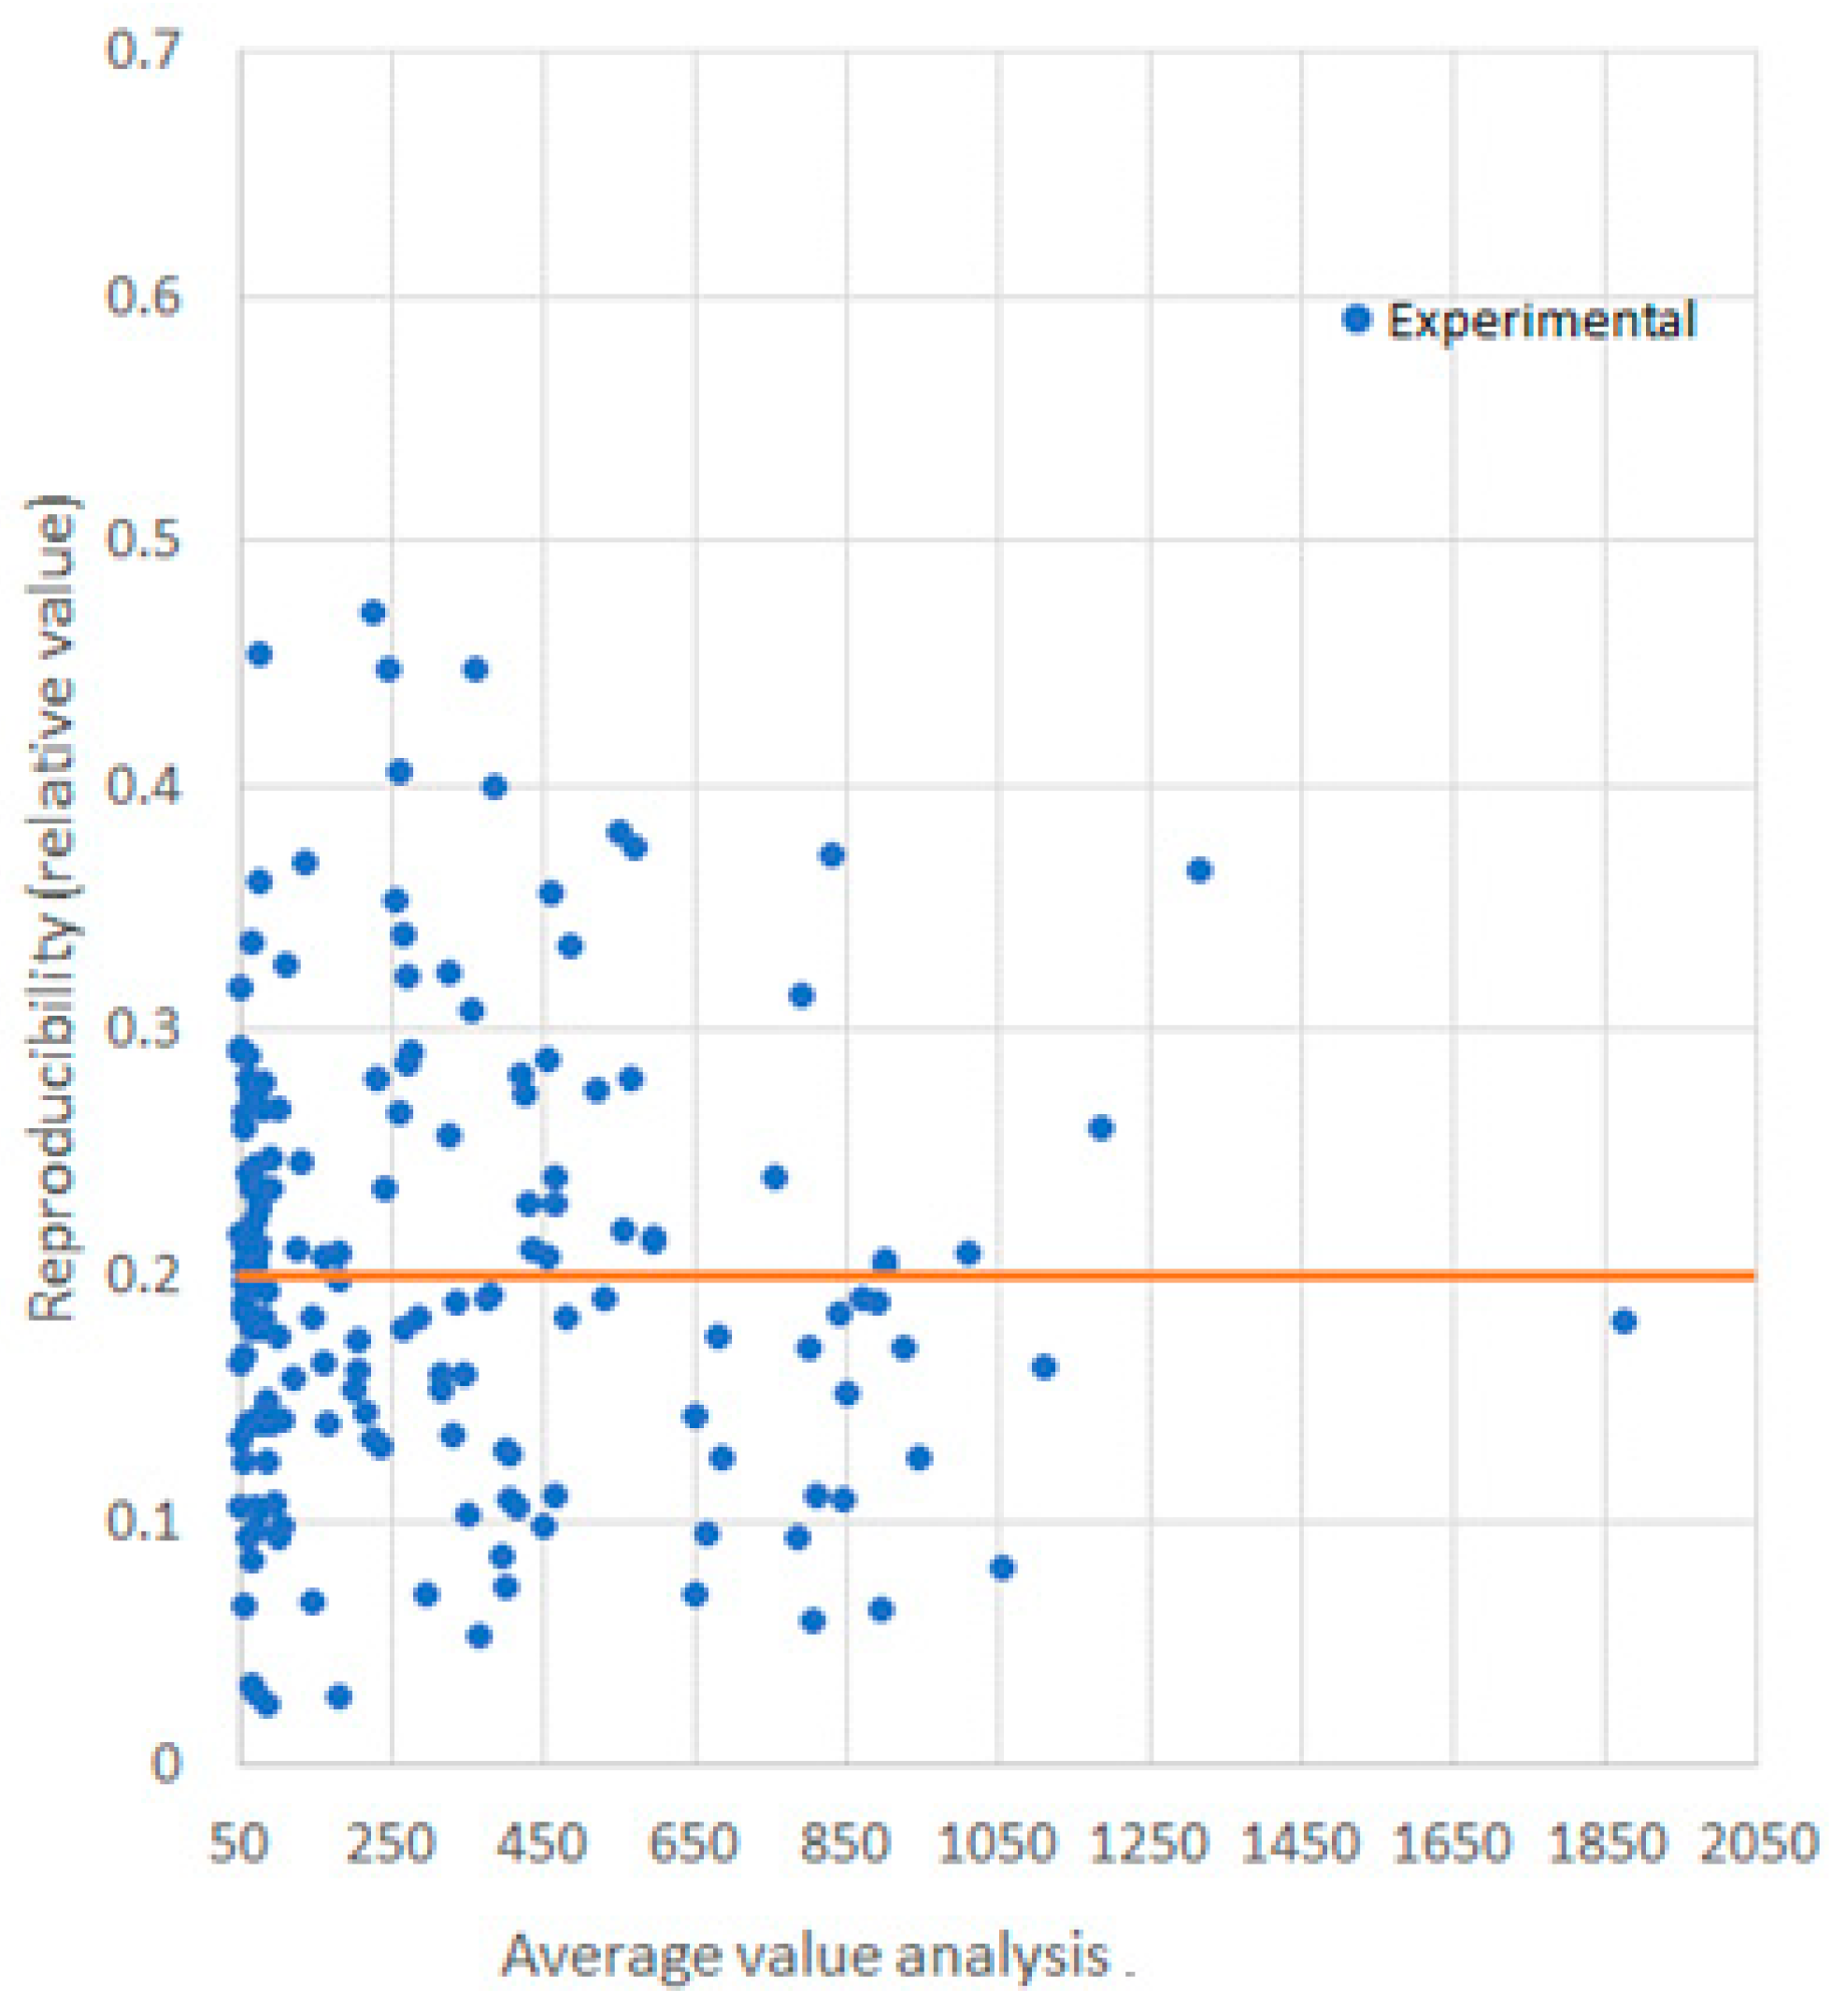
Figure 10 indicates that the obtained relative reproducibility values are lower than those reported in the ASTM D5185-18: 2018 standard [20]. Considering the results obtained for the concentration range of silicon 50–2000 ppm (Figure 11), it is possible to note that there is no specific trend in relative reproducibility. Therefore, a constant value of 0.20, indicated as the orange line, can be assumed in the range of high concentrations. This value cannot be compared with that reported on the ASTM D5185-18: 2018 [20] standard, as it only considers the low silicon concentrations range (0–50 ppm).
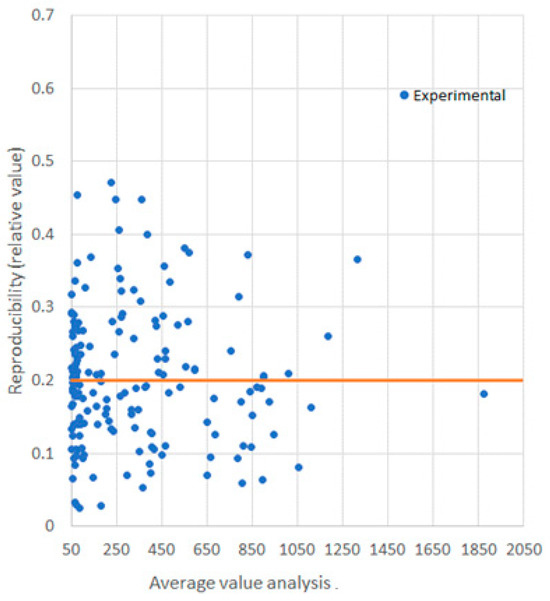
Figure 11.
Reproducibility (relative value) with respect to the average value (50–2000 ppm).
4. Conclusions
In the present work, a protocol for silicon determination in waste oils was developed. The ASTM D5185-18: 2018 [20] method is recommended by CONOU for determining metals in waste oils. The aim is to be able to use this procedure also for samples containing between 50 and 900 ppm of silicon. The Ring Test results demonstrated that the ASTM D5185-18: 2018 method is effective for measuring silicon concentrations above 50 ppm in waste oils. This approach allows us to determine the silicon content in waste oils, discriminating the possibility of recycling oils with a content of silicon lower than a limit value. The mean concentration of silicon is higher in the waste oils collected in northern Italy compared to southern Italy, in agreement with the higher presence of the metallurgic industry. The use of a statistical approach gave the possibility to organize a Ring Test without the use of reference material.
Author Contributions
Conceptualization, M.D.S., R.T. and M.T.; methodology, G.D.N.; software, R.T.; formal analysis, G.D.N.; investigation, F.T. and R.V.; data curation, F.T. and R.V.; writing—original draft preparation, M.B. and M.T.; writing—review and editing, F.T. and R.V.; supervision, M.D.S. and R.T.; project administration, M.D.S. All authors have read and agreed to the published version of the manuscript.
Funding
This research received no external funding.
Institutional Review Board Statement
Not applicable.
Informed Consent Statement
Not applicable.
Data Availability Statement
No data are available from the authors.
Acknowledgments
This study was carried out within the MICS (Made in Italy–Circular and Sustainable) Extended Partnership and received funding from the European Union Next-Generation EU (PIANO NAZIONALE DI RIPRESA E RESILIENZA (PNRR)–MISSIONE 4 COMPONENTE 2, INVESTIMENTO 1.3–D.D. 1551.11-10-2022, PE00000004). This manuscript reflects only the authors’ views and opinions; neither the European Union nor the European Commission can be considered responsible for them.
Conflicts of Interest
Authors state that there are no conflicts of interest.
References
- Nowak, P.; Kucharska, K.; Kamiński, M. Ecological and Health Effects of Lubricant Oils Emitted into the Environment. Int. J. Environ. Res. Public Health 2019, 16, 3002. [Google Scholar] [CrossRef] [PubMed]
- Benessere, V.; Cucciolito, M.E.; Dal Poggetto, G.; Di Serio, M.; López Granados, M.; Ruffo, F.; Vitagliano, A.; Vitiello, R. Strategies for immobilizing homogeneous zinc catalysts in biodiesel production. Catal. Commun. 2014, 56, 81–85. [Google Scholar] [CrossRef]
- Tesser, R.; Russo, V.; Turco, R.; Vitiello, R.; Di Serio, M. Bio-lubricants synthesis from the epoxidized oil promoted by clays: Kinetic modelling. Chem. Eng. Sci. 2020, 214, 115445. [Google Scholar] [CrossRef]
- Mishra, A.; Siddiqi, H.; Kumari, U.; Behera, I.D.; Mukherjee, S.; Meikap, B.C. Pyrolysis of waste lubricating oil/waste motor oil to generate high-grade fuel oil: A comprehensive review. Renew. Sustain. Energy Rev. 2021, 150, 111446. [Google Scholar] [CrossRef]
- Lei, B.; Wu, Y.T.; Wang, W.; Wang, J.F.; Ma, C.F. A study on lubricant oil supply for positive-displacement expanders in small-scale organic Rankine cycles. Energy 2014, 78, 846–853. [Google Scholar] [CrossRef]
- Pan, Y.; Abazari, R.; Tahir, B.; Sanati, S.; Zheng, Y.; Tahir, M.; Gao, J. Iron-based metal–organic frameworks and their derived materials for photocatalytic and photoelectrocatalytic reactions. Coord. Chem. Rev. 2024, 499, 215538. [Google Scholar] [CrossRef]
- Li, X.M.; Jia, J.; Yang, D.; Jin, J.; Gao, J. Construction of biomimetic proton transport channels in metal-organic framework. Chin. Chem. Lett. 2024, 35, 108474. [Google Scholar] [CrossRef]
- Santos, J.C.O.; Santos, I.M.G.; Souza, A.G. Thermal Degradation Process of Synthetic Lubricating Oils: Part I—Spectroscopic Study. Petrol. Sci. Technol. 2015, 33, 1238–1245. [Google Scholar] [CrossRef]
- Santos, J.C.O.; Santos, I.M.G.; Souza, A.G. Thermal degradation of synthetic lubricating oils: Part III—TG and DSC studies. Petrol. Sci. Technol. 2017, 35, 540–546. [Google Scholar] [CrossRef]
- Mishra, A.; Kumari, U.; Turlapati, V.Y.; Siddiqi, H.; Meikap, B.C. Extensive thermogravimetric and thermo-kinetic study of waste motor oil based on iso-conversional methods. Energy Convers. Manag. 2020, 221, 113194. [Google Scholar] [CrossRef]
- Wang, J.; Jia, C.R.; Wong, C.K.; Wong, P.K. Characterization of Polycyclic Aromatic Hydrocarbons Created in Lubricating Oils. Water Air Soil Pollut. 2000, 120, 381–396. [Google Scholar] [CrossRef]
- de Souza, C.V.; Corrêa, S.M. Polycyclic aromatic hydrocarbons in diesel emission, diesel fuel and lubricant oil. Fuel 2016, 185, 925–931. [Google Scholar] [CrossRef]
- Arpa, O.; Yumrutas, R.; Alma, M.H. Effects of turpentine and gasoline-like fuel obtained from waste lubrication oil on engine performance and exhaust emission. Energy 2010, 35, 3603–3613. [Google Scholar] [CrossRef]
- Bhaskar, T.; Uddin, M.A.; Muto, A.; Sakata, Y.; Omura, Y.; Kimura, K.; Kawakami, Y. Recycling of waste lubricant oil into chemical feedstock or fuel oil over supported iron oxide catalysts. Fuel 2004, 83, 9–15. [Google Scholar] [CrossRef]
- Mamun, A.A.; Al-Abdul Wahhab, H.I. Evaluation of Waste Engine Oil-Rejuvenated Asphalt Concrete Mixtures with High RAP Content. Adv. Mater. Sci. Eng. 2018, 2018, 7386256. [Google Scholar] [CrossRef]
- Pawlaka, Z.; Urbaniak, W.; Kaldonski, T.; Styp-Rekowski, M. Energy conservation through recycling of used oil. Ecol. Eng. 2010, 36, 1761–1764. [Google Scholar] [CrossRef]
- Conou. Available online: https://www.conou.it/en/ (accessed on 16 January 2024).
- Kelly, J.F.; Cotterell, M.G. Minimal lubrication machining of aluminium alloys. J. Mater. Process. Technol. 2002, 120, 327–334. [Google Scholar] [CrossRef]
- Sarkar, S.; Datta, D.; Deepak, K.S.; Mondal, B.K.; Das, B. Comprehensive investigation of various re-refining technologies of used lubricating oil: A review. J. Mater. Cycles Waste Manag. 2023, 25, 1935–1965. [Google Scholar] [CrossRef]
- ASTM D5185-18; Standard Test Method for Multielement Determination of Used and Unused Lubricating Oils and Base Oils by Inductively Coupled Plasma Atomic Emission Spectrometry (ICP-AES). ASTM: West Conshohocken, PA, USA, 2018.
- ISO 13528:2015; Statistical Methods for Use in Proficiency Testing by Interlaboratory Comparison. ISO: Geneva, Switzerland, 2015.
- Analytical Methods Committee, Royal Society of Chemistry, No. 6. April 2001. Available online: https://rsc.org/images/robust-statistics-technical-brief-6_tcm18-214850.pdf (accessed on 16 January 2024).
- ISO 5725-2; Accuracy (Trueness and Precision) of Measurement Methods and Results—Part 2: Basic Method for the Determination of Repeatability and Reproducibility of a Standard Measurement Method. ISO: Geneva, Switzerland, 2019.

Disclaimer/Publisher’s Note: The statements, opinions and data contained in all publications are solely those of the individual author(s) and contributor(s) and not of MDPI and/or the editor(s). MDPI and/or the editor(s) disclaim responsibility for any injury to people or property resulting from any ideas, methods, instructions or products referred to in the content. |
© 2024 by the authors. Licensee MDPI, Basel, Switzerland. This article is an open access article distributed under the terms and conditions of the Creative Commons Attribution (CC BY) license (https://creativecommons.org/licenses/by/4.0/).