Abstract
With the expansion of the scope and diversity of agricultural non-point source (AGNPS) pollution, environmental pollution in water bodies and soils has intensified, seriously affecting the quality of life of urban and rural residents. This paper presents a comprehensive analysis of the current status of AGNPS pollution from five aspects: fertilizers, pesticides, agricultural films, livestock and crop residues. The study also includes a comprehensive risk assessment of the nitrogen and phosphorus pollution, microplastic pollution, and heavy metal contamination attributed to the current AGNPS pollution in China. The findings reveal widespread nitrogen and phosphorus pollution across provinces in China, a low risk of microplastic pollution, and acute contamination with heavy metals such as As, Cd and Hg, notably in Hubei, Gansu, Liaoning, Guizhou, and Hunan. Additionally, the study reveals that in Chinese provinces currently facing severe heavy metal pollution, heavy metal contamination constitutes a significant carcinogenic risk to adult health and a serious non-carcinogenic risk to child health. Consequently, guided by the ‘3R theory’ principles of source reduction, interception, and remediation, this paper suggests an array of expanded strategies for AGNPS pollution management. These strategies are proposed to aid in the sustainable advancement of AGNPS pollution control.
1. Introduction
In recent years, with the improvement of point source pollution control levels, agricultural non-point source (AGNPS) pollution arising from various sources is already more and more serious, which has become a key factor affecting water environment security [1]. In an environment where point sources are effectively controlled, non-point source (NPS) pollution is considered to be the main factor causing the deterioration of water quality [2]. NPS pollution has gradually become a major regional and global environmental problem, which has attracted more and more attention around the world [3,4,5,6]. NPS pollution is a concept relative to point source pollution, which refers to soluble pollution produced in rural life or production activities, such as heavy metal in soil, excess nitrogen and phosphorus carried by fertilizers, pesticides residues and livestock manure, as well as the pollution caused by bringing pollutants into water bodies (rivers, lakes, reservoirs, bays) through surface runoff [7,8,9]. The widespread presence, complex hydrodynamics and great difficulty in handling of NPS pollution has made it an important source of pollution in water environment [10].
In addition, AGNPS pollution presents characteristics such as complexity, hysteresis, multiple sources of pollution, wide distribution, difficulty in control, etc. [11,12]. Many studies have reported that chemical fertilizers, soil particles, microplastic particles, livestock manure and pesticides can enter soil surface runoff and underground runoff under rainfall conditions. Excessive input of phosphorus and nitrogen into water bodies leads to eutrophication [13,14,15,16]. The widespread use of plastic films in agriculture leads to the degradation and formation of small plastics and microplastics, which accumulate in the soil, causing a decrease in soil fertility and pollution [17]. These particles are also transported to nearby water bodies, causing developmental delays and weakened immune systems in aquatic animals [18]. However, the uncertainty of NPS pollution discharge path leads to the difficulty of water pollution traceability [19]. At the same time, the lack of relevant monitoring data also limits the research and control of NPS pollution [20]. In view of the limitations of NPS pollution-related data, scholars have studied and developed many assessment models to determine the key source areas in the watershed by analyzing the spatial distribution of NPS pollution [21]. Up to now, the research on spatial distribution and risk assessment of AGNPS pollution has made great progress, the assessment model has provided scientific basis for the prevention and control of AGNPS pollution in the basin, and has also played a positive role in achieving the goal of water pollution control in the basin [22,23].
In summary, this paper primarily focuses on several key aspects: providing a comprehensive summary of the sources of AGNPS pollution; examining the recent situation in AGNPS pollution within China; and introducing and summarizing the most current methods for managing AGNPS pollution, specifically targeting the control of nitrogen, phosphorus, microplastics, and heavy metals in the most heavily affected provinces in China. This article will serve as a foundational reference for future efforts in AGNPS pollution control in China.
2. Materials and Methods
2.1. Study Area
China, situated on the eastern Eurasian Plate, features a varied landscape. As the world’s third-largest country by land area, at 9.6 million square kilometers, China is surpassed only by Russia and Canada. Moreover, China is the second most populous country after India, comprising about 17.72% of the global population [24]. Despite this, only 7% of the world’s arable land is in China, a limitation that leads to high usage of fertilizers and pesticides, ranking it among the world’s foremost consumers. The vast population contributes to increasing agricultural and livestock waste, intensifying AGNPS pollution.
This study is designed to provide an accurate assessment of the current state of AGNPS in China. Our analysis centers on three key contributors to AGNPS across China’s 31 provinces: total nitrogen (TN) and total phosphorus (TP), heavy metals, and microplastics (resulting from the degradation of plastic films). The objective is to evaluate the risk associated with present NPS levels.
2.2. Methodology
2.2.1. TN and TP Assessment
In this study, the factors of TN and TP were determined by analyzing the concentrations of nitrogen and phosphorus in major rivers, reservoirs, and lakes situated in proximity to agricultural regions across all 31 provinces. The evaluation of water quality is detailed in Table S1.
2.2.2. Microplastics Ecological Risk Assessment
In this study, the microplastic risk in water bodies across Chinese provinces was assessed using two indices: ecological risk index (H) and the regional pollution loading index (PLI). The risk index (H) is derived from the toxicity of polymers, serving as a measure in microplastic risk assessment. This index encapsulates the cumulative toxic impact of different polymer types [25]. The formula used is as follows:
H is the ecological risk index of microplastics, Pi is the proportion of each plastic, Si is the risk score of each type of plastic polymer. Polyethylene (PE), polypropylene (PP), polyamide (PA), polyethylene terephthalate (PET), polystyrene (PS) as the main components of agricultural plastic films, with risk scores of 11, 1, 50, 4, and 30, respectively [26].
The regional pollution loading index (PLI) uses microplastic abundance as an indicator of the agricultural NPS pollution—microplastics status of the region [27].
CFi is the pollution coefficient, which is the ratio of the abundance of microplastics at each point (Ci) to the background value of microplastic abundance (Cb), Cb refers to the predicted no-effect concentration as the reference value, and the reference value of the water body is 6650 n·m−3 [28]. PLIi is the pollution loading index of a certain point, PLIall is the pollution loading index of the whole region, n is the number of points. The risk classification is shown in Table S2.
2.2.3. Heavy Metal Ecological Risk Assessment
Heavy metals possess distinct physicochemical properties that impact the environment, leading to ecological pollution. Consequently, the ecological risk index formula is employed to quantify the extent of heavy metal contamination [29]. The formula is as follows:
RI represents the comprehensive ecological risk index. Eir denotes the potential ecological risk index for a specific heavy metal, Tir signifies the toxicity response coefficient of i; Pi is the enrichment coefficient of i; Wi refers to the measured value of i; and Bi represents the background value of i. Research has established that the toxicity response coefficients for As, Cd, Cr, Cu, Hg, Ni, Pb and Zn are 10, 30, 2, 5, 40, 5, 5, and 1, respectively [30]. The risk classification is shown in Table S3.
2.2.4. Heavy Metal Health Risk Assessment
The assessment of health risks posed by heavy metals primarily involves quantifying both non-carcinogenic and carcinogenic risks to humans, which occur through direct oral intake, dermal contact, and inhalation. In this study, we employed the human exposure risk assessment model endorsed by the United States Environmental Protection Agency (USEPA) to determine the carcinogenic and non-carcinogenic risks to both adults and children in the study area [29]. The formula for this calculation is as follows:
ADIdoi, ADIri, and ADIsc represent the acceptable daily intake (ADI) values for direct oral intake, respiratory inhalation, and skin contact, respectively, expressed in mg·(kg·d)−1. Ci denotes the concentration of heavy metals, measured in mg·kg−1. The definitions and values of additional parameters can be found in Table S4.
Health risks are categorized into non-carcinogenic and carcinogenic types. The non-carcinogenic health risk is assessed using HQ or HI, which are defined as follows:
HQij represents the non-carcinogenic risk index for individual heavy metals, while HI denotes the collective non-carcinogenic health risk index for multiple heavy metals. The reference dose, RfDij, in mg·(kg·d)−1, is detailed in Table S5. A value of HQij or HI below 1 indicates an insignificant non-carcinogenic health risk, deemed acceptable. Conversely, values exceeding 1 signify a notable non-carcinogenic risk.
The carcinogenic risk index is determined as follows:
CRij refers to the individual carcinogenic risk index, while SFij is the slope factor in mg·(kg·d)−1, and TCR represents the total carcinogenic risk for multiple heavy metals. CRij value below 10−6 implies negligible carcinogenic risk. In contrast, values ranging from 1 × 10⁻⁶ to 1 × 10⁻⁴ denote an acceptable level of carcinogenic risk.
2.3. Data Screening and Processing
In this study, we systematically collected and analyzed literature on agricultural water and soil pollution published between 2018 and 2023. To ensure a clear research focus on agricultural nonpoint source pollution, we applied rigorous screening criteria, prioritizing studies that directly address the impacts of pollution from agricultural activities. In addition, we paid particular attention to studies that provided a clear methodological approach to differentiate between pollution from agricultural sources and pollution from urban sources. This approach allows us to more accurately define and understand the extent and impacts of agricultural nonpoint source pollution, while excluding, to the extent possible, interference from specific urban sources. For detailed data, please refer to the Supplementary Materials (Tables S6–S8).
The ArcGIS 10.7 software was utilized to create the sampling distribution map. Data processing and descriptive statistical analysis were conducted using Origin 2019 software, while correlation analysis to assess agricultural surface source pollution in each Chinese province was performed with SPSS 22.0 software.
2.4. Use of AI-Assisted Technology
In this study, we integrated the GPT-4.0 AI model provided by OpenAI and the Write tool from DeepL to improve the writing quality and language accuracy of the paper. The specific applications are as follows:
We use GPT-4.0 to touch up academic papers. By entering the command “Below is a paragraph from an academic paper. Then polish the writing to meet the academic style, improve the spelling, grammar, clarity, concision and overall readability. Then polish the writing to meet the academic style, improve the spelling, grammar, clarity, concision and overall readability.”, GPT-4.0 automatically optimized the text for spelling, grammar, clarity and overall readability. This process enhances the academic style and clarity of presentation of the paper.
In order to further enhance the quality of the text, we used DeepL Write for text proofreading. DeepL Write proofreads the text for spelling and grammar through its advanced text processing functions, and suggests optimization of the language style and expression.
All content touched up using GPT-4.0 and DeepL Write was reviewed and edited in detail by the authors to ensure accuracy, appropriateness, and compliance with academic integrity. Relevant ethical standards and publication guidelines were strictly adhered to throughout the research and writing process to ensure quality and academic integrity.
3. Types of AGNPS Pollution
AGNPS pollution refers to pollution caused by nitrogen, phosphorus, metallic elements, pesticides and other organic or inorganic pollutants entering environmental water bodies through rainfall, surface runoff, paddy field runoff and underground leakage in agricultural activities such as farmland farming, livestock and poultry breeding, pesticide spraying, irrigation and fertilization [31]. The pollutants are mainly water-soluble chemical substances such as nitrogen, phosphorus and COD, and water-insoluble macromolecular substances such as agricultural film and crop straw [32]. In China, AGNPS pollution is mainly caused by the following: unreasonable application of pesticides and fertilizers in the planting industry, arbitrary disposal of agricultural plastic film, random disposal and incineration of crop straws, and improper disposal of livestock excreta.
3.1. Pollution from Fertilizers
In order to pursue the rapid crop growth, increased yield and income, farmers usually use a large number of fertilizers, such as nitrogen fertilizer, phosphate fertilizer and potassium fertilizer. About 86% of agricultural products are produced using chemical fertilizers [33]. In areas with significant fertilizer use, high concentrations of nitrogen and phosphorus pollution can be detected [34,35]. Since the utilization rate of fertilizers by crops is certain, excessive fertilizers can enter nearby water bodies with rainwater or irrigation water, bringing serious burden to the water body, resulting in high contents of TN, TP and NH3-N in water body, resulting in eutrophication of water body and serious damage to steady-state environment.
China ranks first in the world in terms of fertilizer use, which is the sum of the United States and India, and the amount per hectare is 2.8 times that of the United States and 2.6 times that of Europe [36]. The average amount of fertilizer applied in China is 335.3 kg·hm−2, and even reaches more than 500 kg·hm−2 in some regions [37]. In the United States, the use of fertilizers in agriculture has been steadily increasing [38]. Wisconsin’s groundwater is severely polluted due to high levels of nitrogen from fertilizers [39]. In India, during the period 2017 to 2018, an annual average of 26.59 million tons of fertilizer was used [40,41]. Excessive use of fertilizer not only creates the hazard of soil compaction, but also seriously damages the environment through surface and subsurface runoff into water bodies.
3.2. Pollution from Pesticides
Pesticides are used to control weeds and insects in agriculture. About 34% of agricultural products are produced using pesticides [33]. After pesticides are applied to crops, although they can be degraded by microorganisms, chemical reactions or light [42], the degradation of pesticides may take hours, days or even years according to different environmental conditions and different chemical characteristics of pesticides [43,44]. After the application of pesticide, the residual chemical substances in environment such as soil, water bodies, and crops, under the action of various factors such as rainwater scouring, landslides and geological changes, soil and water loss causes the residual chemical pesticide elements in soil to be transferred to the surface runoff and underground runoff, and finally transported to the nearby waters, causing pollution [45]. Pesticides that eventually enter water bodies pose a great threat to rivers, lakes, reservoirs and their aquatic ecosystems [46,47].
Global pesticide consumption reaches around 2 million tons annually, with approximately 16% in China, 14% in Japan, 11% in the Netherlands, 8% in the USA, 7% in Korea, 6% in the UK, 5% in France, 3% in Germany, 3% in Austria, 1% in Pakistan, 1% in India, and the remaining 20% consumed in other regions worldwide [48]. According to the statistical data analysis of the National Bureau of Statistics of China, the amount of pesticide used in China in 2021 was 1.31 million tons, which was 27.62% less than the peak of 1.81 million tons in 2014, the amount of pesticide used per unit area was still much higher than the world average. In the United States, the annual average pesticide usage is approximately 400,000 to 450,000 tons, components of approximately 150 different pesticides have been detected in surface water in 609 cities, with herbicides and insecticides being nearly ubiquitous [49,50]. Intensive land use practices in Brazil, Argentina, Costa Rica, and Chile have led to an increase in pesticide usage, resulting in soil and water source contamination [51]. In developing countries like India, concentrations of organophosphate pesticides in certain water bodies have far exceeded safe environmental standards, resulting in approximately 300,000 cases of organophosphate pesticide poisoning globally each year [52]. The excessive and improper use of pesticides has led to soil and water pollution, posing a significant threat to aquatic life and the health of nearby residents. Additionally, prolonged exposure to pesticide-contaminated environments significantly increases the risk of diseases and cancer in humans.
3.3. Pollution from Agricultural Plastic Film
Agricultural plastic film, also known as agricultural ground covering film, can not only improve ground temperature, keep water, soil and fertilizer, but also prevent weeds, diseases, pests, drought and waterlogging, and other functions [53,54]. As it helps to improve crop productivity, plastic film is used more and more in the world [55,56]. However, the threat posed by the accumulation of plastic debris in soil has only been pointed out in recent years [57,58]. Studies have shown that the accumulation of film residues can have a significant negative impact on soil quality and crop growth [59,60,61]. Microplastics are now considered to be an important environmental pollutant, almost ubiquitous in the atmosphere, water, soil and other environmental media [62,63]. Specifically, the morphology of microplastic fibers plays a critical role in their capability for long-range atmospheric transport, suggesting that they can traverse vast geographical expanses and exert impacts on the environment [64]. Due to their small particle size and very slow biodegradation, they are easily absorbed by organisms and subsequently transported through the food web [65,66,67,68]. They may act as carriers for other pollutants (e.g., human pathogens, organic pollutants, heavy metals) [69]. When discarded agricultural plastic film debris enters the cultivated soil, it destroys the normal structure of the soil, affects soil permeability, hinders water absorption and root growth of crops, seriously affects the utilization of land resources, and causes great harm to agricultural production [70,71].
In agricultural soils worldwide, the average concentration of plastic residues is in the range of 50–250 kg ha−1 [69]. At present, the amount of agricultural plastic film used in China is the largest in the world [72]. The total amount of agricultural plastic film used in China reached 2.39 million tons in 2021. The coverage area of plastic film reached 18.4 million ha, accounting for about 12% of the total arable land in that year [73]. According to the monitoring data of the Ministry of Agriculture in 2016, all the soil covered with plastic film in China has different degrees of plastic film residue, with the average residual amount of 0.27–1.3 kg ha−1 in some areas and more than 2 kg ha−1 in some plots. In North America, the annual usage of plastic films in agriculture is estimated to be between 44,000 and 300,000 metric tons [63]. In Europe, the annual production of microplastic pollution is estimated to be approximately 430,000 tons [74]. In India, there is a plastic film residue ranging from 35.07% to 37.97% in the soil at depths of 0–30 cm [75]. In the rivers of Bangladesh, the presence of microplastics in fish, ranging from 0.63 to 7.0 particles per individual [76]. The microplastics pose serious environmental and human health risks and need to be dealt with as early as possible to combat increased microplastic pollution.
3.4. Pollution of Livestock and Poultry Breeding
In recent years, with the improvement of residents’ living standards, the rural livestock and poultry breeding industry has developed rapidly [77]. Most of the farms do not have a corresponding fecal treatment system, especially those small farmers who choose the way of stocking for breeding. Animal waste is an important source of AGNPS pollution, its output is huge and pollution is widespread, but the corresponding pollution prevention countermeasures are relatively weak [78]. The discharge of livestock and poultry feces is large and highly random, then the direct or indirect discharge of eutrophic substances such as nitrogen and phosphorus into the water bodies, causing serious pollution to water quality [79]. Therefore, livestock and poultry breeding have become one of the key issues of AGNPS pollution.
According to the statistics of “Ecological Environment Data” and “China Statistical Yearbook 2022”, China had a total of 104.86 million large livestock, and 15.57 billion poultry were sold annually, including 600,000 tons of NH3-N emission from livestock and poultry breeding, accounting for 25% of the total pollution emissions in China [37,80]. In America, pollution from agriculture and livestock farming has led to eutrophication in coastal lagoons [81]. In Argentina, livestock wastewater has resulted in El Pescado Creek having elevated levels of organic matter, nutrients, and pharmaceutical compounds [82]. These pollutants will enter into the water body through rainwater scouring and surface water runoff, which will further aggravate the eutrophication of the water body. Rising levels of nitrogen, phosphorus and heavy metals in water bodies as a result of increasing agricultural surface pollution caused by livestock and poultry farming are not only extremely harmful to the environment, but also pose a risk to human health.
3.5. Pollution from Crop Straw
As a by-product of agricultural production, crop straw is also an important step in the cycle of “returning farmland to increase production” [83]. However, with the popularization of high efficiency coal and liquefied gas, the burning method has been gradually replaced, and a large number of straw residues has occurred in rural areas. Research indicates that burying crop residues in soil increases the levels of methylmercury and cadmium in the soil and crops [84,85].
Since the 1980s, China’s grain output increased significantly, and the amount of crop straw has also begun to increase. From 2010 to 2017, China’s agricultural straw production increased from 700 million tons to 780 million tons, of which 27% was incinerated, 38% returned to farmland, 17% was used for fuel and 14% for feed [36,80]. The General Office of the State Council issued the notice on the Comprehensive Utilization of Agricultural straw in 2019, which aims to promote the return of straw to fields or other uses, including feed, substrate, energy fuel, feed raw materials, etc. However, the proportion of crop straw burned in the field is still very high, accounting for 10–50% in most areas of China, and even higher in some areas [86]. The disposal of crop straw through direct burning, accumulation in fields, or abandonment in rivers constitutes not only a significant waste of resources, but also leads to severe environmental pollution. When this waste straw is left in fields and rivers, it contributes to elevated levels of nitrogen and phosphorus in aquatic systems, thereby inducing eutrophication.
4. Results of the AGNPS Risk Assessment
4.1. Spatial Variability of TN and TP of Water Bodies in Different Provinces of China
The TN and TP concentrations and pollution of major agricultural water bodies in 31 provinces of China are shown in Figure 1 and Table 1. TN values varied from 0.54 to 9.32 mg·(kg·d)−1, with a mean value of 2.89. TN values varied from 0.03 to 0.57 mg·L−1, with a mean value of 0.16. The Tibetan province, which has some of the lowest TN and TP concentrations in the country, is still recognized as Class IV water quality, while the other provinces have Class V and Super Class V water quality, indicating serious TN and TP pollution in major agricultural water bodies in China. The water quality was Class V and Super Class V, which indicated that TN and TP pollution was serious in major agricultural water bodies in China. The provinces with the most serious TN concentrations (mg·L−1) are: Hubei (4.07) > Hebei (3.5) > Henan (3.2) > Qinghai (2.95) > Fujian (2.93) > Guizhou (2.87) > Sichuan (2.65) > Shandong (2.63) > Jilin (2.61) > Ningxia (2.61) > Ningxia (2.61) > Heilongjiang (2.6) > Anhui (2.51) > Gansu (2.38) > Tianjin (2.32) > Beijing (2.27) > Zhejiang (2.21) > Shanghai (2.12) > Jiangsu (2.01). The provinces with the most serious TN concentrations (mg·L−1) are: Guangdong (0.57) > Shanxi (0.33) > Hunan (0.30) > Sichuan (0.27) > Shandong (0.25) > Tianjin (0.25) > Shanghai (0.25) > Chongqing (Shanghai (0.25) > Chongqing (0.22) > Yunnan (0.22) > Jiangxi (0.22).
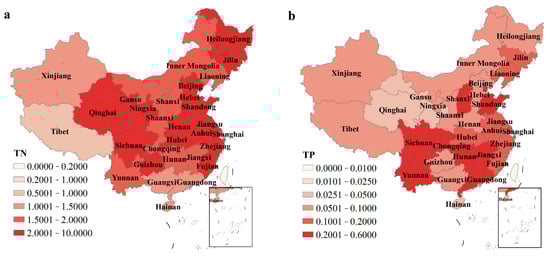
Figure 1.
TN and TP values in water bodies of different provinces in China. (a) TN values; (b) TP values.

Table 1.
The content of TN and TP in different provinces in China.
Most of the TN and TP concentrations in the water bodies in this study were similar to previous findings in other provinces in China. However, there is a phenomenon that Hunan, Hebei and Henan possess higher TN concentrations, and Guangdong, Jiangxi and Hunan possess higher TP concentrations. According to China’s environmental quality standard for surface water (Table S1), the maximum TN and TP concentrations for Class V water quality are 2 and 0.2. Our study found that TN and TP in agricultural waters exceeded the maximum standard, which indicates the existence of more serious nitrogen and phosphorus contamination of the water bodies, and timely measures are needed to prevent further aggravation of the contamination.
4.2. Ecological Risk Assessment of Agricultural Microplastics
The results of microplastic ecological risk index (H) and microplastic regional pollution loading indices (PLIs) for each province in China are shown in Figure 2 and Table 2. The provinces with more serious microplastic ecological risk are: Jilin (19.09) > Hainan (15.62) > Inner Mongolia (14.47) > Heilongjiang (13.66) > Gansu (12.83) > Hunan (12.61) > Jiangsu (11.38) > Liaoning (10.92) > Anhui (10.20) > Liaoning (10.92) > Anhui (10.20). The PLIs of all provinces in China was lower than 10.0.
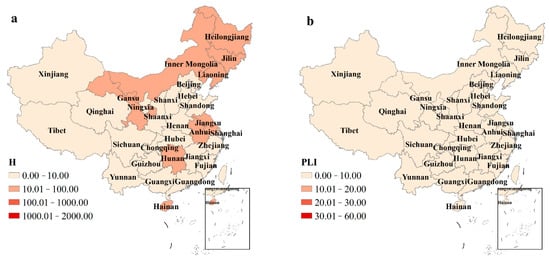
Figure 2.
Ecological risk assessment of microplastic in water bodies of different provinces in China. (a) the ecological risk index; (b) regional pollution loading index.
Table 2.
Ecological risk assessment of microplastic in different provinces in China.
The regional pollution loading index (PLI) reflects the abundance of microplastics in the environment. The ecological risk index (H) is employed to gauge the hazard posed by microplastic polymers in the environment, particularly focusing on their toxicity to ecosystems. This index quantifies the collective toxic effects of various polymer types. Among China’s 31 provinces, Jilin, Hainan, Inner Mongolia, Heilongjiang, Gansu, Hunan, Jiangsu, Liaoning, and Anhui are identified with a Class II microplastic ecological risk, categorized as moderate according to Table S2 criteria. Despite this, proactive measures are recommended to mitigate the increasing risks associated with microplastics. Notably, the PLI in all provinces is below 10, suggesting that the overall microplastic concentration in these environments is relatively low.
4.3. Ecological Risk Assessment of Heavy Metals in the Environment
The results of the specific heavy metal ecological risk index (Eir) and the comprehensive ecological risk index (RI) for each province in China are shown in Figure 3 and Figure 4 and Table 3. The provinces with more serious comprehensive ecological risk of heavy metals are Hubei (1143.33) > Gansu (776.19) > Liaoning (752.76) > Guizhou (709.95) > Hunan (646.19).
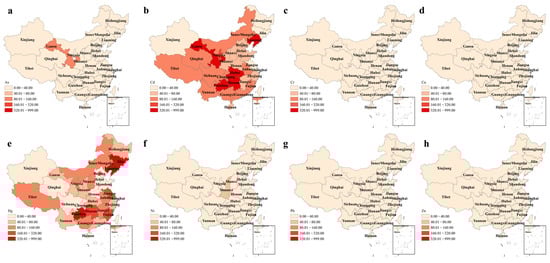
Figure 3.
Ecological risk assessment of specific heavy metal in provinces of China. (a) Ecological risk index of As; (b) ecological risk index of Cd; (c) ecological risk index of Cr; (d) ecological risk index of Cu; (e) ecological risk index of Hg; (f) ecological risk index of Ni; (g) ecological risk index of Pb; (h) ecological risk index of Zn.
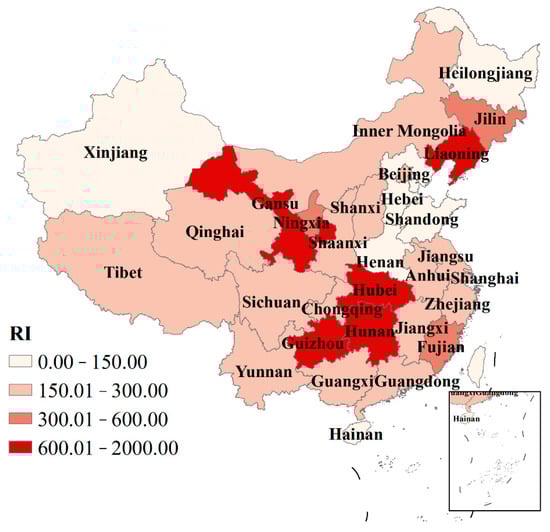
Figure 4.
Comprehensive ecological risk assessment of heavy metals in provinces of China.
Table 3.
The content of heavy metals in different provinces of China.
The specific heavy metal ecological risk index (Eir) and the comprehensive ecological risk index (RI) are used to analyze the degree of ecological pollution of the environment caused by the physicochemical properties of specific and comprehensive heavy metals, respectively. In 31 provinces of China, As, Cd and Hg are the main heavy metal pollutants, among which Cd and Hg are more serious. Hubei, Guansu, Liaoning, Guizhou and Hunan were recognized as serious comprehensive heavy metal pollution, and Jilin, Fujian and Ningxia were recognized as severe comprehensive heavy metal pollution, which indicates that heavy metal pollution has caused great impacts on the agro-environment in these provinces. Therefore, urgent measures need to be taken to prevent the pollution from increasing and to reduce the concentration of heavy metals in the environment.
4.4. Health Risk Assessment of Heavy Metals in the Environment
The results of the collective non-carcinogenic health risk index (HI) and the total carcinogenic risk for multiple heavy metals (TCR) for children and adults in each province of China are shown in Figure 5 and Table S9. In terms of non-carcinogenic risk, children in Gansu province exhibited the highest level (12.71), surpassing adults in all provinces. Conversely, for both children and adults, the pattern of individual carcinogenic risk was inverse to that of non-carcinogenic risk. Adults showed greater individual carcinogenic risk than children across all Chinese provinces, notably in Hubei (2.33 × 10⁻³) and Gansu (1.83 × 10⁻³). The comprehensive risk assessment revealed that children in all provinces face heightened non-carcinogenic and carcinogenic risks, whereas adults demonstrate elevated individual carcinogenic risk across all provinces. This underscores the considerable challenge of controlling heavy metal contamination in agriculture. The findings highlight the urgent need for implementing mitigation measures.
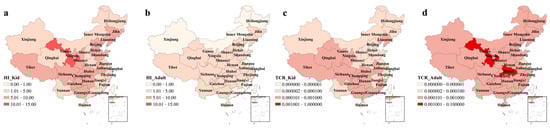
Figure 5.
Health risk assessment of heavy metals in various provinces of China. (a) Non-carcinogenic health risks for children; (b) non-carcinogenic health risks for adult; (c) carcinogenic health risks for children; (d) carcinogenic health risks for adult.
5. Discussion
The AGNPS pollution control technology can be succinctly described by the 3R principle of ‘source reduction, interception, and repair’ [87]. This technology has specific applicability and limitations, thus, selecting appropriate control methods based on distinct pollution sources and regional pollution levels is essential.
5.1. Mitigating Nitrogen and Phosphorus Pollution
In 31 provinces across China, levels of TN and TP are significantly elevated. To mitigate the risk of excessive nitrogen and phosphorus concentrations in aquatic environments, a comprehensive, multifaceted approach to treatment is essential. Consequently, this paper outlines control measures focusing on three primary pollution sources: the management of fertilizers, the handling of livestock waste, and the effective management of crop residues.
The treatment technologies for chemical fertilizers primarily encompass three approaches: soil fertilization, the application of broad-spectrum fertilizer synergists, and the use of organic fertilizers in crop cultivation [45]. (1) Soil fertilization: this strategy entails the strategic use of organic fertilizers, customized to meet the specific nutrient needs of crops, the nutrient supply capacity of the soil, and the efficiency of the fertilizer [88,89]. (2) Broad-spectrum fertilizer synergists: These synergists can be combined effectively with a range of fertilizers, including organic ones, farm manure, and traditional chemical fertilizers. Their usage markedly improves fertilizer efficiency and meets the diverse nutritional needs of crops across various growth stages [90,91]. (3) Organic fertilizers: these fertilizers are rich in beneficial microorganisms, when applied under optimal conditions, enable the proliferation and secretion of hormones, elements, and enzymes advantageous to crops [92].
The Clean Breeding Project is designed to prevent and control pollution from livestock and poultry breeding, primarily focusing on the treatment of manure and sewage. This initiative involves four applications of harmless livestock and poultry manure: as feed, fertilizer, fuel, and raw materials. Given the integration of end-of-pipe and source treatments, the application of modern technology for treating livestock and poultry wastewater merits consideration [45]. Currently, manure composting and biogas treatment are the predominant technologies. (1) Manure composting technology: this involves the microbial degradation of organic matter in solid manure under controlled conditions of moisture, carbon-nitrogen ratio, and aeration, resulting in mineralization, humification, and detoxification [93]. (2) Biogas treatment technology: Generating biogas from livestock manure is a viable resource utilization approach. In biogas digesters, organic matter from manure is anaerobically converted into renewable resources like biogas, biogas slurry, and biogas residue, thereby facilitating extensive utilization in the ecological chain [94].
The primary approach to managing crop straw involves its recycling and reuse, encompassing five key methods: transforming straw into fuel [95], fermenting straw for fertilizer production [96,97,98], processing straw into feed for livestock and poultry [99], converting straw into industrial raw materials, and utilizing it as a planting substrate [100]. These methods of recycling not only effectively mitigate the pollution caused by crop residues in their natural state, but also significantly contribute to the sustainable cycle of agricultural resources.
5.2. Control of Microplastic Pollution
The widespread production and utilization of agricultural plastic films have led to significant microplastic pollution, adversely affecting the sustainability and health of agricultural ecosystems due to the accumulation of used films and the proliferation of microplastics in soil and water bodies. To address the NPS pollution caused by agricultural plastic film, urgent reform and innovative solutions are required, focusing on reduction, substitution, and recycling strategies.
Reduction: The cultivation of various crops under different ecological conditions should be optimized based on the technical standards of film mulching and specific operational techniques. By considering factors such as land, light, water, and fertilizer, and through diverse plastic film applications, it is possible to enhance the efficient use of plastic films, mitigate their pollution impact, and adjust their usage standards appropriately.
Alternatives: Plastic mulch films are categorized into non-degradable and degradable types, with the development of the latter being actively pursued globally Currently, the more advanced technologies encompass biodegradable mulch films [101], photodegradable mulch films [102], paper mulch films [103], and liquid spray degradable mulch films [104].
Recycling: Waste agricultural film needs to be thoroughly recycled and reused. Polyethylene and polypropylene, the primary constituents of agricultural film, are valuable renewable resources. They can be transformed into recycled plastic particles and other products through specific processing methods [72]. There is a non-woven mulch film made of coarser chemical fiber that has the property of being easily recycled, which can reduce the difficulty of recycling [105]. In addition, there is a need for mandatory legislation and policy support through the government to ensure the effective recycling of plastic films.
5.3. Prevention and Control of Heavy Metal Pollution
Heavy metals commonly found in agriculture, such as As, Cd, Cr, Cu, Hg, Ni, Pb, Zn, pose significant environmental and health risks when present in high concentrations in water and soil. Consequently, our study emphasizes analyzing the sources of these elements and devising strategies for their mitigation. According to our relevant analyses (refer to Figure S1 for detailed information), As, Cd, Cu, Hg, Ni and Zn originate partially from pesticides, Pb partially from pesticides and plastic films, and Cr partially from pesticides and crop residues. The management of plastic films and crop residues has already been discussed, and the control of pesticide use, along with soil remediation strategies, will be examined subsequently.
Pesticide reduction is typically achieved through integrated pest management, encompassing phytochemical, biological, and physical control techniques. (1) Botanical insecticidal techniques: these involve the use of pesticides derived from secondary metabolites produced by plants, animals, and microorganisms, which are noted for their lower toxicity and enhanced safety for humans and the environment, compared to traditional chemically synthesized pesticides [106]. (2) Biological control technology: this approach employs natural predators to manage pests, where each pest typically has one or more natural enemies that can effectively inhibit their overpopulation [107,108]. (3) Physical control technology: this method includes the application of physical measures to control diseases and pests, such as solar frequency vibration insecticidal lamps and insect-prevention yellow plates, which are effective in eliminating larvae or adult pests [45].
Soil remediation entails the restoration of the environmental functions of soils contaminated by various pollutants through diverse technical approaches. In addressing heavy metal contamination in soils, the primary goal is to either reduce the concentration of these metals or diminish their bioavailability. (1) Chemical stabilization: This approach involves adding certain compounds (such as lime, phosphates, or silicates) to the soil, which react with heavy metals to form insoluble or barely soluble compounds. This process significantly reduces the mobility and bioavailability of the heavy metals [109,110]. (2) Phytoremediation: This employs specific plants, known as hyperaccumulators, for their capacity to absorb and accumulate heavy metals from the soil. These plants extract heavy metals from contaminated soils, and their subsequent harvesting and safe disposal effectively remove these metals from the environment [111]. (3) Microbial remediation: This method leverages the metabolic functions of certain microorganisms to degrade, convert, or stabilize heavy metals in the soil. These microorganisms, either naturally occurring or genetically engineered for enhanced efficiency, play a crucial role in mitigating soil heavy metal contamination [112,113].
6. Conclusions
AGNPS pollution has been an important source of environmental pollution. Due to the shortage of cultivated land and the lack of environmental protection measures, AGNPS pollutants carrying a large number of nitrogen, phosphorus, heavy metals, microplastics and other elements, which enter the soil and water bodies along with surface runoff and underground runoff, posing a serious threat to China’s environmental security.
Our review’s statistical analysis reveals that TN and TP pollution in the water bodies of various Chinese provinces is severe. Provinces including Jilin, Hainan, Inner Mongolia, Heilongjiang, Gansu, Hunan, Jiangsu, Liaoning, and Anhui exhibit elevated microplastic pollution. Furthermore, Hubei, Gansu, Liaoning, Guizhou, Hunan, Jilin, Fujian, and Ningxia face severe comprehensive heavy metal pollution, notably involving As, Cd and Hg, indicating significant impacts on the agricultural environment. Concurrently, this study has identified that in Gansu Province, children are exposed to a significantly elevated non-cancer risk attributed to heavy metal pollution, while adults in Hubei and Gansu Provinces face a markedly high risk of cancer.
In response to this challenge, we recommend various prevention and control measures for AGNPS pollution, tailored to specific pollutants including nitrogen and phosphorus, microplastics, and heavy metals. In regions with high TN and TP contamination, strategies include the judicious management of fertilizers, proper handling of livestock waste, and effective management of crop residues. In areas with elevated microplastic concentrations, reduction, substitution, and recycling strategies are advocated. For provinces facing significant heavy metal contamination, particularly with As, Cd and Hg, an integrated management approach is advised. This approach encompasses the management of crop residues and plastic film, stringent control of pesticide use, and comprehensive soil remediation strategies.
The implementation of these AGNPS pollution prevention and control measures, in conjunction with corresponding risk assessments, focuses on key aspects such as source reduction, pollution interception, and remediation. These strategies aim to reduce the discharge of various pollutants, ultimately fostering sustainable agricultural development, improving the aquatic environment, and mitigating the overall AGNPS pollution scenario.
Supplementary Materials
The following supporting information can be downloaded at: https://www.mdpi.com/article/10.3390/su16062515/s1. Figure S1 Heat map for heavy metal source analysis. Table S1 Chinese surface water environmental quality standards about TN, TP. Table S2 Risk classification of microplastics. Table S3 Risk classification of heavy metals. Table S4 Heavy metal health risk assessment exposure parameters. Table S5 Model parameters RfD and SF values. Table S6 Average abundance of microplastics and proportion of microplastic substances in water by province. Table S7 TN, TP, COD in water bodies by province. Table S8 Heavy metal content by province. Table S9 Individual carcinogenic risk index and non-carcinogenic risk index indices for adults and children, by province.
Author Contributions
Conceptualization, T.J. and F.W.; methodology, T.J.; software, T.J.; validation, M.W.; formal analysis, W.Z.; resources, C.Z.; data curation, T.J.; writing—original draft preparation, T.J.; writing—review and editing, F.W.; visualization, T.J.; supervision, C.Z.; project administration, C.Z.; funding acquisition, F.W. All authors have read and agreed to the published version of the manuscript.
Funding
This work was supported by the National Key Research and Development Porject of China (2018YFE011900), Natural Science Foundation of Zhejiang Province, China (Z24C130013), Fundamental Research Funds of China Jiliang University (2023YW15) and National Natural Science Foundation of China (No. 22108265).
Institutional Review Board Statement
Not applicable.
Informed Consent Statement
Not applicable.
Data Availability Statement
Data is contained within the article or Supplementary Materials.
Acknowledgments
In this study, we used GPT-4.0 (a natural language processing AI model) provided by OpenAI and the Write tool from DeepL to assist with text touch-ups. We thank these tools for supporting the research and recognize their contribution in completing the work described in this paper. GPT-4.0, provided by OpenAI, is an advanced language model trained on large-scale datasets for understanding and modifying natural language text. DeepL Write, provided by DeepL, is a powerful text translation and language processing tool known for its high quality translation and language processing capabilities.
Conflicts of Interest
The authors declare no conflicts of interest.
References
- Fleming, P.; Stephenson, K.; Collick, A.; Easton, Z. Targeting for nonpoint source pollution reduction: A synthesis of lessons learned, remaining challenges, and emerging opportunities. J. Environ. Manag. 2022, 308, 114649. [Google Scholar] [CrossRef] [PubMed]
- Su, F.; Kaplan, D.; Li, L.; Li, H.; Song, F.; Liu, H. Identifying and Classifying Pollution Hotspots to Guide Watershed Management in a Large Multiuse Watershed. Int. J. Environ. Res. Public Health 2017, 14, 260. [Google Scholar] [CrossRef]
- Huang, J.J.; Lin, X.; Wang, J.; Wang, H. The precipitation driven correlation based mapping method (PCM) for identifying the critical source areas of non-point source pollution. J. Hydrol. 2015, 524, 100–110. [Google Scholar] [CrossRef]
- Wang, J.; Wang, D.; Ni, J.; Xie, D. Simulation of the dissolved nitrogen and phosphorus loads in different land uses in the Three Gorges Reservoir Region—Based on the improved export coefficient model. Environ. Sci. Process. Impacts 2015, 17, 1976–1989. [Google Scholar] [CrossRef] [PubMed]
- Zhu, Q.; Sun, J.; Hua, G.; Wang, J.; Wang, H. Runoff characteristics and non-point source pollution analysis in the Taihu Lake Basin: A case study of the town of Xueyan, China. Environ. Sci. Process. Impacts 2015, 22, 15029–15036. [Google Scholar] [CrossRef]
- Damashek, J.; Westrich, J.R.; McDonald, J.M.B.; Teachey, M.E.; Jackson, C.R.; Frye, J.G.; Lipp, E.K.; Capps, K.A.; Ottesen, E.A. Non-point source fecal contamination from aging wastewater infrastructure is a primary driver of antibiotic resistance in surface waters. Water Res. 2022, 222, 118853. [Google Scholar] [CrossRef]
- Han, Q.; Tong, R.; Sun, W.; Zhao, Y.; Yu, J.; Wang, G.; Shrestha, S.; Jin, Y. Anthropogenic influences on the water quality of the Baiyangdian Lake in North China over the last decade. Sci. Total Environ. 2020, 701, 134929. [Google Scholar] [CrossRef]
- Wu, J.; Lu, J. Landscape patterns regulate non-point source nutrient pollution in an agricultural watershed. Sci. Total Environ. 2019, 669, 377–388. [Google Scholar] [CrossRef]
- Domangue, R.J.; Mortazavi, B. Nitrate reduction pathways in the presence of excess nitrogen in a shallow eutrophic estuary. Environ. Pollut. 2018, 238, 599–606. [Google Scholar] [CrossRef]
- Zeiger, S.J.; Hubbart, J.A. Measuring and modeling event-based environmental flows: An assessment of HEC-RAS 2D rain-on-grid simulations. J. Environ. Manag. 2021, 285, 112125. [Google Scholar] [CrossRef]
- Xu, B.; Niu, Y.; Zhang, Y.; Chen, Z.; Zhang, L. China’s agricultural non-point source pollution and green growth: Interaction and spatial spillover. Environ. Sci. Pollut. Res. 2022, 29, 60278–60288. [Google Scholar] [CrossRef]
- Luo, M.; Liu, X.; Legesse, N.; Liu, Y.; Wu, S.; Han, F.X.; Ma, Y. Evaluation of Agricultural Non-point Source Pollution: A Review. Water Air Soil Pollut. 2023, 234, 657. [Google Scholar] [CrossRef]
- Schoumans, O.; Chardon, W.; Bechmann, M.; Gascuel-Odoux, C.; Hofman, G.; Kronvang, B.; Rubæk, G.; Ulén, B.; Dorioz, J.-M. Mitigation options to reduce phosphorus losses from the agricultural sector and improve surface water quality: A review. Sci. Total Environ. 2014, 468, 1255–1266. [Google Scholar] [CrossRef]
- Dupas, R.; Delmas, M.; Dorioz, J.M.; Garnier, J.; Moatar, F.; Chantal, G.O. Assessing the impact of agricultural pressures on N and P loads and eutrophication risk. Ecol. Indic. 2015, 48, 396–407. [Google Scholar] [CrossRef]
- Li, X.; Zhang, W.; Zhao, C.; Li, H.; Shi, R. Nitrogen interception and fate in vegetated ditches using the isotope tracer method: A simulation study in northern China. Agric. Water Manag. 2020, 228, 105893. [Google Scholar] [CrossRef]
- Li, Z.; Zhang, R.; Liu, C.; Zhang, R.; Chen, F.; Liu, Y. Phosphorus spatial distribution and pollution risk assessment in agricultural soil around the Danjiangkou reservoir, China. Sci. Total Environ. 2020, 699, 134417. [Google Scholar] [CrossRef]
- Chia, R.W.; Lee, J.-Y.; Jang, J.; Kim, H.; Kwon, K.D. Soil health and microplastics: A review of the impacts of microplastic contamination on soil properties. J. Soils Sediments 2022, 22, 2690–2705. [Google Scholar] [CrossRef]
- Bhatt, P.; Pathak, V.M.; Bagheri, A.R.; Bilal, M. Microplastic contaminants in the aqueous environment, fate, toxicity consequences, and remediation strategies. Environ. Res. 2021, 200, 111762. [Google Scholar] [CrossRef] [PubMed]
- Liu, R.; Xu, F.; Zhang, P.; Yu, W.; Men, C. Identifying non-point source critical source areas based on multi-factors at a basin scale with SWAT. J. Hydrol. 2016, 533, 379–388. [Google Scholar] [CrossRef]
- Shen, W.; Zhang, L.; Li, S.; Zhuang, Y.; Liu, H.; Pan, J. A framework for evaluating county-level non-point source pollution: Joint use of monitoring and model assessment. Sci. Total Environ. 2020, 722, 137956. [Google Scholar] [CrossRef] [PubMed]
- Yang, F.; Xu, Z.; Zhu, Y.; He, C.; Wu, G.; Qiu, J.R.; Fu, Q.; Liu, Q. Evaluation of agricultural nonpoint source pollution potential risk over China with a Transformed-Agricultural Nonpoint Pollution Potential Index method. Environ. Technol. 2013, 34, 2951–2963. [Google Scholar] [CrossRef]
- Zuo, D.; Bi, Y.; Song, Y.; Xu, Z.; Wang, G.; Ma, G.; Abbaspour, K.C.; Yang, H. The response of non-point source pollution to land use change and risk assessment based on model simulation and grey water footprint theory in an agricultural river basin of Yangtze River, China. Ecol. Indic. 2023, 154, 110581. [Google Scholar] [CrossRef]
- Yuan, X.; Jun, Z. Water Resource Risk Assessment Based on Non-Point Source Pollution. Water 2021, 13, 1907. [Google Scholar] [CrossRef]
- Worldometers Countries in the World by Population. 2024. Available online: https://www.worldometers.info/world-population/population-by-country/ (accessed on 7 March 2024).
- Li, R.; Yu, L.; Chai, M.; Wu, H.; Zhu, X. The distribution, characteristics and ecological risks of microplastics in the mangroves of Southern China. Sci. Total Environ. 2019, 708, 135025. [Google Scholar] [CrossRef]
- Lithner, D.; Larsson, A.; Dave, G. Environmental and health hazard ranking and assessment of plastic polymers based on chemical composition. Sci. Total Environ. 2011, 409, 3309–3324. [Google Scholar] [CrossRef] [PubMed]
- Zhang, B.; Xu, D.; Wan, X.; Wu, Y.; Liu, X.; Gao, B. Comparative analysis of microplastic organization and pollution risk before and after thawing in an urban river in Beijing, China. Sci. Total Environ. 2022, 828, 154268. [Google Scholar] [CrossRef]
- Everaert, G.; Van Cauwenberghe, L.; De Rijcke, M.; Koelmans, A.A.; Mees, J.; Vandegehuchte, M.; Janssen, C.R. Risk assessment of microplastics in the ocean: Modelling approach and first conclusions. Environ. Pollut. 2018, 242, 1930–1938. [Google Scholar] [CrossRef]
- Zhang, J.; Peng, W.; Lin, M.; Liu, C.; Chen, S.; Wang, X.; Gui, H. Environmental geochemical baseline determination and pollution assessment of heavy metals in farmland soil of typical coal-based cities: A case study of Suzhou City in Anhui Province, China. Heliyon 2023, 9, e14841. [Google Scholar] [CrossRef] [PubMed]
- Wu, D.; Liu, H.; Wu, J.; Gao, X.; Nyasha, N.K.; Cai, G.; Zhang, W. Bi-Directional Pollution Characteristics and Ecological Health Risk Assessment of Heavy Metals in Soil and Crops in Wanjiang Economic Zone, Anhui Province, China. Int. J. Environ. Res. Public Health 2022, 19, 9669. [Google Scholar] [CrossRef]
- Li, X.; Shang, J. Spatial interaction effects on the relationship between agricultural economic and planting non-point source pollution in China. Environ. Sci. Pollut. Res. 2023, 30, 51607–51623. [Google Scholar] [CrossRef]
- Crocker, R.; Blake, W.H.; Hutchinson, T.H.; Comber, S. Spatial distribution of sediment phosphorus in a Ramsar wetland. Sci. Total Environ. 2021, 765, 142749. [Google Scholar] [CrossRef]
- Tudi, M.; Daniel Ruan, H.; Wang, L.; Lyu, J.; Sadler, R.; Connell, D.; Chu, C.; Phung, D.T. Agriculture development, pesticide application and its impact on the environment. Int. J. Environ. Res. Public Health 2021, 18, 1112. [Google Scholar] [CrossRef]
- Kanter, D.R.; Zhang, X.; Mauzerall, D.L. Reducing Nitrogen Pollution while Decreasing Farmers’ Costs and Increasing Fertilizer Industry Profits. J. Environ. Qual. 2015, 44, 325–335. [Google Scholar] [CrossRef]
- Yuan, M.; Fernandez, F.G.; Pittelkow, C.M.; Greer, K.D.; Schaefer, D. Tillage and Fertilizer Management Effects on Phosphorus Runoff from Minimal Slope Fields. J. Environ. Qual. 2018, 47, 462–470. [Google Scholar] [CrossRef] [PubMed]
- Chen, Y.F. Influence and Control Strategies of Agricultural Nonpoint Source Pollution on Water Quality(in Chinese). China Resour. Compr. Util. 2016, 34, 54–56. (In Chinese) [Google Scholar]
- NBSC (National Bureau of Statistics of China). China Statistical Yearbook 2022. Available online: https://www.stats.gov.cn/sj/ndsj/2022/indexch.htm (accessed on 12 March 2024).
- Souza, M.C.O.; Rocha, B.A.; Adeyemi, J.A.; Nadal, M.; Domingo, J.L.; Barbosa, F., Jr. Legacy and emerging pollutants in Latin America: A critical review of occurrence and levels in environmental and food samples. Sci. Total Environ. 2022, 848, 157774. [Google Scholar] [CrossRef] [PubMed]
- Dissanayaka, D.; Plaxton, W.C.; Lambers, H.; Siebers, M.; Marambe, B.; Wasaki, J. Molecular mechanisms underpinning phosphorus-use efficiency in rice. Plant Cell Environ. 2018, 41, 1483–1496. [Google Scholar] [CrossRef]
- Mona, S.; Malyan, S.K.; Saini, N.; Deepak, B.; Pugazhendhi, A.; Kumar, S.S. Towards sustainable agriculture with carbon sequestration, and greenhouse gas mitigation using algal biochar. Chemosphere 2021, 275, 129856. [Google Scholar] [CrossRef] [PubMed]
- Sarkar, S.; Mukherjee, A.; Duttagupta, S.; Bhanja, S.N.; Bhattacharya, A.; Chakraborty, S. Vulnerability of groundwater from elevated nitrate pollution across India: Insights from spatio-temporal patterns using large-scale monitoring data. J. Contam. Hydrol. 2021, 243, 103895. [Google Scholar] [CrossRef]
- Abian, J.; Durand, G.; Barcelo, D. Analysis of chlorotriazines and their degradation products in environmental samples by selecting various operating modes in thermospray HPLC/MS/MS. J. Agric. Food Chem. 1993, 41, 1264–1273. [Google Scholar] [CrossRef]
- Tcaciuc, A.P.; Borrelli, R.; Zaninetta, L.M.; Gschwend, P.M. Passive sampling of DDT, DDE and DDD in sediments: Accounting for degradation processes with reaction–diffusion modeling. Environ. Sci. Process. Impacts 2018, 20, 220–231. [Google Scholar] [CrossRef]
- Wu, L.; Chládková, B.; Lechtenfeld, O.J.; Lian, S.; Schindelka, J.; Herrmann, H.; Richnow, H.H. Characterizing chemical transformation of organophosphorus compounds by 13C and 2H stable isotope analysis. Sci. Total Environ. 2018, 615, 20–28. [Google Scholar] [CrossRef]
- Wang, R.; Wang, Q.; Dong, L.; Zhang, J. Cleaner agricultural production in drinking-water source areas for the control of non-point source pollution in China. J. Environ. Manag. 2021, 285, 112096. [Google Scholar] [CrossRef]
- Ongley, E.D.; Xiaolan, Z.; Tao, Y. Current status of agricultural and rural non-point source pollution assessment in China. Environ. Pollut. 2010, 158, 1159–1168. [Google Scholar] [CrossRef]
- Ward, M.H.; Jones, R.R.; Brender, J.D.; de Kok, T.M.; Weyer, P.J.; Nolan, B.T.; Villanueva, C.M.; van Breda, S.G. Drinking Water Nitrate and Human Health: An Updated Review. Int. J. Environ. Res. Public Health 2018, 15, 1557. [Google Scholar] [CrossRef]
- Yadav, I.C.; Devi, N.L.; Syed, J.H.; Cheng, Z.; Li, J.; Zhang, G.; Jones, K.C. Current status of persistent organic pesticides residues in air, water, and soil, and their possible effect on neighboring countries: A comprehensive review of India. Sci. Total Environ. 2015, 511, 123–137. [Google Scholar] [CrossRef]
- Stehle, S.; Bline, A.; Bub, S.; Petschick, L.L.; Wolfram, J.; Schulz, R. Aquatic pesticide exposure in the U.S. as a result of non-agricultural uses. Environ. Int. 2019, 133, 105234. [Google Scholar] [CrossRef] [PubMed]
- Bexfield, L.M.; Belitz, K.; Lindsey, B.D.; Toccalino, P.L.; Nowell, L.H. Pesticides and Pesticide Degradates in Groundwater Used for Public Supply across the United States: Occurrence and Human-Health Context. Environ. Sci. Technol. 2021, 55, 362–372. [Google Scholar] [CrossRef] [PubMed]
- Dias, L.A.; Gebler, L.; Niemeyer, J.C.; Itako, A.T. Destination of pesticide residues on biobeds: State of the art and future perspectives in Latin America. Chemosphere 2020, 248, 126038. [Google Scholar] [CrossRef] [PubMed]
- Kaushal, J.; Khatri, M.; Arya, S.K. A treatise on Organophosphate pesticide pollution: Current strategies and advancements in their environmental degradation and elimination. Ecotoxicol. Environ. Saf. 2021, 207, 111483. [Google Scholar] [CrossRef] [PubMed]
- Zhou, J.; Jia, R.; Brown, R.W.; Yang, Y.; Zeng, Z.; Jones, D.L.; Zang, H. The long-term uncertainty of biodegradable mulch film residues and associated microplastics pollution on plant-soil health. J. Hazard. Mater. 2023, 442, 130055. [Google Scholar] [CrossRef] [PubMed]
- Cao, J.; Gao, X.; Cheng, Z.; Song, X.; Cai, Y.; Siddique, K.H.M.; Zhao, X.; Li, C. The harm of residual plastic film and its accumulation driving factors in northwest China. Environ. Pollut. 2023, 318, 120910. [Google Scholar] [CrossRef] [PubMed]
- Steinmetz, Z.; Wollmann, C.; Schaefer, M.; Buchmann, C.; David, J.; Tröger, J.; Muñoz, K.; Frör, O.; Schaumann, G.E. Plastic mulching in agriculture. Trading short-term agronomic benefits for long-term soil degradation? Sci. Total Environ. 2016, 550, 690–705. [Google Scholar] [CrossRef] [PubMed]
- Gao, H.; Yan, C.; Liu, Q.; Ding, W.; Chen, B.; Li, Z. Effects of plastic mulching and plastic residue on agricultural production: A meta-analysis. Sci. Total Environ. 2019, 651, 484–492. [Google Scholar] [CrossRef] [PubMed]
- Liu, E.; He, W.; Yan, C. ‘White revolution’to ‘white pollution’—Agricultural plastic film mulch in China. Environ. Res. Lett. 2014, 9, 091001. [Google Scholar] [CrossRef]
- Zhang, Q.-Q.; Ma, Z.-R.; Cai, Y.-Y.; Li, H.-R.; Ying, G.-G. Agricultural Plastic Pollution in China: Generation of Plastic Debris and Emission of Phthalic Acid Esters from Agricultural Films. Environ. Sci. Technol. 2021, 55, 12459–12470. [Google Scholar] [CrossRef]
- Dong, H.G.; Liu, T.; Han, Z.Q.; Sun, Q.M.; Li, R. Determining time limits of continuous film mulching and examining residual effects on cotton yield and soil properties. J. Environ. Biol. 2015, 36, 677. [Google Scholar]
- Qi, Y.; Yang, X.; Pelaez, A.M.; Lwanga, E.H.; Beriot, N.; Gertsen, H.; Garbeva, P.; Geissen, V. Macro-and micro-plastics in soil-plant system: Effects of plastic mulch film residues on wheat (Triticum aestivum) growth. Sci. Total Environ. 2018, 645, 1048–1056. [Google Scholar] [CrossRef]
- Qi, Y.; Ossowicki, A.; Yang, X.; Lwanga, E.H.; Dini-Andreote, F.; Geissen, V.; Garbeva, P. Effects of plastic mulch film residues on wheat rhizosphere and soil properties. J. Hazard. Mater. 2020, 387, 121711. [Google Scholar] [CrossRef]
- He, L.; Ou, Z.; Fan, J.; Zeng, B.; Guan, W. Research on the non-point source pollution of microplastics. Front. Chem. 2022, 10, 956547. [Google Scholar] [CrossRef]
- Ng, E.L.; Huerta Lwanga, E.; Eldridge, S.M.; Johnston, P.; Hu, H.W.; Geissen, V.; Chen, D. An overview of microplastic and nanoplastic pollution in agroecosystems. Sci. Total Environ. 2018, 627, 1377–1388. [Google Scholar] [CrossRef]
- Xiao, S.; Cui, Y.; Brahney, J.; Mahowald, N.M.; Li, Q. Long-distance atmospheric transport of microplastic fibres influenced by their shapes. Nat. Geosci. 2023, 16, 863–870. [Google Scholar] [CrossRef]
- Rillig, M.C. Microplastic in Terrestrial Ecosystems and the Soil? ACS Publications: Washington, DC, USA, 2012; pp. 6453–6454. [Google Scholar]
- Horton, A.A.; Walton, A.; Spurgeon, D.J.; Lahive, E.; Svendsen, C. Microplastics in freshwater and terrestrial environments: Evaluating the current understanding to identify the knowledge gaps and future research priorities. Sci. Total Environ. 2017, 586, 127–141. [Google Scholar] [CrossRef] [PubMed]
- Hurley, R.R.; Nizzetto, L. Fate and occurrence of micro (nano) plastics in soils: Knowledge gaps and possible risks. Curr. Opin. Environ. Sci. Health 2018, 1, 6–11. [Google Scholar] [CrossRef]
- Liu, M.; Lu, S.; Song, Y.; Lei, L.; Hu, J.; Lv, W.; Zhou, W.; Cao, C.; Shi, H.; Yang, X. Microplastic and mesoplastic pollution in farmland soils in suburbs of Shanghai, China. Environ. Pollut. 2018, 242, 855–862. [Google Scholar] [CrossRef] [PubMed]
- Qi, R.; Jones, D.L.; Li, Z.; Liu, Q.; Yan, C. Behavior of microplastics and plastic film residues in the soil environment: A critical review. Sci. Total Environ. 2020, 703, 134722. [Google Scholar] [CrossRef] [PubMed]
- Davidson, K.; Dudas, S.E. Microplastic Ingestion by Wild and Cultured Manila Clams (Venerupis philippinarum) from Baynes Sound, British Columbia. Arch. Environ. Contam. Toxicol. 2016, 71, 147–156. [Google Scholar] [CrossRef] [PubMed]
- Kumar, M.; Xiong, X.; He, M.; Tsang, D.C.W.; Gupta, J.; Khan, E.; Harrad, S.; Hou, D.; Ok, Y.S.; Bolan, N.S. Microplastics as pollutants in agricultural soils. Environ. Pollut. 2020, 265, 114980. [Google Scholar] [CrossRef] [PubMed]
- Kotaiba, S.; Martin, G. Plastic Mulch Films in Agriculture: Their Use, Environmental Problems, Recycling and Alternatives. Environments 2023, 10, 179. [Google Scholar]
- Zhang, B.; Wang, Z.; Jin, S.Q. Current situation and prospect of agricultural film pollution treatment in China. World Environ. 2019, 6, 22–25. (In Chinese) [Google Scholar]
- Lares, M.; Ncibi, M.C.; Sillanpää, M.; Sillanpää, M. Occurrence, identification and removal of microplastic particles and fibers in conventional activated sludge process and advanced MBR technology. Water Res. 2018, 133, 236–246. [Google Scholar] [CrossRef]
- Kumar, M.V.; Sheela, A.M. Effect of plastic film mulching on the distribution of plastic residues in agricultural fields. Chemosphere 2021, 273, 128590. [Google Scholar] [CrossRef]
- Khan, M.B.; Urmy, S.Y.; Setu, S.; Kanta, A.H.; Gautam, S.; Eti, S.A.; Rahman, M.M.; Sultana, N.; Mahmud, S.; Baten, M.A. Abundance, distribution and composition of microplastics in sediment and fish species from an Urban River of Bangladesh. Sci. Total Environ. 2023, 885, 163876. [Google Scholar] [CrossRef]
- Zhang, X.; Gong, Z.; Allinson, G.; Xiao, M.; Li, X.; Jia, C.; Ni, Z. Environmental risks caused by livestock and poultry farms to the soils: Comparison of swine, chicken, and cattle farms. J. Environ. Manag. 2022, 317, 115320. [Google Scholar] [CrossRef]
- De Rosa, D.; Biala, J.; Nguyen, T.H.; Mitchell, E.; Friedl, J.; Scheer, C.; Grace, P.R.; Rowlings, D.W. Environmental and economic trade-offs of using composted or stockpiled manure as partial substitute for synthetic fertilizer. J. Environ. Qual. 2022, 51, 589–601. [Google Scholar] [CrossRef] [PubMed]
- Zhu, Z.; Zhang, X.; Dong, H.; Wang, S.; Reis, S.; Li, Y.; Gu, B. Integrated livestock sector nitrogen pollution abatement measures could generate net benefits for human and ecosystem health in China. Nat. Food 2022, 3, 161–168. [Google Scholar] [CrossRef] [PubMed]
- Xin, Z. Brief Analysis of Present Situation and Countermeasures of Agricultural Non-point Source Pollution Control in China. Chin. Agric. Sci. Bull. 2017, 33, 80–84. (In Chinese) [Google Scholar]
- Ruiz-Ruiz, T.M.; Morquecho, L.; Cruz-Garcia, L.M.; Torres, J.R.; Del Carmen Flores-Miranda, M.; Arreola-Lizarraga, J.A. Eutrophication assessment and environmental management perspectives of Tobari: An arid subtropical coastal lagoon of the Gulf of California. Environ. Monit. Assess. 2023, 195, 1049. [Google Scholar] [CrossRef] [PubMed]
- Delgado, M.I.; Mac Donagh, M.E.; Casco, M.A.; Tanjal, C.; Carol, E. Nutrient dynamics in water resources of productive flatland territories in the Pampean region of Argentina: Evaluation at a watershed scale. Environ. Monit. Assess. 2022, 195, 236. [Google Scholar] [CrossRef] [PubMed]
- Dhanda, S.; Yadav, A.; Yadav, D.B.; Chauhan, B.S. Emerging Issues and Potential Opportunities in the Rice-Wheat Cropping System of North-Western India. Front. Plant Sci. 2022, 13, 832683. [Google Scholar] [CrossRef] [PubMed]
- Xu, H.; Huang, Y.; Xiong, X.; Zhu, H.; Lin, J.; Shi, J.; Tang, C.; Xu, J. Changes in soil Cd contents and microbial communities following Cd-containing straw return. Environ. Pollut. 2023, 330, 121753. [Google Scholar] [CrossRef]
- Wang, Y.; Chen, Z.; Wu, Y.; Zhong, H. Comparison of methylmercury accumulation in wheat and rice grown in straw-amended paddy soil. Sci. Total Environ. 2019, 697, 134143. [Google Scholar] [CrossRef]
- Liu, Y.; Zhang, J.; Zhuang, M. Bottom-up re-estimations of greenhouse gas and atmospheric pollutants derived from straw burning of three cereal crops production in China based on a national questionnaire. Environ. Sci. Process. Impacts 2021, 28, 65410–65415. [Google Scholar] [CrossRef]
- Wu, Y.H.; Hu, Z.Y.; Yang, L.Z. Strategies for controlling agricultural non-point source pollution:reduce-retain-restoration (3R) theory and its practice. Trans. CSAE 2011, 27, 1–6. (In Chinese) [Google Scholar]
- Sheikhzeinoddin, A.; Esmaeili, A. Ecological and economic impacts of different irrigation and fertilization practices: Case study of a watershed in the southern Iran. Environ. Dev. Sustain. 2017, 19, 2499–2515. [Google Scholar] [CrossRef]
- Wu, Y.; Shi, X.; Li, C.; Zhao, S.; Pen, F.; Green, T.R. Simulation of hydrology and nutrient transport in the Hetao Irrigation District, Inner Mongolia, China. Water 2017, 9, 169. [Google Scholar] [CrossRef]
- Xiaodi, S.; Ruiguo, W.; Mengdie, Z.; Yuxiu, L.; Junjie, K.; Hongjian, S.; Jingjing, Z.; Qingmin, W. Promoting the utilization efficiency of agrochemicals via short-chain nonionic fluorinated synergist: Strategies and working mechanisms. Colloids Surf. A Physicochem. Eng. Asp. 2022, 653, 129989. [Google Scholar]
- Wang, J.; Sha, Z.; Zhang, J.; Qin, W.; Xu, W.; Goulding, K.; Liu, X. Improving nitrogen fertilizer use efficiency and minimizing losses and global warming potential by optimizing applications and using nitrogen synergists in a maize-wheat rotation. Agric. Ecosyst. Environ. 2023, 353, 108538. [Google Scholar] [CrossRef]
- Xie, S.; Feng, H.; Yang, F.; Zhao, Z.; Hu, X.; Wei, C.; Liang, T.; Li, H.; Geng, Y. Does dual reduction in chemical fertilizer and pesticides improve nutrient loss and tea yield and quality: A pilot study in a green tea garden in Shaoxing, Zhejiang Province, China. Environ. Sci. Process. Impacts 2019, 26, 2464–2476. [Google Scholar] [CrossRef]
- Qian, X.; Wang, Z.; Zhang, H.; Gu, H.; Shen, G. Occurrence of veterinary antibiotics in animal manure, compost, and agricultural soil, originating from different feedlots in suburbs of Shanghai, East China. Environ. Monit. Assess. 2022, 194, 379. [Google Scholar] [CrossRef] [PubMed]
- Wang, M.; Jiang, T.; Mao, Y.; Wang, F.; Yu, J.; Zhu, C. Current Situation of Agricultural Non-Point Source Pollution and Its Control. Water Air Soil Pollut. 2023, 234, 471. [Google Scholar] [CrossRef]
- Fang, Y.R.; Zhang, S.; Zhou, Z.; Shi, W.; Xie, G.H. Sustainable development in China: Valuation of bioenergy potential and CO2 reduction from crop straw. Appl. Energy 2022, 322, 119439. [Google Scholar] [CrossRef]
- Song, K.; Sun, L.; Lv, W.; Zheng, X.; Sun, Y.; Terzaghi, W.; Qin, Q.; Xue, Y. Earthworms accelerate rice straw decomposition and maintenance of soil organic carbon dynamics in rice agroecosystems. PeerJ 2020, 8, e9870. [Google Scholar] [CrossRef]
- Zhang, W.; Yang, S.; Sun, D.; Jin, Y.; Lou, S.; Liu, P. Effects of Straw Mulching and Nitrogen Reduction on the Distribution of Soil Nitrogen and Groundwater Nitrogen Pollution. Environ. Sci. 2021, 42, 786–795. (In Chinese) [Google Scholar]
- Zhang, Z.; Liu, D.; Wu, M.; Xia, Y.; Zhang, F.; Fan, X. Long-term straw returning improve soil K balance and potassium supplying ability under rice and wheat cultivation. Sci. Rep. 2021, 11, 22260. [Google Scholar] [CrossRef] [PubMed]
- Ma, Y.L.; Chen, X.; Muhammad, Z.K.; Xiao, J.X.; Liu, S.; Wang, J.J.; He, Z.Y.; Li, C.C.; Cao, Z.J. The Impact of Ammoniation Treatment on the Chemical Composition and In Vitro Digestibility of Rice Straw in Chinese Holsteins. Animals 2020, 10, 1854. [Google Scholar] [CrossRef]
- Sheng, C.; Wang, Y.; Pan, C.; Shi, L.; Wang, Y.; Ma, Y.; Wang, J.; Zhao, J.; Zhang, P.; Liu, Z.; et al. Evaluation of Rice Straw, Corncob, and Soybean Straw as Substrates for the Cultivation of Lepista sordida. Life 2024, 14, 101. [Google Scholar] [CrossRef]
- Huang, F.; Zhang, Q.; Wang, L.; Zhang, C.; Zhang, Y. Are biodegradable mulch films a sustainable solution to microplastic mulch film pollution? A biogeochemical perspective. J. Hazard. Mater. 2023, 459, 132024. [Google Scholar] [CrossRef]
- Kasirajan, S.; Ngouajio, M. Polyethylene and biodegradable mulches for agricultural applications: A review. Agron. Sustain. Dev. 2012, 32, 501–529. [Google Scholar] [CrossRef]
- Li, A.; Kang, Q.; Ren, S.; Zhang, Y.; Zhang, F.; He, Q. Preparation of superhydrophobic composite paper mulching film. Arab. J. Chem. 2021, 14, 103247. [Google Scholar] [CrossRef]
- Tian, Y.Y.; Qiao, Y.Y.; Huang, W.; Liu, F.; Gong, Z.J. The White Pollution vs. Humic Acid Multi-function Degradable Black Liquid Mulching Film. Humic Acid 2006, 2, 19–23. [Google Scholar]
- Lu, J.N.; Wang, C.Y.; Yi, Y.J. The Development Status of Agricultural Plastics Mulching Film and Progress on Degradable Mulching Films. Plant Fiber Sci. China 2007, 3, 150–157. (In Chinese) [Google Scholar]
- Fernández-Grandon, G.M.; Harte, S.J.; Ewany, J.; Bray, D.; Stevenson, P.C. Additive Effect of Botanical Insecticide and Entomopathogenic Fungi on Pest Mortality and the Behavioral Response of Its Natural Enemy. Plants 2020, 9, 173. [Google Scholar] [CrossRef]
- Topalova, Y.; Dimkov, R.; Kozuharov, D.; Van Keer, C. The role of the Biological Control in the Creation of Bioremediation Technologies. Biotechnol. Biotechnol. Equip. 2009, 23 (Suppl. S1), 145–153. [Google Scholar] [CrossRef][Green Version]
- Gossen, B.D.; McDonald, M.R. New technologies could enhance natural biological control and disease management and reduce reliance on synthetic pesticides. Can. J. Plant Pathol. 2020, 42, 30–40. [Google Scholar] [CrossRef]
- Liu, L.; Li, W.; Song, W.; Guo, M. Remediation techniques for heavy metal-contaminated soils: Principles and applicability. Sci. Total Environ. 2018, 633, 206–219. [Google Scholar] [CrossRef] [PubMed]
- Xu, D.M.; Fu, R.B.; Wang, J.X.; Shi, Y.X.; Guo, X.P. Chemical stabilization remediation for heavy metals in contaminated soils on the latest decade: Available stabilizing materials and associated evaluation methods—A critical review. J. Clean. Prod. 2021, 321, 128730. [Google Scholar] [CrossRef]
- Song, P.; Xu, D.; Yue, J.; Ma, Y.; Dong, S.; Feng, J. Recent advances in soil remediation technology for heavy metal contaminated sites: A critical review. Sci. Total Environ. 2022, 838, 156417. [Google Scholar] [CrossRef] [PubMed]
- Guo, S.; Xiao, C.; Zhou, N.; Chi, R. Speciation, toxicity, microbial remediation and phytoremediation of soil chromium contamination. Environ. Chem. Lett. 2020, 19, 1413–1431. [Google Scholar] [CrossRef]
- Deng, Y.; Fu, S.; Xu, M.; Liu, H.; Jiang, L.; Liu, X.; Jiang, H. Purification and water resource circulation utilization of Cd-containing wastewater during microbial remediation of Cd-polluted soil. Environ. Res. 2023, 219, 115036. [Google Scholar] [CrossRef] [PubMed]


Disclaimer/Publisher’s Note: The statements, opinions and data contained in all publications are solely those of the individual author(s) and contributor(s) and not of MDPI and/or the editor(s). MDPI and/or the editor(s) disclaim responsibility for any injury to people or property resulting from any ideas, methods, instructions or products referred to in the content. |
© 2024 by the authors. Licensee MDPI, Basel, Switzerland. This article is an open access article distributed under the terms and conditions of the Creative Commons Attribution (CC BY) license (https://creativecommons.org/licenses/by/4.0/).