Article

Optimizing Biochar Application Rates to Improve Soil Properties and Crop Growth in Saline–Alkali Soil

1
School of Agriculture and Biology, Shanghai Jiao Tong University, 800 Dongchuan Rd., Shanghai 200240, China
2
Shanghai Yangtze River Delta Eco-Environmental Change and Management Observation and Research Station, The Ministry of Science and Technology, The Ministry of Education, 800 Dongchuan Rd., Shanghai 200240, China
3
Shanghai Urban Forest Ecosystem Research Station, The National Forestry and Grassland Administration, 800 Dongchuan Rd., Shanghai 200240, China
*
Authors to whom correspondence should be addressed.
Sustainability 2024, 16(6), 2523; https://doi.org/10.3390/su16062523
Submission received: 30 January 2024 / Revised: 10 March 2024 / Accepted: 15 March 2024 / Published: 19 March 2024
(This article belongs to the Section Environmental Sustainability and Applications)

Abstract

:
There is great demand for the amelioration of saline–alkali soils, which requires efficient and economical amendments. Biochar addition could alleviate the adverse impacts of saline–alkali stress in crops. However, their efficiency and optimal amounts in saline–alkali soil restoration remain contradictory and inconclusive. The objective of this study was to investigate the effects of biochar application on the properties of saline–alkali soil and crop growth, as well as to determine the optimal application rate of biochar. We conducted pot experiments with biochar (B) application rates, including 0 (CK), 1% (B-1%), 2.5% (B-2.5%), 5% (B-5%), and 10% (B-10%), studying the impact of biochar on soil water content (SWC), soil salinity, soil electrical conductivity (EC), soil ion content, soil nutrients, soil enzyme activity, and crop growth. A four-parameter Gaussian function was established for the curves depicting the relationship between soil salinity characteristics and the biochar application rates to determine the most optimal application rate. The results indicated that: (1) Compared to the CK, all biochar treatments improved soil water-holding capacity and reduced soil Na+ content and sodium adsorption ratio (SAR). (2) B-1%, B-2.5%, and B-5% treatments reduced soil content, EC, Cl, and SO42− content over CK, while the results were reversed for the B-10% treatment. (3) Compared to the CK, all biochar treatments significantly increased soil fertility, enhanced soil enzyme activity (alkaline phosphatase, catalase, and urease activity), and significantly promoted the growth of maize. (4) The results of the Gaussian model suggested that a biochar application rate of 3.16% is the optimal rate for alleviating soil salinity in saline–alkali soils. This research demonstrated the potential of biochar to improve soil properties and promote crop growth and provided useful information on biochar application rates for ameliorating saline–alkali soils.

1. Introduction

Saline–alkali soil has become one of the major limiting factors that hamper agricultural production globally [1]. Saline–alkali soils commonly manifest attributes such as elevated salinity, limited water permeability, insufficient aeration, and nutrient scarcity [2], which result in the decline of crop quality and productivity [3]. According to statistics, saline–alkali soil is present in more than 100 countries and roughly 10.3 × 10⁸ ha of land is suffering from soil salinization [4]. Therefore, there is great demand for the amelioration of saline–alkali soils [5], which especially require efficient and economical amendments. For a long time, people have been committed to using different methods to restore soils affected by salt. These methods can be broadly classified into four categories: physical measures, chemical measures, biological measures, and combined measures [4]. Nevertheless, traditional measures associated with these efforts are plagued by drawbacks such as elevated costs, diminished efficiency, and a substantial carbon footprint, particularly within the context of climate change [6].
Biochar is a loosely structured and highly aromatic carbonaceous material formed by pyrolysis of various biomass under anaerobic or low oxygen conditions at relatively low temperatures (<700 °C) [7]. Upon incorporation into the soil, biochar has demonstrated commendable efficacy in increasing soil fertility [8], improving soil structure and water retention [9], and enhancing microbial and soil enzyme activities [10]. Furthermore, biochar has been shown to promote plant growth through various direct and indirect mechanisms, such as facilitating nutrient absorption [11], altering plant hormone levels [12], increasing antioxidant enzyme activity [10], and enhancing the K/Na ratio in plants [13], resulting in a significant increase in crop yield [14]. These characteristics indicate the potential of biochar as a valuable soil amendment.
An increasing amount of research indicates that adding biochar to saline–alkali soil improves the physical, chemical, and biological characteristics of the soil [15,16,17]. He et al. reported that the application of biochar made from mixed materials such as pine led to a decrease in soil pH of 10.6–11.3%, a reduction in soil bulk density of 4.7–5.7%, and a substantial decrease in the soil’s total salt content of 51.4–57.2% [18]. After applying woodchip biochar to saline–alkali soil, the soil’s electrical conductivity (EC), exchangeable sodium percentage (ESP), and sodium adsorption ratio (SAR) decreased by 79.5%, 92.0%, and 90.5%, respectively [19]. These research results indicate that biochar has great potential to improve the health of saline–alkali soils by alleviating salt stress. However, it was reported that the application of biochar increased soil EC, and the value of EC increased with the increase in biochar application rate [16,20]. These research findings suggest that biochar holds great potential in improving the health of saline–alkali soils by alleviating salt stress.
The extent of improvement of saline–alkali soil by biochar depends on many factors, among which the application rate of biochar is one of the most important [21,22]. For instance, Yue et al. applied sewage sludge biochar to the soil at various rates (0%, 1%, 5%, 10%, 20%, and 50%, w/w), finding that the improvement in the soil’s physicochemical properties and promotion of plant growth increased with the biochar application rate [23]. Sun et al. demonstrated that the application of 0.5%, 1%, 2%, and 5% biochar can improve water infiltration capacity, resulting in an increase in cumulative infiltration by 6.6%, 5.2%, 4.7%, and 1.5%, respectively. However, when the proportion of biochar added reaches 10%, cumulative infiltration significantly decreases by 10.5% [24]. Yuan et al. observed that applying biochar at a relatively low rate (<1% w/w) was more effective in reducing EC than applying biochar at a higher rate (>1% w/w) [4]. However, Chaganti et al. reported that even at a high rate of biochar application (5% w/w), soil EC can still be effectively reduced [19]. When applying larger rates of biochar to soil, the positive outcomes of biochar application are typically higher [25]. However, the increase in biochar application also means an increase in planting costs [26]. Therefore, it is of great significance to determine the optimal biochar application rate by considering the benefits and costs.
In this study, the improvement of saline–alkali soil by biochar from maize straw with different application rates was validated on maize grown in pots containing saline–alkali soil from the Hetao Plain, China. A four-parameter Gaussian function was fitted to the curves depicting the relationship between soil salinity characteristics and the biochar application rates to determine the optimal application rate. The purpose of this study is: (1) to explore the effects of different biochar application rates on the properties and salinity of saline–alkali soil; (2) to study the effects of biochar treatment on soil enzyme activity, soil fertility, and crop growth; (3) to find the best application rate of biochar needed to improve the properties of saline–alkali soil. This study can provide theoretical guidance for the application of biochar for the improvement of saline–alkali soils.

2. Materials and Methods

2.1. Materials

Saline–alkali soil samples were collected from Hetao Plain located in Bayannur City, Inner Mongolia Autonomous Region, China. The soil samples were taken at random from the topsoil (0–20 cm), dried in the air, passed through a 2 mm sieve, and homogenized completely. Based on particle size analysis [27], the soil was classified as sandy loam soil (Table S1 of Supplementary Material (SM)). The predominant component in the saline–alkali soil is quartz, with minor amounts of muscovite, franklinite, and calcite (Figure S1 of SM). Inner Mongolia has abundant maize straw resources [28], and based on pre-experimental results from the use of biochar derived from different biomass sources (Figure S1 and Table S2 of SM), maize straw biochar was chosen as the biochar for this study. Biochar was derived from maize straw and obtained by pyrolysis in a pilot carbonization furnace located in Inner Mongolia under sealed conditions at 350 °C for 30 min. The physicochemical properties and nutrient content of biochar and soil are shown in Table 1.

2.2. Pot Experimental Design

The pot experiment consisted of five different treatments based on varying rates of biochar application. The selection of biochar application rates integrates the range proposed by Sun (0.5, 1, 2, 5, and 10%, w/w) [24] and the range suggested by Bhaduri (2.5, 5, and 10%, w/w) [29], ensuring that this study can observe changes in soil properties and crop growth under different biochar application rates. The biochar was added into saline–alkali soils at different rates of 0%, 1%, 2.5%, 5%, and 10% (biochar weight/soil weight), denoted henceforth as CK, B-1%, B-2.5%, B-5%, and B-10%, respectively. To ensure sufficient growth space for maize roots, pots with a height of 13 cm and a diameter of 11 cm were selected, and each filled with 1000 g of soil or soil–biochar mixture. In each pot, ten maize seeds (Zea mays L.) were sown. For each treatment, three replicates were established. To eliminate the influence of external environmental factors on the experimental results, all treatments were randomly placed in a climate-controlled environment (room temperature (25 °C), light for 16 h, and 70–80% humidity), and consistent water management was maintained throughout the entire cultivation period. The emergence rate of maize seeds was recorded 7 days after sowing and 18 days after sowing, soil samples and maize plants were collected for analysis. Three maize plants with consistent growth were selected from each pot for measurement, including plant height, root length, and fresh and dry weights of shoot and root components. The plant heights and root lengths of the maize were measured using a ruler, where plant height was defined as the distance from the soil surface to the highest leaf tip. The fresh weights of shoots and roots were measured directly using an analytical balance. The shoots and roots were dried at 105 °C for 30 min and then at 60 °C to a constant weight. After cooling, the dry weight was measured using an analytical balance [30]. The schematic diagram of the pot experiment is shown in Figure 1.

2.3. Soil Property Measurements

Soil pH was determined in a 1:5 (w/v) soil:water slurry using a pH meter (PHS-3E, LEI-CI). EC was assessed in a soil:water slurry at a ratio of 1:5 (w/v) using a conductivity meter (DDS-307A, LEI-CI). The soil water content (SWC) was calculated by comparing the difference in the quality of the soil sample before and after drying in a 105 °C oven for 24 h [31]. The salt content was measured by weighing [32]. Soil organic carbon (SOC) was analyzed using the dichromate oxidation and titration method [33]. Soil-soluble salts were determined using the method of Lu [32]. The concentration of soil cations (including Na+, Mg2+, Ca2+, and K+) was measured using an inductively coupled plasma emission spectrometer (ICP) (AVIO 200). The concentrations of HCO3 and CO32− were determined using a dual indicator neutralization titration method [32]. The concentrations of Cl and SO42− were measured using an ion chromatograph (Compact IC plus 882). The sodium adsorption rate (SAR) was calculated using the following equation [34]:
SAR = Na + / 1 / 2 Ca 2 + + Mg 2 +
For soil nutrient content, total nitrogen (TN) was analyzed using the Kjeldahl method, total potassium (TK) was determined using the NaOH melting method [32], and total phosphorus (TP) was digested in an H2SO4–HClO4 solution at 250 °C and assessed using the molybdenum blue colorimetric method [35]. For the soil’s available nutrients, available nitrogen (AN) was extracted using the micro-diffusion technique after alkali hydrolysis [32]. Available phosphorus (AP) was extracted using the NaHCO3 method, and its concentration was tested at a wavelength of 700 nm using a UV-visible spectrophotometer (UV-8000 T) [36]. Available potassium (AK) was extracted using a neutral ammonium acetate solution (NH4OAc-K) and estimated using flame photometry [37].
The enzymatic activities of catalase (CAT), urease (UE), and alkaline phosphatase (ALP) were evaluated using enzyme kits procured from Suzhou Comin Biotechnology Co., Ltd. (Suzhou, China).

2.4. Calculations

The relationship between soil salt properties (salt content, EC, Cl content, and SO42− content) and the rate of biochar applied was fitted using a four-parameter Gaussian function. The Gaussian equation can be expressed as:
Y = m + n e 0.5 × B μ β 2
where Y represents the response variable (salt content, EC, Cl content, SO42− content); B represents the biochar application rate, %; μ, m, n, and β represent empirical coefficients. When B = μ, the maximum response variable (Y) can be obtained as m + n; therefore, μ represents the optimal biochar application rate, %.

2.5. Statistical Analysis

Statistical analysis for significance was carried out using one-way ANOVA (Duncan’s test, p < 0.05). Pearson correlation analysis was employed to examine the correlations between crop growth parameters, enzyme activities, and soil properties. Data analyses were executed using SPSS 19.0 software, while graphical representations were generated using GraphPad Prism 9.5.0 and Origin 9.1.0 software.

3. Results and Discussion

3.1. Effects of Biochar Application on Soil Properties and Nutrients

3.1.1. Effects of Biochar Application on SWC, pH, and SOC

SWC was significantly increased by biochar addition (p < 0.05, Figure 2a). The enhancement effect ranking is as follows: B-10% > B-5% > B-2.5% > B-1%. The rise in SWC suggested that biochar facilitated soil water retention. The potential reasons for biochar’s enhancement of soil water retention capacity can be attributed to two main factors. Firstly, biochar possesses abundant pores and a higher specific surface area (Table 1), which can provide more water storage space within and between pores in the soil. Secondly, On the other hand, biochar contains hydrophilic oxygen-containing functional groups (Figure S2 of SM) that can form hydrogen bonds with water molecules to further enhance soil water retention. The effectiveness of biochar at soil water retention varied depending on the type and application rate of biochar. Results from the study by Yuan et al. indicated that biochar derived from straw exhibited higher performance at increasing SWC (20.9%), with the maximum efficiency being observed when biochar was applied at the highest rate (5% or 40 tons/hectare), resulting in a 37.8% increase in SWC [4]. This is consistent with our experimental results, where the highest biochar application rate (B-10% treatment) resulted in a 41.1% increase in SWC compared to the control treatment.
As shown in Figure 2b, the addition of biochar had no significant impact on soil pH, a trend consistent with findings in previous studies [19,38]. Several potential reasons may account for this observation: (1) Saline–alkali soils often possess high buffering capacity [39]; (2) Biochar typically exhibits alkaline pH values [40], and its ameliorative effect on saline soil is comparable to its inherent alkaline properties; (3) The short duration of soil improvement may not have allowed sufficient interaction between biochar and the soil microenvironment, preventing the formation of abundant organic acids capable of neutralizing the alkalinity of saline soils [41]. A comprehensive understanding of these specific reasons would require long-term targeted experiments for identification and validation.
SOC significantly increased with biochar application (Figure 2c). As a sustainable carbon-negative tool, biochar with high carbon content (70–80%) and strong stability can directly increase SOC [42,43]. Therefore, the higher the application rate of biochar, the more significant the enhancement effect on SOC. This is consistent with the findings of our study, where an increase in the application rate of biochar resulted in a greater proportionate increase in SOC. Additionally, different biochar materials exhibited variations in their effectiveness in enhancing SOC, biochar derived from maize straw showed the most significant increase in SOC, with a relative enhancement of 61.9% compared to the control [38].

3.1.2. Effects of Biochar Application on Soil Salt

The increase in SWC and SOC contributed to the improvement of the physical structure of saline–alkali soil, thereby influencing key soil chemical properties susceptible to variations in the quantity and types of salts such as EC and SAR [44,45]. Therefore, following an in-depth investigation into the effects of different biochar rates on soil physicochemical properties, we transitioned to examining the impact of these rates on soil salt. Soil water-soluble salt is a critical characteristic of saline–alkali soils and a limiting factor for crop growth. In this study, treatments B-1%, B-2.5%, and B-5% reduced soil salt content, with the value of the B-2.5% treatment being significantly lower than those of other treatments (p < 0.05), while the B-10% treatment increased soil salt content (Figure 3a). Since various salts generally exist in ionic form in the soil, the salt content is positively correlated with EC. Therefore, soil leachate EC can also reflect the level of soil salinity, further confirming the effect of biochar on soil salinity. Similar to the trend of salt content, the B-2.5% treatment significantly reduced soil EC, showing a 17.76% decrease compared to CK (Figure 3b). It can be observed that within a certain application range, biochar has the potential to reduce the salt content and EC in the soil. However, beyond this range, biochar tends to increase soil salt content and EC. Previous studies have shown that biochar improves soil porosity and hydraulic conductivity, accelerates the leaching of soluble salts, and reduces soil EC [24,46]. However, the ash content in biochar contains carbonate and silica components of alkali and alkali earth metals [47], and the application of biochar to soil may lead to an increase in soil EC [48]. Therefore, the impact of biochar on soil EC is uncertain, and its practical application may need to be determined based on specific conditions [21]. When the ameliorative effect of biochar on saline–alkali soil surpassed its salt accumulation effect, soil salt content and EC decreased. Conversely, when the salt accumulation effect of biochar itself outweighed its ameliorative effect on saline–alkali soil, the results were the opposite.
The analysis of eight soil salt ions reveals that Na+ predominates as the principal alkaline cation in the examined saline–alkali soil, with Mg2+ following suit (Table 2). Anions in saline–alkali soils mainly exist in the form of SO42− and Cl, with lower HCO3 content and almost undetectable CO32−. These results suggested that, in the saline–alkali soils of the Hetao Plain, the main chemical substances causing soil salinization are Na2SO4 and NaCl. After adding biochar, the content of Na+ and Mg2+ in the soil decreased. Chaganti et al. also observed similar results, finding that mean cumulative leachate losses of Na+ and Mg2+ for biochar treatment were significantly higher (p < 0.01) than control, indicating that biochar addition can promote the leaching of Na+ and Mg2+ from the soil, thereby alleviating soil salt stress [19]. The content of Cl and SO42− in the soil decreases initially and then increases with the increase in the application rate of biochar. This indicates that an appropriate rate of biochar can reduce the content of Cl and SO42−. However, when the rate of biochar exceeded this optimal level, the ion concentrations tended to increase. Similar conclusions have been presented in previous literature [49]. However, the K+ concentration in soil increased significantly with the application of biochar (p < 0.05), and the magnitude of the increase became more pronounced with higher levels of biochar application. Compared with CK, B-1%, B-2.5%, B-5%, and B-10% increased the K+ concentration by 1.43, 2.87, 6.97, and 12.10 times, respectively. The divergent trend observed, with a decline in Na+ content and a concurrent increase in K+ content in soils treated with biochar, can be ascribed to the inherent content disparities between biochar and the soil (Table S1 of SM), a phenomenon observed in other studies as well [50,51].
SAR refers to the square root ratio of the average concentrations of Na+ to Ca2+ and Mg2+ in the soil solution. It is used to reflect the neutralizing effect of the presence of Ca2+ and Mg2+ on the alkalinization of exchangeable Na+ in the soil [34]. In this study, the application of biochar reduced the SAR values of the soil (Figure 3c). Due to the relatively high BET-specific surface area of the maize straw biochar (Table 1), it was hypothesized that the reduction in Na+ and SAR was attributed to the biochar’s ability to adsorb excess Na+ through electrostatic attraction and pore filling, which was consistent with previous studies [52]. Additionally, the increase in soil porosity caused by the biochar enhanced the leaching of Na+ from the soil profile, resulting in a decrease in SAR [46,53]. Overall, the effect of biochar addition on reducing soil salinity initially increased with the increase in application rate but then decreased. Salinity gradually decreased with biochar additions ranging from 0 to 2.5%. After adding 5%, the salinity decreased compared to the CK but increased relative to the addition of the 2.5% treatment.

3.1.3. Effects of Biochar Application on Soil N, P, and K

Saline–alkali soil is generally low in N, P, and K due to many reasons, including low input of organic matter from plant biomass [54] and high loss of organic matter [55]. Biochar significantly influenced the levels of N, P, and K in saline–alkali soils (Figure 4a–f). Biochar markedly increased the TN content in the soil (p < 0.05), rising from 0.57 g/kg in the CK treatment to 1.66 g/kg in the B-10% treatment. Previous literature has reported similar findings: the application of biochar significantly increased the soil TN content in heavily saline–alkali rice fields, with these enhancements directly correlating with the amount of biochar added [56]. However, biochar significantly reduced the content of AN in saline–alkali soil, with the trend being CK > B-1% > B-5% > B-10% > B-2.5% treatment. Based on previous research, the reduction in AN content may be attributed to the high biochar C/N (N immobilization) [57]. The maize straw biochar used in this study has a high C/N ratio (Table 1), which is influenced by lignin, cellulose, and hemicellulose contents of biomass [58]. However, further research is needed to investigate how biochar from different biomass impacts soil properties.
As shown in Figure 4b,e, the application of biochar increased the levels of TP and AP in saline–alkali soils. The content of TP and AP increased with the increase in biochar application, and the differences between biochar-treated and CK-treated soils were statistically significant (p < 0.05). This can be attributed to the higher content of TP and AP in the biochar (Table 1). This is consistent with previous research results, where the application of biochar in saline–alkali soil increased AP by more than double [59]. The reasons behind this phenomenon are as follows: (1) Biochar is rich in phosphorus and can serve as a direct source of phosphorus [44]; (2) Biochar indirectly enhances the conditions favorable for improving the effectiveness of phosphorus in the growth medium (especially SOC) in saline-affected soils [59]; (3) Biochar can increase the relative abundance and distribution of phosphorus-solubilizing bacteria in the soil, accelerating the conversion of organic phosphorus to inorganic phosphorus [60,61]. Additionally, the application of biochar significantly increased the activity of ALP, ALP can enhance soil phosphorus availability, increasing the content of AP in the soil [61], more mechanisms have been discussed in the Section 3.2.
Notably, the impact of adding biochar is more pronounced on K content compared to its effects on N and P contents. Additionally, the application of biochar resulted in a significantly greater increase in AK compared to TK. In the B-1%, B-2.5%, B-5%, and B-10% treatments, AK levels increased by 76.55%, 211.34%, 313.75%, and 621.01%, respectively, while the corresponding TK content only increased by 6.84%, 13.91%, 20.10%, and 37.33% (Figure 4c,f). The most likely reason for this result is the substantial amount of potassium present in the biochar itself, directly contributing to the soil. Simultaneously, the addition of biochar improved soil properties, thereby facilitating the transformation of non-exchangeable potassium into more readily available forms such as water-soluble potassium and exchangeable potassium [62]. A study by Cui et al. also indicated that adding biochar to saline–alkali soil increased soil AK content by 34.6–262% compared to the control [63]. Therefore, maize straw biochar demonstrates the ability to store and release soil nutrients, including N, P, and K.

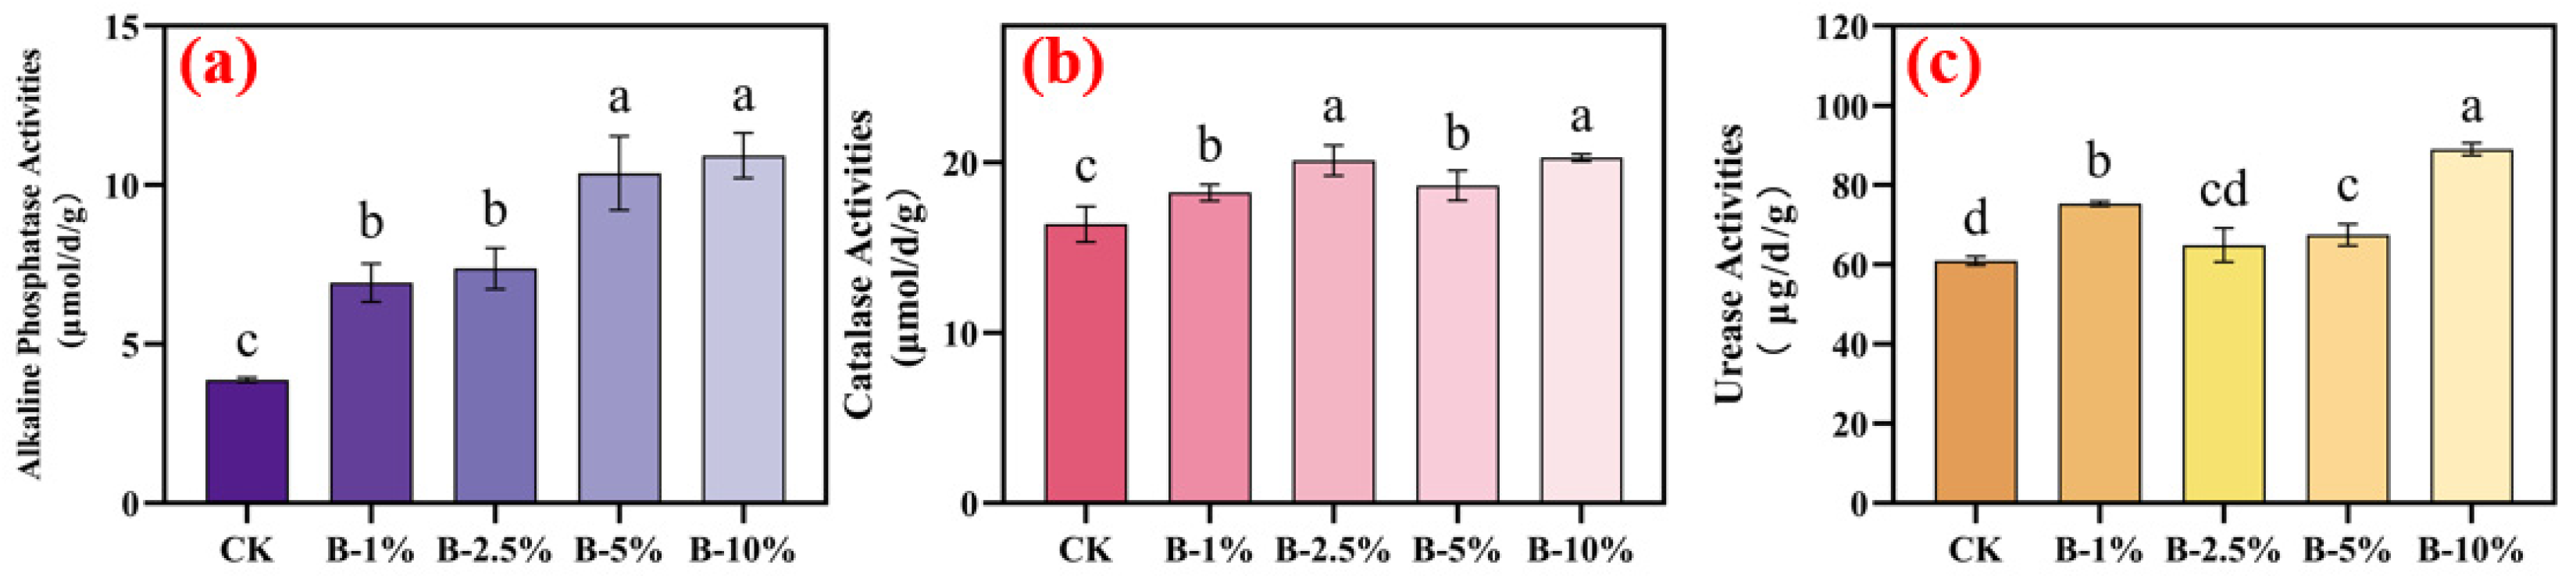
3.2. Effects of Biochar Application on Soil Enzyme Activities

Soil enzymes are crucial drivers of soil metabolism, influencing the activity of soil biochemical reactions, microbial activity, and nutrient cycling, serving as important indicators for assessing soil quality [64]. In soils impacted by salinity, the activity of soil enzymes associated with nitrogen and phosphorus cycling is frequently diminished. This decline is attributed to denaturation and inactivation induced by elevated salinity stress, coupled with constraints on microbial growth [65]. In this study, the addition of maize straw biochar elicited a positive response in the activities of ALP, CAT, and UE (Figure 5, p < 0.05). CAT is acknowledged as an indicator of aerobic microorganisms, providing insights into the redox potential within the soil. It maintains a close association with soil fertility and the abundance of aerobic microorganisms [60]. In this research, the application of biochar significantly increased CAT activity in saline–alkali soils (Figure 5b), reaching its maximum at the highest biochar application rate, consistent with results reported by Masto et al. [66]. Numerous earlier investigations have proposed that the application of biochar can expedite soil nitrogen–carbon cycling, ameliorate soil quality, and consequently elevate CAT activity [67,68]. Soil urease (UE) engages in the hydrolysis of nitrogen-containing organic matter, thereby augmenting the AN content in the soil. It is recognized as an indicator of soil nitrogen content [69]. Moreover, high salinity or sodium content significantly influences UE activity [56]. In this study, after the application of biochar, UE activity in saline–alkali soil significantly increased (Figure 5c). It is worth noting that the impact of adding biochar on ALP activity exceeded its effects on CAT and UE activities, resulting in a substantial increase in ALP activity ranging from 78.60% to 181.76% (p < 0.05, Figure 5a). Consistent with our results, existing research suggests that biochar application can enhance soil ALP activity [70]. The reason behind this may be that biochar contains rich organic components (such as organic carbon, nitrogen, and phosphorus), minerals, a large specific surface area (SSA), and a porous structure, providing sufficient habitat, water, and nutrients for soil microorganisms, thereby increasing their ALP, CAT, and UE activities [71,72].
Correlation analysis was performed to explore the relationship between enzyme activity and soil properties and nutrients. From the correlation bubble chart (Figure 6), it is evident that enzyme activity was positively correlated with N, P, and K nutrients, and SOC. Particularly, for ALP, the correlation reached a highly significant level (p < 0.01); simultaneously, a significant negative correlation was observed with Na+ and SAR (p < 0.05). These results led us to speculate that the positive impact of biochar on the activities of ALP, CAT, and UE in the soil may be attributed to the increase in soil nutrients (N, P, K) and SOC after application, as well as the reduction in salinity and alkalinity stress. Furthermore, the enhancement of soil enzyme activity further contributes to the improvement of the fertility of saline–alkali soils [73]. Overall, maize straw biochar significantly enhances soil enzyme activity and nutrient levels in the soil.

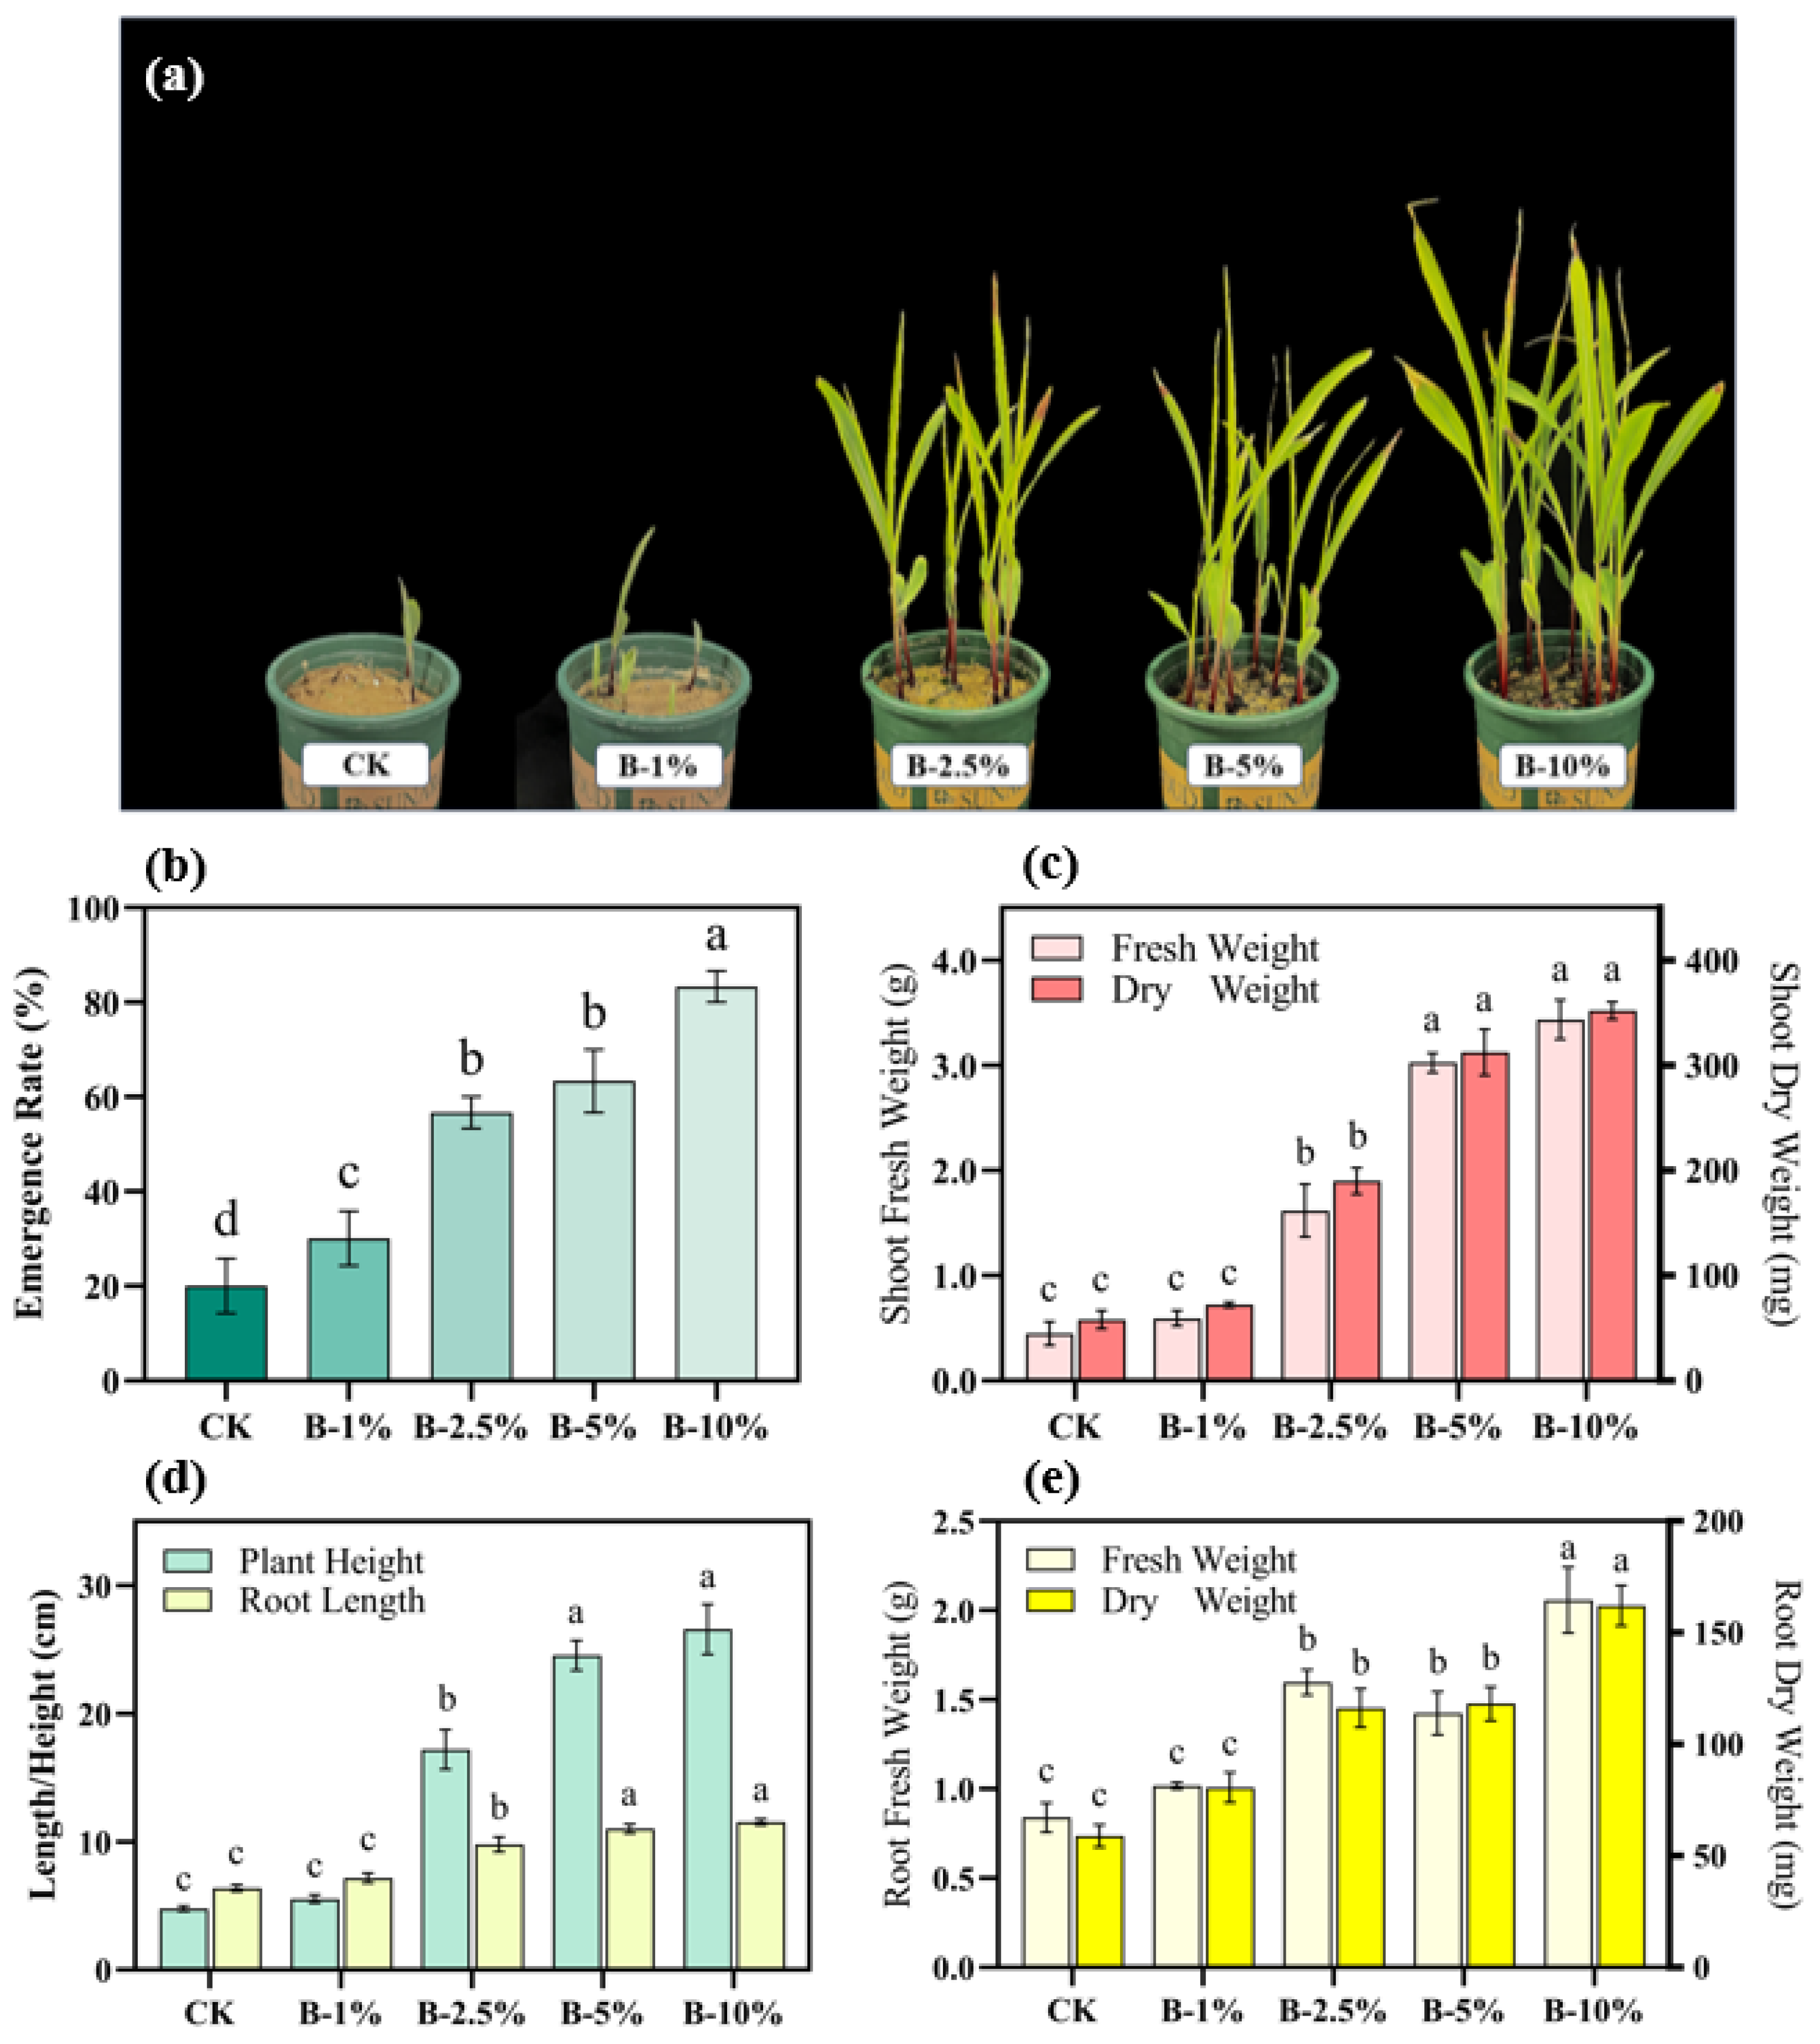
3.3. Effects of Biochar Application on Crop Growth

Distinct variations in the growth of maize plants were evident across different treatments, as illustrated in Figure 7a. Due to the high salt content and nutrient deficiency of saline–alkali soils, maize in the control soil showed impaired growth, with an emergence rate of only 20%. After 18 days of cultivation, the average plant height was a mere 5.03 cm and the average root length was 6.40 cm. The application of biochar significantly promoted the growth of maize, as evidenced by improvements in germination rate, plant height, root length, shoot fresh weight, dry weight, and root dry weight (Figure 7b–e). Moreover, the enhancing effect on maize growth became more pronounced with increasing levels of biochar application, with the order of effectiveness being B-10% > B-5% > B-2.5% > B-1%.
In order to find the factors affecting crop growth, correlation analyses between crop parameters and soil physicochemical properties, soil nutrients, and enzyme activities were carried out. Correlation analysis revealed that crop growth is highly positively correlated with TN, TP, TK, AK, SOC, SWC, and K+ (p < 0.01). Simultaneously, crop growth showed a significant positive correlation with AP, ALP, and UE (p < 0.05). Conversely, there was a highly significant negative association (p < 0.01) between crop growth and Na+ and SAR (p < 0.01) (Figure 8). The potential mechanisms through which biochar promotes crop growth may include: (1) Biochar contributes to crop growth by enhancing soil fertility. Due to its rich content of nutrients such as N, P, and K, biochar enhances soil fertility immediately upon incorporation [74]. Additionally, the high carbon content in biochar influences the content of soil organic matter or humus through slow decomposition, thereby promoting long-term soil fertility improvement [75]. (2) The large surface area and abundant pores of biochar facilitate direct adsorption of excess Na+ through electrostatic adsorption and pore filling, thereby mitigating the SAR [52] and alleviating the stress response of plants caused by Na+ [76]. (3) Biochar provides a favorable habitat for soil enzymes, enhancing enzyme activity and consequently improving soil physicochemical properties, nutrient composition, and biological availability [77], ultimately promoting plant growth [73]. Overall, the incorporation of biochar emerged as an efficacious amendment for saline–alkali soils, exhibiting the capacity to enhance soil fertility and facilitate nutrient absorption by crops. This amendment contributed to the amelioration of saline–alkali soil conditions, ultimately fostering the growth of crops.

3.4. The Most Optimal Biochar Application Rate

From the perspective of soil nutrients and crop growth in this experiment, a higher application rate of biochar appeared to be more beneficial. However, this is largely influenced by the fact that the soil samples used in the experiment were taken from a severely saline–alkali land, making it unsuitable for agricultural production due to nutrient deficiencies. When applied in conjunction with chemical fertilizers, exceeding a certain limit of biochar input may have negative impacts on crop production [77,78]. Additionally, the extensive use of biochar may also have adverse effects on the physicochemical properties of saline–alkali soils [79,80]. This may be attributed to the fact that when biochar itself contains a certain amount of salt, exceeding a certain limit of application may result in the salt accumulation effect of biochar outweighing its ameliorative effect on the saline–alkali soil [81]. On the other hand, high biochar application rates may not always be economically feasible [82], as an increase in biochar application implies an increase in production costs [26]. Therefore, determining the optimal biochar application rate not only maximizes the improvement of saline–alkali soil properties but also helps reduce production costs [79,83].
In this study, the responses of soil salt content, EC, Cl content, and SO42− content to different biochar application rates exhibited a similar trend: initial reduction followed by an increase with increasing biochar application rate. Therefore, we employed a four-parameter Gaussian function to identify the optimal biochar application rate (Equation (2)). The relationship between the biochar application rate and salt content, EC, Cl content, and SO42− content followed a “single-valley” curve, reaching its minimum at approximately 3% (Figure 9a–d). The determination coefficients (R2) for the four fitting curves were all greater than 0.95, indicating a good and satisfactory fit precision. To further determine the optimal biochar application rate, the four-parameter Gaussian equations for the four fitting curves were analyzed for the minimum values of salt content, EC, Cl content, and SO42− content (Table 3). We found that when the optimal application ratio ranges from 2.92% to 3.37%, salt content, EC, Cl content, and SO42− content reach their minimum values. This result suggested that within the optimal biochar application range (2.92% to 3.37%), the salinity of saline–alkali soils can be effectively alleviated. To recommend the optimal biochar application rate, the average of the four optimal biochar application ratios was 3.16%. Further, the experimental validation indicated that at a biochar application rate of 3.16%, soil salt content, EC, Cl content, and SO42− content decreased to 7.28 g/kg, 2.38 mS/cm, 1.68 g/kg, and 2.22 g/kg, respectively, all lower than levels observed at other application rates in this study. Therefore, 3.16% was recommended as the optimal biochar application rate for alleviating soil salinity in saline–alkali soils.

4. Conclusions

This study investigated the effect of biochar in ameliorating saline–alkali soils and determined its optimal application rate. Using a pot experiment employing varying biochar application rates, significant improvements were observed in soil properties and crop growth. Biochar enhanced SWC, reduced salt content, EC, and levels of Na+, Cl, SO42−, and SAR. Moreover, it positively influenced soil fertility and enzyme activities, leading to notable maize growth promotion. The relationship between soil salt content, EC, Cl content, SO42− content, and biochar application rate was well-fitted using a four-parameter Gaussian equation, pinpointing an optimal rate of 3.16%. This research demonstrated the potential of biochar in reducing soil salinity and promoting crop growth and provided a sustainable solution for saline–alkali soil reclamation. However, this experiment only investigated the short-term improvement effects of biochar on saline–alkali soil under laboratory conditions. Further research is needed to explore the long-term effects of biochar on saline–alkali soil under field conditions. Future studies could examine the long-term effects of biochar under different types of saline–alkali soils, while also integrating other remediation measures such as phytoremediation to enhance the effectiveness and sustainability of soil management.

Supplementary Materials

The following supporting information can be downloaded at: https://www.mdpi.com/article/10.3390/su16062523/s1, Figure S1: XRD pattern of saline–alkali soil samples, Figure S2: FTIR spectra of maize straw biochar, Figure S3: The effects of different types of biochar on plant growth. TB: Tobacco straw biochar; RB: Rice straw biochar; MB: Maize straw biochar, Table S1: Property of pristine soil and biochar, Table S2: The emergence rate of corn treated with different types of biochar.

Author Contributions

Conceptualization, X.C., Q.C. and G.S.; methodology, X.C., Q.C. and G.S.; formal analysis, X.C.; investigation, X.C., L.L., Q.Y. and H.X.; data curation, L.L.; writing—original draft preparation, X.C.; writing—review and editing, G.S.; supervision, Q.C. and G.S.; project administration, Q.C. All authors have read and agreed to the published version of the manuscript.

Funding

This research was funded by the National Natural Science Foundation of China (Grant NO. 21876109, 42207004) and the Science and Technology Commission of Shanghai Municipality, China (21DZ1209401).

Institutional Review Board Statement

Not applicable.

Informed Consent Statement

Not applicable.

Data Availability Statement

Data is contained within the article.

Conflicts of Interest

The authors declare that they have no conflicts of interest in the study.

References

  1. Abiala, M.A.; Abdelrahman, M.; Burritt, D.J.; Tran, L.S.P. Salt stress tolerance mechanisms and potential applications of legumes for sustainable reclamation of salt-degraded soils. Land. Degrad. Dev. 2018, 29, 3812–3822. [Google Scholar] [CrossRef]
  2. Li, H.; Zhao, Q.; Huang, H. Current states and challenges of salt-affected soil remediation by cyanobacteria. Sci. Total Environ. 2019, 669, 258–272. [Google Scholar] [CrossRef]
  3. Datta, A.; Setia, R.; Barman, A.; Guo, Y.; Basak, N. Carbon Dynamics in Salt-affected Soils. In Research Developments in Saline Agriculture; Dagar, J.C., Yadav, R.K., Sharma, P.C., Eds.; Springer: Singapore, 2019; pp. 369–389. [Google Scholar]
  4. Yuan, Y.; Liu, Q.; Zheng, H.; Li, M.; Liu, Y.; Wang, X.; Peng, Y.; Luo, X.; Li, F.; Li, X.; et al. Biochar as a sustainable tool for improving the health of salt-affected soils. Soil. Environ. Health 2023, 1, 100033. [Google Scholar] [CrossRef]
  5. Yang, J.; Yao, R.; Wang, X.; Xie, W. Research on ecological management and ecological industry development model of saline-alkali land in the Hetao Plain, China. Acta Ecol. Sin. 2016, 36, 7059–7063. [Google Scholar]
  6. Collas, L.; Sourd, R.C.D.; Finch, T.; Green, R.; Hanley, N.; Balmford, A. The costs of delivering environmental outcomes with land sharing and land sparing. People Nat. 2023, 5, 228–240. [Google Scholar] [CrossRef]
  7. Lehmann, J.; Joseph, S. Biochar for Environmental Management: Science, Technology and Implementation, 2nd ed.; Routledge: Abingdon, UK, 2015. [Google Scholar]
  8. Aborisade, M.A.; Feng, A.; Oba, B.T.; Kumar, A.; Battamo, A.Y.; Huang, M.; Chen, D.; Yang, Y.; Sun, P.; Zhao, L. Pyrolytic synthesis and performance efficacy comparison of biochar-supported nanoscale zero-valent iron on soil polluted with toxic metals. Arch. Agron. Soil. Sci. 2023, 69, 2249–2266. [Google Scholar] [CrossRef]
  9. Zanutel, M.; Garré, S.; Sanglier, P.; Bielders, C. Biochar modifies soil physical properties mostly through changes in soil structure rather than through its internal porosity. Vadose Zone J. 2024, 23, e20301. [Google Scholar] [CrossRef]
  10. Aborisade, M.A.; Oba, B.T.; Kumar, A.; Liu, J.; Chen, D.; Okimiji, O.P.; Zhao, L. Remediation of metal toxicity and alleviation of toxic metals-induced oxidative stress in Brassica chinensis L using biochar-iron nanocomposites. Plant Soil. 2023, 493, 629–645. [Google Scholar] [CrossRef]
  11. Liu, D.; Ding, Z.L.; Ali, E.F.; Kheir, A.M.S.; Eissa, M.A.; Ibrahim, O.H.M. Biochar and compost enhance soil quality and growth of roselle (Hibiscus sabdariffa L.) under saline conditions. Sci. Rep. 2021, 11, 8739. [Google Scholar] [CrossRef] [PubMed]
  12. Sun, R.; Zheng, H.; Yin, S.; Zhang, X.; You, X.; Wu, H.; Suo, F.; Han, K.; Cheng, Y.; Zhang, C.; et al. Comparative study of pyrochar and hydrochar on peanut seedling growth in a coastal salt-affected soil of Yellow River Delta, China. Sci. Total Environ. 2022, 833, 155183. [Google Scholar] [CrossRef]
  13. Lashari, M.S.; Ye, Y.X.; Ji, H.S.; Li, L.Q.; Kibue, G.W.; Lu, H.F.; Zheng, J.F.; Pan, G.X. Biochar-manure compost in conjunction with pyroligneous solution alleviated salt stress and improved leaf bioactivity of maize in a saline soil from central China: A 2-year field experiment. J. Sci. Food Agric. 2015, 95, 1321–1327. [Google Scholar] [CrossRef]
  14. Xiao, L.; Yuan, G.; Feng, L.; Bi, D.; Wei, J. Soil properties and the growth of wheat (Triticum aestivum L.) and maize (Zea mays L.) in response to reed (phragmites communis) biochar use in a salt-affected soil in the Yellow River Delta. Agric. Ecosyst. Environ. 2020, 303, 107124. [Google Scholar] [CrossRef]
  15. Zhang, X.; Qu, J.; Li, H.; La, S.; Tian, Y.; Gao, L. Biochar addition combined with daily fertigation improves overall soil quality and enhances water-fertilizer productivity of cucumber in alkaline soils of a semi-arid region. Geoderma 2020, 363, 114170. [Google Scholar] [CrossRef]
  16. Luo, X.; Liu, G.; Xia, Y.; Chen, L.; Jiang, Z.; Zheng, H.; Wang, Z. Use of biochar-compost to improve properties and productivity of the degraded coastal soil in the Yellow River Delta, China. J. Soils Sediments 2017, 17, 780–789. [Google Scholar] [CrossRef]
  17. Shi, Y.; Liu, X.; Zhang, Q.; Gao, P.; Ren, J. Biochar and organic fertilizer changed the ammonia-oxidizing bacteria and archaea community structure of saline–alkali soil in the North China Plain. J. Soils Sediments 2020, 20, 12–23. [Google Scholar] [CrossRef]
  18. He, K.; He, G.; Wang, C.; Zhang, H.; Xu, Y.; Wang, S.; Kong, Y.; Zhou, G.; Hu, R. Biochar amendment ameliorates soil properties and promotes Miscanthus growth in a coastal saline-alkali soil. Appl. Soil. Ecol. 2020, 155, 103674. [Google Scholar] [CrossRef]
  19. Chaganti, V.N.; Crohn, D.M.; Šimůnek, J. Leaching and reclamation of a biochar and compost amended saline–sodic soil with moderate SAR reclaimed water. Agric. Water Manag. 2015, 158, 255–265. [Google Scholar] [CrossRef]
  20. Zhang, J.; Zhou, S.; Sun, H.; Lü, F.; He, P. Three-year rice grain yield responses to coastal mudflat soil properties amended with straw biochar. J. Environ. Manag. 2019, 239, 23–29. [Google Scholar] [CrossRef]
  21. Saifullah; Dahlawi, S.; Naeem, A.; Rengel, Z.; Naidu, R. Biochar application for the remediation of salt-affected soils: Challenges and opportunities. Sci. Total Environ. 2018, 625, 320–335. [Google Scholar] [CrossRef] [PubMed]
  22. Xiao, Q.; Zhu, L.-x.; Shen, Y.-f.; Li, S.-q. Sensitivity of soil water retention and availability to biochar addition in rainfed semi-arid farmland during a three-year field experiment. Field Crops Res. 2016, 196, 284–293. [Google Scholar] [CrossRef]
  23. Yue, Y.; Cui, L.; Lin, Q.; Li, G.; Zhao, X. Efficiency of sewage sludge biochar in improving urban soil properties and promoting grass growth. Chemosphere 2017, 173, 551–556. [Google Scholar] [CrossRef]
  24. Sun, J.; Yang, R.; Li, W.; Pan, Y.; Zheng, M.; Zhang, Z. Effect of biochar amendment on water infiltration in a coastal saline soil. J. Soils Sediments 2018, 18, 3271–3279. [Google Scholar] [CrossRef]
  25. Lebrun, M.; Miard, F.; Nandillon, R.; Hattab-Hambli, N.; Scippa, G.S.; Bourgerie, S.; Morabito, D. Eco-restoration of a mine technosol according to biochar particle size and dose application: Study of soil physico-chemical properties and phytostabilization capacities of Salix viminalis. J. Soils Sediments 2018, 18, 2188–2202. [Google Scholar] [CrossRef]
  26. Vochozka, M.; Maroušková, A.; Váchal, J.; Straková, J. Biochar pricing hampers biochar farming. Clean. Technol. Environ. Policy 2016, 18, 1225–1231. [Google Scholar] [CrossRef]
  27. Natural Resources Conservation Service; Agriculture Department. Keys to Soil Taxonomy; Government Printing Office: Washington, DC, USA, 2010.
  28. Luo, R.; Zhang, B.; Gao, J.; Wang, Z.; Sun, J.; Yu, X. Climate change impacts on corn production as evidenced by a model and historical yields in Inner Mongolia, China. J. Food Agric. Environ. 2012, 10, 976–983. [Google Scholar]
  29. Bhaduri, D.; Saha, A.; Desai, D.; Meena, H.N. Restoration of carbon and microbial activity in salt-induced soil by application of peanut shell biochar during short-term incubation study. Chemosphere 2016, 148, 86–98. [Google Scholar] [CrossRef] [PubMed]
  30. Qiu, J.; De Souza, M.F.; Wang, X.; Ok, Y.S.; Meers, E. Influence of biochar addition and plant management (cutting and time) on ryegrass growth and migration of As and Pb during phytostabilization. Sci. Total Environ. 2024, 913, 169771. [Google Scholar] [CrossRef] [PubMed]
  31. Zhang, J.; Zeng, G.; Chen, Y.; Yu, M.; Yu, Z.; Li, H.; Yu, Y.; Huang, H. Effects of physico-chemical parameters on the bacterial and fungal communities during agricultural waste composting. Bioresour. Technol. 2011, 102, 2950–2956. [Google Scholar] [CrossRef]
  32. Lu, R. Analytical Methods of Soil Agrochemistry; China Agricultural Science and Technology Press: Beijing, China, 1999; pp. 85–96. [Google Scholar]
  33. Kalembasa, S.J.; Jenkinson, D.S. A comparative study of titrimetric and gravimetric methods for the determination of organic carbon in soil. J. Sci. Food Agric. 1973, 24, 1085–1090. [Google Scholar] [CrossRef]
  34. Qadir, M.; Sposito, G.; Smith, C.J.; Oster, J.D. Reassessing irrigation water quality guidelines for sodicity hazard. Agric. Water Manag. 2021, 255, 107054. [Google Scholar] [CrossRef]
  35. Walker, T.W.; Adams, A.F.R. Studies on soil organic matter: I. Influence of phosphorus content of parent materials on accumulations of carbon, nitrogen, sulfur, and organic phosphorus in grassland soils. Soil. Sci. 1958, 85, 307–318. [Google Scholar] [CrossRef]
  36. Chen, H.; Yang, X.; Wang, H.; Sarkar, B.; Shaheen, S.M.; Gielen, G.; Bolan, N.; Guo, J.; Che, L.; Sun, H.; et al. Animal carcass- and wood-derived biochars improved nutrient bioavailability, enzyme activity, and plant growth in metal-phthalic acid ester co-contaminated soils: A trial for reclamation and improvement of degraded soils. J. Environ. Manag. 2020, 261, 110246. [Google Scholar] [CrossRef] [PubMed]
  37. Chen, X.; Opoku-Kwanowaa, Y.; Li, J.; Wu, J. Application of Organic Wastes to Primary Saline-alkali Soil in Northeast China: Effects on Soil Available Nutrients and Salt Ions. Commun. Soil. Sci. Plant Anal. 2020, 51, 1238–1252. [Google Scholar] [CrossRef]
  38. Sun, J.; He, F.; Shao, H.; Zhang, Z.; Xu, G. Effects of biochar application on Suaeda salsa growth and saline soil properties. Environ. Earth Sci. 2016, 75, 630. [Google Scholar] [CrossRef]
  39. Cui, Q.; Xia, J.; Yang, H.; Liu, J.; Shao, P. Biochar and effective microorganisms promote Sesbania cannabina growth and soil quality in the coastal saline-alkali soil of the Yellow River Delta, China. Sci. Total Environ. 2021, 756, 143801. [Google Scholar] [CrossRef]
  40. Al-Wabel, M.I.; Hussain, Q.; Usman, A.R.A.; Ahmad, M.; Abduljabbar, A.; Sallam, A.S.; Ok, Y.S. Impact of biochar properties on soil conditions and agricultural sustainability: A review. Land. Degrad. Dev. 2018, 29, 2124–2161. [Google Scholar] [CrossRef]
  41. Tittonell, P.; Rufino, M.C.; Janssen, B.H.; Giller, K.E. Carbon and nutrient losses during manure storage under traditional and improved practices in smallholder crop-livestock systems-evidence from Kenya. Plant Soil. 2010, 328, 253–269. [Google Scholar] [CrossRef]
  42. Sakhiya, A.K.; Anand, A.; Kaushal, P. Production, activation, and applications of biochar in recent times. Biochar 2020, 2, 253–285. [Google Scholar] [CrossRef]
  43. Liu, K.; Ran, Q.; Li, F.; Shaheen, S.M.; Wang, H.; Rinklebe, J.; Liu, C.; Fang, L. Carbon-based strategy enables sustainable remediation of paddy soils in harmony with carbon neutrality. Carbon. Research 2022, 1, 12. [Google Scholar] [CrossRef]
  44. Kim, H.-S.; Kim, K.-R.; Yang, J.E.; Ok, Y.S.; Owens, G.; Nehls, T.; Wessolek, G.; Kim, K.-H. Effect of biochar on reclaimed tidal land soil properties and maize (Zea mays L.) response. Chemosphere 2016, 142, 153–159. [Google Scholar] [CrossRef] [PubMed]
  45. Sun, J.; Yang, R.; Zhu, J.; Pan, Y.; Yang, M.; Zhang, Z. Can the increase of irrigation frequency improve the rate of water and salt migration in biochar-amended saline soil? J. Soils Sediments 2019, 19, 4021–4030. [Google Scholar] [CrossRef]
  46. Yue, Y.; Guo, W.N.; Lin, Q.M.; Li, G.T.; Zhao, X.R. Improving salt leaching in a simulated saline soil column by three biochars derived from rice straw (Oryza sativa L.), sunflower straw (Helianthus annuus), and cow manure. J. Soil. Water Conserv. 2016, 71, 467–475. [Google Scholar] [CrossRef]
  47. Raison, R.J. Modification of the soil environment by vegetation fires, with particular reference to nitrogen transformations - review. Plant Soil. 1979, 51, 73–108. [Google Scholar]
  48. Abebe, N.; Endalkachew, K.; Mastawesha, M.; Gebremedhin, A. Effect of Biochar Application on Soil Properties and Nutrient Uptake of Lettuces (Lactuca sativa) Grown in Chromium Polluted Soils. Am. Eurasian J. Agric. Environ. Sci. 2011, 12, 369–374. [Google Scholar]
  49. Mahmoud, E.; El-Beshbeshy, T.; El-Kader, N.A.; El Shal, R.; Khalafallah, N. Impacts of biochar application on soil fertility, plant nutrients uptake and maize (Zea mays L.) yield in saline sodic soil. Arab. J. Geosci. 2019, 12, 719. [Google Scholar] [CrossRef]
  50. Zhang, P.; Bing, X.; Jiao, L.; Xiao, H.; Li, B.; Sun, H. Amelioration effects of coastal saline-alkali soil by ball-milled red phosphorus-loaded biochar. Chem. Eng. J. 2022, 431, 133904. [Google Scholar] [CrossRef]
  51. Duan, M.; Liu, G.; Zhou, B.; Chen, X.; Wang, Q.; Zhu, H.; Li, Z. Effects of modified biochar on water and salt distribution and water-stable macro-aggregates in saline-alkaline soil. J. Soils Sediments 2021, 21, 2192–2202. [Google Scholar] [CrossRef]
  52. Alotaibi, K.D. Use of biochar for alleviating negative impact of salinity stress in corn grown in arid soil. Can. J. Soil. Sci. 2022, 102, 187–196. [Google Scholar] [CrossRef]
  53. Wu, Y.; Xu, G.; Shao, H.B. Furfural and its biochar improve the general properties of a saline soil. Solid. Earth 2014, 5, 665–671. [Google Scholar] [CrossRef]
  54. Lakhdar, A.; Rabhi, M.; Ghnaya, T.; Montemurro, F.; Jedidi, N.; Abdelly, C. Effectiveness of compost use in salt-affected soil. J. Hazard. Mater. 2009, 171, 29–37. [Google Scholar]
  55. Wong, V.N.L.; Greene, R.S.B.; Dalal, R.C.; Murphy, B.W. Soil carbon dynamics in saline and sodic soils: A review. Soil. Use Manag. 2010, 26, 2–11. [Google Scholar] [CrossRef]
  56. Yao, T.; Zhang, W.; Gulaqa, A.; Cui, Y.; Zhou, Y.; Weng, W.; Wang, X.; Liu, Q.; Jin, F. Effects of Peanut Shell Biochar on Soil Nutrients, Soil Enzyme Activity, and Rice Yield in Heavily Saline-Sodic Paddy Field. J. Soil. Sci. Plant Nutr. 2021, 21, 655–664. [Google Scholar] [CrossRef]
  57. Lehmann, J.; da Silva, J.P.; Steiner, C.; Nehls, T.; Zech, W.; Glaser, B. Nutrient availability and leaching in an archaeological Anthrosol and a Ferralsol of the Central Amazon basin: Fertilizer, manure and charcoal amendments. Plant Soil. 2003, 249, 343–357. [Google Scholar] [CrossRef]
  58. Li, L.; Long, A.; Fossum, B.; Kaiser, M. Effects of pyrolysis temperature and feedstock type on biochar characteristics pertinent to soil carbon and soil health: A meta-analysis. Soil. Use Manag. 2023, 39, 43–52. [Google Scholar] [CrossRef]
  59. Lashari, M.S.; Liu, Y.; Li, L.; Pan, W.; Fu, J.; Pan, G.; Zheng, J.; Zheng, J.; Zhang, X.; Yu, X. Effects of amendment of biochar-manure compost in conjunction with pyroligneous solution on soil quality and wheat yield of a salt-stressed cropland from Central China Great Plain. Field Crops Res. 2013, 144, 113–118. [Google Scholar] [CrossRef]
  60. Liu, S.; Meng, J.; Jiang, L.; Yang, X.; Lan, Y.; Cheng, X.; Chen, W. Rice husk biochar impacts soil phosphorous availability, phosphatase activities and bacterial community characteristics in three different soil types. Appl. Soil. Ecol. 2017, 116, 12–22. [Google Scholar] [CrossRef]
  61. Hu, Y.; Xia, Y.; Sun, Q.; Liu, K.; Chen, X.; Ge, T.; Zhu, B.; Zhu, Z.; Zhang, Z.; Su, Y. Effects of long-term fertilization on phoD-harboring bacterial community in Karst soils. Sci. Total Environ. 2018, 628–629, 53–63. [Google Scholar] [CrossRef]
  62. Zeng, A.; Liao, Y.; Zhang, J.; Sui, Y.; Wen, X. Effects of Biochar on Soil Moisture, Organic Carbon and Available Nutrient Contents in Manural Loessial Soils. J. Agro-Environ. Sci. 2013, 32, 1009–1015. [Google Scholar]
  63. Cui, L.; Liu, Y.; Yan, J.; Hina, K.; Hussain, Q.; Qiu, T.; Zhu, J. Revitalizing coastal saline-alkali soil with biochar application for improved crop growth. Ecol. Eng. 2022, 179, 106594. [Google Scholar] [CrossRef]
  64. Burns, R.G.; DeForest, J.L.; Marxsen, J.; Sinsabaugh, R.L.; Stromberger, M.E.; Wallenstein, M.D.; Weintraub, M.N.; Zoppini, A. Soil enzymes in a changing environment: Current knowledge and future directions. Soil. Biol. Biochem. 2013, 58, 216–234. [Google Scholar] [CrossRef]
  65. Premalatha, R.P.; Malarvizhi, P.; Parameswari, E. Effect of biochar doses under various levels of salt stress on soil nutrient availability, soil enzyme activities and plant growth in a marigold crop. Crop Pasture Sci. 2023, 74, 66–78. [Google Scholar] [CrossRef]
  66. Masto, R.E.; Kumar, S.; Rout, T.K.; Sarkar, P.; George, J.; Ram, L.C. Biochar from water hyacinth (Eichornia crassipes) and its impact on soil biological activity. CATENA 2013, 111, 64–71. [Google Scholar] [CrossRef]
  67. Amini, S.; Ghadiri, H.; Chen, C.; Marschner, P. Salt-affected soils, reclamation, carbon dynamics, and biochar: A review. J. Soils Sediments 2016, 16, 939–953. [Google Scholar] [CrossRef]
  68. Yang, X.; Liu, J.; McGrouther, K.; Huang, H.; Lu, K.; Guo, X.; He, L.; Lin, X.; Che, L.; Ye, Z.; et al. Effect of biochar on the extractability of heavy metals (Cd, Cu, Pb, and Zn) and enzyme activity in soil. Environ. Sci. Pollut. Res. 2016, 23, 974–984. [Google Scholar] [CrossRef] [PubMed]
  69. Demisie, W.; Liu, Z.; Zhang, M. Effect of biochar on carbon fractions and enzyme activity of red soil. CATENA 2014, 121, 214–221. [Google Scholar] [CrossRef]
  70. Ye, L.; Camps-Arbestain, M.; Shen, Q.; Lehmann, J.; Singh, B.; Sabir, M. Biochar effects on crop yields with and without fertilizer: A meta-analysis of field studies using separate controls. Soil. Use Manag. 2020, 36, 2–18. [Google Scholar] [CrossRef]
  71. Palansooriya, K.N.; Wong, J.T.F.; Hashimoto, Y.; Huang, L.; Rinklebe, J.; Chang, S.X.; Bolan, N.; Wang, H.; Ok, Y.S. Response of microbial communities to biochar-amended soils: A critical review. Biochar 2019, 1, 3–22. [Google Scholar] [CrossRef]
  72. He, M.; Xiong, X.; Wang, L.; Hou, D.; Bolan, N.S.; Ok, Y.S.; Rinklebe, J.; Tsang, D.C.W. A critical review on performance indicators for evaluating soil biota and soil health of biochar-amended soils. J. Hazard. Mater. 2021, 414, 125378. [Google Scholar] [CrossRef]
  73. Pokharel, P.; Ma, Z.; Chang, S.X. Biochar increases soil microbial biomass with changes in extra- and intracellular enzyme activities: A global meta-analysis. Biochar 2020, 2, 65–79. [Google Scholar] [CrossRef]
  74. El-Naggar, A.; Lee, S.S.; Rinklebe, J.; Farooq, M.; Song, H.; Sarmah, A.K.; Zimmerman, A.R.; Ahmad, M.; Shaheen, S.M.; Ok, Y.S. Biochar application to low fertility soils: A review of current status, and future prospects. Geoderma 2019, 337, 536–554. [Google Scholar] [CrossRef]
  75. Kimetu, J.M.; Lehmann, J. Stability and stabilisation of biochar and green manure in soil with different organic carbon contents. Aust. J. Soil. Res. 2010, 48, 577–585. [Google Scholar] [CrossRef]
  76. Ducey, T.F.; Ippolito, J.A.; Cantrell, K.B.; Novak, J.M.; Lentz, R.D. Addition of activated switchgrass biochar to an aridic subsoil increases microbial nitrogen cycling gene abundances. Appl. Soil. Ecol. 2013, 65, 65–72. [Google Scholar] [CrossRef]
  77. Zheng, H.; Wang, X.; Chen, L.; Wang, Z.; Xia, Y.; Zhang, Y.; Wang, H.; Luo, X.; Xing, B. Enhanced growth of halophyte plants in biochar-amended coastal soil: Roles of nutrient availability and rhizosphere microbial modulation. Plant Cell Environ. 2018, 41, 517–532. [Google Scholar] [CrossRef]
  78. Zhao, W.; Zhou, Q.; Tian, Z.; Cui, Y.; Liang, Y.; Wang, H. Apply biochar to ameliorate soda saline-alkali land, improve soil function and increase corn nutrient availability in the Songnen Plain. Sci. Total Environ. 2020, 722, 137428. [Google Scholar] [CrossRef]
  79. Li, C.; Xiong, Y.; Qu, Z.; Xu, X.; Huang, Q.; Huang, G. Impact of biochar addition on soil properties and water-fertilizer productivity of tomato in semi-arid region of Inner Mongolia, China. Geoderma 2018, 331, 100–108. [Google Scholar] [CrossRef]
  80. Liang, J.; Li, Y.; Si, B.; Wang, Y.; Chen, X.; Wang, X.; Chen, H.; Wang, H.; Zhang, F.; Bai, Y.; et al. Optimizing biochar application to improve soil physical and hydraulic properties in saline-alkali soils. Sci. Total Environ. 2021, 771, 144802. [Google Scholar] [CrossRef] [PubMed]
  81. Jalali, M.; Ranjbar, F. Effects of sodic water on soil sodicity and nutrient leaching in poultry and sheep manure amended soils. Geoderma 2009, 153, 194–204. [Google Scholar] [CrossRef]
  82. Clare, A.; Shackley, S.; Joseph, S.; Hammond, J.; Pan, G.; Bloom, A. Competing uses for China’s straw: The economic and carbon abatement potential of biochar. GCB Bioenergy 2015, 7, 1272–1282. [Google Scholar] [CrossRef]
  83. Pandit, N.R.; Mulder, J.; Hale, S.E.; Zimmerman, A.R.; Pandit, B.H.; Cornelissen, G. Multi-year double cropping biochar field trials in Nepal: Finding the optimal biochar dose through agronomic trials and cost-benefit analysis. Sci. Total Environ. 2018, 637–638, 1333–1341. [Google Scholar] [CrossRef] [PubMed]
Figure 1. Schematic illustration of the pot experiment.
Sustainability 16 02523 g001
Figure 2. SWC (a), pH (b), and SOC (c) in different treatments of saline–alkali soils. Bars show different letters indicating significant differences among treatments (p < 0.05).
Sustainability 16 02523 g002
Figure 3. Salt content (a), EC (b), and SAR (c) in different treatments of saline–alkali soils. Bars show different letters indicating significant differences among treatments (p < 0.05).
Sustainability 16 02523 g003
Figure 4. Changes in total N (a), total P (b), total K (c), available N (d), available P (e), and available K (f) in different treatments of saline–alkali soils. Bars show different letters indicating significant differences among treatments (p < 0.05).
Sustainability 16 02523 g004
Figure 5. Soil enzyme activities of ALP (a), CAT (b), and UE (c) in different treatments of saline–alkali soils. Bars show different letters indicating significant differences among treatments (p < 0.05).
Sustainability 16 02523 g005
Figure 6. Pearson correlation between soil enzyme activity and soil properties and nutrients. *, ** indicate p < 0.05, p < 0.01, respectively.
Sustainability 16 02523 g006
Figure 7. Effect of maize straw biochar on plant growth (a), emergence rate (b), plant height and root length (c), shoot fresh and dry weight (d), and fresh and dry root weight (e) in saline–alkali soil. Bars show different letters indicating significant differences among treatments (p < 0.05).
Sustainability 16 02523 g007
Figure 8. Pearson correlation between crop parameters and soil physical and chemical properties, soil nutrient, and enzyme activities. *, ** indicate p < 0.05, p < 0.01, respectively.
Sustainability 16 02523 g008
Figure 9. The relationship between biochar application rate and salt content (a), EC (b), Cl content (c), and SO42− content (d).
Sustainability 16 02523 g009
Table 1. Properties of biochar and soil.
PropertiesValue
BiocharSoil
pH8.928.78
C (%)52.52-
H (%)1.31-
O (%)7.49-
N (%)1.23-
C/N42.70-
Brunauer–Emmett–Teller (BET) Surface area (m2/g)96.44-
Salt content (g/kg)-10.44
EC (mS/cm)-3.88
SAR-4.90
Organic carbon (g/kg)401.585.47
Total N (g/kg)8.730.60
Total P (g/kg)2.370.66
Total K (g/kg)29.0610.07
Available N (mg/kg)48.92203.27
Available P (mg/kg)239.1394.25
Available K (mg/kg)19,363.85194.20
Table 2. Content of eight salt ions in soil samples under different treatments (mean ± s.e.).
TreatmentsSoil Salt Ions (g/kg)
Na+Ca2+Mg2+K+SO42−ClHCO3CO32−
CK3.02 ± 0.20 a 10.21 ± 0.01 ab0.31 ± 0.01 a0.10 ± 0.01 e3.21 ± 0.04 a2.37 ± 0.02 ab0.21 ± 0.02 a0.01 a
B-1%2.95 ± 0.07 a0.20 ± 0.01 ab0.30 ± 0.01 a0.24 ± 0.00 d3.08 ± 0.09 a2.33 ± 0.09 b0.21 ± 0.01 a0.00 a
B-2.5%2.06 ± 0.27 b0.16 ± 0.02 b0.21 ± 0.03 b0.39 ± 0.04 c2.33 ± 0.14 c1.70 ± 0.12 c0.21 ± 0.02 a0.00 a
B-5%2.36 ± 0.07 b0.22 ± 0.03 a0.25 ± 0.02 b0.80 ± 0.04 b2.78 ± 0.21 b2.34 ± 0.11 ab0.24 ± 0.01 a0.00 a
B-10%2.06 ± 0.09 b0.25 ± 0.00 a0.25 ± 0.01 b1.31 ± 0.03 a3.26 ± 0.10 a2.57 ± 0.20 a0.23 ± 0.01 a0.00 a
1 Different small letters behind the values in the same column indicate significant differences between different treatments (p < 0.05).
Table 3. The fitting analysis between biochar application rate and salt content, EC, Cl content, and SO42− content.
Variable YMinimum Value of Response Variable (m + n)Optimal Biochar Application Rate (μ, %)R2
Salt content (Y1, g/kg)7.913.190.97
EC (Y2, mS/cm)2.553.160.98
Cl content (Y3, g/kg)1.612.920.97
SO42− content (Y4, g/kg)2.043.370.99
Average value-3.160.98
Disclaimer/Publisher’s Note: The statements, opinions and data contained in all publications are solely those of the individual author(s) and contributor(s) and not of MDPI and/or the editor(s). MDPI and/or the editor(s) disclaim responsibility for any injury to people or property resulting from any ideas, methods, instructions or products referred to in the content.

