Abstract
Livestock systems have been identified as major emitters of greenhouse gases due to the use of extensive areas with degraded pastures. The objective of this study was to analyze carbon (CO2) and methane (CH4) fluxes in the atmosphere as indicators of environmental sustainability in silvopastoral systems. CO2 and CH4 fluxes from soil to the atmosphere were monitored in a degraded pasture (predominant species: Panicum maximum cv. Mombaça) grown in full sun and compared with areas with tree species (Bertholletia excelsa, Dipteryx odorata, and Khaya grandifoliola) and productive pasture (Panicum maximum cv. Mombaça) grown in full sun. The study area was in Mojuí dos Campos, western Pará state, Eastern Amazon, Brazil. The evaluations were conducted in a Technological Reference Unit with a silvopastoral system, where animals used the shade of trees during high-temperature periods. The fluxes were measured using an ultraportable greenhouse gas analyzer coupled with static polyvinyl chloride ring chambers installed at the soil–air interface. In conclusion, areas with integrated systems (B. excelsa + pasture and K. grandifoliola + pasture) were better mitigators of CO2 emissions; the highest emissions occurred in the degraded pasture area during the rainiest months. The CH4 fluxes were more intense in the areas with degraded pasture and K. grandifoliola + pasture. Converting degraded pasture areas into integrated crop–livestock–forest systems reduced greenhouse gas emissions in the Amazon over 10 years of implementation. The implementation of integrated crop–livestock–forest systems in long-deforested areas with degraded pastures and a low production capacity showed high potential for changes focused on developing sustainable agriculture in the Amazon.
1. Introduction
The increase in greenhouse gas concentrations in the atmosphere denotes a strong anthropogenic effect that compromises the balance of natural ecosystems due to potential climate changes [1]. Concerns about climate change are relevant when considering the agricultural sector, which is responsible for 33.6% of greenhouse gas emissions in Brazil [2].
In 2009, the Brazilian government established a national strategic plan for mitigation and adaptation to climate change, the ABC Plan, for the consolidation of a low-carbon economy in agriculture, in accordance with the National Policy on Climate Change, as part of Brazil’s actions to mitigate greenhouse gas emissions and global warming [3]. It is currently called the ABC+ Plan (plan for adaptation and low-carbon emissions in agriculture 2020–2030) [4].
Furthermore, Brazil joined the Global Methane Pledge [5], whose main objective is to take voluntary actions to contribute to the collective effort and reduce global CH4 emissions by at least 30% by 2030, based on 2020 levels, with the potential to reduce global warming by more than 0.2 °C by 2050 [6].
Carbon dioxide (CO2), methane (CH4), and nitrous oxide (N2O) are the most important greenhouse gases in the context of agricultural activity. Although CH4 concentrations in the atmosphere are lower than those of CO2, its warming potential is 27.2 times higher than that of CO2 [7]. CH4 can be classified as a short-lived climate pollutant because it has a relatively short life in the atmosphere (8–12 years) when compared to CO2, which can remain for up to 10,000 years before returning to the global carbon cycle [8].
One of the main challenges of agricultural activity is the need for increasing food production to meet the growing world population [9] while adapting to environmental and economic changes and improving animal performance in more sustainable production systems [10].
The increase in the use and degradation of natural resources is among the issues involving the growth of the agricultural sector. This increase directly contributes to the aggravation of global climate change due to greenhouse gas emissions, depleting water resources, causing soil erosion, and harming natural habitats [7].
Deforestation in tropical regions is another important factor for global warming. Deforestation in the Brazilian Amazon is mainly connected to the conversion of forests into pastures [11,12]. The yield of forage species grown in this region decreases after a few years when the pasture is not recovered; this can lead to the abandonment of fallow areas, which are transformed into secondary forests over time [13].
Changes in land use alter the chemical, physical, and biological properties of the soil, modifying greenhouse gas fluxes [14]. Mitigating these effects requires the use of conservation practices, such as no-tillage systems, and the adoption of integrated systems [15,16]. These practices increase soil porosity by adding organic matter [17,18] and, consequently, increase its aeration and pH, reduce weed infestations, and incorporate N into the system when growing legumes [19,20].
Crop–livestock–forest integration systems have multiple benefits, such as improvement in nutrient cycling and nutrient use efficiency, diversified production, and lower environmental impact; this explains the expansion of areas with this integrated production arrangement [21,22,23]. In addition, crop–livestock–forest integration systems have been among the strategies for food production with low greenhouse gas emissions [24,25].
According to Nair et al. [26] and Peters et al. [27], agrosilvopastoral and silvopastoral systems are types of crop–livestock–forest integration systems that can reduce and compensate for greenhouse gas emissions in the agricultural sector in Brazil by integrating livestock with the forest. These systems reduce animal emission levels [26], mitigate CH4 emissions from enteric fermentation [28], and improve animal digestion efficiency [29]. Additionally, these systems can mitigate greenhouse gas emissions through carbon sequestration by increasing above- and below-ground biomasses [30,31,32].
Currently, there are no flux measurements in integrated systems in the Eastern Amazon. The calculation of emissions due to each component of land use supports managers focused on achieving targets of greenhouse gas emission reduction in production systems at the regional, national, and global levels. Emission estimates are generally based on simplified models and estimated data due to the lack of field monitoring data.
Therefore, the objective of this study was to analyze carbon (CO2) and methane (CH4) fluxes to the atmosphere as indicators of environmental sustainability using silvopastoral systems in the Eastern Amazon.
2. Material and Methods
2.1. Study Area
The data were obtained from collections at Nossa Senhora Aparecida Farm, a private property (02°38′11″ S, 54°56′13″ W, and altitude of 152 m). The area is in the municipalities of Belterra and Mojuí dos Campos, Pará, Brazil. Field samplings were carried out at a Technological Reference Unit under an integrated crop–livestock–forest system, characterized as silvopastoral, where animals use forested areas as shelter, mainly during periods of high solar incidence. The Brazilian Agricultural Research Corporation (EMBRAPA Eastern Amazon) implemented this Technological Reference Unit in 2010, in partnership with the farmer, to introduce an integrated livestock production system in Western Pará, considering the context of low-carbon emission actions in the Amazon under the scope of the ABC Program [3].
The climate in the region is classified as Am3, according to the Köppen methodology adapted by Martorano et al. [33], with rainfall depths in the least rainy month below 60 mm, annual rainfall depths between 2000 and 2500 mm, and a mean temperature of 25.2 °C, with maximum of 29.4 °C to 29.9 °C and minimum of 20.6 to 21.2 °C [34]. The area is monitored by the Belterra meteorological station (Brazilian National Institute of Meteorology—Code 82246) (Figure 1). The soil of the area was classified as Typic Hapludox of clay texture (Latossolo Amarelo) [35].
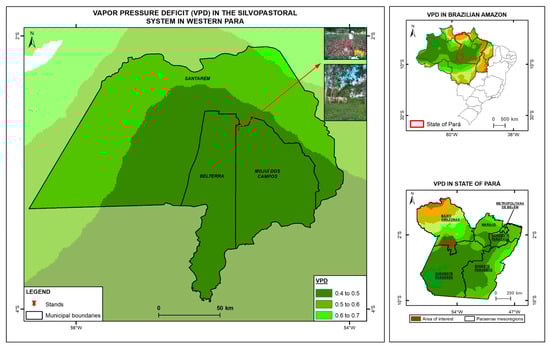
Figure 1.
Map of vapor pressure deficit in the study area in Mojuí dos Campos, Pará, Brazil, highlighting the Nossa Senhora Aparecida Farm in 2024.
2.2. Experimental Plot
The experiment was conducted in six contiguous areas of 0.92 ha with integrated systems (Figure 2) containing the following silvopastoral arrangements: (1) Khaya grandifoliola C. DC + pasture; (2) Dipteryx odorata (Aubl.) Willd + pasture; and (3) Bertholletia excelsa H.B.K + pasture. The area was kept only with pasture before the implementation of the systems. The implementation of the crop–livestock–forest integration system was carried out after soil analysis, focused on characterizing the area for creating a Technological Reference Unit.
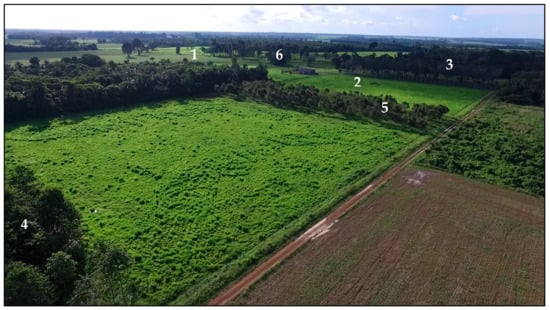
Figure 2.
Distribution of study areas, 1. degraded pasture; 2. productive pasture; 3. Khaya grandifoliola + pasture; 4. Bertholletia excelsa + pasture; 5. Dipteryx odorata + pasture; and 6. agroforestry system. Image of the Technological Reference Unit, captured with a drone in 2019.
The soil presented the following characteristics: pH = 5.26, organic matter = 30.66 g kg−1, Al3+ = 0.43 cmolc dm−3, Ca2+ = 2.96 cmolc dm−3, Mg+ = 0.93 cmolc dm−3, potassium 0.13 cmolc dm−3, phosphorus 2.17 mg dm−3, sum of bases = 4.08 cmolc dm−3, cation exchange capacity = 4.51 mmolc dm−3, and base saturation = 37%, according to the methodology described by Embrapa (2011). In the first year, the forest species were intercropped with agricultural crops in a spacing of 7 × 5 m, using 280 plants of each forest species. Detailed information on the history of the experimental area and the implementation of experimental units was described by Cândido et al. [36] and Silva et al. [37].
The surroundings of the area were composed of fallow areas with spontaneous vegetation and fruit tree species, termed an agroforestry system, mainly with remnant mango trees (Mangifera indica L.) and Brazil nut trees (Bertholletia excelsa H.B.K). The intercalated areas were composed of productive pasture (Panicum maximum cv. Mombaça) and pasture with evidence of degradation, low yield, and excessive presence of weeds (>40%), characterized as degradation level 3 (strong), and low amounts of forage, called degraded pasture, according to the classification of Dias Filho [38], predominantly comprising Panicum maximum cv. Mombaça.
2.3. Characteristics of the Areas
Silva et al. [37] evaluated the soil in these integrated tree systems with an emphasis on aggregate stability, soil density, particle density, and total porosity. Additionally, total carbon and nitrogen contents and stocks were analyzed, and the results of the parcels were compared with those found for the native forest and adjacent agricultural area. This study indicated that the native forest had the highest percentage of macroaggregates, similar to the parcel with K. grandifoliola. Carbon stocks in the soil surface layer (0–0.10 m) were more significant in the agricultural area and in the D. odorata + pasture area. Nitrogen stocks in the native forest were more significant, followed by the areas with K. grandifoliola and D. odorata. The pasture area had greater carbon contents in the layers of 0–0.10 and 0.10–0.20 m compared to the other integrated systems. They also reported a significant effect of the different vegetation covers on nutrient dynamics and soil structure, providing indicators that integrated systems are sustainable management strategies in production systems with low-carbon emissions in the Amazon.
Although no other management practices were carried out in the parcels with tree components after the conclusion of the project with an integrated crop–livestock–forest system, D. odorata trees showed a significant growth in diameter and height in the area, with straight trunk lengths, efficient natural branch fall, and satisfactory phytosanitary conditions, without compromising the overall stand structure [39]. These results indicate that, despite the absence of forestry practices, D. odorata trees exhibited developmental responses, denoting the high performance of this species and its robustness and productivity, which add potential benefits for sustainable management and long-term yield.
Dos Santos et al. [40] compared carbon contents in leaves, branches, and trunks of B. excelsa, D. odorata, and K. grandifoliola and found that D. odorata had the highest carbon contents in leaves (52.14%), similar to that found for B. excelsa leaves (50.68%). Additionally, they found that K. grandifoliola stores a greater carbon content in the trunk, reaching 49.01%. These results denote significant variations in carbon contents among different components that compose a silvopastoral system.
Cândido et al. [36] evaluated the microclimatic conditions in this silvopastoral system and compared it with a full-sun pasture (open field). The results showed that the silvopastoral system that had an exotic forest species, i.e., K. grandifoliola, significantly reduced the ambient temperature due to its canopy. This reduction was attributed to the shading of trees, which results in a microclimate more suitable for animal thermal comfort and may explain the absence of grass species in the parcel with K. grandifoliola. The choice of forest species can affect not only thermal conditions but also provide other benefits and environmental services, highlighting the multifunctionality of the system, combining animal production and environmental conservation.
2.4. Sampling, Concentrations, and Fluxes of CO2 and CH4
The sampling design in this research was based on the following question: What is the effect of vegetation cover on CO2 and CH4 fluxes and concentrations at the biosphere–atmosphere interface? Figure 3 shows a schematic diagram of how the field actions were established. All soil cover types were evaluated in April, June, August, and October 2020. The collections in these months were carried out considering the seasonality of climate conditions, focusing on evaluating the responses associated with the effects of weather and climate conditions on CO2 and CH4 fluxes and concentrations in this region.
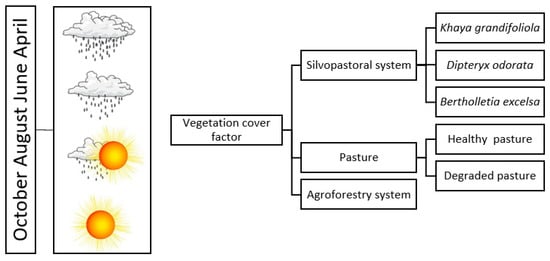
Figure 3.
Sampling design for evaluations of CO2 and CH4 fluxes and concentrations in the Technological Reference Unit with a silvopastoral system, Mojuí dos Campos, Pará, Brazil.
Gases emitted from the soil were measured for analysis of concentration, as conducted by Furtado Neto [41], and for determination of CO2 and CH4 emission/absorption rates at the soil–atmosphere interface at five randomly chosen points in each area, using polyvinyl chloride (PVC) rings. A flux chamber was coupled to these rings, and the CO2 and CH4 emissions from the soil were measured for 240 s in each reading (Figure 4). Each of the five points was composed of three readings, and the device was calibrated facing the atmosphere at each reading interval. The four meters from the edge of each area were not evaluated to exclude the edge effect. In August, the device did not collect CH4 concentration and flux data in the degraded pasture area.
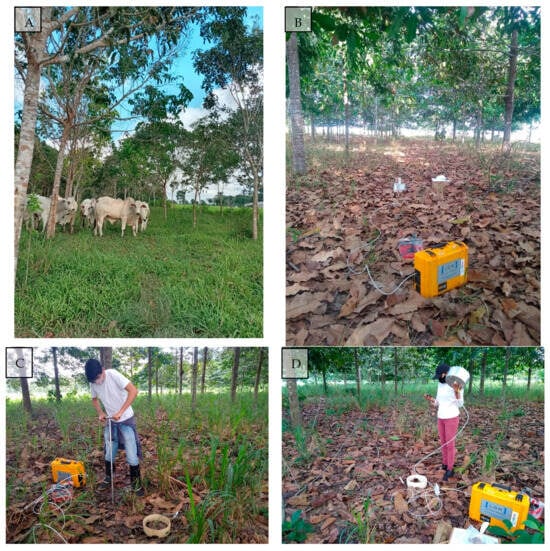
Figure 4.
(A) Silvopastoral system with D. odorata in October, (B) ultraportable greenhouse gas analyzer in the area with Bertholletia excelsa in October, (C) soil collection for moisture determination in the area with B. excelsa in June, (D) calibration of the ultraportable greenhouse gas analyzer between readings in the area with B. excelsa in June.
The ultraportable greenhouse gas analyzer used to measure the gases (915–0011; Los Gatos Research, Mountain View, CA, USA) had a nominal measurement range of 1 to 20,000 ppm for CO2, 0.01 to 100 ppm for CH4, and 500 to 70,000 ppm for water vapor, according to the manufacturer, with accuracies of ±300 ppb (CO2), ±2 ppb (CH4), and ±100 ppm (H2O), and a maximum data recording frequency of 1 Hz. The main components of the device’s internal gas circuit are the laser chamber, the circulation pump, and the vacuum regulator. The pump has a nominal flow rate of 0.5 L min−1. The gas circuit includes a particle filter to protect the mirrors. The partial vacuum (18.7 kPa) in the laser chamber is maintained by a flow regulator combined with a one-way valve. The real-time output of the device can be viewed on a laptop, tablet, or smartphone via a wireless connection, or on a monitor screen via direct connection. The data are stored internally and can be transferred to a portable storage device [42]. There was no intercalibration of concentrations in the device.
Environmental variables were measured using a portable anemometer (TS-301- manufacturer: TOPTES, USA) for wind speed and air temperature, and a thermometer (TP101 ZH90—manufacturer: Smart Kits—Fortaleza, Brazil) for soil temperature. Undisturbed soil samples were collected at each reading point using a Dutch auger (manufacturer: MM Inox—Piracicaba, Brazil) for determining soil moisture. The soil fresh weight was measured and, then, the soil was dried in a forced air circulation oven at 105 °C until a constant weight was reached to obtain the dry weight and calculate the soil moisture using Equation (1).
2.5. Analysis of CO2 and CH4 Flux Measurements
The results of the measurements with the ultraportable greenhouse gas analyzer and the chamber geometry were used to calculate the diffusive flux at the soil surface through the ideal gas law (Equation (2)) adapted from Goldenfum [43], estimating CO2 and CH4 fluxes in the area.
where F is the flux (mmol h−1), A is the basal area of the chamber (), V is the volume of the chamber (), is the slope of the line (mL h−1), P is the atmospheric pressure (atm), R is the ideal gas constant (atm L mol K−1), and T is the air temperature (°C).
The data were arranged in LibreOffice Calc (Version 7.6) and exported as text (txt); the RStudio (Version 4.1.2) tool, a language R compilator (Version 4.4.4), was used for flux calculations. The program R is interactive, thus allowing for the insertion of information about collections, such as time, location, and area of the data collection. Then, the data for compilation, i.e., the information related to Equation (2), were then entered.
The lines are demarcated according to the reading time of each measurement after all the information is entered into the program, as shown in Figure 5; Equation (2) is then applied to calculate the mean concentrations and fluxes of CO2 and CH4.
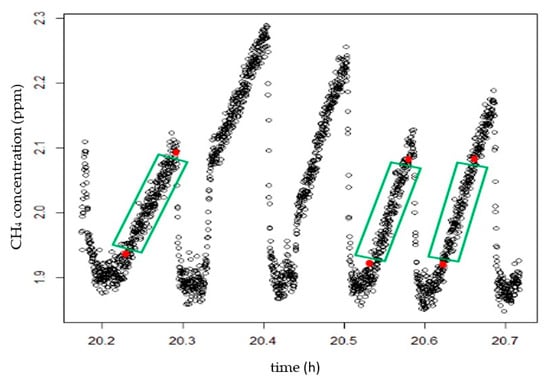
Figure 5.
Delineation of the reading lines.
2.6. Statistical Analysis
The data were tested for the assumptions of analysis of variance (ANOVA). The normality of residues was assessed using the B-Wilk test [44], and the homogeneity of the variance of the residuals was assessed using the Bartlett test [45] for each source of variation. Since none of the variables simultaneously met the assumptions of the ANOVA, non-parametric analysis was used.
The Kruskal–Wallis test [46] was used as a substitute for one-way ANOVA to assess whether treatment groups shared the same distribution, i.e., the null hypothesis () tested was that the populations tend to have similar values for a variable. The alternative hypothesis of the test () is that at least two populations have different values for a variable. In this step, individual analyses were performed for each source of variation: area, month, and the interaction between area and month (area × month).
Subsequently, Dunn’s test [47] was applied; it is commonly used after the Kruskal–Wallis test when its result is significant. The objective was to identify which groups shared the same distribution. The p-value was calculated based on the standard normal distribution and adjusted using the Bonferroni correction. The significance level was α = 0.05 for all variables.
Principal component analysis (PCA) was also performed to investigate correlations between variables. All variables were standardized to unit variance for preventing the magnitude of one variable from affecting the analysis. The result of the analysis was represented in a biplot graph [48].
All analyses were conducted in the program R; the rstatix package (version 1.0.7) [49] was used for the Kruskal–Wallis test; the PMCMRplus package (version 1.9.6) [50] was used for Dunn’s test; and the graphs were developed using the ggplot2 package (version 3.5.0) [51].
3. Results
3.1. Area Effect on CO2 and CH4 Concentrations and Fluxes
The mean, standard deviation, median, minimum, and maximum values comparing the areas are shown in Table 1. The highest mean CO2 concentration and CO2 flux were found in the degraded pasture area and the lowest in the B. excelsa + pasture area.

Table 1.
Mean, median, minimum, and maximum, and standard deviation (SD) values for CO2 and CH4 concentrations and fluxes in areas with different uses. Mojuí dos Campos, Pará, Brazil, 2020.
The highest mean CH4 concentration was found in the K. grandifoliola + pasture area, followed by the degraded pasture area. The species K. grandifoliola has a different development cycle to the other species due to its rapid growth and size. The pasture and weed species in the K. grandifoliola + pasture area had less development compared to the D. odorata + pasture area and even to the B. excelsa + pasture area, which has the largest canopy area compared to the other integrated species and, consequently, has the lowest entry of sunlight into the system [36].
The highest mean CH4 flux was found in the agroforestry area and the lowest in the B. excelsa + pasture area, denoting CH4 capture from the atmosphere in this area.
Figure 6 shows the boxplots with significant differences between the areas evaluated. The CO2 concentrations are shown in Figure 6A and the CO2 fluxes are in Figure 6B. The lowest CO2 concentration and flux were found for the B. excelsa + pasture area, with no significant difference from the K. grandifoliola + pasture area, but differed significantly from the other areas. The highest CO2 concentration and flux was found for the degraded pasture area, with no significant difference from the D. odorata + pasture area. The areas with agroforestry, productive pasture, and D. odorata + pasture did not differ significantly from each other; the areas with agroforestry, productive pasture, and K. grandifoliola + pasture did not differ significantly from each other.
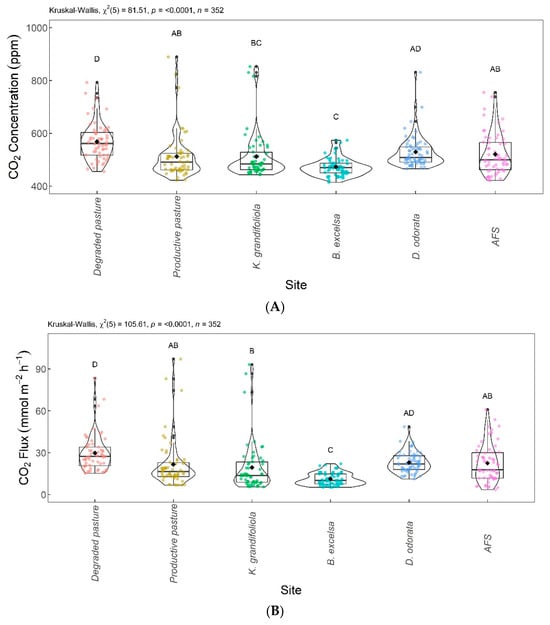
Figure 6.
Comparison of CO2 concentrations (A) and CO2 fluxes (B) among integrated systems with Bertholletia excelsa, Dipteryx odorata, and Khaya grandifoliola, agroforestry system (AFS), productive pasture, and degraded pasture. Systems with the same letter are not significantly different from each other according to Dunn’s test at a 5% significance level. Each colored point represents one reading by an ultraportable greenhouse gas analyzer.
Figure 7 shows the significant differences in CH4 among the areas evaluated. The CH4 concentrations and fluxes are shown in Figure 7A and Figure 7B, respectively. Regarding CH4 concentrations, the B. excelsa + pasture, agroforestry system (AFS), productive pasture, and D. odorata + pasture areas were not significantly different from each other; the B. excelsa + pasture, AFS, degraded pasture, and K. grandifoliola + pasture areas had no significant difference in CH4 concentration. The productive pasture and D. odorata + pasture areas were significantly different from the degraded pasture and K. grandifoliola + pasture areas, the latter presenting the highest CH4 concentrations. The CH4 fluxes from the areas were not significantly different.
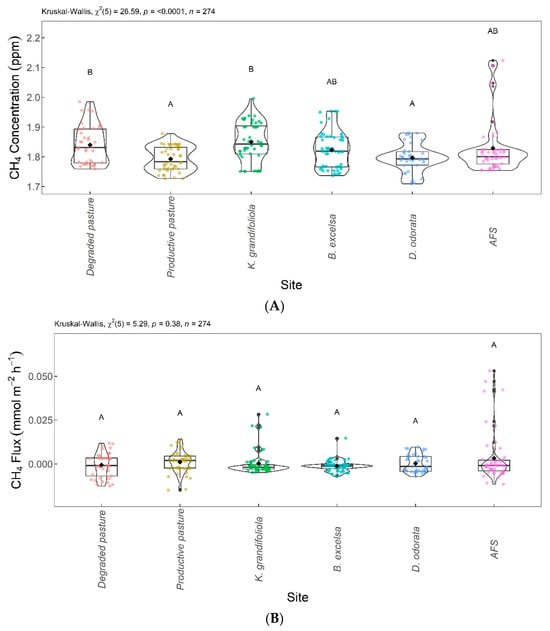
Figure 7.
Comparison of CH4 concentrations (A) and CH4 fluxes (B) among integrated systems with Bertholletia excelsa, Dipteryx odorata, and Khaya grandifoliola, agroforestry system (AFS), productive pasture, and degraded pasture. Systems with the same letter are not significantly different from each other according to Dunn’s test at a 5% significance level. Each colored point represents one reading by an ultraportable greenhouse gas analyzer.
3.2. Evaluation Time Effect on CO2 and CH4 Concentrations and Fluxes
The mean, median, minimum, maximum, and standard deviation values for CO2 and CH4 concentrations and fluxes in the different evaluated months are shown in Table 2. CO2 and CH4 concentrations and fluxes showed a general decreasing trend over the evaluated months, with the highest CO2 and CH4 concentrations and fluxes found in April and June and the lowest values in October 2020.
Table 2.
Mean, median, minimum, maximum, and standard deviation (SD) values for CO2 and CH4 concentrations and fluxes in the different evaluated months. Mojuí dos Campos, Pará, Brazil, 2020.
CO2 concentrations and fluxes showed significant differences among groups according to the Kruskal–Wallis test (p < 0.005). Thus, the null hypothesis () was rejected, as the results showed that at least one group was different from the others. The Dunn test showed significant differences in CO2 concentrations and fluxes between June and October.
Figure 8 shows the boxplots with these significant differences among the evaluation months. CO2 concentrations and fluxes are shown in Figure 8A,B, respectively. Despite a decreasing trend over the evaluated months, the CO2 concentrations and fluxes in April, June, and August were not significantly different from each other, and in April, August, and October, they did not differ significantly from each other.
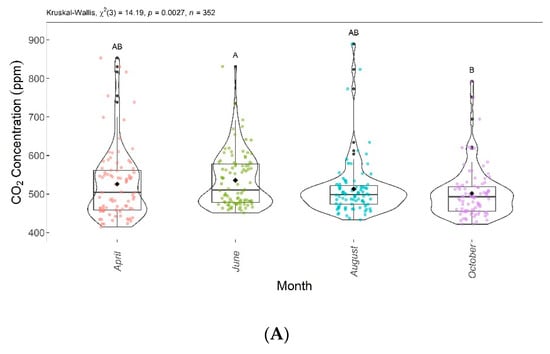
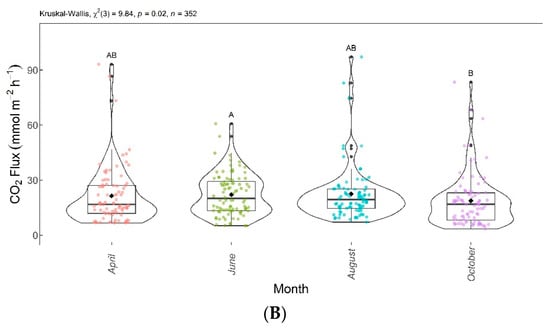
Figure 8.
Comparison of CO2 concentrations (A) and CO2 fluxes (B) found in April, June, August, and October 2020. Months with the same letter are not significantly different from each other according to Dunn’s test at a 5% significance level. Each colored point represents one reading by an ultraportable greenhouse gas analyzer.
Figure 9 shows the significant differences in CH4 between the evaluated months. CH4 concentrations and fluxes are shown in Figure 9A,B, respectively. The Dunn test showed significant differences between April, August, and October. June and October were also significantly different from each other. The CH4 concentrations and fluxes reduced over the evaluated months. August and October presented no emissions, as there were CH4 captures from the atmosphere during this period.
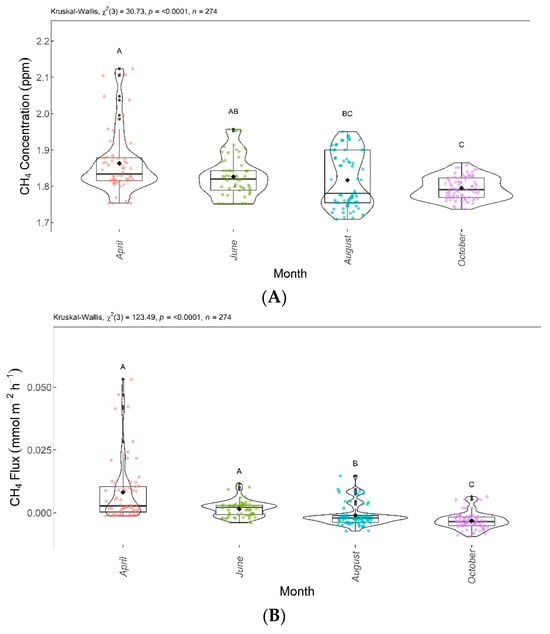
Figure 9.
Comparison of CH4 concentrations (A) and CH4 fluxes (B) found in April, June, August, and October 2020. Months with the same letter are not significantly different from each other according to Dunn’s test at 5% significance level. Each colored point represents one reading by an ultraportable greenhouse gas analyzer.
3.3. Interaction between Area and Evaluation Months for CO2 and CH4 Concentrations and Fluxes
Figure 10 shows the differences in the CO2 concentrations (Figure 10A) and fluxes (Figure 10B) according to the interaction between the areas and months evaluated.
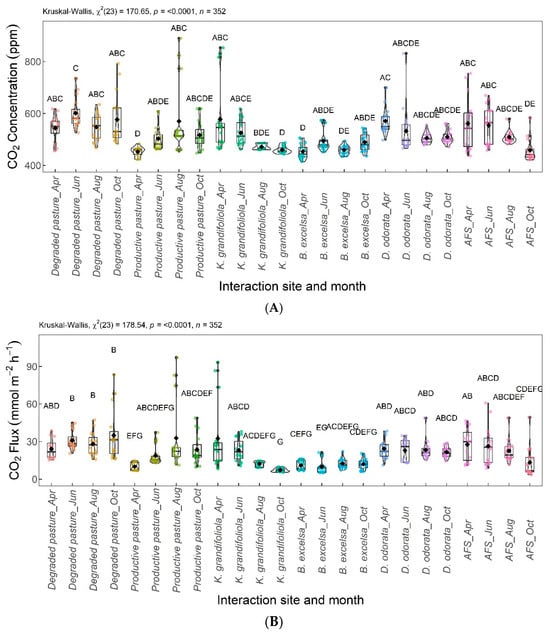
Figure 10.
Interaction between area and month (area × month) for CO2 concentration (A) and CO2 flux (B). Areas–months with the same letter are not significantly different from each other according to Dunn’s test at a 5% significance level. Each colored point represents one reading by an ultraportable greenhouse gas analyzer.
Figure 11 shows the differences in the CH4 concentrations (Figure 11A) and fluxes (Figure 11B) according to the interaction between the areas and months evaluated.
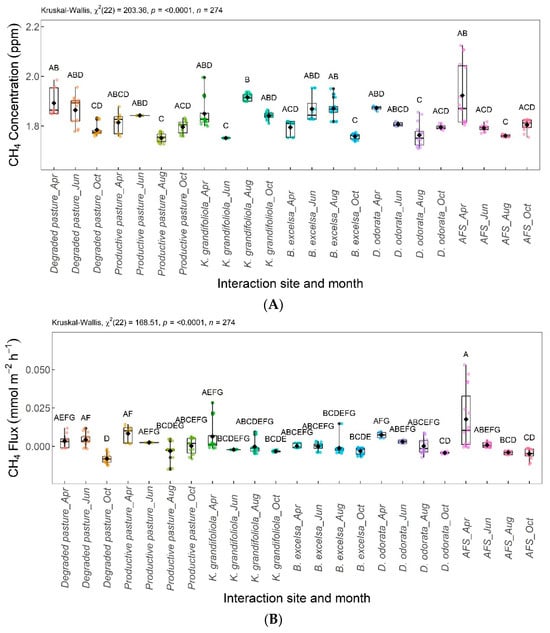
Figure 11.
Interaction between area and month (area × month) for CH4 concentration (A) and CH4 flux (B). Areas–months with the same letter are not significantly different from each other according to Dunn’s test at a 5% significance level. Each colored point represents one reading by an ultraportable greenhouse gas analyzer.
3.4. Principal Component Analysis (PCA)
The first values of the principal component analysis (PCA) for the CO2 concentration and flux in the areas and months evaluated are shown in Figure 12A.
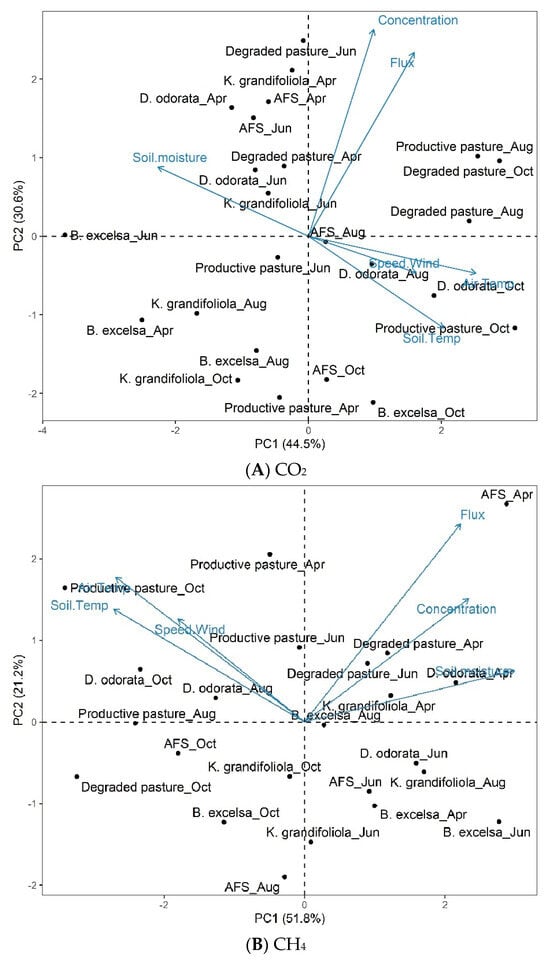
Figure 12.
Biplot (PC1 and PC2) for CO2 concentration and flux (A), CH4 concentration and flux (B), and environmental variables (soil temperature, air temperature, wind speed, and soil moisture) in the interaction between area and month in silvopastoral (Bertholletia excelsa, Dipteryx odorata, and Khaya grandifoliola), pasture (productive pasture and degraded pasture), and agroforestry (AFS) systems in April, June, August, and October 2020. Confidence ellipse = 95%.
The number of principal components (PCs) was determined considering the first two PCs generated by the analyses that had a variance percentage > 70%, as, according to the assumptions of Rencher [52], at least 70% of the total variance should be explained by the first (PC1) and second PC (PC2).
The PCA identified associations between variables and established common factors among them. PC1 and PC2 explained 75.1% of the total variance (Figure 12A), with PC1 accounting for 44.5% and PC2 for 30.6%, denoting that they effectively explained the standard variance of the variable set.
The interaction between the areas and months showed that the points at the center are close to the overall mean, the rightmost points are above the overall mean, and the leftmost points are below the overall mean. The CO2 concentration and flux are strongly correlated. Environmental variables (soil moisture, wind speed, air temperature, and soil temperature) are weakly correlated with the CO2 concentration and flux.
The results of the second PCA (PCA2), comparing data from the interaction between the area and month, showed a correlation with environmental variables for CH4 (Figure 12B). The first two PCs of PCA2 explained 73.0% of the total variance, with PC1 accounting for 51.8% and PC2 for 21.2% of the data variance.
The CH4 concentration and flux are positively correlated with soil moisture and weakly correlated with the other environmental variables (wind speed, air temperature, and soil temperature).
Regarding CO2 (Biplot A), in the first quadrant, the productive pasture-Aug, degraded pasture-Oct, and degraded pasture-Aug groups had high CO2 fluxes and concentrations. In the second quadrant, the degraded pasture-Jun, K.grandifoliola-Apr, AFS-Apr, D. odorata-Apr, AFS-Jun, degraded pasture-Apr, D.odorata-Jun, and K.grandifoliola-Jun groups had a high soil moisture and low wind speed, air temperature, and soil temperature. In the third quadrant, the productive pasture-Jun, K.grandifoliola-Aug, B. excelsa-Apr, B. excelsa-Aug, K. grandifoliola-Oct, and productive pasture-Apr groups had low CO2 concentrations and fluxes. In the fourth quadrant, the D. odorata-Aug, D. odorata-Oct, productive pasture-Oct, AFS-Oct, and B.excelsa-Oct groups had a high wind speed, air temperature, and soil temperature, and low soil moisture. The B. excelsa-Jun group presented characteristics of both quadrants II and III.
Regarding CH4 (Biplot B), in the first quadrant, the AFS-Apr, degraded pasture-Apr, degraded pasture-Jun, D. odorata-Apr, and K. grandifoliola-Apr groups presented high CH4 fluxes and concentrations, soil temperature, and soil moisture. In the second quadrant, the productive pasture-Apr, productive pasture-Aug, productive pasture-Oct, productive pasture-Jun, D. odorata-Oct, and D. odorata-Aug groups had a high wind speed, air temperature, and soil temperature. In the third quadrant, the AFS-Oct, K. grandifoliola-Oct, degraded pasture-Oct, B.excelsa-Oct, and AFS-Aug groups had low CH4 fluxes and concentrations, soil temperature, and soil moisture. In the fourth quadrant, the D odorata-Jun, K. grandifoliola-Aug, AFS-Jun, B. excelsa-Apr, B excelsa-Jun, and K. grandifoliola-Jun groups had a low wind speed, air temperature, and soil temperature. The productive pasture-Aug group presented characteristics of both quadrants II and III.
4. Discussion
4.1. Area Effect on CO2 and CH4 Concentrations and Fluxes
Emissions due to changes in land use are highly heterogeneous in Brazil and across different soil uses. They are generally higher in the Amazon biome due to deforestation [53].
The B. excelsa and K. grandifoliola areas were the best mitigators of CO2 emissions. Torres et al. [54] evaluated agroforestry systems in southeastern Brazil and found that these systems can sequester CO2 from the atmosphere and help reduce greenhouse gas emissions. Silva et al. [55] evaluated agroforestry systems in the Eastern Amazon and concluded that more diversified systems present a better environmental quality.
In addition to the capacity of the tree species B. excelsa and K. grandifoliola in the silvopastoral system to mitigate the CO2 concentration and flux in the soil–atmosphere system, carbon is fixed throughout the development of the trees, which were 10 years old when the collections were carried out. Oliveira et al. [6] evaluated the growth period of eucalyptus trees in a silvopastoral system (8 years) and found that the carbon fixed in tree trunks neutralized CO2 emissions of 9.4 AU ha−1 [1 AU (animal unit) = 450 kg]; considering only the carbon in the wood resulting from wood processing, eight-year-old eucalyptus trees (165 trees ha−1) neutralized CO2e emissions of 2.3 AU ha−1 in the silvopastoral system.
According to Ramos [56], conservation management systems, such as silvopastoral with productive pastures, have soil attributes favorable to the maintenance of soil carbon due to their low CO2 fluxes; thus, these systems are indicated for carbon capture and storage and, consequently, the mitigation of the greenhouse effect.
The mean soil CH4 production found was within the global mean for this gas in the atmosphere, which is 1.800 ppm [57] and 1.813 [58]. It was also below that found in studies conducted in the Tapajós National Forest, which is a federal conservation unit in the Amazon, in Belterra, PA, Brazil. The mean soil CH4 production in the Tapajós National Forest was 2.291 ± 0.340 ppm [41]. Oliveira Junior [59] found values 39% and 59% higher than the concentration of 2 ppm in this area in the dry and wet seasons, respectively, at the depth of 5 cm.
The CH4 production found in the present study was higher in areas with degraded pasture and K. grandifoliola + pasture, however with no significant differences in CH4 fluxes (Figure 7). The K. grandifoliola + pasture area produces less litterfall compared to the other integration areas, explaining its higher CH4 concentration (Figure 4).
Removing CO2 from the atmosphere is as important as reducing emissions. In this case, productive pastures are important for the stock of atmosphere carbon in the soil through the photosynthesis of tropical grasses, which are very efficient at this function. The K. grandifoliola + pasture area stores carbon due to the rapid plant growth. Despite being an exotic species, K. grandifoliola has high production potential in the Amazon and a favorable balance of greenhouse gas emissions due to its good adaptation to the edaphoclimatic conditions of the region.
4.2. Evaluation Time Effect on CO2 and CH4 Concentrations and Fluxes
The decreasing trend in CO2 concentration and flux over the study period showed greater emissions in the rainiest months. Silva et al. [55] evaluated the temporal variation in the CO2 flux from the soil in agroforestry systems with oil palm in the Eastern Amazon and found that the CO2 flux was affected by the rainfall seasonality and was greater in the rainy season.
According to Zanchi et al. [60], the highest soil respiration rate in the rainy season in the Amazon region may be due to increased productivity during this period, which can positively affect the respiration of roots and soil microorganisms, which find favorable conditions for the decomposition of organic matter; this contributes to litterfall accumulation on the soil during the dry season and to the increase in soil moisture during the rainy season.
The CH4 concentration and flux decreased over the study period (April to October). The CH4 flux was affected by the rainfall dynamics in the region, as April has the highest rainfall depths and October the lowest within this period. The CH4 emissions decreased with decreasing rainfall depths. According to Saggar et al. [61], CH4 emissions are connected to soil moisture, rainfall, and air and soil temperatures.
Siqueira Neto et al. [62] found a positive correlation between the soil moisture and CH4 emissions in a no-tillage system. According to Mazzetto et al. [63], rainfall tends to result in an increase in soil pores filled with water, limiting the O2 diffusion in the soil profile. This increase can provide sites of anaerobiosis due to increased soil moisture, which, combined with an increased soil density, reduces O2 diffusion; additionally, microbial activity increases under high temperatures and, consequently, CH4 fluxes increase [64].
4.3. Interaction between Area and Evaluation Time on CO2 and CH4 Concentrations and Fluxes
The analysis of the interaction between the concentrations and fluxes of CO2 and CH4 showed the dynamics of these gases in each area and period evaluated. Despite the effects of the areas and months of the year, the interaction did not show a decreasing trend. This is also due to the complex dynamics of the system. For example, although the trees contributed to reductions in emissions, they resulted in environments that retain moisture, which are correlated to high emissions, as shown in the present study.
4.4. Principal Component Analysis (PCA)
The CH4 concentrations and fluxes were more sensitive to soil moisture than the CO2 concentrations and fluxes. Siqueira Neto et al. [62] found a significant correlation between the soil moisture and increased methane fluxes in a no-tillage system and in Cerrado vegetation, but not for pasture areas (Brachiaria sp.). However, they found a higher soil moisture in the no-tillage system and Cerrado vegetation than in pasture and conventional tillage areas; they attributed this result to the presence of plant residues on the soil surface, which act as a physical barrier to soil moisture loss during the dry season.
The conversion of degraded pasture areas into integrated crop–livestock–forest systems has decreased greenhouse gas emissions in the Amazon over 10 years of implementation. The implementation of integrated crop–livestock–forest systems in long-deforested areas with degraded pastures and low production capacity has shown a high potential for changes focused on developing sustainable agriculture in the Amazon.
This research provides support for decision making on the implementation of conservation agriculture systems in the Amazon and the production of high-value-added natural products in the market, such as Brazil nuts (B. excelsa) and tonka beans (D. odorata), which cause a low impact on greenhouse gas emissions and can improve the local economy. Further research is recommended in this context for this region, mainly with the purpose of investigating strategies for the rational use of natural resources for agricultural production, considering the current climate crisis scenario.
5. Conclusions
Areas with Bertholletia excelsa and Khaya grandifoliola were better mitigators of CO2 emissions, as the highest emissions were found for the degraded pasture area. Regarding the study period, the highest emissions were found in the rainiest months.
The CH4 production was higher in the degraded pasture and K. grandifoliola + pasture areas, however with no significant differences in the CH4 fluxes. The CH4 concentrations and fluxes decreased over the study period (April to October 2020), indicating that the CH4 emissions were affected by rainfall dynamics in the region.
The CH4 concentrations and fluxes were more sensitive to soil moisture than the CO2 concentrations and fluxes. Removing CO2 from the atmosphere is as important as reducing emissions. Thus, productive pastures are important for the stock of atmosphere carbon in the soil through the photosynthesis of tropical grasses, which are significantly efficient at this function.
K. grandifoliola is an exotic species with rapid growth and good adaptation to the edaphoclimatic conditions of the Amazon region and has high production potential in the Western Amazon. Degraded pasture soils have high CO2 and CH4 emissions and can be converted into sustainable agricultural areas in the Amazon with environmental and economic advantages.
Author Contributions
Conceptualization, A.C.T.F.C. and L.G.M.; methodology, A.C.T.F.C., T.A.d.S. and S.S.N.F.C.; validation, L.G.M., P.C.C.F. and J.M.S.d.M.; formal analysis, A.C.T.F.C., W.N. and C.T.d.S.D.; investigation, A.C.T.F.C., T.A.d.S., B.U.F.C. and S.S.N.F.C.; resources, A.C.T.F.C.; data curation, C.T.d.S.D.; writing—original draft preparation, A.C.T.F.C. and W.N.; writing—review and editing, L.G.M., R.T., A.R.S., P.C.C.F., M.B.D.-F., J.M.S.d.M. and T.P.B.; visualization, L.S.S.L., R.G.d.A., L.G.M. and T.P.B.; supervision, A.C.T.F.C. and L.G.M.; project administration, A.C.T.F.C. and L.G.M. All authors have read and agreed to the published version of the manuscript.
Funding
This research received no external funding.
Data Availability Statement
Data is contained within the article.
Acknowledgments
We thank the Fundação Coordenação de Aperfeiçoamento de Pessoal de Nível Superior—CAPES for granting the scholarship to the first author and for the financial support for the acquisition of materials used in the research. The Federal University of Western Pará (UFOPA), for the opportunity offered through the Graduate Program, the Coordinator of the “Society, Nature and Development” program Antônio Humberto H. Minervino for his dedication. We are sincerely grateful to Nossa Senhora Aparecida Farm, which, in addition to the availability of the area, contributes support to the progress of the research. We would like to thank José Mauro Sousa de Moura for the loan of the equipment used.
Conflicts of Interest
Author Arystides Resende Silva was employed by the company Brazilian Agricultural Research Corporation (EMBRAPA Maize and Sorghum). Author Paulo Campos Christo Fernandes was employed by the company Brazilian Agricultural Research Corporation (EMBRAPA Cerrados). Author Moacyr Bernardino Dias-Filho was employed by the company Brazilian Agricultural Research Corporation (EMBRAPA Eastern Amazon). Author Leila Sheila Silva Lisboawas employed by the company SEMEC. Author Roberto Giolo de Almeida was employed by the company Brazilian Agricultural Research Corporation (EMBRAPA Beef Cattle). Author Lucieta Guerreiro Martorano was employed by the company Brazilian Agricultural Research Corporation (EMBRAPA Eastern Amazon). The remaining authors declare that the research was conducted in the absence of any commercial or financial relationships that could be construed as a potential conflict of interest.
References
- Nan, L.; Shang, L.; Zhixin, Y.; Jiang, Y. Estimation of agricultural greenhouse gases emission in interprovincial regions of China during 1996–2014. Nat. Hazards 2020, 100, 1037–1058. [Google Scholar] [CrossRef]
- Ministério da Ciência Tecnologia e Inovações. Inventário Nacional de Emissões e Remoções de Gases de Efeito Estufa (GEE) da Quarta Comunicação Nacional do Brasil–Emissões por Subsetor; Emissões de GEE por Subsetor: Português, Brasil, 2021. Available online: https://antigo.mctic.gov.br/mctic/export/sites/institucional/arquivos/SIRENE/Comunicacoes-Nacionais-do-Brasil-a-UNFCCC/2020_12_22_4CN_v5_PORT_publicada.pdf (accessed on 30 August 2023).
- EMBRAPA, Brazilian Agricultural Research Corporation. ABC Sector Plan–Sector Plan for Mitigation and Adaptation to Climate Change for the Consolidation of a Low-Carbon Economy in Agriculture. 2022. Available online: https://www.embrapa.br/en/tema-agricultura-de-baixo-carbono/sobre-o-tema (accessed on 30 August 2023).
- Ministério da Agricultura Pecuária e Abastecimento. Plano ABC+. 2021. Available online: https://www.gov.br/agricultura/pt-br/assuntos/sustentabilidade/plano-abc/arquivo-publicacoes-plano-abc/abc-english.pdf/view (accessed on 30 August 2023).
- Global Methane Pledge. Available online: https://www.globalmethanepledge.org/ (accessed on 23 August 2023).
- Oliveira, P.P.A.; Pezzopane, J.R.M.; Berbardi, A.C.C.; Garcia, A.R.; Berndt, A.; Pedroso, A.F.; Januário, A.L.; Medeiro, L.S.R. Potencial de Produção de Carne Carbono Neutro por Bovinos Machos da Raça Nelore em Sistema Silvipastoril com Capim-Piatã e Eucalipto: Embrapa Pecuária Sudeste-São Carlos, SP. ISSN 1980-6841, Abril, 2022. Documentos 142, Embrapa. Available online: https://ainfo.cnptia.embrapa.br/digital/bitstream/doc/1142219/1/Documentos142.pdf (accessed on 27 August 2023).
- IPCC. Summary for Policymakers. In Climate Change 2022: Impacts, Adaptation and Vulnerability. Contribution of Working Group II to the Sixth Assessment Report of the Intergovernmental Panel on Climate Change; Cambridge University Press: Cambridge, UK; Cambridge University Press: New York, NY, USA, 2022; Available online: https://www.cambridge.org/core/books/climate-change-2022-impacts-adaptation-and-vulnerability/summary-for-policymakers/016527EADEE2178406C4A7CE7DEAEACA (accessed on 30 August 2023).
- Artaxo, P. Mudanças climáticas e o Brasil. Rev. USP 2014, 103, 8–12. [Google Scholar] [CrossRef]
- Giller, K.E.; Delaune, T.; Silva, J.V.; Descheemaeker, K.; van de Ven, G.; Schut, A.G.T.; van Wijk, M.; Hammond, J.; Hochman, Z.; Taulya, G.; et al. The future of farming: Who will produce our food? Food Sec. 2021, 13, 1073–1099. [Google Scholar] [CrossRef]
- Sakita, G.Z.; Lima, P.M.T.; Abdalla Filho, A.L.; Bompadre, T.F.V.; Ovani, V.S.; Chaves, C.M.S.; Bizzuti, B.E.; Costa, W.S.; Paim, T.P.; Campioni, T.S.; et al. Treating tropical grass with fibrolytic enzymes from the fungus Trichoderma reesei: Effects on animal performance, digestibility and enteric methane emissions of growing lambs. Anim. Feed Sci. Technol. 2022, 286, 115253. [Google Scholar] [CrossRef]
- Fearnside, P.M. Environmente: Deforestation soars in the Amazon. Nature 2015, 521, 423. [Google Scholar] [CrossRef]
- Nepstad, D.; McGrath, D.; Stickler, C.; Alencar, A.; Azevedo, A.; Swette, B.; Bezerra, T.; DiGiano, M.; Shimada, J.; Motta, R.; et al. Slowing Amazon deforestation through public policy and interventions in beef and soy supply chains. Science 2014, 344, 1118–1123. [Google Scholar] [CrossRef]
- Ferreira Junior, M.J.A.; Oliveira Junior, R.C.; Silva, R.; Moura, J.M.S.; Furtado Neto, A.; Ponte, M.X.; Beldini, T.P. Assessing the impact of different tillage systems and land uses on CO2-C emissions in Eastern Amazonia. Afr. J. Agric. 2017, 12, 2427–2441. [Google Scholar] [CrossRef]
- Kim, D.G.; Kirschbaum, M.U. The effect of land-use change on the net exchange rates of greenhouse gases: A compilation of estimates. Agric. Ecosyst. Environ. 2015, 208, 114–126. [Google Scholar] [CrossRef]
- Kim, D.G.; Thomas, A.D.; Pelster, D.; Rosenstock, T.S.; Sanz Cobena, A. Greenhouse gas emissions from natural ecosystems and agricultural lands in sub-Saharan Africa: Synthesis of available data and suggestions for further research. Biogeosciences 2016, 13, 4789–4809. [Google Scholar] [CrossRef]
- Glatzle, S.; Stuerz, S.; Giese, M.; Pereira, M.; Almeida, R.G.; Bungenstab, D.J.; Macedo, M.C.M.; Asch, F. Seasonal dynamics of soil moisture in an Integrated-Crop-Livestock-Forestry system in central-west Brazil. Agriculture 2021, 11, 245. [Google Scholar] [CrossRef]
- Santos, I.L.; Oliveira, A.D.; Figueiredo, C.C.; Malaquias, J.V.; Santos Junior, J.D.G.; Ferreira, E.A.B.; Sa, M.A.C.; Carvalho, A.M. Soil N2O emissions from long-term agroecosystems: Interactive effects of rainfall seasonality and crop rotation in the Brazilian Cerrado. Agric. Ecosyst. Environ. 2016, 233, 111–120. [Google Scholar] [CrossRef]
- Smith, K.A. Changing views of nitrous oxide emissions from agricultural soil: Key controlling processes and assessment at different spatial scales. Eur. J. Soil Sci. 2017, 68, 137–155. [Google Scholar] [CrossRef]
- Hickman, J.E.; Palm, C.A.; Mutuo, P.; Melillo, J.M.; Tang, J. Nitrous oxide (N2O) emissions in response to increasing fertilizer addition in maize (Zea mays L.) agriculture in western Kenya. Nutr. Cycl. Agroecosyst. 2014, 100, 177–187. [Google Scholar] [CrossRef]
- Carvalho, A.M.; Oliveira, W.R.D.; Ramos, M.L.G.; Coser, T.R.; Oliveira, A.D.; Pulrolnik, K.; Souza, K.W.; Vilela, L.; Marchão, L.R. Soil N2O fluxes in integrated production systems, continuous pasture and Cerrado. Nutr. Cycl. Agroecosyst. 2017, 107, 69–83. [Google Scholar] [CrossRef]
- Carvalho, P.C.F.; Anghinoni, I.; de Moraes, A.; de Souza, E.D.; Sulc, R.M.; Lang, C.R.; Flores, J.P.C.; Lopes, M.L.T.; Silva, J.L.S.; Conte, O.; et al. Managing grazing animals to achieve nutrient cycling and soil improvement in no-till integrated systems. Nutr. Cycl. Agroecosyst. 2010, 88, 259–273. [Google Scholar] [CrossRef]
- Franzluebbers, A.J.; Stuedemann, J.A. Crop and cattle production responses to tillage and cover crop management in an integrated crop–livestock system in the southeastern USA. Eur. J. Agron. 2014, 57, 62–70. [Google Scholar] [CrossRef]
- Moraes, A.; Carvalho, P.C.F.; Anghinoni, I.; Lustosa, S.B.C.; Costa, S.E.V.G.A.; Kunrath, T.R. Integrated crop–livestock systems in the Brazilian subtropics. Eur. J. Agron. 2014, 57, 4–9. [Google Scholar] [CrossRef]
- Brasil, M.C.T.I. Terceira Comunicaçao Nacional do Brasil à Convenção-Quadro das Nações Unidas Sobre Mudança do Clima. Setor Uso da Terra, Mudança do Uso da Terra e Florestas. MCT, Brasília. 2016. Available online: http://www.ccst.inpe.br/publicacao/terceira-comunicacao-nacional-do-brasil-a-convencao-quadro-das-nacoes-unidas-sobre-mudanca-do-clima-portugues/ (accessed on 26 November 2023).
- de Azevedo, T.R.; Costa Junior, C.; Brandão Junior, A.; Cremer, M.D.S.; Piatto, M.; Tsai, D.S.; Barreto, P.; Martins, H.; Sales, M.; Galuchi, T.; et al. SEEG initiative estimates of Brazilian greenhouse gas emissions from 1970 to 2015. Sci. Data 2018, 5, 180045. [Google Scholar] [CrossRef]
- Nair, P.K.R.; Tonucci, R.G.; Garcia, R.; Nair, V.D. Silvopasture and carbon sequestration with special reference to the Brazilian Savanna (Cerrado). In Carbon Sequestration Potential of Agroforestry Systems, 2nd ed.; Kumar, B.M., Nair, P.K.R., Eds.; Springer: London, UK, 2011; Volume 1, pp. 145–162. [Google Scholar]
- Peters, M.; Rao, I.; Fisher, M.; Subbarao, G.; Martens, S.; Herrero, M.; van der Hoek, R.; Schultze-Kraft, R.; Miles, J.; Castro, A.; et al. In Eco-Efciency: From Vision to Reality Tropical forage-based systems to mitigate greenhouse gas emissions. In CIAT. 2013. Eco-Efficiency: From Vision to Reality-Issues in Tropical Agriculture; Hershey, C.H., Neate, P., Eds.; CIAT: Cali, Colombia, 2012. [Google Scholar]
- Bernardi, R.E.; de Jonge, I.K.; Holmgren, M. Trees improve forage quality and abundance in South American subtropical grasslands. Agric. Ecosyst. Environ. 2016, 232, 227–231. [Google Scholar] [CrossRef]
- Tornton, P.K.; Herrero, M. Potential for reduced methane and carbon dioxide emissions from livestock and pasture management in the tropics. Proc. Natl. Acad. Sci. USA 2010, 107, 19667–19672. Available online: https://www-pnas-org.translate.goog/doi/full/10.1073/pnas.0912890107?_x_tr_sl=pt&_x_tr_tl=en&_x_tr_hl=pt-BR&_x_tr_pto=wapp (accessed on 30 August 2023). [CrossRef]
- Dube, F.; Espinosa, M.; Stolpe, N.B.; Zagal, E.; Thevathasan, N.V.; Gordon, A.M. Productivity and carbon storage in silvopastoral systems with Pinus ponderosa and Trifolium spp., plantations and pasture on an Andisol in Patagonia, Chile. Agrofor. Syst. 2012, 86, 113–128. [Google Scholar] [CrossRef]
- Paula, R.R.; Reis, G.G.; Reis, M.G.F.; Neto, S.N.O.; Leite, H.G.; Melido, R.C.N.; Lopes, H.N.S.; Souza, F.C.S. Eucalypt growth in monoculture and silvopastoral systems with varied tree initial densities and spatial arrangements. Agrofor. Syst. 2013, 87, 1295–1307. [Google Scholar] [CrossRef]
- Nair, P.K.R. Climate change mitigation: A low-hanging fruit of agroforestry. In Agroforestry-Te Future of Global Land Use, 2nd ed.; Nair, P.K.R., Garrity, D., Eds.; Springer: London, UK, 2012; Volume 1, pp. 31–67. [Google Scholar]
- Martorano, L.G.; Vitorino, M.I.; da Silva, B.P.P.C.; de Moraes, J.R.S.C.; Lisboa, L.S.; Sotta, E.D.; Reichardt, K. Climate conditions in the eastern amazon: Rainfall variability in Belem and indicative of soil water deficit. Afr. J. Agric. Res. 2017, 12, 1801–1810. [Google Scholar]
- Martorano, L.G.; Soares, W.B.; Moraes, J.R.S.C.; Aparecido, L.E.O.; Villa, P.M. Climatology of Air Temperature in Belterra: Thermal Regulation Ecosystem Services Provided by the Tapajós National Forest in the Amazon. Rev. Bras. Meteorol. 2021, 36, 327–337. [Google Scholar] [CrossRef]
- Empresa Brasileira de Pesquisa Agropecuária—EMBRAPA; Centro Nacional de Pesquisa de Solos. Sistema Brasileiro de Classificação de Solos; Embrapa Solos: Rio de Janeiro, Brazil, 2006; p. 306. [Google Scholar]
- Cândido, A.C.T.F.; Guerreiro Martorano, L.; Cândido, B.U.F.; Nascimento, W.; Dias, C.T.d.S.; Lisboa, L.S.S.; Fernandes, P.C.C.; Silva, A.R.; Dias-Filho, M.B.; Beldini, T.P. Infrared Thermal Profiles in Silvopastoral and Full-Sun Pastures in the Eastern Amazon, Brazil. Forests 2023, 14, 1463. [Google Scholar] [CrossRef]
- Silva, J.C.N.; Silva, A.R.; Veloso, C.A.C.; Dantas, E.F.; do Sacramento, J.A.A.S. Aggregation, carbon, and total soil nitrogen in crop-livestock-forest integration in the Eastern Amazon. Rev. Bras. Eng. Agric. E Ambient. 2018, 22, 837–842. [Google Scholar] [CrossRef]
- Dias Filho, M.B. Degradação de Pastagens: O Que é e Como Evitar, 1st ed.; Embrapa: Brasília, Brazil, 2017; p. 19. [Google Scholar]
- Lameira, M.K.S.; Silva, H.K.M.; Gomes, K.M.A.; Ferreira, A.C.T.; Martorano, L.G.; Ribeiro, R.B.S.; Silva, A.R.; Gama, J.R.V. Capacidade produtiva de Dipteryx odorata (Aubl.) Willd. em sistema de produção de pecuária integrada no Baixo Amazonas. Rev. For. Mesoam. Kuru-Rfmk 2022, 19, 56–65. Available online: https://revistas.tec.ac.cr/index.php/kuru/article/view/6102 (accessed on 23 August 2023).
- dos Santos, L.E.; Martorano, L.G.; Silva, A.R.; Gama, J.R.V. Teor de carbono em folhas, galhos e fustes de Bertholletia excelsa Humb. & Bonpl., Dipteryx odorata (Aubl.) Willd. e Khaya grandifoliola C. DC. em sistemas integrados na Amazônia oriental brasileira. DELOS Desarro. Local Sosten. 2023, 16, 910–923. [Google Scholar] [CrossRef]
- Furtado Neto, A.T.; Moura, J.M.S.; Silva, R.; Oliveira Junior, R.C.; Gatti, L.V.; Röckmann, T. Produção e Fluxo de Metano na Floresta Nacional do Tapajós. Rev. Bras. Meteorol. 2019, 34, 585–596. [Google Scholar] [CrossRef]
- Wilkinson, J.; Bors, C.; Burgis, F.; Lorke, A.; Bodmer, P. Measuring CO2 and CH4 with a portable gas analyzer: Closed-loop operation, optimization and assessment. PLoS ONE 2018, 13, e0193973. [Google Scholar] [CrossRef]
- Goldenfum, J.A. (Ed.) GHG Measurement Guidelines for Freshwater Reservoirs: Derived from: The UNESCO/IHA Greenhouse Gas Emissions from Freshwater Reservoirs Research Project; International Hydropower Association (IHA): London, UK, 2010. [Google Scholar]
- Shapiro, S.S.; Wilk, M.B. An analysis of variance test for normality (complete samples). Biometrika 1965, 52, 591–611. [Google Scholar] [CrossRef]
- Bartlett, M.S. Properties of sufficiency and statistical tests. Proc. R. Soc. Lond. Ser. A 1937, 160, 268–282. [Google Scholar] [CrossRef]
- Kruskal, W.H.; Wallis, W.A. Use of Ranks in One-Criterion Variance Analysis. J. Am. Stat. Assoc. 1952, 47, 583. [Google Scholar] [CrossRef]
- Dunn, O.J. Multiple Comparisons Using Rank Sums. Technometrics 1964, 6, 241. [Google Scholar] [CrossRef]
- Gabriel, K.R. The biplot graphic display of matrices with application to principal component analysis. Biometrika 1971, 58, 453–467. [Google Scholar] [CrossRef]
- Kassambara, A.; Mundt, F. Factoextra: Extract and Visualize the Results of Multivariate Data Analyses. R Package Version 1.0.7. 2021. Available online: https://CRAN.R-project.org/package=factoextra (accessed on 30 August 2023).
- Pohlert, T. PMCMRplus: Calculate Pairwise Multiple Comparisons of Mean Rank Sums Extended. R Package Version 1.9.6. 2022. Available online: https://CRAN.R-project.org/package=PMCMRplus (accessed on 30 August 2023).
- Wickham, H.; Navarro, D.; Pedersen, T.L. ggplot2: Elegant Graphics for Data Analysis, 3rd ed.; Springer: Berlin/Heidelberg, Germany, 2016; Available online: https://ggplot2-book.org/ (accessed on 30 August 2023).
- Rencher, A.C. Methods of Multivariate Analysis, 2nd ed.; A John Wiley & Sons, Inc. Publication: Hoboken, NJ, USA, 2002; p. 727. [Google Scholar]
- Garofalo, D.F.T.; Novaes, R.M.L.; Pazianotto, R.A.A.; Maciel, V.G.; Brandão, M.; Shimbo, J.Z.; Matsuura, M.I.S.F. Land-use change CO2 emissions associated with agricultural products at municipal level in Brazil. J. Clean. Prod. 2022, 364, 132549. [Google Scholar] [CrossRef]
- Torres, C.M.M.E.; Jacovine, L.A.G.; Neto, N.O. Greenhouse gas emissions and carbon sequestration by agroforestry systems in southeastern Brazil. Sci. Rep. 2017, 7, 16738. [Google Scholar] [CrossRef] [PubMed]
- Silva, C.M.; Vasconcelos, S.S.; Morão Júnior, M.; Bispo, C.J.C.; Kato, O.R.; Silva Junior, A.C.; Castelani, D.C. Variação temporal do efluxo de CO2 do solo em sistemas agroflorestais com palma de óleo na Amazônia Oriental. Acta Amaz. 2016, 46, 1–12. [Google Scholar] [CrossRef]
- Ramos, J.C.d.A. Emissão de CO2, Quantidade e Qualidade do Carbono do Solo em Sistemas Agrícolas na Região do Cerrado do Mato Grosso do Sul. Ph.D. Thesis, Universidade Estadual Paulista, Ilha Solteira, São Paulo, Brazil, 1 November 2018. [Google Scholar]
- Keppler, F.; Hamilton, J.T.G.; Brass, M.; Röckmann, T. Methane emissions from terrestrial plants under aerobic conditions. Nature 2006, 439, 187–191. [Google Scholar] [CrossRef]
- WMO World Meteorological Organization. Greenhouse Gas Bulletin (GHG Bulletin): The State of Greenhouse Gases in the Atmosphere Based on Global Observations though 2011; WMO World Meteorological Organization: Geneva, Switzerland, 2012; pp. 1–4. [Google Scholar]
- Oliveira Júnior, J.; Nilo, I.C.; Ferreira, R.T. Convergência Microrregional no Setor Agrícola Usando um Modelo com Efeito Threshold. Economia 2009, 10, 553–576. [Google Scholar]
- Zanchi, F.B.; da Rocha, H.R.; De Freitas, H.C.; Kruijt, B.; Waterloo, M.J.; Manzi, A.O. Measurements of soil respiration and simple models dependent on moisture and temperature for an Amazonian southwest tropical Forest. Biogeosci. Discuss. 2009, 6, 6147–6177. [Google Scholar] [CrossRef]
- Saggar, S.N.S.; Bolan, R.; Bhandral, C.B.; Hedley, J.L. A review of emissions of methane, ammonia, and nitrous oxide from animal excreta deposition and farm effluent application in grazed pastures. N. Z. J. Agric. Res. 2004, 47, 513–544. [Google Scholar] [CrossRef]
- Siqueira Neto, M.; Piccolo, M.C.; Costa Junior, C.; Cerri, C.C.; Bernoux, M. Greenhouse gas emissions in different land uses in the Cerrado biome. Rev. Bras. Ciência Solo 2011, 35, 63–76. [Google Scholar] [CrossRef]
- Mazzetto, A.M.; Barneze, A.S.; Feigl, B.J.; Van Groenigen, J.W.; Oenema, O.; Cerri, C.C. Temperature and moisture affect methane and nitrous oxide emission from bovine manure patches in tropical conditions. Soil Biol. Biochem. 2014, 76, 242–248. [Google Scholar] [CrossRef]
- Rosa, J.K.d. Emissões de Gases do Solo e de Excretas de Bovinos em Integração Lavoura-Pecuária e Pastagem Permanente. Ph.D. Thesis, Universidade Tecnológica Federal do Paraná, Pato Branco, Paraná, Brazil, 29 April 2019. [Google Scholar]


Disclaimer/Publisher’s Note: The statements, opinions and data contained in all publications are solely those of the individual author(s) and contributor(s) and not of MDPI and/or the editor(s). MDPI and/or the editor(s) disclaim responsibility for any injury to people or property resulting from any ideas, methods, instructions or products referred to in the content. |
© 2024 by the authors. Licensee MDPI, Basel, Switzerland. This article is an open access article distributed under the terms and conditions of the Creative Commons Attribution (CC BY) license (https://creativecommons.org/licenses/by/4.0/).