Article

Modelling of Aircraft Non-CO2 Emissions Using Freely Available Activity Data from Flight Tracking

CITTA-Centro de Investigação do Território, Transportes e Ambiente, Department of Civil Engineering, Faculty of Sciences and Technology, University of Coimbra, 3030-788 Coimbra, Portugal
*
Author to whom correspondence should be addressed.
Sustainability 2024, 16(6), 2558; https://doi.org/10.3390/su16062558
Submission received: 15 February 2024 / Revised: 15 March 2024 / Accepted: 17 March 2024 / Published: 20 March 2024

Abstract

:
The objective of this work is to develop a new modelling tool to quantify non-CO2 emissions from aircraft during the landing and take-off (LTO cycle) considering the following criteria: (i) utilising freely available activity data; (ii) using widely recommended emission factors; (iii) providing emissions with the spatial and temporal resolution required for local air quality assessment. Freely available flight tracking data obtained from Flightradar24 and emission factors from the European Environment Agency (EEA/EMEP) are considered for the algorithm implementation and tested for Lisbon airport. The analyses of aircraft emissions during various flight stages reveal that HC and CO are mostly emitted during taxiing (93%), while NOX and PM are mostly produced during climb-out (48% and 35%, respectively). Sensitivity analysis, by using simplified activity data from publicly available databases against detailed engine models and emission factors, showed variations in the daily emissions of less than 13% in the case of CO and NOX, but up to 34% for HC and PM. The modelling approach based on freely available activity data developed in this work may offer valuable insights for quantifying airport emissions, providing crucial inputs for air quality assessment, and supporting the definition of mitigation strategies aimed at enhancing sustainability in aviation practices.

1. Introduction

Aviation plays a vital role in advancing worldwide connectivity and the global economy [1]. However, it is also one of the major sources of environmental concerns due to fast-growing energy consumption and aircraft emissions with significant impacts on local air quality, climate change, and population health [2,3,4,5,6,7]. To address these issues, a variety of tools and methods have been applied in previous studies to create emission inventories, which provide comprehensive details about specific emission sources at airports in order to quantify the total mass of pollutants released into the environment [8,9,10,11,12]. Research efforts are being made to integrate new technology and operational techniques that attempt to mitigate the environmental consequences while maintaining the critical role that aviation plays in global connectivity and economic progress in order to promote sustainable aviation practices [13].
Atmospheric emissions from aircraft are generated through the burning of fuel during flight operations, which can be categorised as either LTO (Landing and Take-Off) below 3000 feet (914 m) or CCD (Climb, Cruise, Descent) activities above 3000 feet, as defined by the ICAO-International Civil Aviation Organization [14]. Accordingly, taxiing (taxi in and out), take-off, climb-out, and approach are all included in the LTO cycle. Emissions at the cruise level of a flight are more relevant at global and regional scales, while the emissions under the LTO operations are very important at the local scale [15].
The evaluation of airport emissions during LTO stages is important to put the local air quality issue into place and determine whether the aircraft activities will contribute to an adverse effect on population health and the environment [16,17]. Hence, the evaluation of aviation emissions began to be taken into consideration in the early 2000s, which led to the development of various methods and models. Emission inventories are developed allowing the quantification of pollutants released into the atmosphere, providing essential information for the assessment of air pollution and preparing mitigation strategies [18,19,20,21,22].
Developing an emission inventory for airports involves several key steps and considerations. In general, the pollutants released by aircraft depend on the quantity of fuel burnt and it is calculated as a function of the activity data (AD), emission factor (EF) specific for each pollutant, and time-in-mode of operation (TIM). However, the purpose of the inventory determines its design complexity and the level of data aggregation/disaggregation. Thus, the methodologies currently used for emission quantification may be based on very simplified approaches or very complex ones that require comprehensive data for implementation. For example, airport-specific emission factors could be used in an aggregated way if no information on the type of aircraft is available [23]. On the other hand, detailed approaches promote “best practice” emissions inventory techniques and require inputs at a very detailed level, such as data on the aircraft engine model, aircraft speeds during different LTO stages, aircraft profiles and so on [24].
There are numerous examples of inventories developed to examine the emissions from aviation and assess the environmental impact of air travel [18,20,25,26,27]. Most of the inventories consider historical activity data to estimate the emissions of CO2, CO, H2O, and HC as well as to determine the quantity of fuel used and the distance travelled, rather than using real-time air traffic data [20,28,29]. These emission inventories provide estimations of the quantity and distribution of emissions in terms of space and time associated with the aviation sector. Many of these inventories are structured to determine aircraft emissions on a global scale, using detailed geographical and altitudinal parameters.
In the past few years, there has been an increase in scholarly research focused on studying aircraft emissions, leading to the development and implementation of various measurement and modelling methods to assess these pollutants [21,30,31,32,33]. Several methodologies to estimate aircraft pollutant emissions are currently available and the results indicated that the LTO stages were a priority for many research [34,35,36]. We thoroughly reviewed the literature and selected 14 papers (Table 1) that were very relevant to our research since they dealt with the particular stage of flight operation that we were looking into. These publications were classified based on methodologies, scope, pollutants produced during different LTO stages, and their main outcomes.
Considering the growing focus on air pollution near airports and aircraft emissions at ground level, several critical research challenges persist. Thus, data availability is one of the main issues; there is significant difficulty in securing data that are both available and accurate. Obtaining such data can be expensive, time-consuming, and requires a high level of detail and complexity. Certain flight activity data may be publicly accessible and useful for precise emissions modelling at the local scale. In addition, it is advisable to depend on recommended emission factors, as they offer both convenience and a clear sense of purpose to the study. Finally, presenting emission results with the spatial and temporal details required for local-scale air quality assessment is a complex undertaking. Achieving this level of resolution demands a delicate balance between computational resources, data availability, and model precision.
In addressing the challenges above, the main question of this research is: Can we consider freely available activity data as an alternative source of information to provide reliable emission estimates for airports? Thus, the main objective of this work is to develop a new emission modelling tool to quantify non-CO2 aircraft emissions during landing and take-off activities taking into account the following requirements: (i) using freely available activity data to facilitate the model application; (ii) using widely recommended emission factors; (iii) provide emission results with the spatial and temporal resolution required for local scale air quality assessment. Subsequently, the model is applied in a case study to assess the modelling approach and conduct sensitivity analysis.

2. Methodology

The modelling approach implemented in this work is focused on non-CO2 emissions, including CO, HC, NOX and PM, and is based on the recommendations of EEA/EMEP [46]. In general, the emissions for each aircraft are calculated by considering the activity data and the emission factors for each LTO stage during arrival and departure, namely taxiing (taxi in and out), take-off, climb-out, and approach (Figure 1).
Thus, the emissions for each pollutant are quantified based on Equation (1) adopted [46]:
E P = i = 1 N ( F i × m T I M m × E F i m p × N E i )
where:
E P = hourly emissions of pollutant p (kg);
F i = the total number of flights for aircraft type i;
T I M m = time-in-mode m (take-off, climb-out, taxiing, and approach) (seconds);
E F i m p = the emission factor for pollutant p, in mode m per engine used in aircraft type i (kg s−1 engine−1);
N E i = the total number of engines used on the aircraft type i.
To apply Equation (1) for a specific airport, different inputs are required. The number of flights and type of aircraft, engine thrust level, and time-in-mode are some of the important inputs required by the model that can affect the accuracy of the final results. Both thrust level and TIM are defined based on ICAO standards as outlined in Table 2 [14]. The thrust level is a critical parameter in the emission quantification as it directly impacts the rate of fuel combustion and subsequently release of the pollutants. TIM depends on airport characteristics and conditions. However, the average values recommended by ICAO could be used when data for a specific airport are unavailable.
Although the general approach to the emission quantification is well known, the main limitation to its application consists in the availability of input data to characterize flight activities in a specific airport for the required time period. Moreover, it is important to guarantee that the level of detail in the data (inputs and outputs) is compatible with the final use of the emission inventory that defines the requirements for spatial and temporal resolution of the local air quality assessment.
Consequently, the primary focus of this work is on the development of a novel approach to integrate aircraft activity data into the emission quantification algorithm using publicly available information provided by flight-tracking services.
There are several online flight-tracking platforms that provide real-time or historical information about the movement and status of aircraft during the flights. While Flightradar24 stands out for its comprehensive coverage and user-friendly interface, making it the preferred choice for accurate and easily accessible real-time flight information about thousands of aircraft around the world. Its advantages over the other flight tracking platforms include a wide user base, robust community contributions, and suitability for aviation enthusiasts and researchers.
In this research work, the flight schedules from Flightradar24 are used to characterize the activity data. The collected data include flight number, origin/destination country, airline name, aircraft type, estimated and exact time of arrival and departure, and the status of the flight (landed, departed, diverted, cancelled, or unknown). Figure 2 presents the sample of collected data as an illustrative example.
Additionally, one of the parameters required to select the most appropriate emission factors for emission quantification is the aircraft engine models (e.g., A-320 is an aircraft with 2 engines and may have different engine models installed: PW1127G-JM, CFM56-5-A1, CFM56-5A3, CFM56-5B4/2, V2527-A5, V2527E-A5, etc.). The EEA/EMEP provides specific EFs for various pollutants associated with certified engines for each aircraft-engine combination. These EFs are measured in units of kilograms per second (kg s−1) and are categorised based on the four power settings of the engine emissions certification scheme. Accordingly, they are further classified into various stages of LTO. This comprehensive categorisation ensures the reliability and consistency of emission quantification methodologies, enabling more precise assessments of the environmental impact caused by different aircraft types. As an example, the EFs for different engine models of A-320 are given in Table 3 for NOX.
However, information on the engine model of a specific aircraft is not available from the tracking service. For this purpose, two different datasets have been tested to select the emission factors: (i) EF for the most frequently used engine model recommended by EEA/EMEP, and (ii) median EFs for all engine models associated with specific aircraft. In cases where information on certain aircraft was unavailable, alternative aircraft with comparable design (physical characteristics: structure and layout) and performance attributes (e.g., range, speed, fuel efficiency, etc.) were selected. The sensitivity analysis was also implemented to provide additional information on the robustness and accuracy of emission estimations, facilitating reliable assessments in cases of limited information availability.
The model developed in this study is programmed in Python allowing the emission quantification with hourly/daily resolution separately for each LTO stage along with descriptive statistics for each pollutant. Figure 3 illustrates the procedure used in the calculation steps. In general, the model requires information on activity data and the emission factors. The activity data are provided by the flight tracking service and include aircraft type and timetable on arrivals and departures that are used to calculate the number of flights per hour. Additionally, time in mode and engine thrust for each LTO stage are required to be used in combination with the emission factors. The model is flexible, and a range of emission factors could be considered allowing implementation of sensitivity analysis. The final model output consists of hourly emissions disaggregated by the LTO stage.

3. Case Study/Lisbon Airport

In order to test the developed emission model in a real-world case study, the Lisbon Portela International (LIS) airport is chosen. LIS is considered the principal international airport of Portugal, is surrounded by residential and commercial areas and is situated 7 km northeast of Lisbon’s downtown. According to the Portuguese Civil Aviation Authority (ANAC), Lisbon Airport has expanded remarkably over the past 15 years and the number of passengers increased from 10 million in 2004 to 31 million in 2019 [47,48].
The comprehensive nature of high seasonality, which can vary based on destination and specific case studies, is acknowledged. While August and January are conventionally recognised as peak holiday seasons in Lisbon, Portugal, we deliberately chose July and February to minimize the impact of heightened demand and offer a more typical representation of each season. In this study, data were collected from Flightradar24 for LIS airport during July 2022 (summer) and February 2023 (winter). The selection of this particular time period is based on a thorough analysis of recent data pertaining to the restoration of air travel patterns to pre-COVID-19 levels.
The data reveal that the total number of landings and take-offs for the study periods summer and winter (per month) were 19,124, and 15,885, respectively. This seasonal variation is noticeable and can be attributed to various factors such as changes in travel patterns, weather conditions, and overall demand for air travel. Figure 4 presents the total number of flights per day and the percentage of aircraft types flown during both the summer and winter seasons. The results indicate a higher average daily number of LTO in the summer season compared to the winter season. Nevertheless, the observed differences between the two seasons are relatively slight. The revealed differences in the flight schedule between summer and winter times underscore the significance of considering seasonal dynamics in aviation operations and associated emissions. Hence, understanding these temporal trends and their environmental implications is crucial for developing targeted strategies for sustainable airport management and minimising the environmental impact of aviation activities.
According to the analysis of aircraft types that operated during the summer and winter seasons, Figure 4b illustrates the percentage of usage of aircraft types at LIS airport during the study periods. It is evident from the data that a significant majority of flights were conducted using Airbus and Boeing aircraft. In both seasons, the A320 emerged as the most frequently employed aircraft type.
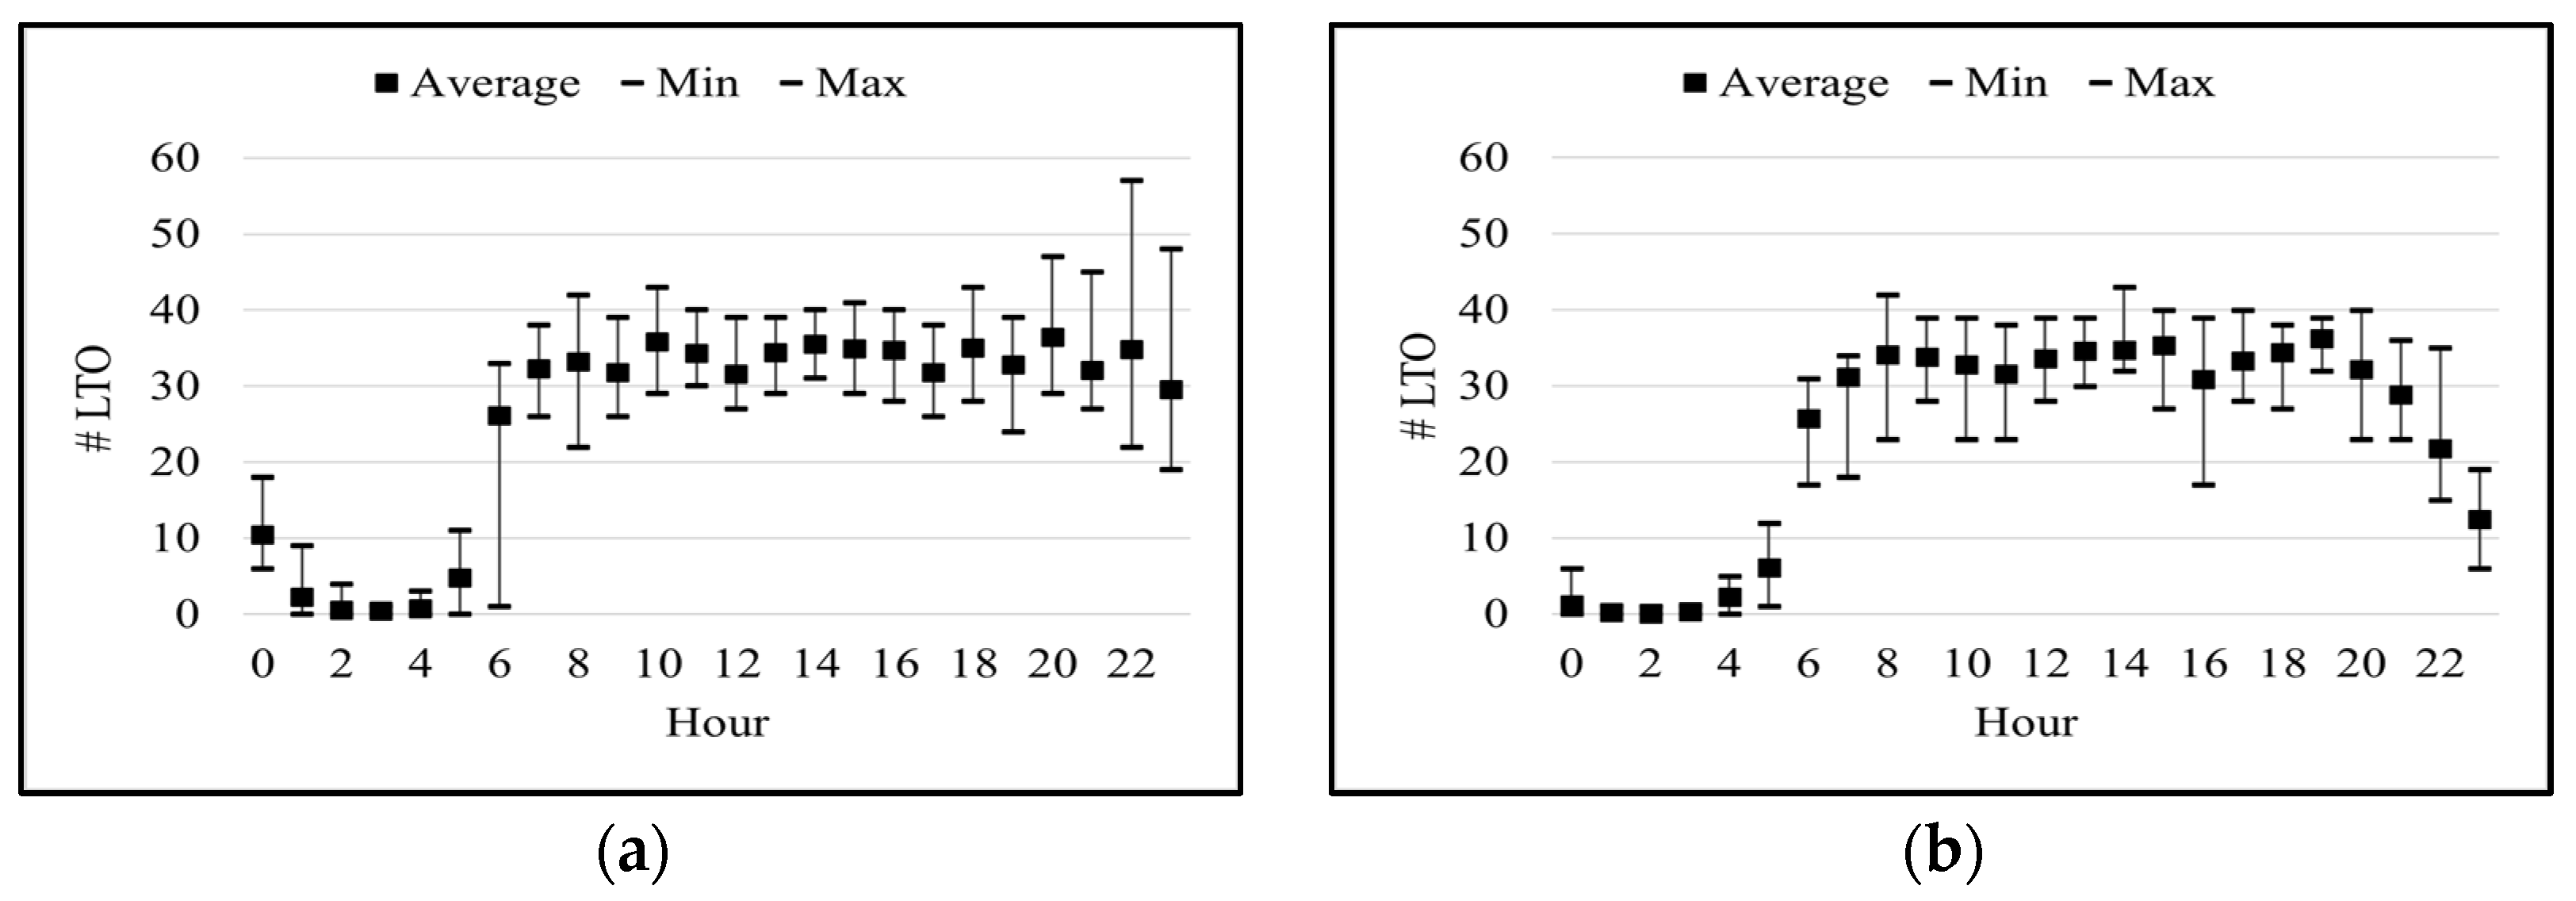
To provide further insight, Figure 5 is given to illustrate the temporal flight distribution based on daily data for summer and winter. Upon conducting a descriptive analysis of LIS airport data, it was observed that a majority of flights occurred between 6:00 and midnight, with a relatively even distribution during this timeframe for both summer and winter times. However, there was a notable difference in the number of flights during night-time hours between these two months. It should be noted that LIS has implemented operating restrictions that strictly regulate aircraft operations between the hours of 00:00 and 06:00 local time, barring regular landings and take-offs during this period unless exceptional circumstances arise. These restrictions aim to address environmental concerns, specifically noise pollution. The average hourly number of flights in both seasons is comparable, with similar values observed. However, during the summer season, particularly after 20:00, the flight frequency exhibits higher values compared to the winter season.

4. Emission Model Results and Discussion

To understand the suitability of each dataset, sensitivity analysis associated with the emission quantification was performed enabling more informed decision-making and enhancing the accuracy of estimates. For this purpose, the emission model was tested considering different emission factors and taking into consideration data limitations on aircraft engine models.
Based on the available information from LIS airport, three different datasets were compiled to be used as inputs for the analysis as presented below. In addition to the data from flight tracking, information on the exact engine model of each aircraft was collected to define the “base case” and used as a reference for the sensitivity analysis. Representative days considering the number of flights available on each day of both seasons were chosen for each month. Hence, the input data were collected for selected weekdays considered representative of the summer (11 July 2022) and winter (23 February 2023) periods. Thus, three datasets with the following characteristics were compiled:
Dataset 1 (D1), the base case: extensive information on engine models for each aircraft was collected from an external database, in addition to the number of flights and type of aircraft. The D1 includes the most complete information in the comparison with other datasets considered in the analysis.
Dataset 2 (D2): information on the number of flights and type of aircraft is the same as in D1, but the engine models of the aircraft are not known. The emission factors are selected using the most frequently used engine model for a specific aircraft based on the information provided by the EEA/EMEP.
Dataset 3 (D3): the same as D1 for the number of flights; no data on engine models as in D2, but considering the median emission factor calculated from engine models available for a specific type of aircraft based on information provided by the EEA/EMEP.
Table 4 provides a comprehensive overview of the total emissions for the specific days selected for the summer and winter seasons, based on the defined datasets.
There is no simple pattern in the daily emissions obtained with different datasets (Table 4). Thus, D2 reports higher values for PM and NOX in both seasons, in comparison with the base case (D1), while CO and HC in D2 are lower than D1. The results for D3 are the lowest considering NOX and PM, but CO emissions in summer are the highest when compared with D1 and D2. Therefore, no simple conclusion could be derived if the emission factors based on the most frequently used engine (D2), or median emission factors (D3) is the best approach based on the analysis of absolute values. The percentage difference between the predefined datasets and the base case (D1) is presented in Table 5 showing that D3 provides lower discrepancy for all the pollutants (CO, HC, PM) except for NOX. Moreover, the sensitivity of the pollutants is different, and the results reveal that the selection of the emission factors is very important. Thus, HC and PM are the most affected and a simplified approach may contribute to the differences of up to 34% of total daily emissions, while CO and NOX are less sensitive and the difference in daily estimates is no more than 13%.
Additionally, Root Mean Squared Error (RMSE) was analysed based on hourly emissions (Table 6). Lower RMSE values indicate better model performance and a closer alignment with the base case. The results presented in Table 6 confirm the conclusions obtained from the analysis of total daily emissions and reveal that D3 is the better solution for all the pollutants analysed, except for NOX. Therefore, in the comprehensive assessment of percentage changes and RMSE values, it is advisable to prioritize median EFs for CO, HC, and PM, considering all engine models within a specific aircraft category. Conversely, NOX emissions are better estimated based on EFs from the most frequently used engine model.
Overall, the outcomes reveal a minor discrepancy for the emission estimates based on a simplified approach, with no specific information on the engine model, and the detailed approach based on accurate information about the engine model for each aircraft.
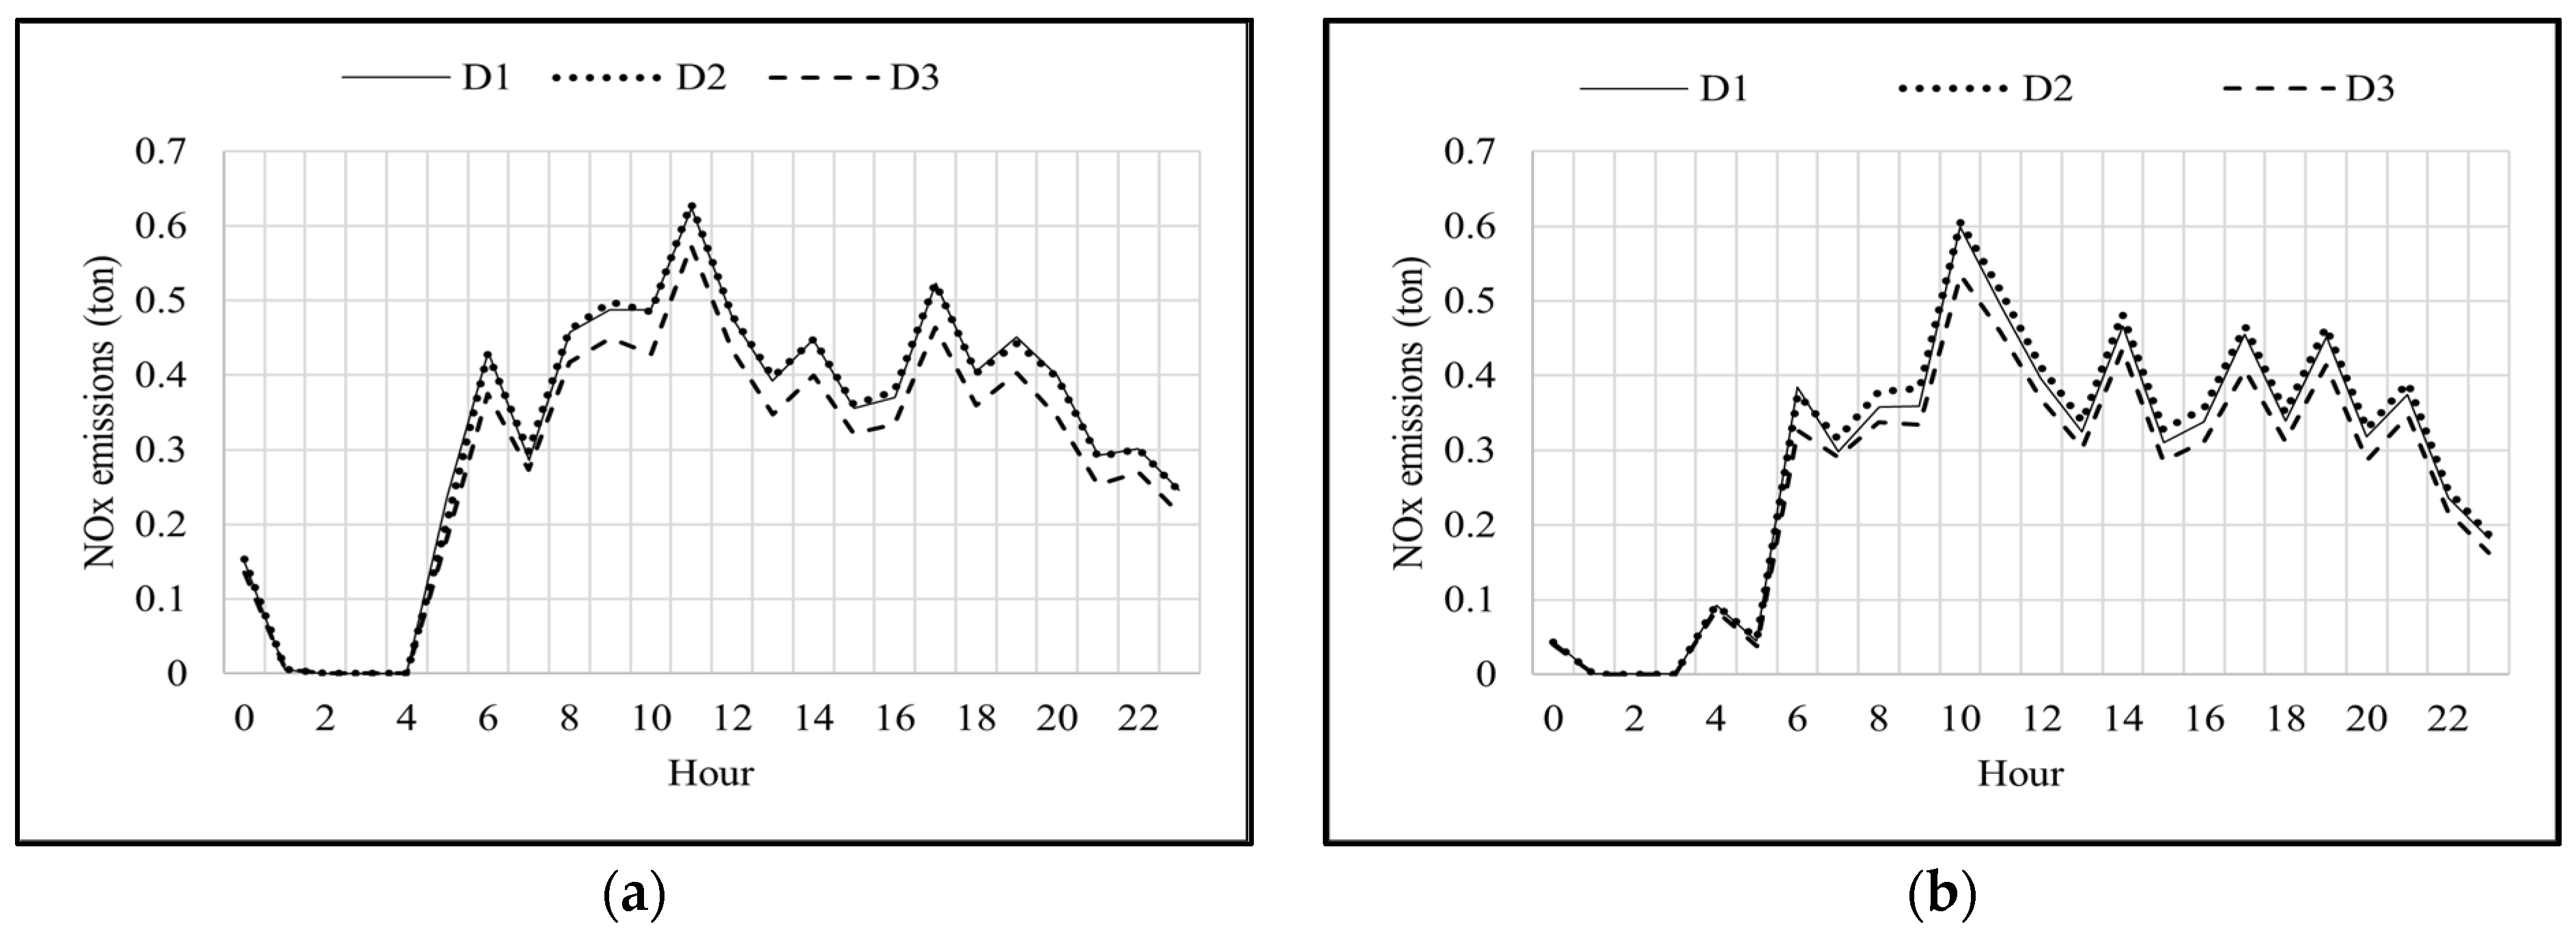
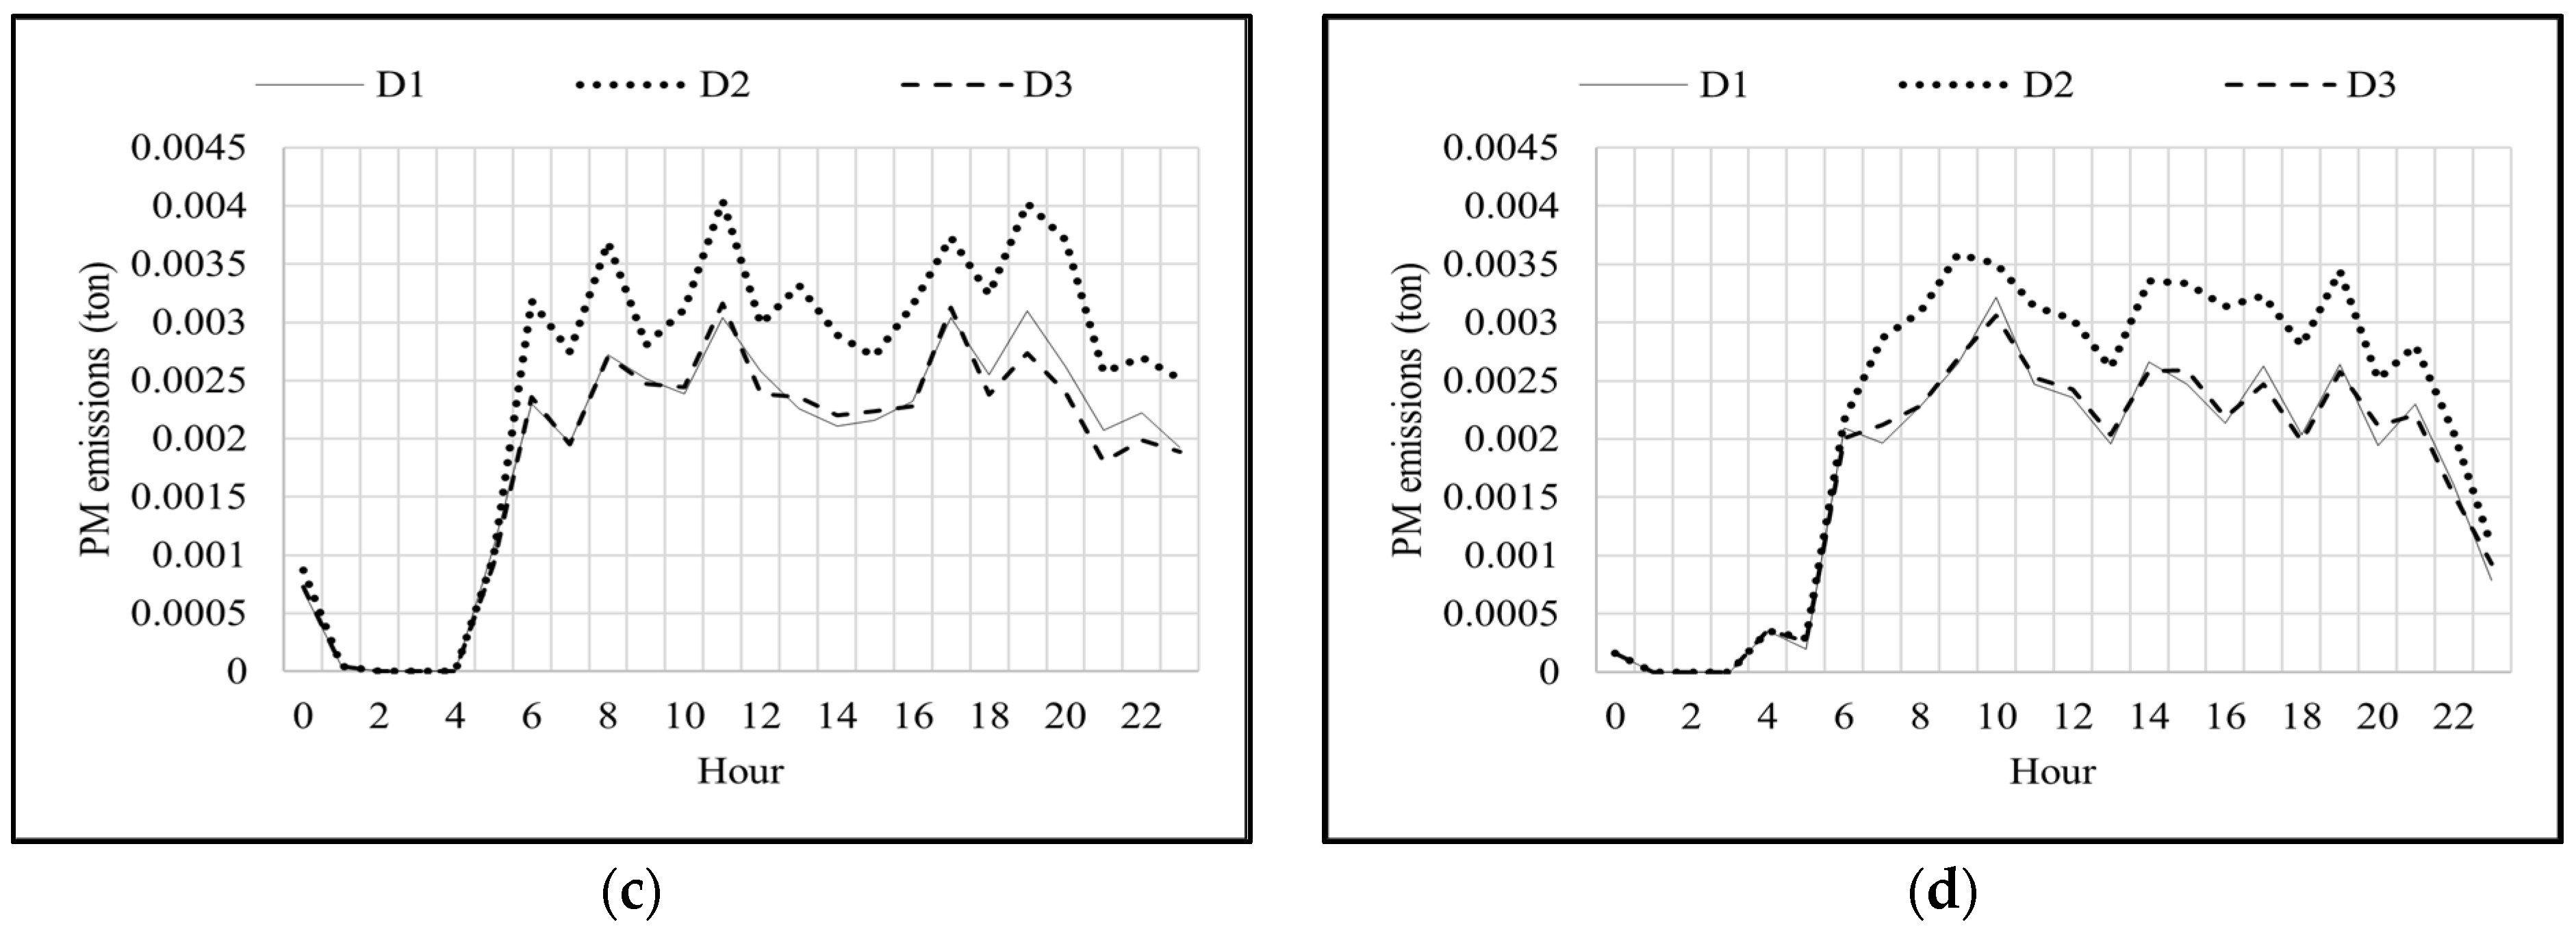
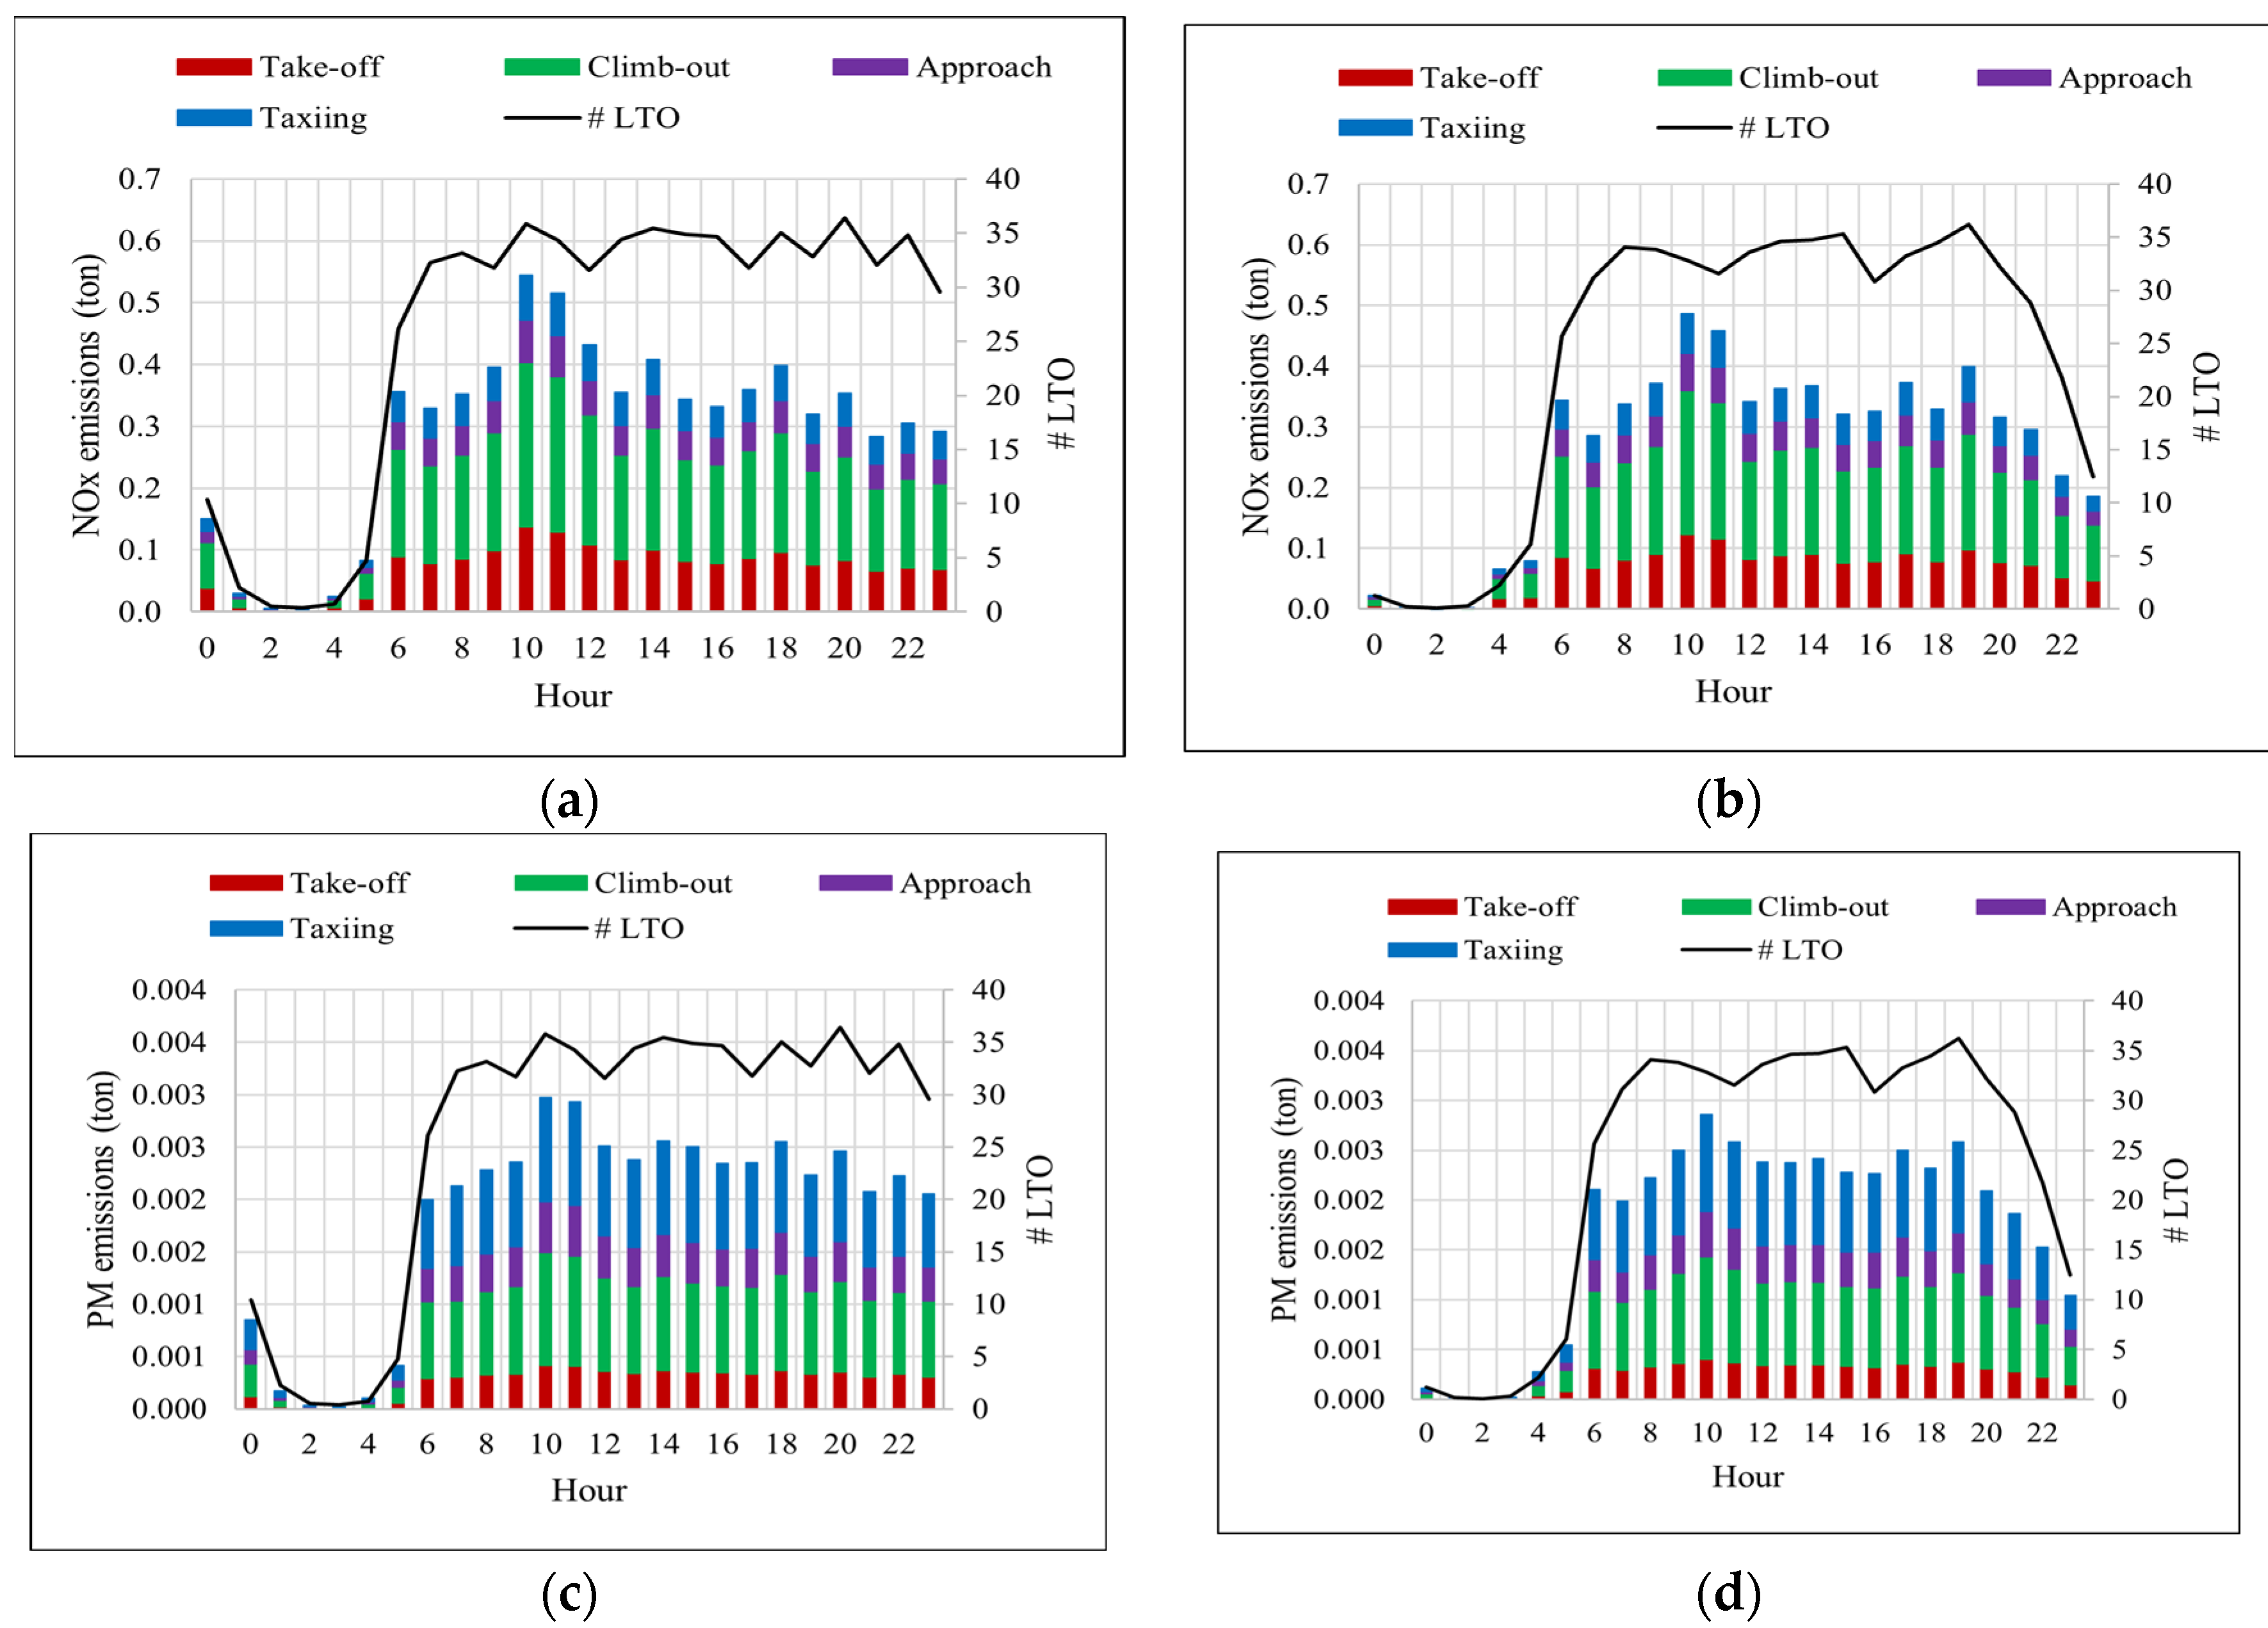
Hourly emissions obtained from the three datasets are presented in Figure 6 for selected pollutants only (NOX and PM). More information can be found in Appendix A (Figure A1).
The results obtained for NOX exhibit similar patterns for all datasets although some discrepancies are noticed for D3, particularly in the summer. However, in the case of PM, the differences between the datasets are more obvious showing that D3 is in good agreement with the hourly emissions provided by the base case, while D2 is significantly higher. Taking into consideration these results, the following analysis will be focused on D3 only.
Thus, the analysis of temporal patterns for emissions and activity data exhibits distinct characteristics and yields interesting findings. Figure 7 presents the hourly NOX and PM emissions and more information in Appendix A (Figure A2), revealing multiple peaks throughout the daily hours of the study period. In both the summer and winter months, the highest levels of NOX emissions are observed between 10:00 and 11:00 which do not align with the highest number of LTOs. Hence, in addition to the number of flights, the aircraft type plays a fundamental role in determining the emission levels as the EFs vary across different aircraft types.
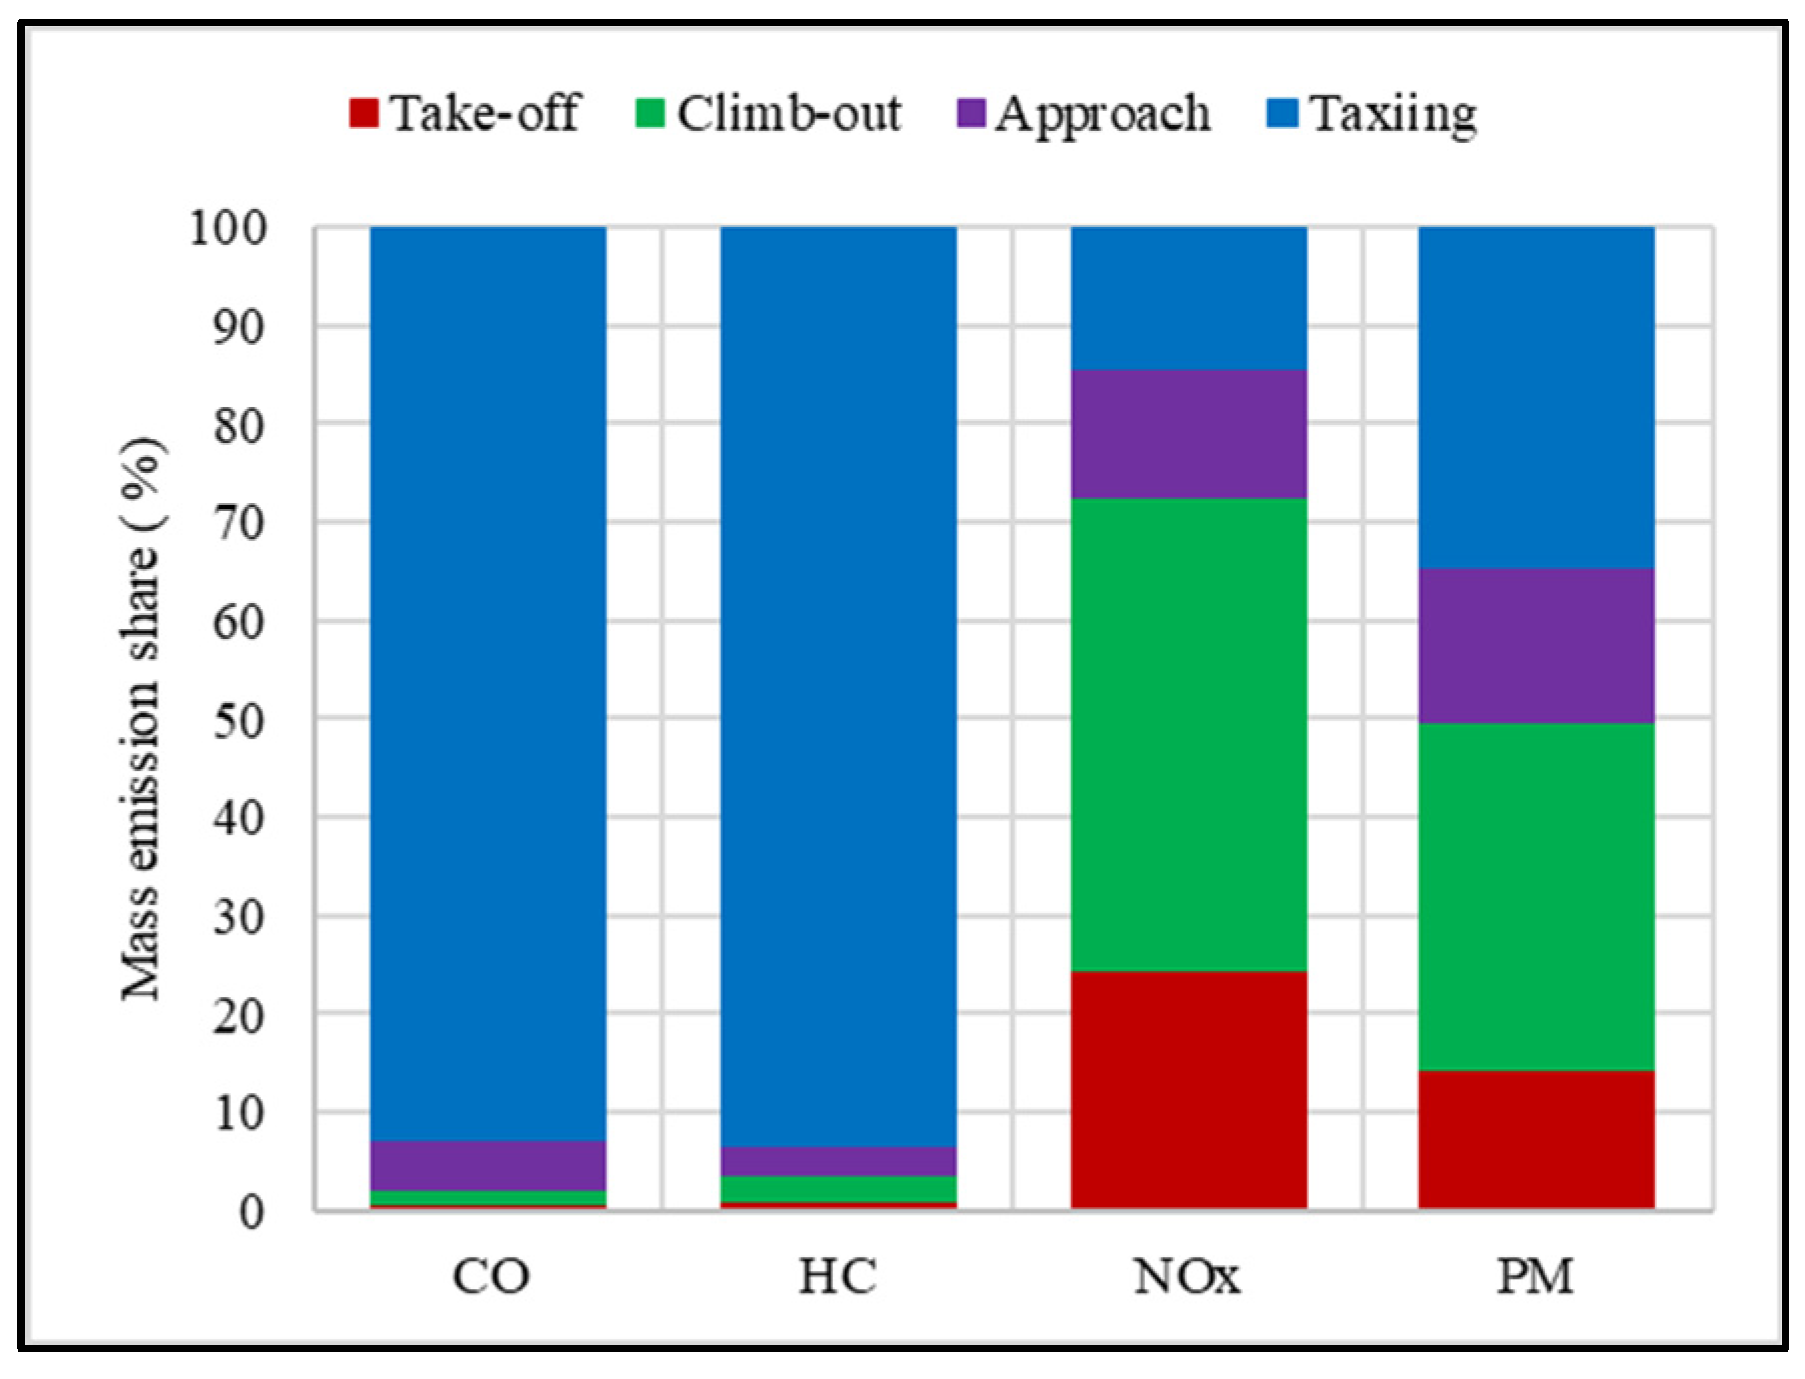
For a clearer perspective, Figure 8 is given to illustrate the relative contributions of CO, HC, NOX, and PM across different LTO stages throughout the study period. It is important to note that the patterns observed in both the summer and winter were consistent with minor distinctions among LTO stages (between 0–7%). For clarity and shortness, summer is chosen to display in Figure 8. Two fundamental factors demand careful scrutiny within the context of this study: the time spent by aircraft in each stage of the LTO referred to as TIM, and the engine thrust level (Table 2), which exerts a pronounced influence on fuel consumption. Generally, it is expected that the more an aircraft spends in any LTO stage, a significant amount of emissions would be produced. Nevertheless, it is imperative to emphasize that the thrust level of aircraft engines must be parallel factored into this analysis.
It is evident that CO emissions are mainly produced during the taxiing stage of LTO, which includes the taxi-in and taxi-out. CO is generated when jet fuel is not completely burned, and it is emitted mostly during the lower power settings in taxiing, which also constitutes the majority of an aircraft’s operating time at an airport.
HC is another product of the combustion process. The literature is inconclusive and does not specify which stage of the flight generates the highest emissions of this pollutant. In general, as the literature shows, HC emissions are significantly affected by engine power and decrease as thrust increases [49,50,51]. Figure 8 shows that taxiing, with a 7% engine thrust level and the highest TIM value has the major contribution of HC emissions.
NOX is one of the most important primary non-CO2 pollutants in aviation. These emissions contribute to local air pollution and to the formation of secondary short-lived climate pollutants. It is generated during high-temperature and high-pressure combustion, which typically occurs when an aircraft is flying at high engine thrust settings. As shown in Figure 8, the quantity of the total amount of NOX produced is highest during the climb-out and take-off stages, as the aircraft’s engine thrust level approaches 85% and 100%, respectively. Additionally, the TIM that aircraft operates in these LTO stages is lower in comparison to the other stages.
Regarding PM, like other pollutants, there is a correlation between the quantity of PM emitted and the engine thrust level. Some studies confirm a direct relationship between engine thrust level and PM emissions in aviation [52]. Our data findings also reveal that the climb-out stage, characterised by an engine thrust level of 85% and relatively low TIM, has the highest contribution to LTO PM emissions. Moreover, it should be noted that it is assumed that all PM generated by aircraft has an aerodynamic diameter of less than 0.1 µm in accordance with the EEA/EMEP approach.

5. Conclusions

Emphasising sustainability in aviation practices aligns with global efforts to combat climate change and fosters a more resilient and environmentally conscious industry for future generations. An emission inventory is a starting point for the evaluation of the impact of aviation on air quality, which is one of the hot topics recently. By accurately quantifying and analysing aviation emissions, stakeholders can gain valuable insights to inform policy decisions and develop strategies aimed at mitigating the negative effects on air quality and preserving public health.
The primary goal of this research was to develop a comprehensive model that accurately estimates emissions resulting from aircraft operations at an airport, specifically focusing on the different LTO stages. The main effort of this work was to integrate publicly available data, incorporating widely recommended emission factors, and deliver emission results with the necessary spatial and temporal resolution for local-scale air quality assessments. The availability of online traffic data has presented a valuable opportunity to enhance the development of emission inventory models. These data, when combined with other relevant information, enable researchers and policymakers to more accurately assess the environmental impacts of aviation.
One of the challenges considered for the development of the emission model was compatibility with the requirements of air quality modelling while ensuring easy access to activity data for a specific airport. By developing this model, the study intends to provide a practical tool that can be readily utilised in air quality assessment and management. The approach emphasises the use of freely available air traffic data, making them accessible to users from various locations.
To assess the model’s applicability, Lisbon Portela International Airport was chosen as the study site to estimate emissions of CO, HC, NOX, and PM for both summer and winter seasons. This estimation was carried out considering three sets of EFs: (i) the base case, where the engine models of aircraft are known; (ii) EFs from the most frequently used engine models as recommended by EEA/EMEP and (iii) median EFs encompassing all engine models for each type of aircraft. In the context of the assessment of model performance and its sensibility, the percentage change and the Root Mean Squared Error analysis were applied for a representative day of each season.
The results show that different stages of LTO produce varying proportions of daily emissions, with HC and CO being significant during taxiing (93%), NOX primarily produced during climb-out (48%), and PM produced during climb-out (35%). Hence, two key parameters, TIM and engine thrust level of each LTO stage play a crucial role. The data on the number of flights, aircraft types, and emission levels suggest that there is no straightforward relationship between the number of flights and total emitted emissions. Rather, it is the specific characteristics of the aircraft type and engine model that significantly influence the amount of emissions generated. This emphasizes the importance of detailed aircraft data, which entails taking into account the unique characteristics of each aircraft type and its corresponding engine model. Simplified activity data from publicly accessible databases were used for the sensitivity analysis, which was conducted against comprehensive engine and emission factor data. The results showed daily emissions changes of less than 13% for CO and NOX and up to 34% for HC and PM.
The study’s conclusions provide policymakers with insightful information to help them make evidence-based decisions about aviation industry mitigation tactics considering air pollution. The research prepares stakeholders to take targeted actions for reducing aviation’s environmental impact on local air quality considering emission inventory based on publicly available air traffic data.
Further steps of this research work will additionally focus on the analysis of key factors and quantifying uncertainty in emission estimates, as well as pollutant concentration based on dispersion modelling at the airport level. However, it is essential not to overlook the limitations posed by the aircraft take-off weight, actual TIM, and engine efficiency in future studies. The release of this emission model is expected to aid in the investigation of local air quality issues caused by airport activities and promote the attainment of a sustainable environment. Additionally, it has the potential to pave the way for future opportunities to use publicly available air traffic data from any location for emissions analysis.

Author Contributions

Methodology, K.S. and O.T.; Software, K.S.; Formal analysis, K.S.; Data curation, K.S.; Writing—original draft, K.S.; Writing—review & editing, O.T.; Supervision, O.T. All authors have read and agreed to the published version of the manuscript.

Funding

This work was supported by Fundação para a Ciência e Tecnologia (FCT) by PhD scholarship of Kiana Sanajou (UI/BD/151113/2021).

Institutional Review Board Statement

Not applicable.

Informed Consent Statement

Not applicable.

Data Availability Statement

The data presented in this study are available on request from the authors.

Conflicts of Interest

The authors declare no conflicts of interest.

Appendix A

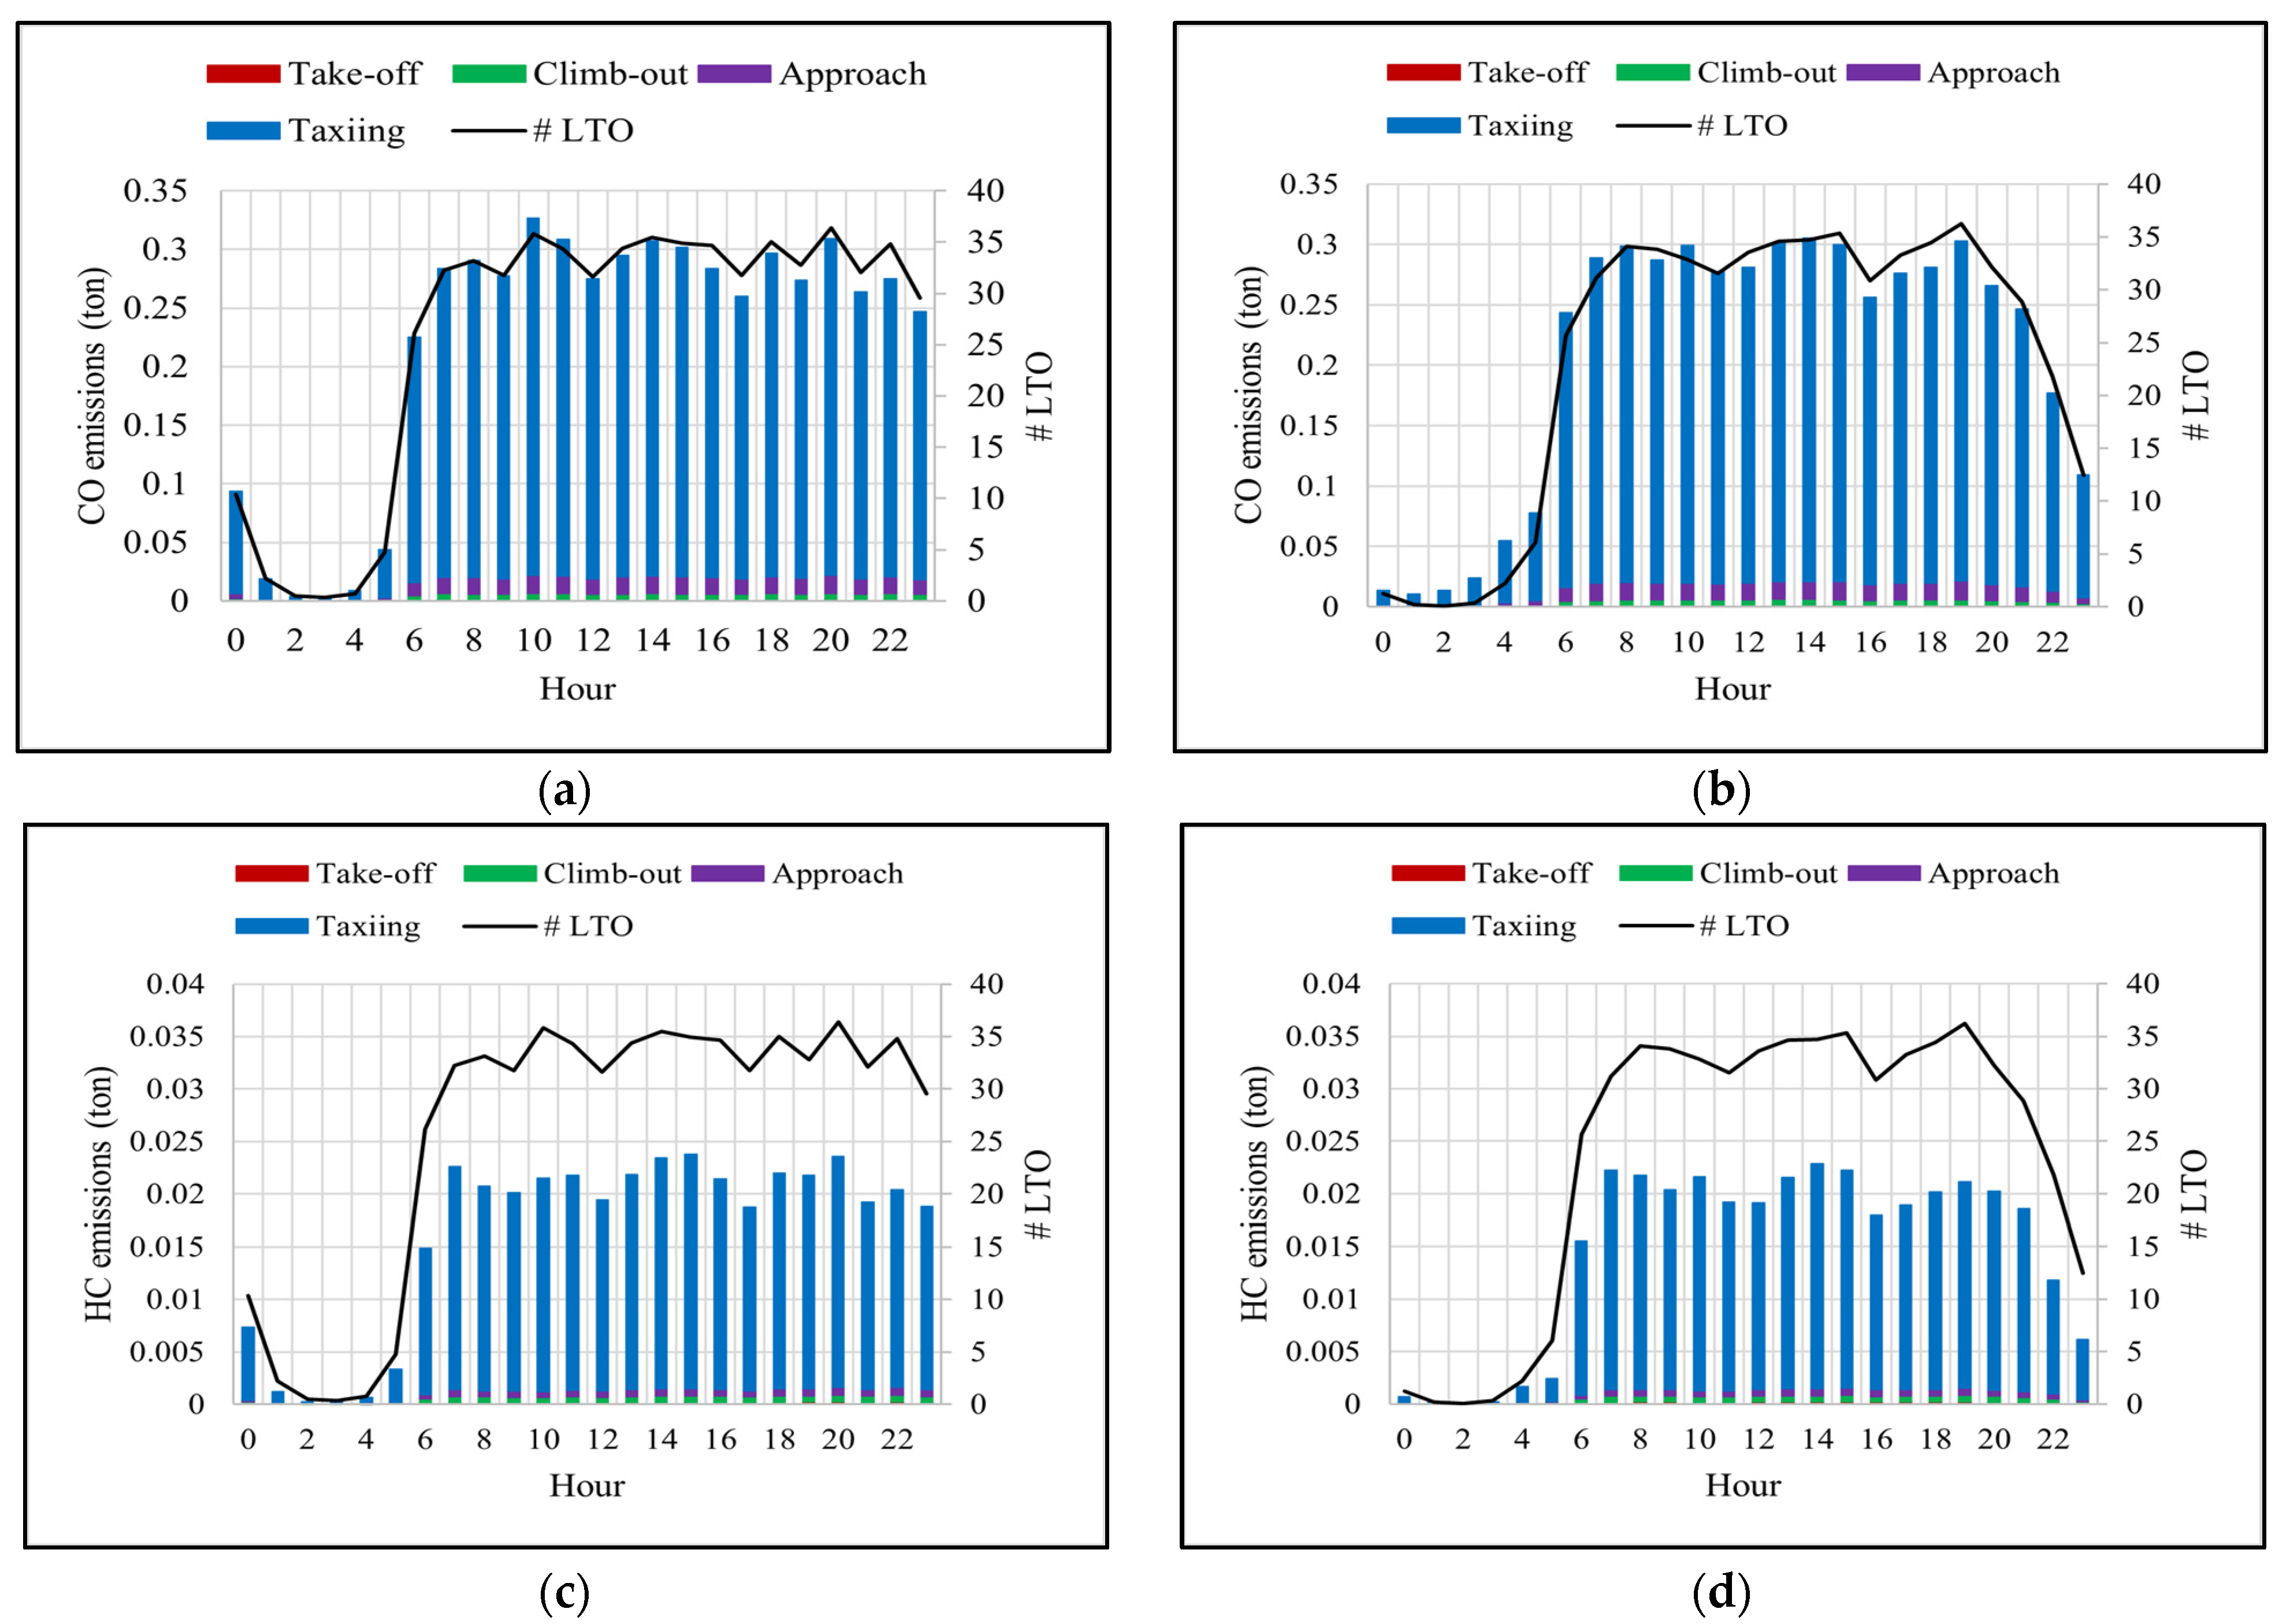
Figure A1. Temporal profile of CO, HC emissions considering different datasets of EFs, (a) summer-CO, (b) winter-CO, (c) summer-HC, and (d) winter-HC.
Sustainability 16 02558 g0a1
Figure A2. Temporal profile of average CO, and HC emissions and number of flights for (a) summer-CO, (b) winter-CO, (c) summer-HC and (d) winter-HC.
Sustainability 16 02558 g0a2

References

  1. Eurocontrol. Challenges of air transport 2030: Survey of experts’ views. In The European Organisation for the Safety of Air Navigation; Report Number 09/07/15-20; Eurocontrol: Brussels, Belgium, 2009. [Google Scholar]
  2. Lee, D.S.; Pitari, G.; Grewe, V.; Gierens, K.; Penner, J.E.; Petzold, A.; Prather, M.J.; Schumann, U.; Bais, A.; Berntsen, T.; et al. Transport impacts on atmosphere and climate: Aviation. Atmos. Environ. 2010, 44, 4678–4734. [Google Scholar] [CrossRef]
  3. Levy, J.I.; Woody, M.; Baek, B.H.; Shankar, U.; Arunachalam, S. Current and Future Particulate-Matter-Related Mortality Risks in the United States from Aviation Emissions during Landing and Takeoff. Risk Anal. 2012, 32, 237–249. [Google Scholar] [CrossRef]
  4. Lee, H.; Olsen, S.C.; Wuebbles, D.J.; Youn, D. Impacts of aircraft emissions on the air quality near the ground. Atmos. Chem. Phys. 2013, 13, 5505–5522. [Google Scholar] [CrossRef]
  5. Kapadia, Z.Z.; Spracklen, D.V.; Arnold, S.R.; Borman, D.J.; Mann, G.W.; Pringle, K.J.; Monks, S.A.; Reddington, C.L.; Benduhn, F.; Rap, A.; et al. Impacts of aviation fuel sulfur content on climate and human health. Atmos. Chem. Phys. 2016, 16, 10521–10541. [Google Scholar] [CrossRef]
  6. Vennam, L.P.; Vizuete, W.; Talgo, K.; Omary, M.; Binkowski, F.S.; Xing, J.; Mathur, R.; Arunachalam, S. Modeled Full-Flight Aircraft Emissions Impacts on Air Quality and Their Sensitivity to Grid Resolution. J. Geophys. Res. Atmos. 2017, 122, 13472–13494. [Google Scholar] [CrossRef]
  7. Phoenix, D.; Khodayari, A.; Wuebbles, D.; Stewart, K. Aviation impact on air quality present day and mid-century simulated in the Community Atmosphere Model (CAM). Atmos. Environ. 2019, 196, 125–132. [Google Scholar] [CrossRef]
  8. Unal, A.; Hu, Y.; Chang, M.E.; Odman, M.T.; Russell, A.G. Airport related emissions and impacts on air quality: Application to the Atlanta International Airport. Atmos. Environ. 2005, 39, 5787–5798. [Google Scholar] [CrossRef]
  9. Masiol, M.; Harrison, R.M. Aircraft engine exhaust emissions and other airport-related contributions to ambient air pollution: A review. In Atmospheric Environment; Elsevier Ltd.: Amsterdam, The Netherlands, 2014; Volume 95, pp. 409–455. [Google Scholar] [CrossRef]
  10. Hudda, N.; Fruin, S.A. International Airport Impacts to Air Quality: Size and Related Properties of Large Increases in Ultrafine Particle Number Concentrations. Environ. Sci. Technol. 2016, 50, 3362–3370. [Google Scholar] [CrossRef]
  11. Meleo, L.; Nava, C.R.; Pozzi, C. Aviation and the costs of the European Emission Trading Scheme: The case of Italy. Energy Policy 2016, 88, 138–147. [Google Scholar] [CrossRef]
  12. Lund, M.T.; Aamaas, B.; Berntsen, T.; Bock, L.; Burkhardt, U.; Fuglestvedt, J.S.; Shine, K.P. Emission metrics for quantifying regional climate impacts of aviation. Earth Syst. Dyn. 2017, 8, 547–563. [Google Scholar] [CrossRef]
  13. ICAO. Innovation for a Green Transition-2022 Environment Report; International Civil Aviation Organization: Montreal, QC, Canada, 2022. [Google Scholar]
  14. ICAO. Airport Air Quality Manual; Technical Report Doc 9889; International Civil Aviation Organization: Montreal, QC, Canada, 2020. [Google Scholar]
  15. Yim, S.H.L.; Lee, G.L.; Lee, I.H.; Allroggen, F.; Ashok, A.; Caiazzo, F.; Eastham, S.D.; Malina, R.; Barrett, S.R.H. Global, regional and local health impacts of civil aviation emissions. Environ. Res. Lett. 2015, 10, 034001. [Google Scholar] [CrossRef]
  16. Barrett SR, H.; Britter, R.E.; Waitz, I.A. Global mortality attributable to aircraft cruise emissions. Environ. Sci. Technol. 2010, 44, 7736–7742. [Google Scholar] [CrossRef]
  17. Riley, K.; Cook, R.; Carr, E.; Manning, B. A systematic review of the impact of commercial aircraft activity on air quality near airports. In City and Environment Interactions; Elsevier B.V.: Amsterdam, The Netherlands, 2021; Volume 11. [Google Scholar] [CrossRef]
  18. Eyers, C.J.; Norman, P.; Middel, J.; Plohr, M.; Michot, S.; Atkinson, K.; Christou, R.A. AERO2k Global Aviation Emissions Inventories for 2002 and 2025; European Commission: Hampshire, UK, 2004. [Google Scholar]
  19. Watterson, J.; Walker, C.; Eggleston, S. Revision to the Method of Estimating Emissions from Aircraft in the UK Greenhouse Gas Inventory, Report to Global Atmosphere Division, DEFRA, England. 2004.
  20. Pham VVan Tang, J.; Alam, S.; Lokan, C.; Abbass, H.A. Aviation emission inventory development and analysis. Environ. Model. Softw. 2010, 25, 1738–1753. [Google Scholar] [CrossRef]
  21. Fan, W.; Sun, Y.; Zhu, T.; Wen, Y. Emissions of HC, CO, NOx, CO2, and SO2 from civil aviation in China in 2010. Atmos. Environ. 2012, 56, 52–57. [Google Scholar] [CrossRef]
  22. Arunachalam, S.; West, J.; Bendor, T.K.; Binkowski, F.; Rissman, J.; Arunachalam, S.; Woody, M.; West, J.J.; Bendor, T.; Binkowski, F.S. A plume-in-grid approach to characterize air quality impacts of aircraft emissions at the Hartsfield-Jackson Atlanta International Airport. Atmos. Chem. Phys. 2013, 13, 9285–9302. [Google Scholar] [CrossRef]
  23. NIR. AgÍncia Portuguesa do Ambiente, National Inventory Report-Portugal. 2023. Available online: https://apambiente.pt/sites/default/files/_Clima/Inventarios/20230404/NIR202315%20April.pdf (accessed on 18 January 2024).
  24. Celikel, A.; Duchene, N.; Fleuti, E.; Hofmann, P. Airport local air quality modelling: Zurich airport emissions inventory using three methodologies. In Proceedings of the Eurocontrol Air Transport Research Society (ATRS) Conference, Rio de Janeiro, Brazil, 2–5 July 2005. [Google Scholar]
  25. Kim, B.; Fleming, G.; Balasubramanian, S.; Malwitz, A.; Lee, J.; Ruggiero, J.; Waitz, I.; Klima, K.; Stouffer, V.; Long, D.; et al. SAGE System for Assessing Aviation’s Global Emissions V1.5: Global Aviation Emissions Inventories for 2000 through 2004; FAA-EE-2005-02; FAA: Washington, DC, USA, 2005. [Google Scholar]
  26. Ashok, A.; Lee, I.H.; Arunachalam, S.; Waitz, I.A.; Yim, S.H.L.; Barrett, S.R.H. Development of a response surface model of aviation’s air quality impacts in the United States. Atmos. Environ. 2013, 77, 445–452. [Google Scholar] [CrossRef]
  27. Whiteley, M.; Gores, S.; Ntemiri, S.; Fernandez, R. European Aviation Fuel Burn and Emissions Inventory System for the European Environment Agency (for Data from 2005). Eurocontrol. 2018. Available online: https://www.eurocontrol.int/publication/european-aviation-fuel-burn-and-emissions-inventory-system-feis-european-environment (accessed on 27 September 2023).
  28. Michot, S.; Stancioi, N.; Mcmullan, C.; Peeters, S.; Carlier, S. AERO2K Flight Movement Inventory Project Report; EEC Report EEC/SEE/2003, 5; Eurocontrol: Brussels, Belgium, 2003. [Google Scholar]
  29. Schaefer, M. Methodologies for Aviation Emission Calculation-A Comparison of Alternative Approaches Towards 4D Global Inventories. Master Thesis, Berlin University of Technology, Berlin, Germany, 2006. [Google Scholar] [CrossRef]
  30. Tsilingiridis, G. Aircraft air pollutant emissions in greek airports. Glob. NEST J. 2009, 11, 4. [Google Scholar]
  31. Simonetti, I.; Maltagliati, S.; Manfrida, G. Air quality impact of a middle size airport within an urban context through EDMS simulation. Transp. Res. Part D Transp. Environ. 2015, 40, 144–154. [Google Scholar] [CrossRef]
  32. Hu, R.; Zhu, J.; Zhang, J.; Zheng, L.; Liu, B. Characteristics and mitigation measures of aircraft pollutant emissions at Nanjing Lukou International Airport (NKG), China. Promet-Traffic Transp. 2020, 32, 461–474. [Google Scholar] [CrossRef]
  33. Ekici, S.; Sevinc, H. Understanding a commercial airline company: A case study on emissions and air quality costs. Int. J. Environ. Sci. Technol. 2022, 19, 5139–5154. [Google Scholar] [CrossRef]
  34. Monforti, F.; Pederzoli, A. THOSCANE: A tool to detail CORINAIR emission inventories. Environ. Model. Softw. 2005, 20, 505–508. [Google Scholar] [CrossRef]
  35. Kurniawan, J.S.; Khardi, S. Comparison of methodologies estimating emissions of aircraft pollutants, environmental impact assessment around airports. Environ. Impact Assess. Rev. 2011, 31, 240–252. [Google Scholar] [CrossRef]
  36. Taghizadeh, S.A.; Shafabakhsh, G.H.; Aghayan, I. Evaluation of aircraft emission at Imam Khomeini International Airport and Mehrabad International Airport. Int. J. Environ. Sci. Technol. 2019, 16, 6587–6598. [Google Scholar] [CrossRef]
  37. Kesgin, U. Aircraft emissions at Turkish airports. Energy 2006, 31, 372–384. [Google Scholar] [CrossRef]
  38. Wilkerson, J.T.; Jacobson, M.Z.; Malwitz, A.; Balasubramanian, S.; Wayson, R.; Fleming, G.; Naiman, A.D.; Lele, S.K. Analysis of emission data from global commercial aviation: 2004 and 2006. Atmos. Chem. Phys. 2010, 10, 6391–6408. [Google Scholar] [CrossRef]
  39. Stettler, M.E.J.; Eastham, S.; Barrett, S.R.H. Air quality and public health impacts of UK airports. Part I: Emissions. Atmos. Environ. 2011, 45, 5415–5424. [Google Scholar] [CrossRef]
  40. Song, S.K.; Shon, Z.H. Emissions of greenhouse gases and air pollutants from commercial aircraft at international airports in Korea. Atmos. Environ. 2012, 61, 148–158. [Google Scholar] [CrossRef]
  41. Mokalled, T.; Le Calvé, S.; Badaro-Saliba, N.; Abboud, M.; Zaarour, R.; Farah, W.; Adjizian-Gérard, J. Identifying the impact of Beirut Airport’s activities on local air quality—Part I: Emissions inventory of NO2 and VOCs. Atmos. Environ. 2018, 187, 435–444. [Google Scholar] [CrossRef]
  42. Lu, C.; Liu, H.; Song, D.; Yang, X.; Tan, Q.; Hu, X.; Kang, X. The Establishment of LTO Emission Inventory of Civil Aviation Airports Based on Big Data. IOP Conf. Ser. Earth Environ. Sci. 2018, 128, 012069. [Google Scholar] [CrossRef]
  43. Kuzu, S.L. Estimation and dispersion modeling of landing and take-off (LTO) cycle emissions from Atatürk International Airport. Air Qual. Atmos. Health 2018, 11, 153–161. [Google Scholar] [CrossRef]
  44. Xu, H.; Fu, Q.; Yu, Y.; Liu, Q.; Pan, J.; Cheng, J.; Wang, Z.; Liu, L. Quantifying aircraft emissions of Shanghai Pudong International Airport with aircraft ground operational data. Environ. Pollut. 2020, 261, 114115. [Google Scholar] [CrossRef]
  45. Arunachalam, S.; Baek, B.H.; Wang, B.; Davis, N.; Holland, A.; Adelman, Z.; Shankar, U.; Binkowski, F.; Hanna, A.; Thrasher, T.; et al. 5.1 An Improved Method to Represent Aviation Emissions in Air Quality Modelling Systems and Their Impacts on Air Quality. 2008. Available online: http://www.epa.gov/ttn/amtic/ (accessed on 25 June 2023).
  46. EMEP/EEA. European Environment Agency, Air Pollutant Emission Inventory Guidebook 2019: Technical Guidance to Prepare National Emission Inventories, Report No 13/2019; EMEP/EEA: Copenhagen, Denmark, 2019.
  47. ANAC. Anuário da Aviação Civil. Civil Aviation Yearbook (2003–2007); Autoridade Nacional da Aviação Civil: Lisboa, Portugal, 2008; Available online: https://www.anac.pt/SiteCollectionDocuments/Publicacoes/anuarios/anuario_ac_2003_07.pdf (accessed on 16 August 2023).
  48. ANAC. Anuário da Aviação Civil, Civil Aviation Yearbook 2019; Autoridade Nacional da Aviação Civil: Lisboa, Portugal, 2020; Available online: https://www.anac.pt/SiteCollectionDocuments/Publicacoes/anuarios/ACC_2019.pdf (accessed on 16 August 2023).
  49. Anderson, B.E.; Chen, G.; Blake, D.R. Hydrocarbon emissions from a modern commercial airliner. Atmos. Environ. 2006, 40, 3601–3612. [Google Scholar] [CrossRef]
  50. Yelvington, P.E.; Herndon, S.C.; Wormhoudt, J.C.; Jayne, J.T.; Miake-Lye, R.C.; Knighton, W.B.; Wey, C. Chemical speciation of hydrocarbon emissions from a commercial aircraft engine. J. Propuls. Power 2007, 23, 912–918. [Google Scholar] [CrossRef]
  51. Herndon, S.C.; Jayne, J.T.; Lobo, P.; Onasch, T.B.; Fleming, G.; Hagen, D.E.; Whitefield, P.D.; Miake-Lye, R.C. Commercial aircraft engine emissions characterization of in-use aircraft at Hartsfield-Jackson Atlanta International Airport. Environ. Sci. Technol. 2008, 42, 1877–1883. [Google Scholar] [CrossRef]
  52. Durdina, L.; Brem, B.T.; Abegglen, M.; Lobo, P.; Rindlisbacher, T.; Thomson, K.A.; Smallwood, G.J.; Hagen, D.E.; Sierau, B.; Wang, J. Determination of PM mass emissions from an aircraft turbine engine using particle effective density. Atmos. Environ. 2014, 99, 500–507. [Google Scholar] [CrossRef]
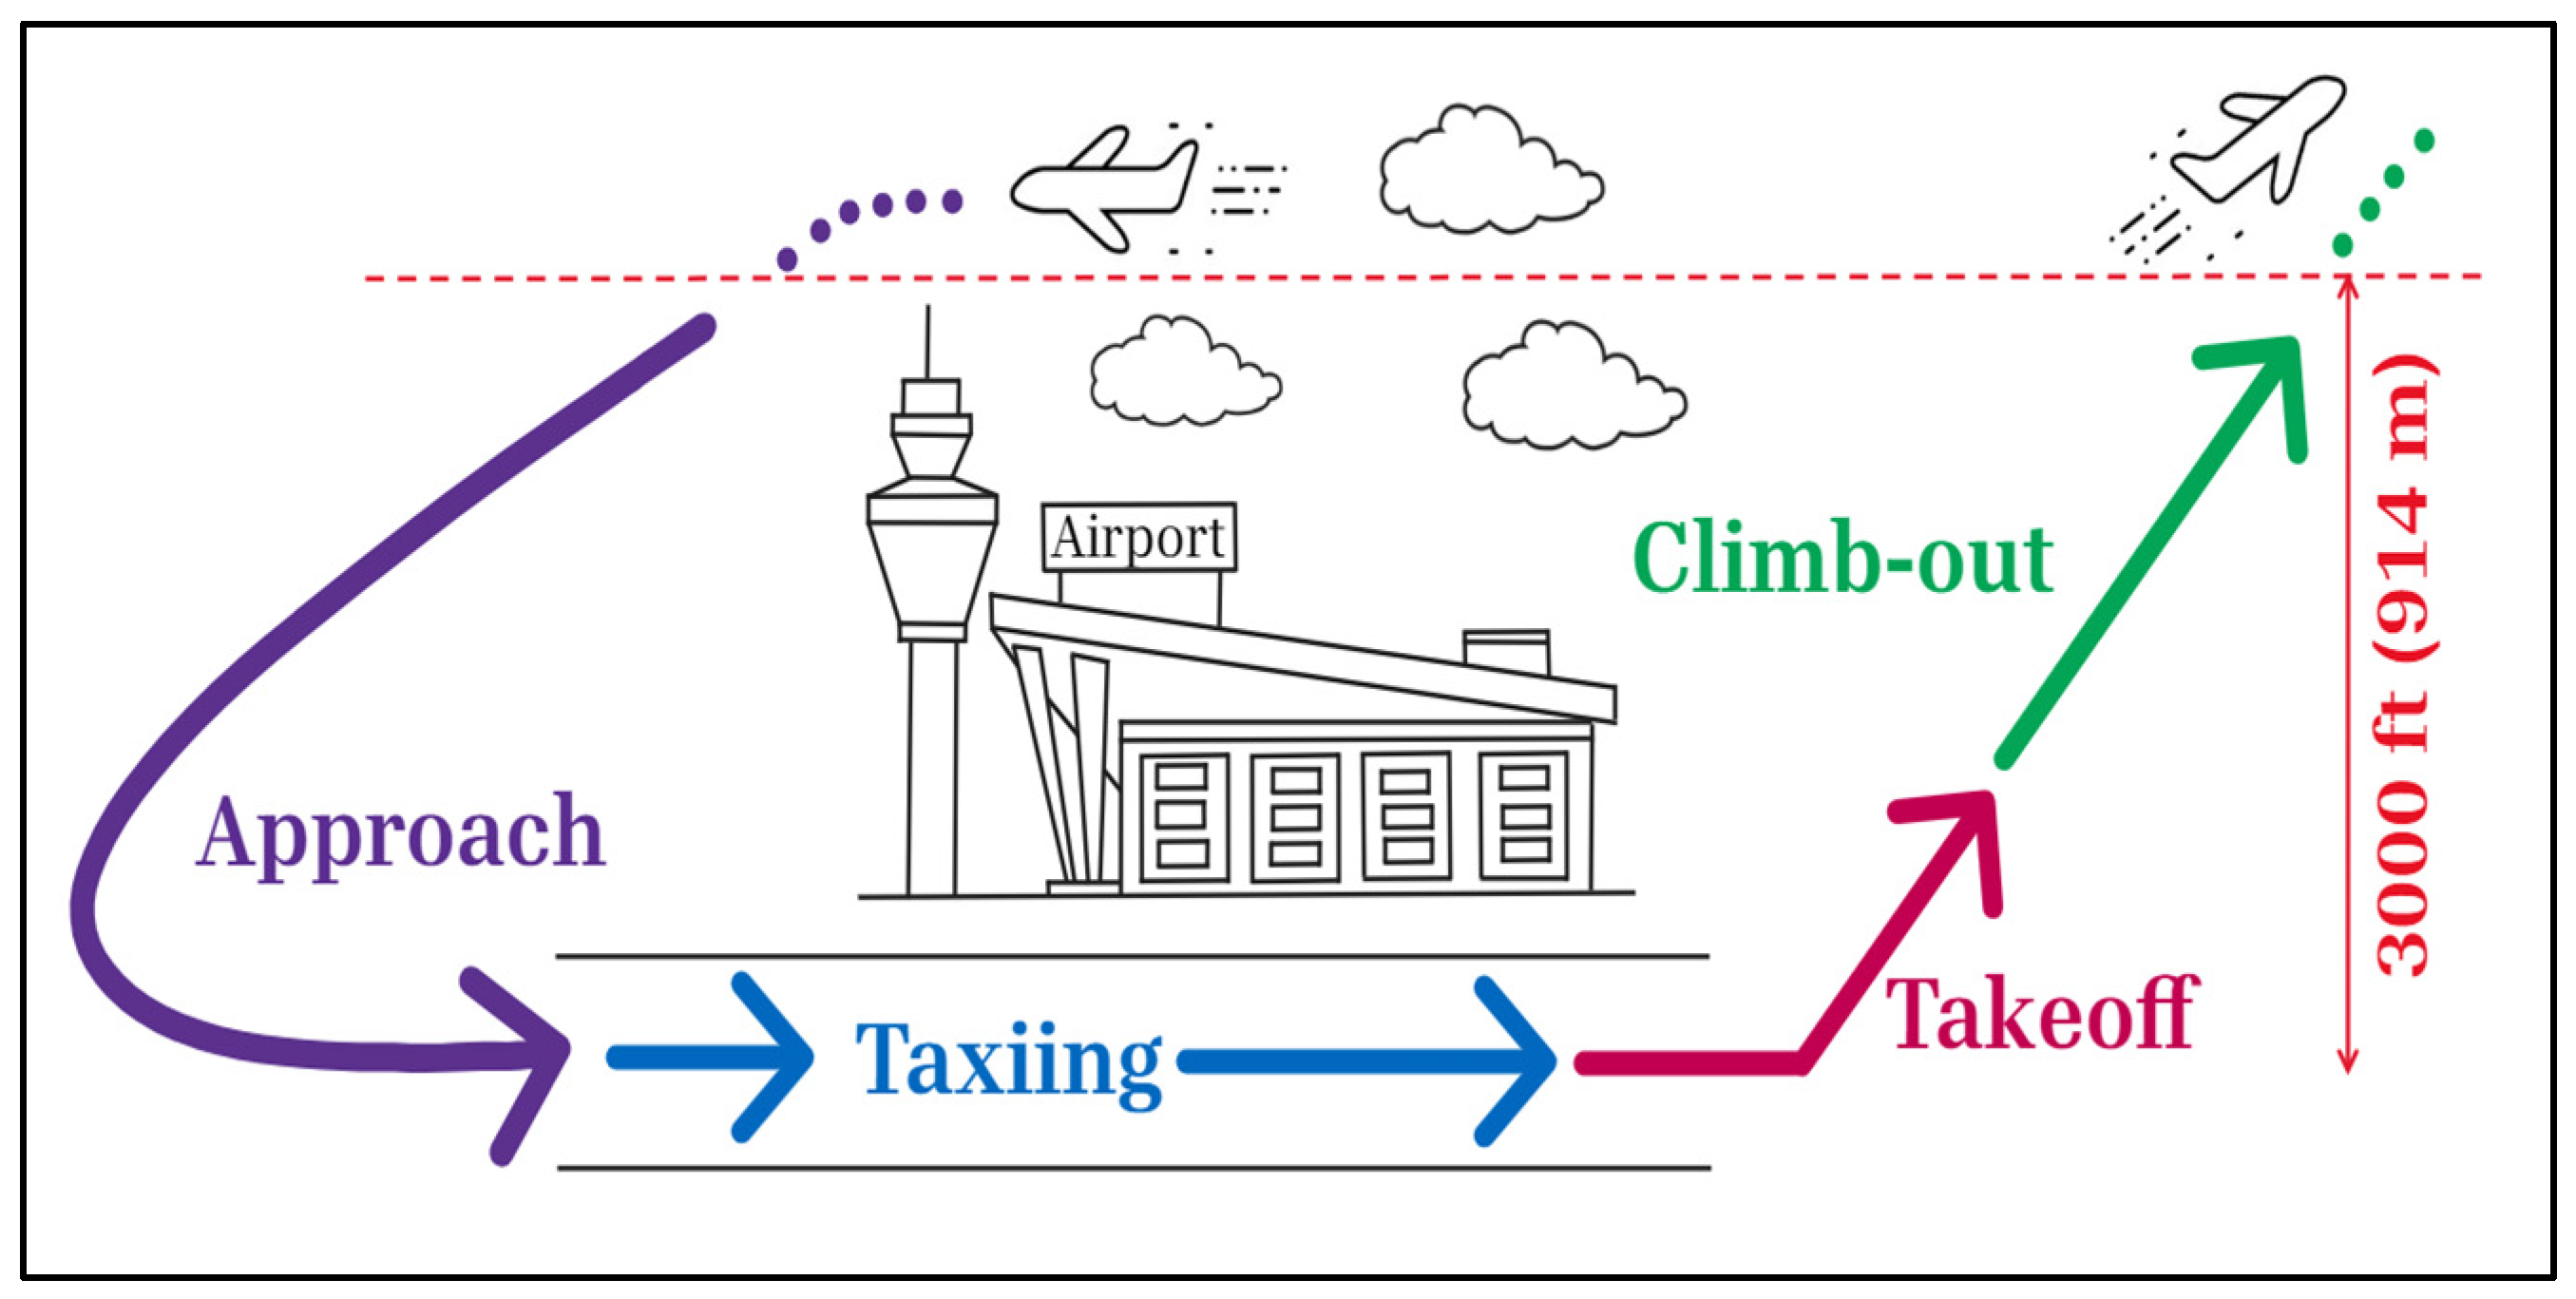
Figure 1. Different LTO stages distinguished for aircraft emissions quantification.
Sustainability 16 02558 g001
Figure 2. A sample of the data collected from Flightradar24 (https://www.flightradar24.com/data/airport/lis).
Sustainability 16 02558 g002
Figure 3. Flowchart illustrating the developed emission model.
Sustainability 16 02558 g003
Figure 4. (a) Total number of flights per day for the study periods at LIS, (b) the percentage of aircraft types flown during summer and winter seasons at LIS.
Sustainability 16 02558 g004
Figure 5. Temporal distribution of flights for (a) summer, and (b) winter seasons at LIS.
Sustainability 16 02558 g005
Figure 6. Temporal profile of NOx, PM emissions considering different datasets of EFs, (a) summer-NOx, (b) winter-NOx, (c) summer-PM, and (d) winter-PM.
Sustainability 16 02558 g006aSustainability 16 02558 g006b
Figure 7. Temporal profile of average NOx, and PM emissions and number of flights for (a) summer-NOX, (b) winter-NOX, (c) summer-PM and (d) winter-PM.
Sustainability 16 02558 g007
Figure 8. Contribution of different LTO stages to daily emissions in summer.
Sustainability 16 02558 g008
Table 1. Summary table of aviation emissions calculation with regard to different LTO stages.
Ref.ContentResults
[21]Methodology: BFFM2
Scope: Country level
Emissions: CO, HC, NOX, SO2, CO2
  • The annual LTO emissions in China in 2010: 39,700 tons CO, 4600 tons HC, 154,100 tons NOX, 9700 tons SO2, and 38.21 million tons CO2.
  • Fuel consumption on domestic flights in China (excluding Taiwan Province) in 2010: 12.12 million tons.
[30]Methodology: EEA/EMEP
Scope: Country level
Emissions: CO, VOC, NOX, SO2, PM2.5
  • Emissions from Greek airports increased significantly from 1980 to 2005, following the growth of air traffic.
  • Athen’s airport had the highest contribution to total air traffic and emissions, but its share decreased from 59.0% in 1980 to 42.2% in 2005.
  • NOX emissions increased at a faster rate. Lower rates of increase were seen in CO and VOC emissions.
[31]Methodology: EDMS
Scope: Airport level
Emissions: CO, HC, NOX, SOX, PM10, and CO2
  • Take-off stage contributes significantly to NOX, SOX, and PM10 emissions, while the taxiing stage decreases in relative contribution in the future layout.
  • SOX concentrations remain below daily and yearly limits but are still significant, reaching up to 50% of the background levels in nearby zones.
[32]Methodology: ICAO
Scope: Airport level
Emissions: CO, HC, NOX, SO2, PM
  • The annual LTO emissions in NGK airport (China) in 2016: 921.3 tons CO, 123.7 tons HC, 1207.7 tons NOX, 268.3 tons SO2, 36.2 tons PM.
  • Taxiing stage dominant contributor to CO and HC emissions during LTO cycles. Take-off and climb-out stages with high thrust setting major contributors to NOX emissions.
[37]Methodology: ICAO
Scope: Country level
Emissions: HC, CO, NOX, and SO2
  • The (total) annual LTO emissions in Turkey from aircraft operating in 2001 ranged from 7614.34 to 8338.79 tons.
  • It is predicted that emissions will rise by 31% to 33% in response to a 25% increase in LTO cycles.
  • A 6% reduction in LTO emissions could be achieved by cutting the taxiing time by two minutes.
[38]Methodology: AEDT
Scope: Airport level,
Emissions: CO, NOX, SO2, PM, CO2
  • The annual growth rate in fuel burn from 2004 to 2006 was 3.95%.
  • In 2006, short-haul flights denoted 85.2% of all commercial flights accounted for 53.9% of total distance travelled.
[39]Methodology: EDMS, FOA3
Scope: Country level
Emissions: CO, HC, NOX, SO2, PM2.5, and CO2
  • The annual LTO emissions in UK airports in 2005: 117 × 102 tons CO, 1800 tons HC, 10,200 tons NOX, 730 tons SO2, 310 tons PM2.5, and 2.4 × 10⁶ tons CO2.
  • To determine the effect on public health and air quality, the emissions will be entered into CTM model.
[40]Methodology: EDMS
Scope: Country level
Emissions: CO, VOCs, NOX, N2O, PM, and CO2
  • The (average) annual LTO emissions from aircraft operating at Korea were 4120 tons CO, 746 tons VOCs, 5200 tons NOX, 17.6 tons N2O, 33.7 tons PM, 1.11 × 10⁶ tons CO2.
  • Emissions varied considerably for each aircraft operational mode, with the highest emissions observed during the taxi-out mode.
[41]Methodology: EMIT
Scope: Airport level
Emissions: VOCs, NOX, NO2, NO
  • The annual LTO emissions in Beirut airport in 2012: 24.4 tons VOCs, 454.8 tons NOX, 50.7 tons NO2, 404.1 tons NO.
  • Aircraft activities (LTO cycle) account for the majority of emissions at the airport: 58% of VOC emissions, 91% of NOX emissions, 92% of NO2 emissions, 91% of NO emissions.
[42]Methodology: ICAO
Scope: Airport level
Emissions: CO, VOCs, NOX, SO2, PM10, PM2.5
  • The annual LTO emissions at Shuangliu International Airport of China in 2015: 2024.08 tons CO, 266.75 tons VOCs, 4140.16 tons NOX, 276.50 tons SO2, 30.18 tons PM10, 29.63 tons PM2.5.
  • The study provided information on the uncertainty of the model, which ranged from approximately 7% to 10% for different pollutants.
[43]Methodology: ICAO, EEA/EMEP
Scope: Airport level
Emissions: CO, HC, NOX
  • The annual LTO emissions at Atatürk International Airport in 2015: 2153 tons CO, 181 tons HC, 4249 tons NOX.
  • CO and HC emissions are primarily generated during the taxiing stage. NOX emissions are mainly produced during the climb-out stage.
[44]Methodology: ACARS
Scope: Airport level
Emissions: CO, HC, HONO, HNO3, NOX, NO2, NO, NOY, SO2, SO4, PM2.5, BC, OC
  • The annual LTO emissions in Shanghai Pudong airport (China) in 2017: 4350 tons CO, 382 tons HC, 103 tons HONO, 3.83 tons HNO3, 5360 tons NOX, 958 tons NO2, 4400 tons NO, 5470 tons NOY, 3.56 tons SO2, 13.1 tons SO4, 72.2 tons PM2.5, 54.3 tons BC, 4.73 tons OC.
  • Using the maximum height of the mixing layer led to emissions increases, especially for NOX (up to 16.9%).
[45]Methodology: EDMS
Scope: Country level
Emissions: PM2.5
  • Assessing three major US airports, the study found that aviation emissions contribute up to 1.5% of annual average PM2.5 levels at the Chicago airport.
  • The study suggests that LTO aircraft emissions can affect air quality up to 250 km from the airports.
Table 2. Default ICAO engine thrust level and time-in-mode for different LTO stages [14].
LTO CycleThrust Level (%)TIM (s)
Take-off10042
Climb-out85132
Approach30240
Taxiing71560
Table 3. EFs in (kg s−1) of A-320 for NOX according to EEA/EMEP dataset [46].
Engine ModelTake-OffClimb-OutApproachTaxiing
PW1127G-JM0.014215390.009376710.002054920.00058782
CFM56-5-A10.025854600.016895200.002328000.00040440
CFM56-5A30.029858400.019517500.002548100.00042804
CFM56-5B4/20.019599800.012265500.002053550.00054329
CFM56-5B4/2P0.020976000.012920000.002210000.00046800
CFM56-5B4/30.024632900.016178970.002796600.00043044
CFM56-5B4/P0.031696000.021692000.003120000.00044720
CFM56-5B6/P0.022679600.0156604000.002530000.00038800
V2500-A10.041325700.0284776800.004492300.00073284
V2527-A50.027904500.0196240000.002839100.00060160
V2527E-A50.027904500.0196240000.002839100.00060160
Table 4. Daily emissions estimated for selected days considering different datasets.
SeasonDayDatasetEmissions (ton)
COHCNOxPM
Summer11 July 2022D15.13600.51147.82700.0457
D24.66530.33577.83460.0590
D 35.27430.38906.98670.0445
Winter23 February 2023D 15.11970.37796.86260.0409
D24.47740.31847.09910.0525
D 34.99900.35286.28990.0411
Table 5. Percentage difference between defined datasets (D2, D3) in the comparison with the base case (D1).
SeasonDayDatasetDifference with D1 (%)
COHCNOXPM
Summer11 July 2022D29.234.40.129.2
D32.723.910.72.6
Winter23 February 2023D212.615.73.428.4
D32.46.68.30.5
Table 6. Root mean square error values of defined datasets.
COHCNOXPM
D20.028170.006840.010670.00063
D30.019350.005440.035050.00012
Disclaimer/Publisher’s Note: The statements, opinions and data contained in all publications are solely those of the individual author(s) and contributor(s) and not of MDPI and/or the editor(s). MDPI and/or the editor(s) disclaim responsibility for any injury to people or property resulting from any ideas, methods, instructions or products referred to in the content.