Article

A Novel Approach to Detecting the Salinization of the Yellow River Delta Using a Kernel Normalized Difference Vegetation Index and a Feature Space Model

1
School of Civil Engineering and Geomatics, Shandong University of Technology, Zibo 255000, China
2
Key Laboratory of Remote Sensing of Gansu Province, Heihe Remote Sensing Experimental Research Station, Northwest Institute of Eco-Environment and Resources, Chinese Academy of Sciences, Lanzhou 730000, China
*
Authors to whom correspondence should be addressed.
These authors contributed equally to this work.
Sustainability 2024, 16(6), 2560; https://doi.org/10.3390/su16062560
Submission received: 22 December 2023 / Revised: 6 March 2024 / Accepted: 18 March 2024 / Published: 20 March 2024

Abstract

:
Using the kernel normalized difference vegetation index (KNDVI) to monitor soil salinization has great advantages; however, approaches using KNDVI and a feature space model to monitor salinization have not yet been reported. In this study, the KNDVI, normalized difference vegetation index (NDVI), extended difference vegetation index (EDVI), green normalized difference vegetation index (TGDVI), modified soil-adjusted vegetation index (MSAVI), and salt index (SI) were used to establish five feature space monitoring indices for salinization. The spatio-temporal evolution pattern of soil salinization in the Yellow River Delta from 2000 to 2020 was analyzed based on the optimal monitoring index. The remote sensing monitoring index model based on KNDVI-SI’s point-to-point mode had the best applicability with R2 = 0.93, followed by EDVI-SI’s salinization monitoring index model with R2 = 0.90. From 2000 to 2020, soil salinization in the Yellow River Delta followed an exacerbating then improving trend. Soil salinization was more severe in the northern and eastern coastal areas of the Yellow River Delta. These results are conducive to salinization restoration and control in the Yellow River Delta.

1. Introduction

The Yellow River Delta is one of the most important agricultural regions in China. However, the region has faced severe salinization problems. Many farmlands and cultivated lands have suffered different degrees of salinization. According to statistics, saline–alkali soil in the region accounts for more than 50% of the cultivated land in the whole region [1]. Salinization in the Daonan and Binbei areas has been a prominent issue since 2020. Saline–alkali soil decreases soil fertility, negatively affects the growth and development of crops, and significantly reduces yield [2]. The groundwater level in the Yellow River Delta is high, the salt content in the groundwater and soil is high, and the permeability of the soil layer is low. Agricultural irrigation, the river water body, groundwater exploitation, and other factors have led to the decline in the groundwater level. The salt rises to the root layer and enters the crop system, leading to soil salinization [3]. In addition, salinization formation is also related to the evaporation of surface water and the incomplete absorption of crop roots. These elements interact and accumulate, aggravating the degree of salinization. Salinization leads to the inability to cultivate saline–alkaline land, which is detrimental to the growth and development of crops, affects the quality and yield of crops, and severely restricts the sustainable development of agricultural production [4]. Salinization has also caused damage to the ecological environment. Vegetation grown in saline–alkali soil is sparse, biodiversity is severely affected, and land degradation is apparent. Salinization and the decline in the groundwater level lead to seawater intrusion, which severely affects the safety of infrastructure for residents, farmland, and ports in coastal areas [5]. At the same time, poor water quality in saline–alkali areas poses a potential threat to people’s lives and health [6]. Therefore, research on the methods able to monitor soil salinization has always been a topical issue.
Previous soil salinization monitoring studies have mostly been based on the modified soil-adjusted vegetation index (MSAVI), normalized difference vegetation index (NDVI), and salt index (SI) retrieved from Landsat series satellite images. For example, Wang et al. [7] proposed the concept of an NDVI-SI feature space based on Landsat-ETM + data and field survey data. They constructed a remote sensing monitoring index model of soil salinization, conducted a quantitative analysis, and monitored salinization. Zhang et al. [8] used Landsat-OLI satellite images to comprehensively analyze the relationship between the modified soil-adjusted vegetation index (MSAVI) and the Salinity Index (SI) and to monitor and manage soil salinization by remote sensing. Liu et al. [9] used Landsat data to construct a remote sensing inversion model of soil salinity using an improved vegetation index (MSAVI) and salinity index (SI). Afterward, they obtained the actual distribution of land types with different salinization degrees based on MODIS data products. Wang et al. [10] used the modified soil-adjusted vegetation index (MSAVI) to construct a model and prove its feasibility for drought monitoring and early warning signs in the Beijing–Tianjin–Hebei region. These research results show that MSAVI-SI produces better monitoring results for salinization. Therefore, we selected the modified soil-adjusted vegetation index (MSAVI) as a typical surface parameter. Wang et al. [11] used the extended enhanced vegetation index (EEVI) to study the sensitivity of soil salinity, with Landsat TM/ETM+/OLI as the data source. Zhang et al. [12] used Landsat8-OLI remote sensing images to establish rules based on the green normalized difference vegetation index (GNDVI). They also constructed a decision tree model for vegetation information extraction, which proved the feasibility of monitoring the spatial distribution of vegetation. Ren et al. [13] used TM remote sensing images as their data source and combined the soil greenness index (TGDVI) with the pixel dichotomy model to study the process of spatial and temporal changes and trends in the vegetation cover grades. Hong et al. [5] used Landsat 8 OLI multi-spectral images to construct an Albedo-SI model using the surface reflectance index (Albedo) and salinity index (SI), which proved the feasibility of this model for salinization monitoring. Liu et al. [14] constructed an ecological drought vulnerability index (EDVI) in Northwest China. They analyzed the EDVI’s spatial autocorrelation and evolution trends and evaluated ecological problems in Northwest China. Dai et al. [15] studied the spatial and temporal changes in the enhanced vegetation index (EVI) and its driving mechanism in the Sichuan Basin. They also provided a theoretical basis for the dynamic monitoring of vegetation and ecological environment quality assessment in the Sichuan Basin. Based on multi-temporal Landsat8 data, Zhu et al. [16] established a remote sensing yield estimation model for maize in Lishu County, Jilin Province. These results showed that the cumulative normalized difference vegetation index (NDVI) value and the cumulative ratio vegetation index (RVI) value reached their maximum values during the tasseling period of maize growth, which provided a basis for the application of remote sensing to crops. Yuan et al. [17] combined Sentinel-2 MSI images to construct a vegetation index for extracting sparse non-photosynthetic vegetation (NPV) coverage information. By constructing an EDVI index model, the rapid extraction and monitoring of large-scale NPV coverage in arid and semi-arid areas, where NPV has low coverage and plays an important role, can be effectively realized. We also selected the kernel normalized difference vegetation index (KNDVI), normalized difference vegetation index (NDVI), and extended difference vegetation index (EDVI) according to their use in previous studies. The green normalized difference vegetation index (TGDVI) and salt index (SI) were used as typical surface parameters for salinization. Although previous investigations based on traditional vegetation indices had better salinization monitoring results, these indices did not reflect the vegetation conditions, which reduced the accurate detection of salinization. The newly proposed kernel normalization index (KNDVI) has greater advantages in monitoring land degradation and vegetation changes [14]. Compared to the traditional normalization index, KNDVI’s stability is stronger, and it reduces the influence of noise and outliers. It can adapt to different types of vegetation and geographical environments, providing more accurate vegetation information. However, the newly proposed index has rarely been studied in combination with a feature model to detect salinization.
In this study, we used the KNDVI, normalized difference vegetation index (NDVI), extended difference vegetation index (EDVI), green normalized difference vegetation index (TGDVI), modified soil-adjusted vegetation index (MSAVI), and salt index (SI) to construct five feature space monitoring indices for salinization. Then, the optimal salinization monitoring index was determined. Finally, we analyzed the spatial and temporal evolution patterns of soil salinization in the Yellow River Delta from 2000 to 2020 based on the optimal remote sensing monitoring index salinization model. The novelty of this paper is that it proposes an optimal salinization morning method based on the KNDVI and feature space model, and aims to provide a new approach to revealing the process of salinization in the Yellow River Delta.

2. Materials and Methods
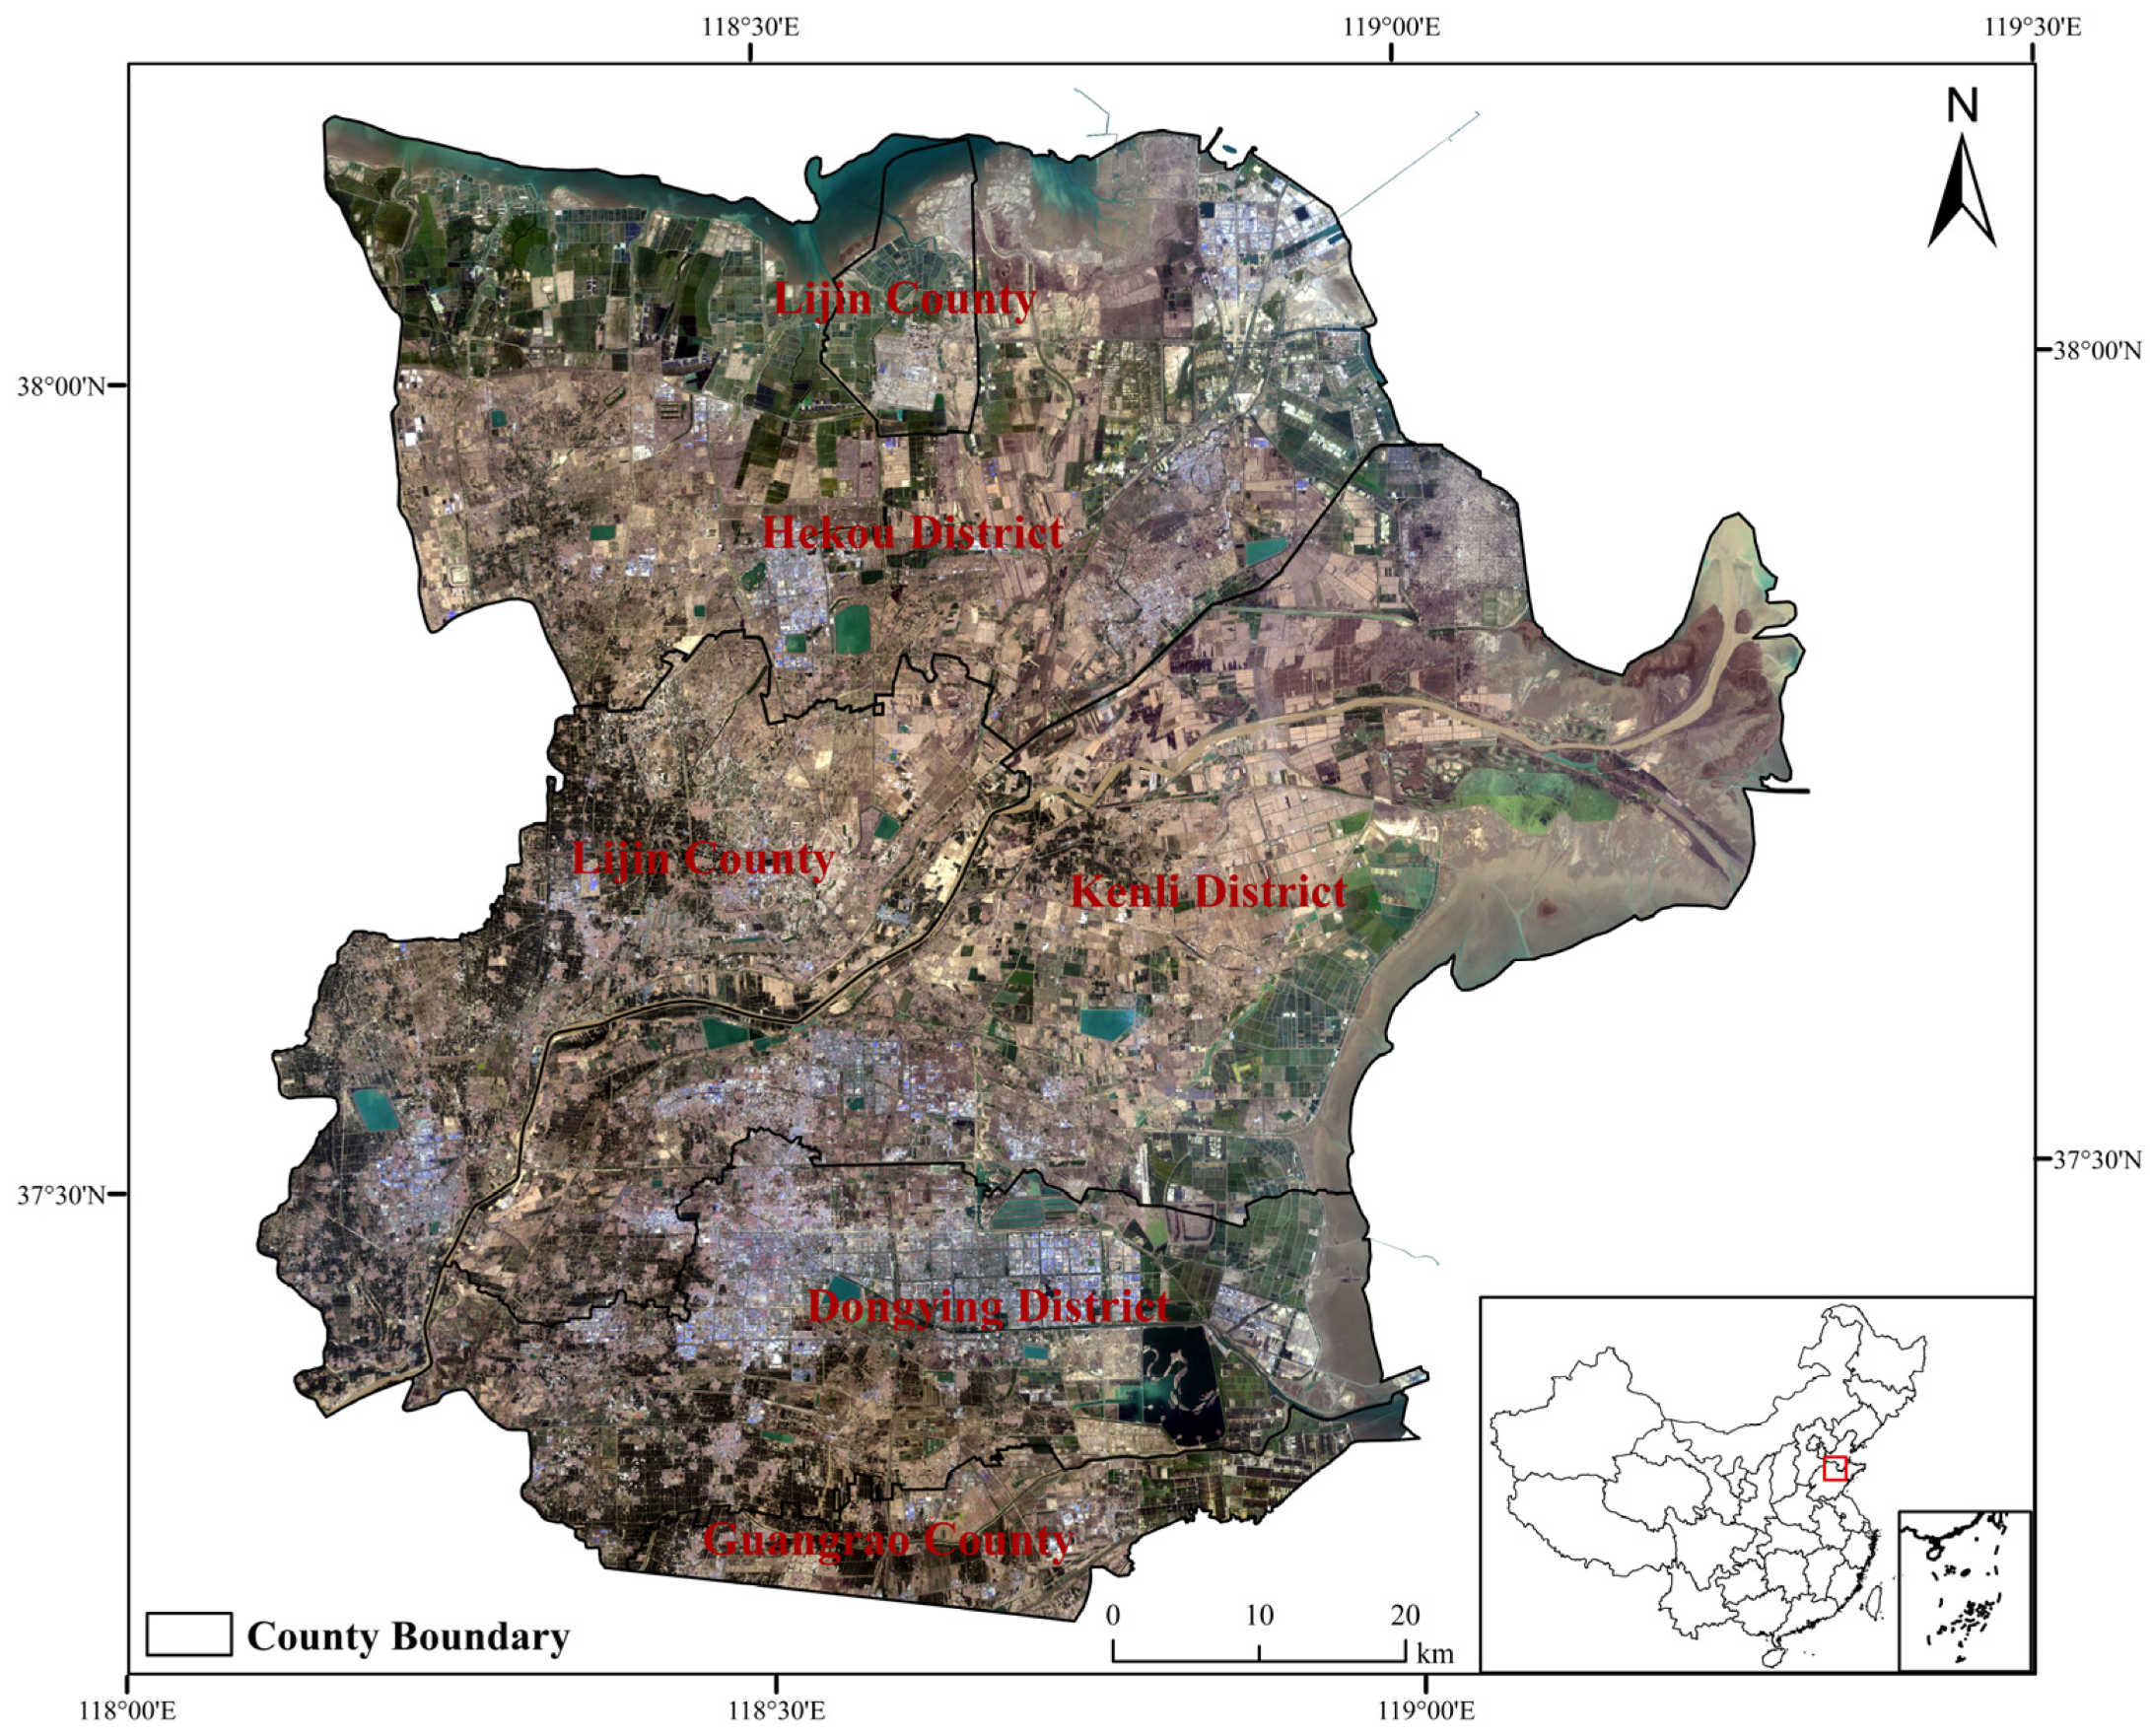
2.1. Study Area

The modern Yellow River Delta (118°07′ E–119°10′ E, 37°20′ N–38°12′ N) is a fan-shaped zone that has the Kenlining Sea as its apex and that starts from the Taoer Estuary in the north and extends to the branch gully mouth in the south (Figure 1) [18]. Its name refers to the plain formed by sediments from the Yellow River estuary in the Bohai Sea depression. The Eurasian continent and the Pacific Ocean affect the Yellow River Delta, which belongs to the warm temperate semi-humid continental monsoon climate zone. It is hot and rainy in summer, cold and dry in winter, and has four distinct seasons. This region’s total area is about 5400 km2. The terrain is high in the southwest and low in the northeast, and the average altitude is <10 m. The average annual temperature in this area is between 11.7 and 12.6 °C. The average sunshine hours are between 2590 and 2830 h, and the annual precipitation is between 530 and 630 mm. However, precipitation is unevenly distributed throughout the year, with strong interannual variation. The average evapotranspiration is 750–1400 mm [19]. This area is characterized by higher evaporation and lower precipitation, which causes the salt in the soil to accumulate under evaporation, contributing to the aggravation of soil salinization in this area. After preprocessing the original data via radiation correction, atmospheric correction and image cutting, the profile map of the study area was obtained.

2.2. Data Source and Preprocessing

In this study, Landsat series satellite data were used, as shown in Table 1. Landsat satellites can obtain high-resolution images of up to 30 m. Due to the interannual variation in precipitation in the Yellow River Delta, the seasonal characteristics of salinization are significant. In this study, Landsat images from April 2000, 2009, and 2020 were selected for radiometric calibration, atmospheric correction, boundary clipping, and index inversion in the ENVI, and multi-band images were output.

2.3. Selection of Typical Surface Parameters

Salinization is mostly monitored based on the MSAVI, NDVI and SI. In this study, five vegetation indices (KNDVI, NDVI, EDVI, TGDVI and MSAVI) and the salinity index (SI) were selected to construct the feature space salinization monitoring index. By introducing the new KNDVI, the vegetation index and salinization index are used to construct a better salinization monitoring model. The NDVI is one of the most important parameters reflecting crop growth and nutrition information, and is calculated by measuring the energy absorbed and reflected by vegetation in infrared and visible bands [7]. The TGDVI has a higher correlation with vegetation biomass than the NDVI [10]. The EDVI can correctly identify surface vegetation’s water content [15]. The MSAVI can use the reflectance of visible and near-infrared bands to eliminate the influence of light soil backgrounds, thereby extracting accurate soil vegetation information [20]. Comparatively, the KNDVI aligns more with the current situation, has a more dynamic range, and separates the vegetation material cycle from background noise [21]. The salt index directly reflects information about the salt in the soil. Table 1 shows the calculation formula.

2.4. Standardization of Indicators

The dimensions of different characteristic parameters differ. Therefore, to eliminate the influence of the aforementioned factors and improve the salinity inversion accuracy [22,23,24], different indicators were standardized in this study (Formula (1)):
V i = ( F i F i , min ) / ( F i , max F i , min )
where V i represents standardized indicators; F i is the original indicator; F i , min is the minimum value of the original index; and F i , max is the maximum value of the original index.

2.5. Construction of Feature Space

To reduce the influence of water and buildings on soil salinization extraction and improve the inversion accuracy of feature spaces, land use data, excluding areas such as rivers, lakes, and artificial buildings, were downloaded from the Resource Environment and Data Center of the Chinese Academy of Sciences (https://www.resdc.cn, accessed on 10 July 2023). The land cover data were from 2010 and 2020, with a data resolution of 30 m. Six surface parameters (TGDVI, EDVI, NDVI, MSAVI, SI) were normalized. Five feature spaces were then constructed using a 2D scatterplot tool in ENVI 5.3 to establish a soil salinization monitoring index for the Yellow River Delta based on the KNDVI, NDVI, EDVI, TGDVI, MSAVI, and SI. Figure 2 shows that according to the spatial differentiation law of different point groups in the feature space, the feature space constructed by different surface parameters belongs to the point-to-point model. Taking Figure 2d as an example, the NDVI represents the degree of lushness in plants. Combined with field observation data, it can be determined that the larger the NDVI value, the lower the degree of salinization, and vice versa. The SI represents the salinization index; the higher the index, the more serious the degree of salinization. Therefore, the distance from any point in the feature space to the origin O can represent the degree of salinization. The farther away the O point is, the more serious the degree of salinization.

2.6. Establishment of Salinization Monitoring Index Model

Figure 3 shows the spatial distribution of point groups at different salinization levels in the KNDVI-SI feature space. There are significant differences in the spatial distribution of different soil salinization levels in the feature space. The farther the distance from any point in the feature space to the origin point (1, 0), the more severe the degree of salinization. The closer the distance, the less server the degree of salinization. According to this principle, we distinguished five point groups with different distances in the study area. Five point groups in different regions of the study area were selected, and the relationship between the degree of soil salinization and the five point groups was obtained by analyzing the 46 measured samples of each point group. The KNDVI indicates the degree of lushness in plants. The higher the index, the more lush the plants and the lighter the salinization degree; meanwhile, the opposite implies severe salinization. The SI represents the salt index; the higher the index, the more severe the degree of salinization, and vice versa. As shown in Figure 3, the red point group is the farthest from the origin point (1, 0) and represents the coastal area of the Yellow River Delta, which belongs to a highly salinized area. The orange point group is mainly concentrated in the severely salinized area, while the yellow point group is concentrated in the moderate salinization area. The green and blue point groups are concentrated in the mild salinization and non-salinized areas. Therefore, different degrees of soil salinization were accurately identified and distinguished in the KNDVI-SI feature space.
Combined with the field observation data, verification points were selected in this study. The field soil samples were collected from March to May (salt accumulation period) in the spring of 2020. According to the degree of soil salinization, surface morphology and micro-topography differences in the Yellow River Delta, a total of 230 total sample points were set up and divided into five groups, with 46 measurement units in each group. Each measurement unit arranged the soil sample collection points according to the five-point plum blossom shape. Soil samples with a 0–20 cm soil layer were collected, and the GPS position and corresponding environmental information were recorded. The collected soil samples were naturally air-dried and crushed, and other intrusions were removed; they were then sieved with a 1 mm sieve and mixed evenly. A quartering method was used to create a 200 g sample, and a 1:5 soil/water ratio extract was prepared to determine the soil salinity [25]. Finally, the mean value of every 5 soil sampling points was taken as the observation value of the soil measurement unit. Among them, the treatment of the soil samples and the determination of the water and salt content were carried out by the analysis and test center of Shandong University of Technology.

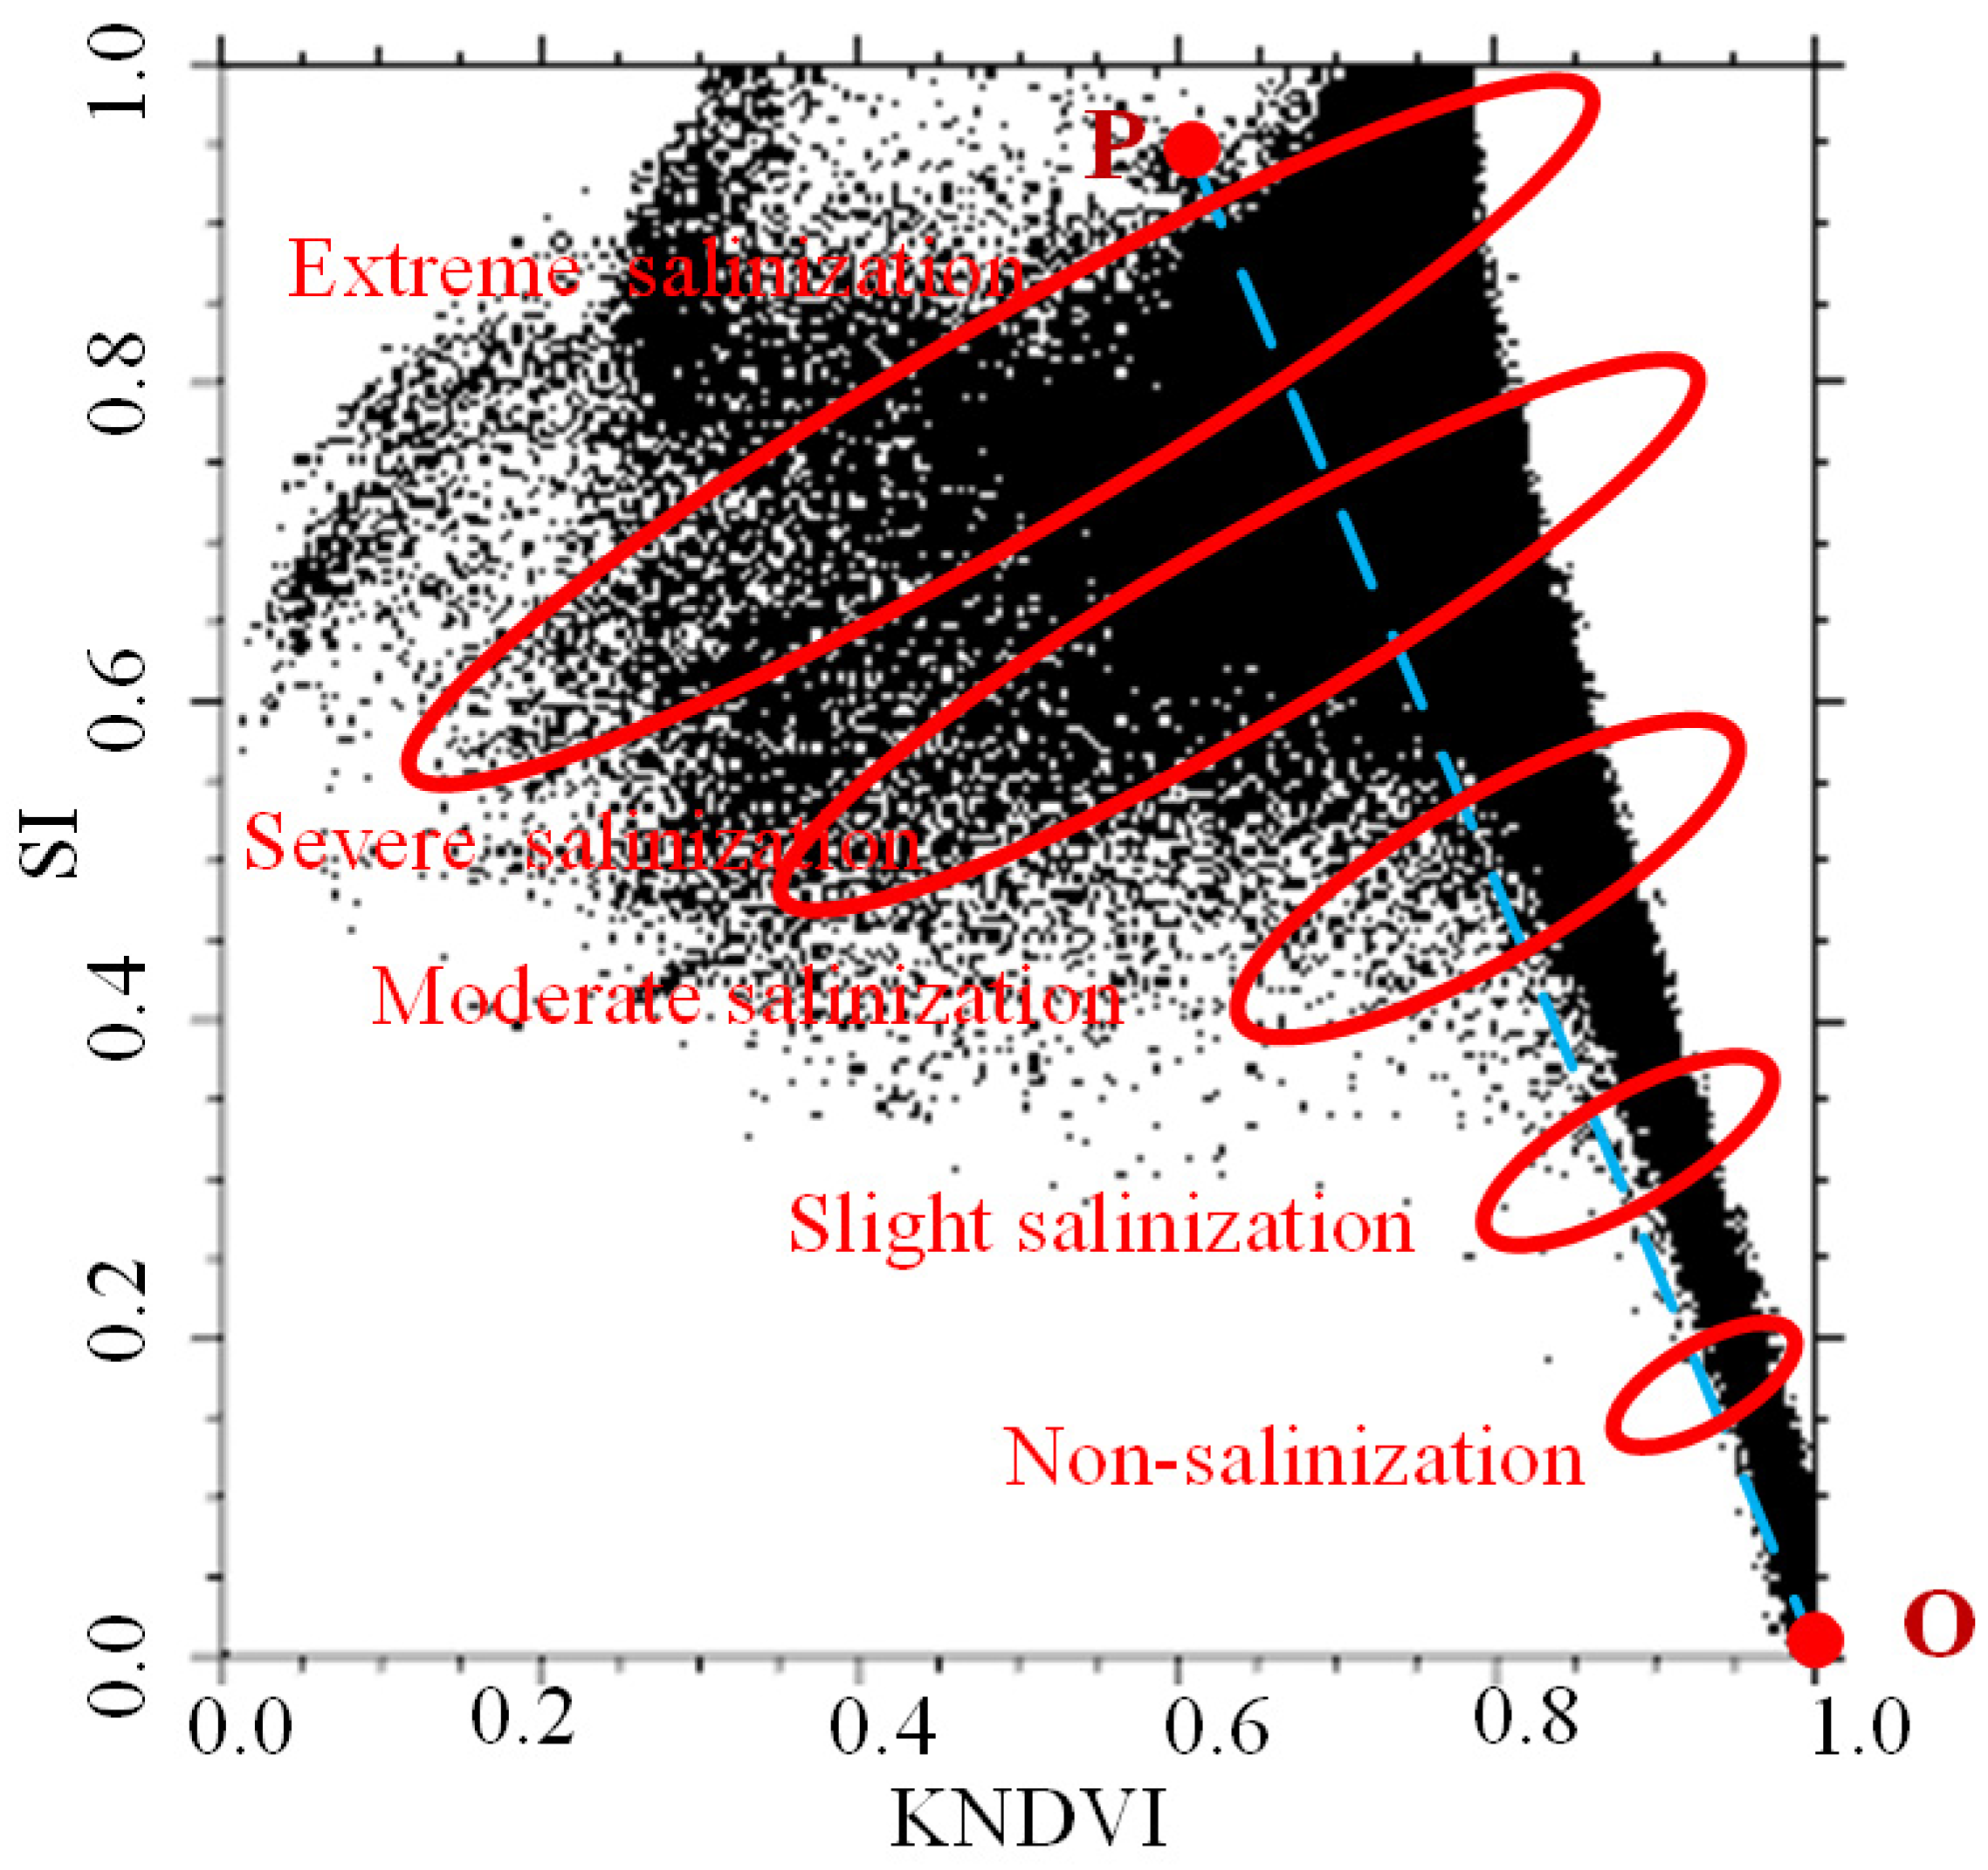
Construction of Monitoring Model Based on Point–Point Patterns (KNDVI-SI Feature Space Considered as an Example)

The KNDVI-SI feature space monitoring model was based on the point-to-point mode and is shown in Figure 4. The non-linear relationship between the kernel normalized difference vegetation index and the salt index was consistent with the soil salinization trajectory in the feature space. With the increase in the KNDVI, the salinity index (SI) decreased, indicating that the salinization degree was less severe than in the dense vegetation area. The soil salinization degree is represented by the distance from any point P (x1, y1) in the feature space to the origin O (x0, y0). The greater the distance, the more severe the salinization degree. In this study, L1 was used to represent the distance between OPs. The KNDVI-SI salinization remote sensing monitoring index was constructed as follows (Formula (2)):
DMI 1 = L 1 = ( KNDVI x 0 ) 2 + ( SI y 0 ) 2
Figure 4 shows the KNDVI-SI feature space remote sensing monitoring model. The straight-line OP successfully distinguished between different soil salinization levels. The distance from any point to point O (1, 0) in the feature space explains the salinization degree. In other words, the farther the distance from point O, the more severe the salinization degree. According to the feature space, salinization is divided into five parts: extreme salinization, severe salinization, moderate salinization, mild salinization and non-salinization. By selecting different point groups from the measured points, the salinization law is revealed, that is, the closer the O point, the slighter the salinization degree; the ellipse is used to more directly show the salinization degree of different grades in the feature space, which is convenient for the quantitative expression of the law and establishment of an exponential model. The exponential model was used to invert different degrees of salinization. The natural breaks method [26] and field measured data were used to find the grading standards and determine the thresholds of different grades. The specific threshold grading standards are shown in Table 2, so as to better show the degree of salinization of different grades. From the figure, we can see the distribution law of the salinization degree. The red circle in the figure represents the typical distribution area of each grade, and the specific grading standard refers to Table 2.

3. Results

3.1. Optimal Salinization Monitoring Model

In the different two-dimensional feature spaces, the spatial distribution of the different soil salinization degrees was significantly different. Based on the above feature space, ArcGIS 10.7 calculated five spatial salinization remote sensing monitoring indices. Figure 5 shows the spatial distribution of the soil salinization areas. In this study, the salinization monitoring index was divided into five grades by using the Natural Breaks method [27,28], combined with the measured point data. The zones with severe soil salinization were mainly distributed in the northern part of the estuary area, the eastern part of Kenli County, and the eastern part of Dongying District, and were consistent with the research results of [23]. Taking Figure 5a as an example, the KNDVI-SI represents an index constructed in the two-dimensional feature space, rather than a two-dimensional index. The larger the index is, the more serious the salinization degree is. The smaller the index is, the less serious the salinization degree is.
By using the distance calculation Formula (2), the degree of salinization can be obtained. The grading standards of each grade of salinization are shown in Table 2.

3.2. Accuracy Verification and Comparative Analysis

To better verify the model’s accuracy and explore different surface parameters for quantitatively monitoring soil salinization, we used 60 field-measured samples to compare and analyze the applicability of different feature space monitoring index models. We analyzed the correlation between the values of the remote sensing monitoring index and salt content in the 0–20 cm soil layer. As shown in Figure 6, the remote sensing monitoring index model constructed by different surface parameters significantly differed from the actual observation values. Table 3 shows the different models and their accuracy. The RMSE (Root Mean Square Error) represents the square root of the ratio of the square of the deviation between the predicted value and the true value to the number of observations n (See Formula (3)). The accuracy of the KNDVI-SI remote sensing feature space monitoring index is the highest, and the RMSE is 0.218.
RMSE = 1 N i = 1 n ( y i f ( x i ) ) 2

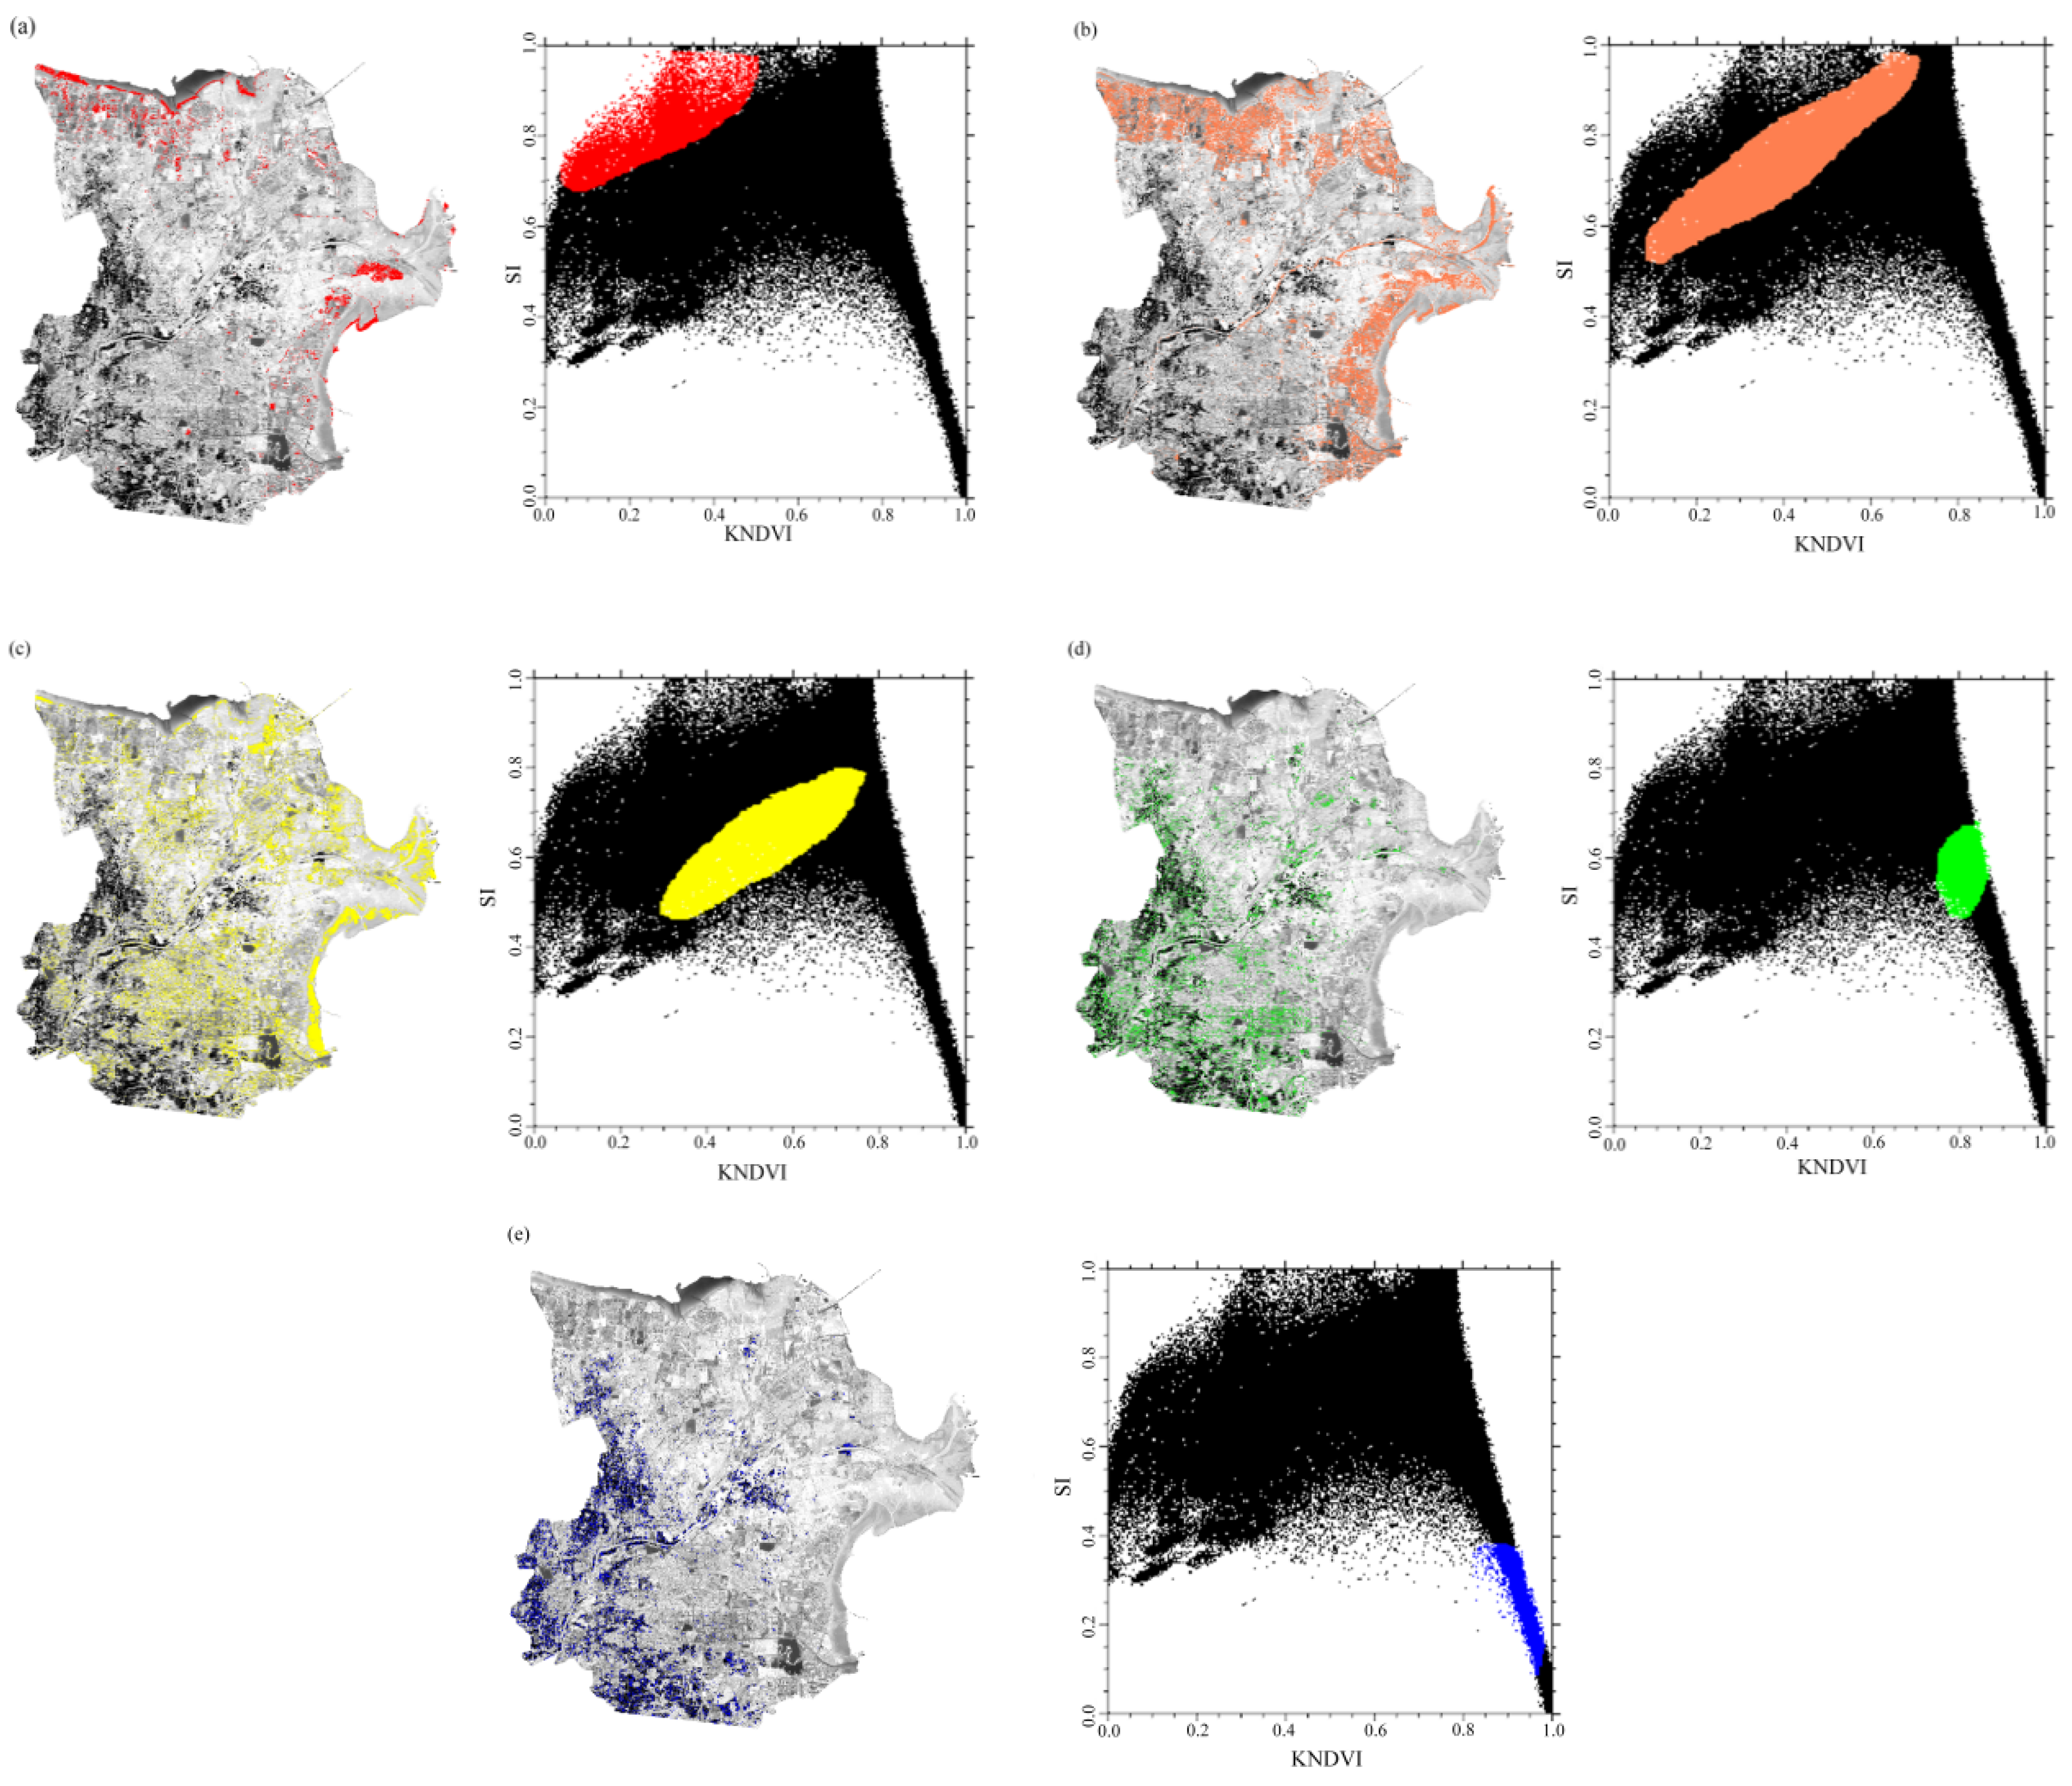
3.3. Spatial Evolution Characteristics of Soil Salinization in the Yellow River Delta

To better analyze the distribution characteristics of different soil salinization grades, we reclassified the salinization index that derives from the KNDVI-SI feature space model according to the Yellow River Delta’s salinization classification standards. By comparing and analyzing the spatial distribution of salinization in 2000, 2010 and 2020, the non-salinization area and the extreme salinization area increased overall. In contrast, the areas of mild, moderate and high salinization decreased (Figure 7). Severe salinization rose between 2000 and 2010. From 2010 to 2020, the severe salinization area showed a downward trend, indicating that soil salinization showed an exacerbating then improving trend. The spatial distribution of soil salinization gradually decreased from the northeast to the southwest inland. From 2000 to 2020, severe salinization gradually expanded inland. The non-salinization and the mild salinization areas were mainly distributed in the center of Lijin County, west of the Dongying District, and north of Guangrao County. The severe and extreme salinization areas were mainly distributed in the northern and eastern parts of the Hekou District, and the eastern coastal area of Kenli District. The main reason for this is that soil salt accumulation and desalination easily occur along the riverbank. Under the influence of evaporation, the soluble salt in the soil and groundwater rises with the water flow, so that salt accumulates on the surface, leading to salinization. The moderate and severe salinization areas first increased then decreased, showing an overall decreasing trend. The extreme salinization and non-salinization areas first decreased then increased, showing an overall increasing trend. The non-salinization area increased from 279.21 to 400.65 km2, and the extreme salinization area increased from 1074.86 to 1613.87 km2 (Table 4).
Regarding the proportion of different soil salinization levels, severe salinization was the highest in 2000, followed by extreme salinization. The proportion of non-salinized areas was less severe, accounting for 47%, 23%, and 13%, respectively. In 2010, the proportion of severe salinization increased to 62%, and the non-salinization area decreased to only 2%. In 2020, the areas of severe and extreme salinization were relatively large, accounting for 43% and 35% of the total area, respectively. By contrast, mild salinization had the smallest total area, accounting for about 5%. From 2000 to 2010, the reduction rate of the non-salinization area was the highest, at 73%. From 2010 to 2020, the reduction rate of the moderate salinization area was the highest, at 61%. From 2000 to 2020, the proportion of severe salinization areas remained the highest, at about 45%.

4. Discussion

4.1. Advantages of the Model

In this study, we propose a novel approach to salinization monitoring by introducing a new vegetation index named the KNDVI. The index is more resistant to saturation, bias, and complex phenological periods, showing robustness against noise and stability on the time and space scale [24]. This study confirms that the KNDVI has a stronger biological correlation than the NDVI and MSAVI, providing strong theoretical support for exploring soil salinization in the Yellow River Delta.
Feature space models based on different vegetation and salinity indices were compared and analyzed. We found that the correlation coefficient of the KNDVI-SI salinization remote sensing monitoring model was the highest at R2 = 0.93, followed by the EDVI-SI at R2 = 0.90. The salinity index can be used as an important surface parameter for directly reflecting the soil salinization degree. The extended difference vegetation index (EDVI) is more widely used in studying terrestrial ecological carbon and water fluxes. The relationships between the green normalized difference vegetation index (TGDVI) and soil salinity were significantly different between time and space. They were highly sensitive to factors such as the geomorphological characteristics, the vegetation type, and the geographical environment [25]. However, most of these study areas were located in coastal areas, which demonstrated climate change characteristics including dry–wet alternations; therefore, they could not ensure the stability of the vegetation index [26].
As a new vegetation index, the KNDVI has been used as a suitable index for the vegetation coverage of natural and agricultural systems. It is superior to the NDVI in all applications, including forest land, biological communities, and climatic zones, with great advantages over saturation effects, seasonal changes, and mixed pixels. Therefore, the KNDVI vegetation and salt indices (SI) are important for constructing a salinization monitoring model.

4.2. Causes of Spatio-Temporal Evolutions in the Yellow River Delta’s Salinization

From 2000 to 2020, soil salinization in the Yellow River Delta region accelerated, indicating an enlarged soil salinization area. During the study period, the salinization area of each grade first increased, then decreased. Areas with severe salinization were mainly distributed in the central and northern parts of the estuary, the eastern and central parts of the Kenli and Dongying Districts, and the eastern coastal areas of Guangrao County. Soil salinization showed a decreasing trend from the Northeastern coastal areas to the inland areas, which was consistent with previous research results [27,28].
The ‘Bohai granary’ plan, human activities such as increasing greenery in the living environments of local residents, and seawater intrusion caused by the decline in the Yellow River’s sediment content have affected spatio-temporal changes in regional salinization [29]. From 2000 to 2009, the mild salinization and non-salinized areas significantly decreased, whereas the moderate and severe salinization areas increased significantly. Due to the rapid increase in population in the last century, water consumption has increased significantly. Water diversion irrigation in the upper reaches of the Yellow River has decreased the water volume in the lower reaches of the river, resulting in sea level degradation, drying riverbeds, and seawater intrusion into underground freshwater resources, which have expanded and intensified salinization. Therefore, saline–alkali land in coastal areas and on both sides of the Yellow River has increased. According to measured data from the Dongying meteorological station, the annual evaporation and precipitation ratio of the Yellow River Delta was about 3.5:1 for several years, and evaporation was much higher than precipitation [30,31]. These favorable conditions promoted the upward movement of salt in the soil. From 2010 to 2020, the non-salinized and mild salinization areas gradually increased and were mainly distributed in the central and southwestern parts of Lijin County, Dongying District, and the western part of Guangrao County, which have deep inland areas [32]. In addition to decreasing the moderate and severe salinization areas, the Shandong Yellow River Delta National Nature Reserve built a sustainable water system pattern that achieved the formation of ‘river, land, beach, and sea’ into the sea; this was achieved by allocating water resources and ensuring system connectivity [33]. By reducing the unreasonable use of water and soil resources and seawater intrusion, this plan further alleviated the problem of soil salinization caused by rising groundwater levels.

5. Conclusions

Considering that the Yellow River Delta is greatly affected by seasonal rainfall and the ocean, we proposed a novel approach to detecting salinization information using the KNDVI and feature space models. We also analyzed the spatio-temporal changes in the Yellow River Delta’s salinization. Our results can be summarized as follows:
(1)
The inversion effect of the NDVI-SI point-to-point feature space monitoring model was the best, at R2 = 0.93. The EDVI-SI monitoring model was superior at R2 = 0.90. The kernel normalized difference vegetation index could avoid the influence of the geographical environment, seasonal variation, and the saturation effect, thereby reflecting the soil salinization status of the Yellow River Delta better and providing a new approach to salinization monitoring;
(2)
Soil salinization was more severe in the northern and eastern coastal areas than in the inland areas of the Yellow River Delta;
(3)
From 2000 to 2020, the Yellow River Delta’s soil salinization levels showed an exacerbating and then improving trend.

Author Contributions

Conceptualization, methodology, writing—original draft preparation, M.X.; investigation, supervision, project administration, and funding acquisition, B.G. and R.Z. All authors have read and agreed to the published version of the manuscript.

Funding

This research was funded by the National Natural Science Foundation of China (grant numbers: 42101306, 42301102 and 62006096),the Natural Science Foundation of Shandong Province (grant number: ZR2021MD047); the Scientific Innovation Project for Young Scientists in Shandong Provincial Universities (grant number: 2022KJ224);the Natural Science Foundation of Fujian Province (grant number: 2020J05146); and a grant from the State Key Laboratory of Resources and Environmental Information Systems.

Institutional Review Board Statement

Not applicable.

Informed Consent Statement

Not applicable.

Data Availability Statement

Data are contained within the article.

Conflicts of Interest

The authors declare no conflicts of interest.

References

  1. Zuo, Q.; Wu, X.; Shi, J.C.; Wang, J.Q.; Liu, Z.H.; Zhu, A.N.; Yin, D.Q.; Feng, Q.L.; Ji, W.J.; Kang, S.Z. Constraints and Coordinated Allocation Strategies of Water and Land Resources for Sustainable Use of Coastal Saline-Alkali Land in the Yellow River Delta. Strateg. Study CAE 2023, 25, 169–179. [Google Scholar] [CrossRef]
  2. Yan, J.N.; Wang, L.Z.; He, H.X.; Liang, D.; Song, W.J.; Han, W. Large area land cover changes monitoring with time-series remote sensing images using transferable deep models. IEEE Trans. Geosci. Remote Sens. 2022, 60, 4409917. [Google Scholar] [CrossRef]
  3. Guan, B.; Yu, J.B.; Wu, M.D.; Liu, X.L.; Wang, X.H.; Yang, J.S.; Zhou, D.; Zhang, X.L. Clonal integration promotes the growth of Phragmites australis populations in saline wetlands of the Yellow River Delta. Front. Plant. Sci. 2023, 14, 1162923. [Google Scholar] [CrossRef] [PubMed]
  4. Yu, C.X.; Wang, G.M.; Zhang, H.B.; Chen, H.P.; Ma, Q. Biochar and Nitrification Inhibitor (Dicyandiamide) Combination Had a Double-Win Effect on Saline-Alkali Soil Improvement and Soybean Production in the Yellow River Delta, China. Agronomy 2022, 12, 3154. [Google Scholar] [CrossRef]
  5. Hong, M.M.; Wang, J.L.; Han, B.M. Spatial and Temporal Pattern Changes and Driving Forces: Analysis of Salinization in the Yellow River Delta from 2015 to 2020. J. Resour. Ecol. 2022, 13, 786–796. [Google Scholar]
  6. Guan, B.; Xie, B.H.; Yang, S.S.; Hou, A.X.; Chen, M.; Han, G.X. Effects of five years’ nitrogen deposition on soil properties and plant growth in a salinized reed wetland of the Yellow River Delta. Ecol. Eng. 2019, 136, 160–166. [Google Scholar] [CrossRef]
  7. Wang, F.; Ding, J.L.; Wu, M.C. Remote sensing model of soil salinization based on NDVI-SI feature space. Trans. Chin. Soc. Agric. Eng. 2010, 26, 168–173+8. [Google Scholar]
  8. Zhang, T.Y.; Wang, L.; Zeng, P.L.; Wang, T.; Geng, Y.H.; Wang, H. Soil Salinization in the Irrigated Area of the Manas River Basin Based on MSAVI-SI Feature Space. Arid Zone Res. 2016, 33, 499–505. [Google Scholar]
  9. Liu, Y.N.; Bai, X.; Hou, J.Y. Remote sensing inversion of soil salinity based on feature space. J. Anhui Agric. Sci. 2014, 42, 110–111+136. [Google Scholar]
  10. Wang, J.J.; Wang, H.F.; Zhang, A.B.; Fu, K.; Gao, Y.P. Drought Monitoring in Beijing-Tianjin-Hebei Region Based on TVDI of Multiple Vegetation Indexes. Geomat. Spat. Inf. Technol. 2023, 46, 21–25. [Google Scholar]
  11. Wang, F.; Ding, J.L.; Wei, Y.; Zhou, Q.Q.; Yang, X.D.; Wang, Q.F. Sensitivity analysis of soil salinity variation by using Landsat series images: Applications in different oases in Xinjiang, China. Acta Ecol. Sin. 2017, 37, 5007–5022. [Google Scholar]
  12. Zhang, N.; Wei, J.B.; Liu, J.Q.; Zhang, X.Y.; Wang, Y.X. Vegetation information extraction of Artemisia brachyloba Franch based on Landsat-OLI images. Ecol. Sci. 2022, 41, 151–163. [Google Scholar]
  13. Ren, D.Z.; Ren, Y.H.; Lu, J.; Pan, G. Estimating the Changes of Vegetation Coverage by Remote Sensing Date in Lulang River Valley of the Sejila Mountain. J. Northwest For. Univ. 2012, 27, 184–189. [Google Scholar]
  14. Liu, X.; Su, X.L.; Liu, Y.H.; Liang, X.X. Vulnerability assessment of ecological drought in Northwest China. Water Resour. Prot. 2023, 39, 65–73. [Google Scholar]
  15. Dai, Q.Y.; Xu, Y.; Zhao, C.; Lu, Y.G.; Huang, W.T. Dynamic variation of vegetation EVI and its driving mechanism in the Sichuan Basin. China Environ. Sci. 2023, 43, 4292–4304. [Google Scholar]
  16. Zhu, Z.L.; Wang, J.; Pan, Y.H.; Shi, H.C.; Li, X.J. Remote Sensing Yield Estimation of Corn in Lishu County of Jilin Province Based on Multi-temporal Landsat8 Data. Technol. Innov. Appl. 2023, 13, 22–25+31. [Google Scholar]
  17. Yuan, H.; Ji, C.C.; Yang, X.M.; Chen, M.L.; Pan, J.P.; Cao, Y.M. Construction of Sparse Non-Photosynthetic Vegetation Index Combining Sentinel-2 Data and Spectral Features. J. Geo-Inf. Sci. 2023, 25, 1894–1907. [Google Scholar]
  18. Kong, D.X.; Miao, C.Y.; Zheng, H.Y.; Gou, J.J. Dynamic evolution characteristics of the Yellow River Delta in response to estuary diversion and a water–sediment regulation scheme. J. Hydrol. 2023, 627 Pt B, 130447. [Google Scholar] [CrossRef]
  19. Zhao, Y.; Yu, J.Y.; Hu, Q.L.; Zhao, H.L.; Suo, L.Z.; Wang, Y.; Wu, N. Interactive Processes and Modifications of Root-Soil-Water in Saline Agricultural Development of the Yellow River Delta. J. Ludong Univ. 2023, 39, 97–106+145. [Google Scholar]
  20. Amina, B.; Nouar, B.; Fatma, D.A. Multi-temporal Landsat imagery and MSAVI index for monitoring rangeland degradation in arid ecosystem, case study of Biskra (southeast Algeria). Environ. Monit. Assess. 2023, 195, 656. [Google Scholar]
  21. Seiichiro, O.; Takeshi, O.; Nozomu, S.; Narumasa, T. Large, concealed islands in the urban sea: Scattered surrounding green space enhances the quality of grassland habitats in urban parks, Tokyo. Urban. Ecosyst. 2022, 26, 641–649. [Google Scholar]
  22. Yan, J.N.; He, H.X.; Wang, L.Z.; Zhanh, H.; Liang, D.; Zhang, J.Q. Inter-comparison of four models for detecting forest fire disturbance from MOD13A2 time series. Remote Sens. 2022, 14, 1446. [Google Scholar] [CrossRef]
  23. Yao, C.X.; Yuan, H.M.; Meng, X.J. Natural factors for deterioration of coastal wetland in the Yellow River Delta. Mar. Geol. Quat. Geol. 2011, 31, 43–50. [Google Scholar] [CrossRef]
  24. Gustau, C.V.; Manuel, C.T.; Álvaro, M.M.; Sophia, W.; Grégory, D.; Alessandro, C.; Miguel, D.M.; Jordi, M.M.; Javier, G.H.F.; Guanter, L.; et al. A unified vegetation index for quantifying the terrestrial biosphere. Sci. Adv. 2021, 7, eabc7447. [Google Scholar]
  25. Wu, G.L.; Gao, J.; Ou, W.Y.; Wan, J.Z.; Li, X.L. Effects of the hummock-depression microhabitat on plant communities of alpine marshy meadows in the yellow river source zone, China. J. Plant. Ecol. 2022, 15, 111–128. [Google Scholar] [CrossRef]
  26. Bian, L.L.; Wang, J.L.; Liu, J.; Han, B.M. Spatiotemporal Changes of Soil Salinization in the Yellow River Delta of China from 2015 to 2019. Sustainability 2021, 13, 822. [Google Scholar] [CrossRef]
  27. Liu, J.K.; Bernard, A.E.; Zhang, G.F.; Wang, Y.; Wu, Y.N.; Zhang, M.X.; Zhang, Z.M. Hydrological connectivity: One of the driving factors of plant communities in the Yellow River Delta. Ecol. Model 2020, 112, 106150. [Google Scholar] [CrossRef]
  28. Li, Y.S.; Chang, C.Y.; Wang, Z.R.; Zhao, G.X. Upscaling remote sensing inversion and dynamic monitoring of soil salinization in the Yellow River Delta, China. Ecol. Indic. 2023, 148, 110087. [Google Scholar] [CrossRef]
  29. Guo, B.; Liu, Y.F.; Fan, J.F.; Lu, M.; Zang, W.Q.; Liu, C.; Wang, B.Y.; Huang, X.Z.; Lai, J.B.; Wu, H.W. The salinization process and its response to the combined processes of climate change–human activity in the Yellow River Delta between 1984 and 2022. CATENA 2023, 231, 107301. [Google Scholar] [CrossRef]
  30. Liu, J.; Chen, X.; Chen, W.F.; Zhang, Y.; Wang, A.L.; Zheng, Y.F. Ecosystem Service Value Evaluation of Saline—Alkali Land Development in the Yellow River Delta—The Example of the Huanghe Island. Water 2023, 15, 477. [Google Scholar] [CrossRef]
  31. Feng, X.J.; Tian, J.; Wang, Y.X.; Wu, J.J.; Liu, J.; Ya, Q.; Li, Z.S. Spatio-Temporal Variation and Climatic Driving Factors of Vegetation Coverage in the Yellow River Basin from 2001 to 2020 Based on kNDVI. Forests 2023, 14, 620. [Google Scholar] [CrossRef]
  32. Jenks, G.F. The Data Model Concept in Statistical Mapping. Int. Yearb. Cartogr. 1967, 7, 186–190. [Google Scholar]
  33. Zhang, Z.M.; Fan, Y.G.; Jiao, Z.J.; Guan, Q.C. Impact of soil salinization on the eco-environment quality of coastal wetlands: A case study of Yellow River Delta. Remote Sens. Nat. Resour. 2023, 35, 226–235. [Google Scholar]
Figure 1. Overview of study area in 2020.
Sustainability 16 02560 g001
Figure 2. Construction of feature space: (a) KNDVI-SI; (b) EDVI-SI; (c) MSAVI-SI; (d) NDVI-SI; (e) TGDVI-SI.
Sustainability 16 02560 g002
Figure 3. The spatial distribution of different soil salinization degrees in the KNDVI-SI feature space: (a) red points: extreme salinization; (b) orange points: severe salinization; (c) yellow points: moderate salinization; (d) green points: slight salinization; (e) blue points: non-salinization.
Sustainability 16 02560 g003
Figure 4. Different levels of salinization in the KNDVI-SI feature space.
Sustainability 16 02560 g004
Figure 5. Spatial distributions of soil salinization in the Yellow River Delta: (a) KNDVI-SI; (b) EDVI-SI; (c) MSAVI-SI; (d) NDVI-SI; (e) TGDVI-SI.
Sustainability 16 02560 g005
Figure 6. Scatter distribution maps of different monitoring models: (a) KNDVI-SI; (b) EDVI-SI; (c) MSAVI-SI; (d) NDVI-SI; (e) TGDVI-SI.
Sustainability 16 02560 g006
Figure 7. The spatial distribution map of the salinization grade in 2000, 2010 and 2020: (a) 2000; (b) 2010; (c) 2020.
Sustainability 16 02560 g007
Table 1. Calculation formula of surface characteristic parameters.
Characteristic ParametersComputing Formula
KNDVI KNDVI = tanh ( ( B 8 A B 4 2 σ ) 2 )
TGDVI TGDVI = ( Nir Red ) ( 0.8646 0.6546 ) ( Swir1 Nir ) ( 1.6090 0.8646 )
EDVI EDVI = Nir + Swi r 1 Red
NDVI NDVI = ( Nir Red ) ( Nir + Red )
MSAVI MSAVI = ( 2 Nir + 1 ( 2 Nir + 1 ) 2 8 ( Nir Red ) ) / 2
SI SI = Blue × Red
Table 2. Grading standard of the salinization monitoring model.
Salinization GradeKNDVI-SI
Non-salinization0 < KNDVI-SI ≤ 0.8
Slight salinization0.8 < KNDVI-SI ≤ 1.0
Moderate salinization1.0 < KNDVI-SI ≤ 1.2
Severe salinization1.2 < KNDVI-SI ≤ 1.4
Extreme salinization1.4 < KNDVI-SI ≤ 2.0
Table 3. Accuracy comparisons between different salinization remote sensing monitoring index models.
Model TypesFeature SpaceFormulaRMSE
Point-to-point modelKNDVI-SI DMI 1 = ( KNDVI 1 ) 2 + SI 2 0.218
NDVI-SI DMI 2 = ( NDVI 1 ) 2 + SI 2 0.341
MSAVI-SI DMI 3 = ( MSAVI 1 ) 2 + SI 2 0.674
EDVI-SI DMI 4 = ( EDVI 1 ) 2 + SI 2 0.589
TGDVI-SI DMI 5 = ( TGDVI 1 ) 2 + SI 2 0.416
Table 4. Different salinization area grades in different years.
Salinization GradeArea in 2000/km2Area in 2010/km2Area in 2020/km2
Non-salinization279.207974.1492400.653
Slight salinization353.4246168.0984209.7594
Moderate salinization738.96841076.2983418.6854
Severe salinization2159.86142869.9561963.3563
Extreme salinization1074.861417.82141613.8692
Disclaimer/Publisher’s Note: The statements, opinions and data contained in all publications are solely those of the individual author(s) and contributor(s) and not of MDPI and/or the editor(s). MDPI and/or the editor(s) disclaim responsibility for any injury to people or property resulting from any ideas, methods, instructions or products referred to in the content.

