Article

Quantifying the Spatial Distribution Pattern of Soil Diversity in Southern Xinjiang and Its Influencing Factors

1
College of Resources and Environment, Xinjiang Agricultural University, Urumqi 830052, China
2
Xinjiang Key Laboratory of Soil and Plant Ecological Processes, Xinjiang Agricultural University, Urumqi 830052, China
*
Author to whom correspondence should be addressed.
Sustainability 2024, 16(6), 2561; https://doi.org/10.3390/su16062561
Submission received: 1 February 2024 / Revised: 17 March 2024 / Accepted: 18 March 2024 / Published: 20 March 2024

Abstract

:
Soil diversity plays an important role in maintaining ecological balance and ensuring the sustainability of the land. Xinjiang is a typical arid and semi-arid region of China, and the study of Xinjiang soils is significant for understanding soil properties in all such environments. This study applied the moving window technique and the species–area curve model from ecology to establish optimal analysis windows, calculate landscape pattern indices, and reveal soil distribution characteristics in Southern Xinjiang. Additionally, we used geographic detectors to identify the primary influencing factors in different geomorphic regions. The results indicate a positive correlation between soil richness and area in the Southern Xinjiang region. The Tarim Basin, despite being the largest area, shows the lowest diversity and evenness indices. Overall, mountainous areas have higher soil evenness when compared to basins. In terms of natural factors, temperature, precipitation, and topography play a crucial role in the variation of soil diversity in mountainous areas, while parent material has a greater influence in the basin regions. The characteristics of soil diversity vary by region and are influenced by the interactive effects of various natural factors. However, the impact of human activities also requires consideration. The low evenness poses a greater challenge for soil restoration in the basin regions. Soil conservation efforts in arid regions are of paramount importance. The research findings can provide valuable insights for the development of sustainable agriculture, soil conservation, and for addressing climate change challenges in arid regions.

1. Introduction

Soil diversity is intricately linked to ecological balance and underpins the sustainability of the land. The formation of soil arises from the integrated interactions of five key factors, namely parent material, climate, organisms, topography, and time [1]. Soil, being a fundamental element of land productivity, is among the most basic and significant components of land and the most vital life support within the biosphere [2,3,4]. However, a greater emphasis is placed on the perceived productivity of the soil rather than on its ecological significance, so the exploration of the inherent natural soil characteristics is often overlooked [5,6]. Soil diversity is a measure that is often used to investigate the spatial variability of non-renewable abiotic resources within ecosystems [7,8,9]. China is currently facing land resource scarcity with severe soil degradation, and increasingly encountering challenges such as soil salinization and desertification [10,11,12]. When salinization or desertification has reached a certain level, substantial alterations in soil properties may occur in specific regions and the soil type can change accordingly. Salinized soil may transform into saline-alkali soil, for example, while desertified soil might become aeolian sandy soil. The Xinjiang region has a complex and diverse topography, with a wide variety of soils, accounting for approximately half of China’s soil types. For this reason, it has been given the title of the “Museum of Chinese Soils” [13].
According to Amundson et al. [14], maintaining soil diversity is crucial for the stability and resilience of global biota and biogeochemical systems. However, both natural factors such as climate, parent material, vegetation, time, and topography, as well as anthropogenic factors such as cultivation, grazing, and construction, influence soil diversity. This complexity, thus, renders the concept and measurement of soil diversity quite intricate [15,16,17]. In the 1990s, Ibáñez et al. [18] proposed the use of ecological research methods for analyzing the category diversity of soils within the pedosphere. They employed the 1:5 million World Soil Map issued by the Food and Agriculture Organization of the United Nations as their research base. They calculated ecological diversity indices and successfully analyzed the diversity and distribution patterns of major soil groups across continents and primary climatic zones. They concluded that the quantitative analysis of soil diversity is possible, in a similar way to the diversity of ecosystems or plant communities. They also elaborated on the feasibility of using biodiversity quantification methods for investigating spatial variations and distribution patterns in soils. Currently, multiple countries are actively exploring the complexity of soil diversity, with each nation’s research displaying unique characteristics [19,20]. For instance, countries such as the United States [21,22], Australia [23], Germany [24], Italy [25], and India [26] are conducting relevant studies, taking into account the specific conditions and backgrounds of their respective regions. These efforts provide a solid foundation for advancing research on soil diversity and its integration with soil taxonomy and land-use pattern studies. The study of soil diversity is increasingly garnering research attention in various related natural science disciplines internationally, including soil science, land studies, and environmental sciences [27]. Recently, Smirnova et al. [28] successfully conducted large-scale ecosystem mapping of the Western Altai Mountain region, quantitatively assessing vegetation, soil, and ecosystem diversities using Shannon and Simpson indices. While studying soil diversity in the Taihang Mountains region, Fu et al. [29] further confirmed that, at a certain scale, richness and area are positively correlated. Using the Central European Uplands as a case study, Samec [30] made a preliminary evaluation of the extent to which soil diversity influences forest plant species.
The health of soil and the success of agriculture are closely intertwined with variations in soil diversity. From studying the continuous evolution of soil diversity, it becomes evident that the exploration and quantification of soil diversity and its primary influencing factors are unquestionably important. Xinjiang is a typical arid and semi-arid region in China, and the study of Xinjiang soils is of wider significance in understanding soil properties in such environments. This study employed the moving window technique and the species–area curve model from ecology to establish an optimal analysis window and calculate relevant landscape pattern indices. Through this approach, we explored the distribution characteristics of soil diversity in Southern Xinjiang. Factor detectors and ecological detectors from the geographic detector were utilized to identify the primary influencing factors affecting soil diversity in different geomorphic regions. The research findings can provide valuable insights for the development of sustainable agriculture and soil conservation, as well as address climate change challenges in arid regions.

2. Materials and Methods
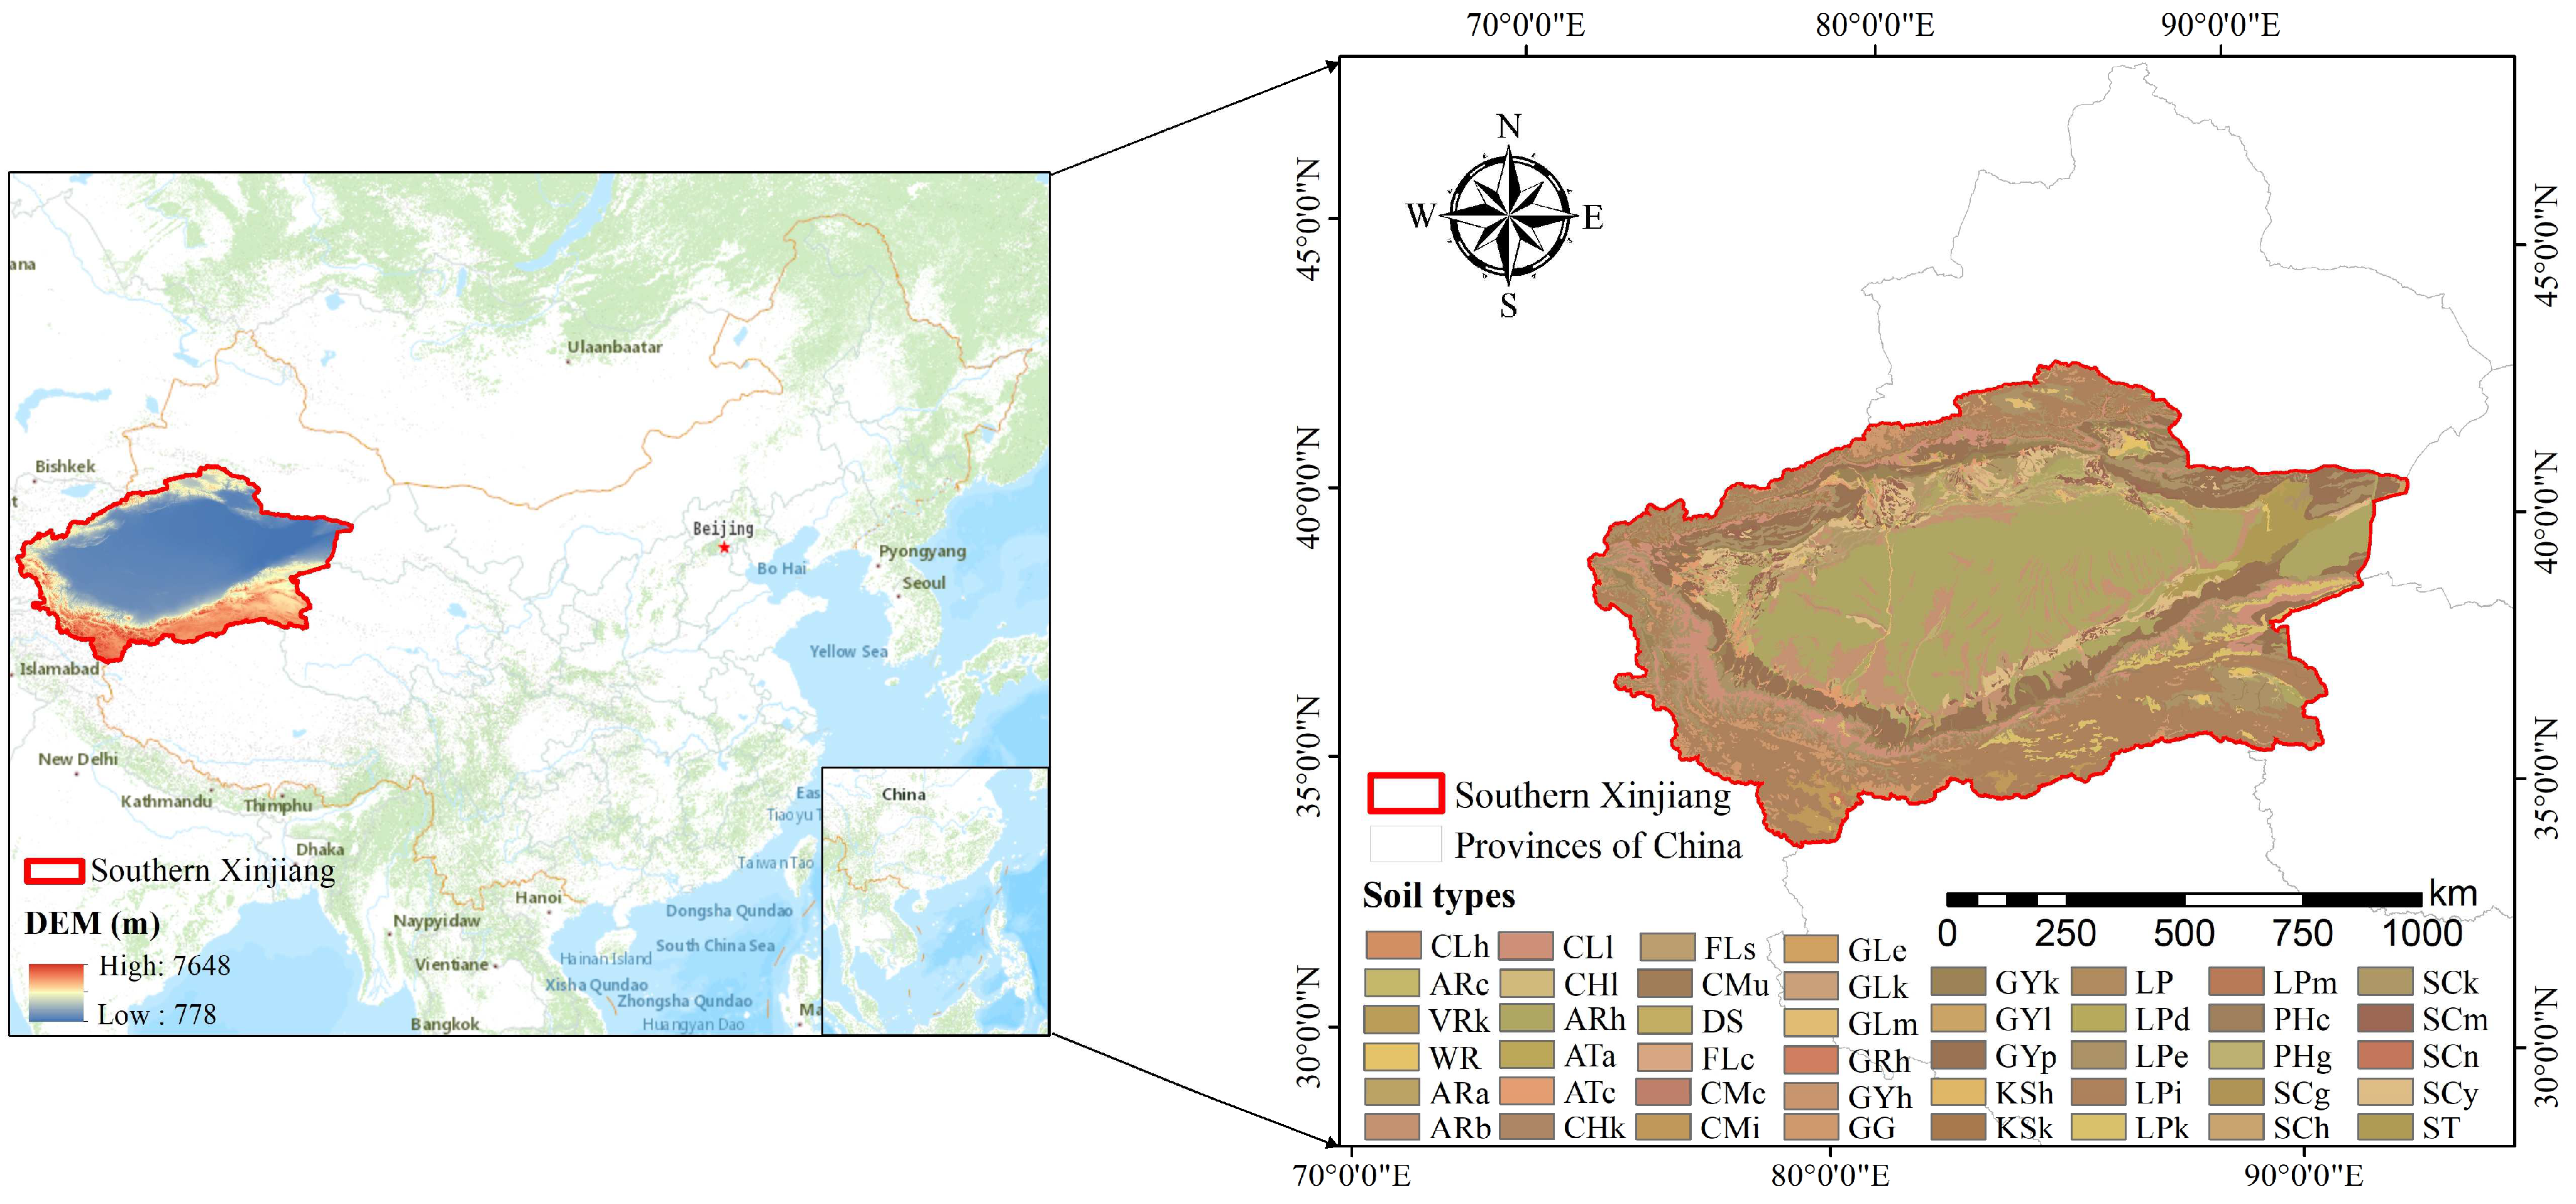
2.1. Study Area

Xinjiang is situated in the northwestern part of China, covering approximately one-sixth of the country’s total land area. Due to its inland location and distance from oceans, the region experiences a typical temperate continental arid and semi-arid climate [31]. As the Chinese province with the largest expanse of desert, it is characterized by desert soils and inland saline soils [32]. The region displays distinct horizontal, vertical, and regional distribution patterns, influenced by both natural conditions and human activities. Southern Xinjiang is positioned between the Kunlun Mountains in the north and the Tianshan Mountains in the south, extending from approximately 73°20′ E to 96°25′ E longitude and 34°15′ N to 49°10′ N latitude. It encompasses an area of around 1.08 million square kilometers and features the geographical phenomenon of “Two mountains flanking one basin”. The Tian Shan Mountains are located in the north, the Kunlun Mountain Range stretches to the far south, and between these two ranges lies the Tarim Basin. Southern Xinjiang boasts a vast territory characterized by low rainfall and arid conditions. The annual average temperature is 12.5 °C, with an average annual precipitation of 76.3 mm. Evaporation ranges from 2000 to 3000 mm annually, increasing from south to north in the central desert region. The terrain in Southern Xinjiang is diverse and complex, situated in a desert region with varying parent materials across different landforms. This diversity contributes to the richness of soil types in Southern Xinjiang (Figure 1).

2.2. Data Collection and Processing

The data were collected from a range of sources. Previous research has demonstrated that parent material serves as the foundation for soil formation [33], while various environmental factors contribute to the formation of different soils. For instance, climate change impacts the physical, chemical, and biological characteristics of the soil, influencing its overall health [34,35]. Concurrently, different types of vegetation play a role in altering the surrounding soil [36]. Throughout this process, topographical differences may change factors such as precipitation, temperature, and vegetation, thereby indirectly affecting soil development [37]. The primary objective of this study was, therefore, to quantify the influence of five soil-forming factors—temperature, precipitation, parent material, vegetation, and topography—on soil diversity. Previous studies have indicated a relative consistency in the soil formation time across different geomorphic regions; therefore, this study does not incorporate the time factor into consideration [38].
(1) Meteorological data were obtained from the daily datasets of ground meteorological stations from the National Meteorological Information Center (http://data.cma.cn (accessed on 15 March 2023)). Using the Anusplin v4.4 software developed by the Australian National University, combined with Digital Elevation Mode (DEM) for interpolation, the average temperature distribution (Figure 2A) and average precipitation distribution (Figure 2B) in Southern Xinjiang were plotted from 1982 to 1985. (2) Because of the vast expanse of Southern Xinjiang, challenges were encountered in capturing soil diversity patterns while studying the entire region. In order to enhance the reliability of the findings, this study divided the region into six areas based on China’s secondary geomorphic zoning [39], namely Qiangtang Plateau Lake Basin, Karakoram Mountains, Altun Mountains Qilian Mountains, Kunlun Mountains, Tarim Basin, and Tianshan Alpine Basin (Figure 2C). (3) Normalized Difference Vegetation Index (NDVI) data were obtained from the global 1 km NDVI dataset (http://doi.org/10.5281/zenodo.4734593 (accessed on 15 March 2023)) generated by Guan et al. [40] by fusing MODIS and AVHRR products. Using these data, the average NDVI distribution map for Southern Xinjiang from 1982 to 1985 was generated to represent vegetation factors (Figure 2D). (4) The parent material data were sourced from the Geographic Data Platform of the College of Urban and Environmental Sciences at Peking University (https://geodata.pku.edu.cn (accessed on 15 March 2023)). Southern Xinjiang is classified into 19 parent material types (Figure 2E). The soil type data were sourced from the Xinjiang Uygur Autonomous Region Soil Survey Office and the Xinjiang Institute of Biology, Soil, and Desert Research, Chinese Academy of Sciences. It is a vectorized version of the “1:1,000,000 Soil Map of the Xinjiang Uygur Autonomous Region”, jointly compiled and published in 1985, and is displayed and categorized based on soil groups. (5) The topographical and geomorphological data were obtained from the Geospatial Cloud 30-m resolution digital elevation data product (https://www.gscloud.cn (accessed on 15 March 2023)). Following the topographical classification standards of mainland China, the data were segmented into seven terrain categories: plains, mesa, hilly, small rolling hills, medium rolling hills, large rolling hills, and extremely undulating hills (Figure 2F).

2.3. Methods of Analysis

This study, based on the moving window technique and a soil richness index, employed the species–area curve model [41] to determine the optimal analysis window for soil diversity in different geomorphic regions. The soil diversity index and evenness index were computed for different geomorphic regions using the optimal analysis window, which revealed the distribution characteristics of soil diversity in Southern Xinjiang. Setting the spatial distribution of soil diversity in different geomorphic regions as the dependent variable (Y) and the influencing factors as independent variables (X), quantitative analysis and significance testing were conducted using the factor detector and ecological detector within the geographic detector framework. This aimed to identify the primary influencing factors on soil diversity in different geomorphic regions. The flow of this study is shown in Figure 3.

2.3.1. Methodology for Determining the Optimal Analysis Window

The size of different geomorphic areas varies, affecting the accuracy and comparability of the diversity indices and the quantification of impact factors calculated between those areas. This study, therefore, used a species–area curve model to fit the relationship between window area and richness in different geomorphic areas. The objective was to obtain the best-fit curves suitable for analyzing soil diversity in different geomorphic regions of Southern Xinjiang to calculate the size of the optimal analysis window for different geomorphic zones. Since the number of soil types in the different areas is known, the logarithmic and power functions in the saturation curves were selected for fitting [41] (Equations (1) and (2)).
S = a ln ( b A + 1 ) ,
S = a A b .
In the equations, A represents the window area; S signifies the richness within A; and a and b are the parameters to be estimated. Curve fitting was performed using the data analysis and scientific graphing software Origin 2021, developed by the U.S. company OriginLab.
The calculation of the optimal analysis window corresponding to the above curves is given in Equations (3) and (4).
A =   exp ρ S t / a / b 1 ,
A = ρ S t   / a 1 / b .
In the equations, the scaling factor ρ indicates the species percentage in the study area relative to the total species count. Typically, the ρ value lies between 0.6 and 0.9.

2.3.2. Methodology for Calculating Soil Diversity

During the 1990s, the Spanish researcher Juan José Ibáñez advocated an ecological approach for studying soil diversity [18]. The number of soil types can be assessed using the soil richness index (Pa), as illustrated in Equation (5).
P a = S ,
In the equation, S represents the number of soil types within a given region.
The diversity index (H) reflects the heterogeneity and diversity among different soil types, as illustrated in Equation (6). This index is most pronounced when soil type distribution is uneven.
H = i 1 s P i ln P i ,
In the equation, S represents richness and Pi denotes the proportion of the total area within the region occupied by the i soil type.
The evenness index (E) reflects the evenness of soil type distribution within a specific region, as illustrated in Equation (7).
E = H   H max = H lnS ,
In the equation, Hmax = lnS represents the H value when all soil types appear with equal probability. The value range of E is 0–1. A larger value indicates a more even distribution of the research subject within that range. E = 1 indicates that within that range, the number of all research subjects is consistent. For the soil within that range, all soil types are suggested to have equal coverage areas. Conversely, E = 0 implies that one soil type occupies the entire area of the region.

2.3.3. Methods for Determining Factors Influencing Soil Diversity

The geographic detector comprises factor detectors, interaction detectors, risk detectors, and ecological detectors [42]. The species–area curve model was first used to determine the optimal window of analysis, followed by a combination of diversity indices to calculate the spatial distribution of soil diversity in different geomorphic zones (set to a value of Y), with the influence factor denoted as X. The spatial dissimilarity of Y was detected using a factor detector (Equation (8)), as well as the extent to which a given factor X explains the spatial dissimilarity of attribute Y. The results are measured by the q-value. The ecological detector was employed to assess whether there are significant differences in the impact of environmental factors on soil diversity (Equations (9) and (10)). The software ArcGIS 10.7 (manufactured by Esri, located in Redlands, CA, USA) was used to divide the continuous type data using natural breakpoints according to the needs of this study.
q   = 1   h = 1 L N h σ h 2 N σ 2 ,
In the equation, q represents the extent to which environmental factors explain soil diversity (with 0 < q < 1), L stands for the number of subregions, and σ2h denotes the internal variation within the subregion. σ2 is the study area variance. Nh and N, respectively, represent the number of units in subregion h and the entire region.
F = N x 1 ( N x 2 1 ) S S W x 1 N x 2 ( N x 1 1 ) S S W x 2 ,
s s w x 1 = h = 1 L 1 N h σ h 2 , s s w x 2 = h = 1 L 2 N h σ h 2 .
In the equation, NX1 and NX2 denote the sample size of the two factors X1 and X2, respectively; SSWX1 and SSWX2 denote the sum of intralayer variances of the stratification formed by X1 and X2, respectively; and L1 and L2 denote the number of strata for variables X1 and X2, respectively. The null hypothesis H0: SSWX1 = SSWX2. If H0 is rejected at the α significance level, then a significant difference exists between the effects of the two factors X1 and X2 on the spatial distribution of attribute Y.

3. Results

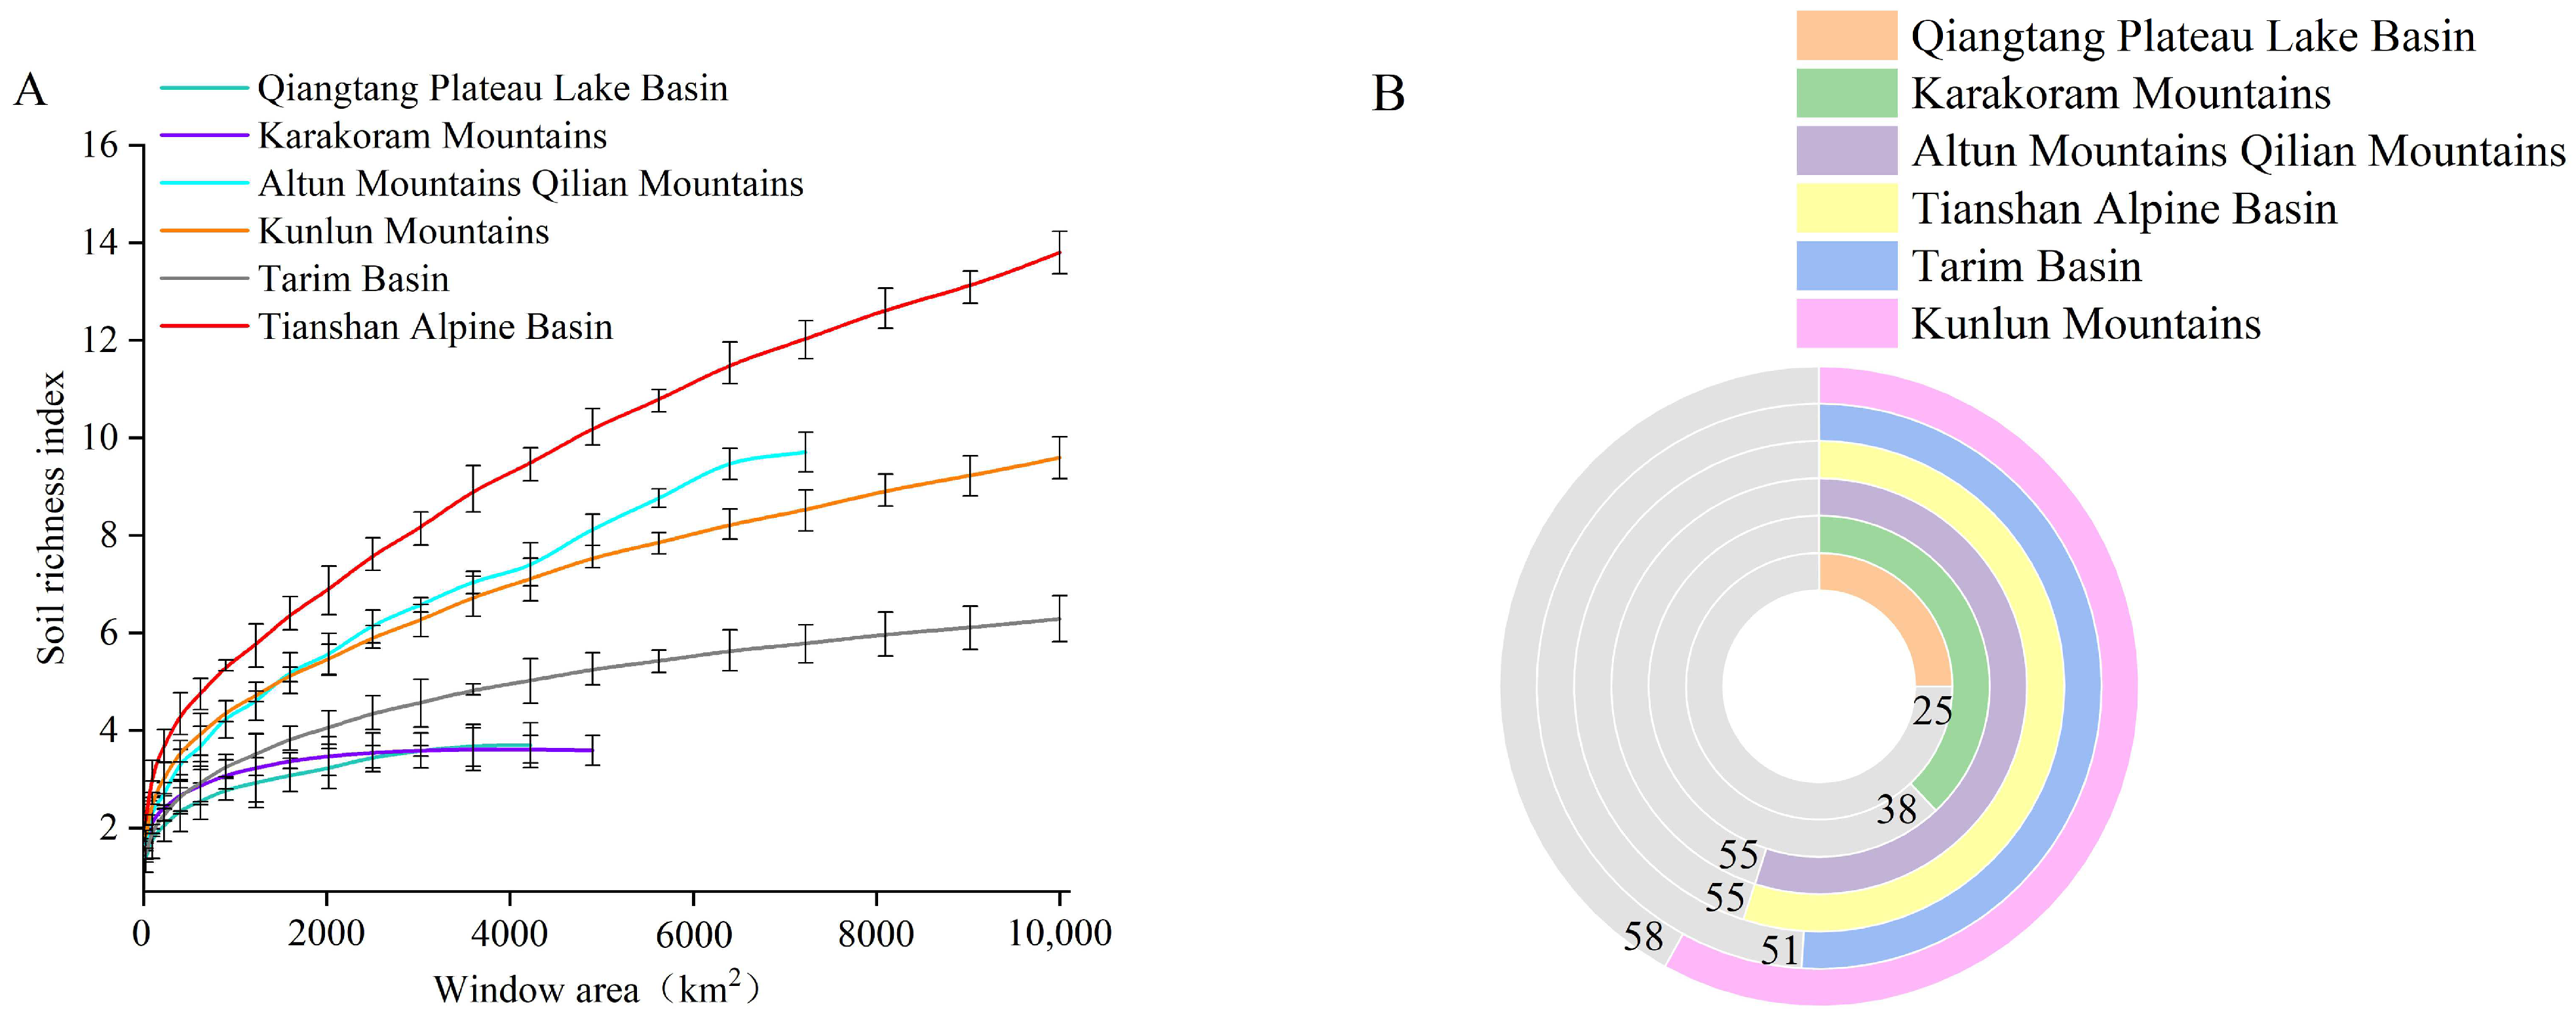
3.1. Fitting of the Optimal Analysis Window

Detailed calculations of soil richness within various area ranges (increasing in 5 km increments from 5 km to 100 km) were conducted using the Fragstats v4.2.1 software, co-developed by Dr. McGarigal and Barbara Marks at Oregon State University. The window area–richness curve (Figure 4A) was generated using the data analysis and scientific graphing software Origin 2021 v9.8.0, developed by OriginLab Corporation, located in Northampton, MA, USA. The data revealed that during the initial phase of the window area expansion, soil richness increases rapidly. This pronounced growth trend underlines the fact that soil richness is highly sensitive to changes in the window area. However, this growth is not infinite. As the window area expanded, the rate of soil richness increase decelerated, which suggests that the area–soil richness has reached a certain saturation point or a critical threshold.
In order to select the best window of analysis, two curve models, (1) and (2), were fitted using Origin 2021 and the fitting results are shown in Table 1. The coefficient of determination (R2) was used to determine whether the curve model fitting was successful or not. The larger the result of R2, the smaller the ratio of the mean squared deviation to the error squared of this model will be, and the closer the actual value will be to the estimated value, so the data will be more accurate. For the relationship between soil richness and area in different geomorphic regions, the optimal curve model for the extremely high mountainous areas of Karakoram Mountains was S = aln(bA + 1), with an R2 value of 0.986. For other geomorphic regions, the optimal curve model was S = aAb, with R2 values of >0.985 in all cases, indicating a high level of fitting accuracy. In this study, a proportionality factor of 0.7 was established. Based on the aforementioned fitting results, calculations were made using the corresponding Equations (3) and (4). In the Qiangtang Plateau Lake Basin, the optimal analysis window size was 25 km. For the Karakoram Mountains and Tarim Basin, the optimal analysis window sizes were 38 and 51 km, respectively. For the Altun Mountains Qilian Mountains and Tianshan Alpine Basin, the optimal analysis window size was 55 km. The Kunlun Mountains had the largest optimal analysis window size, reaching 58 km (Figure 4B).

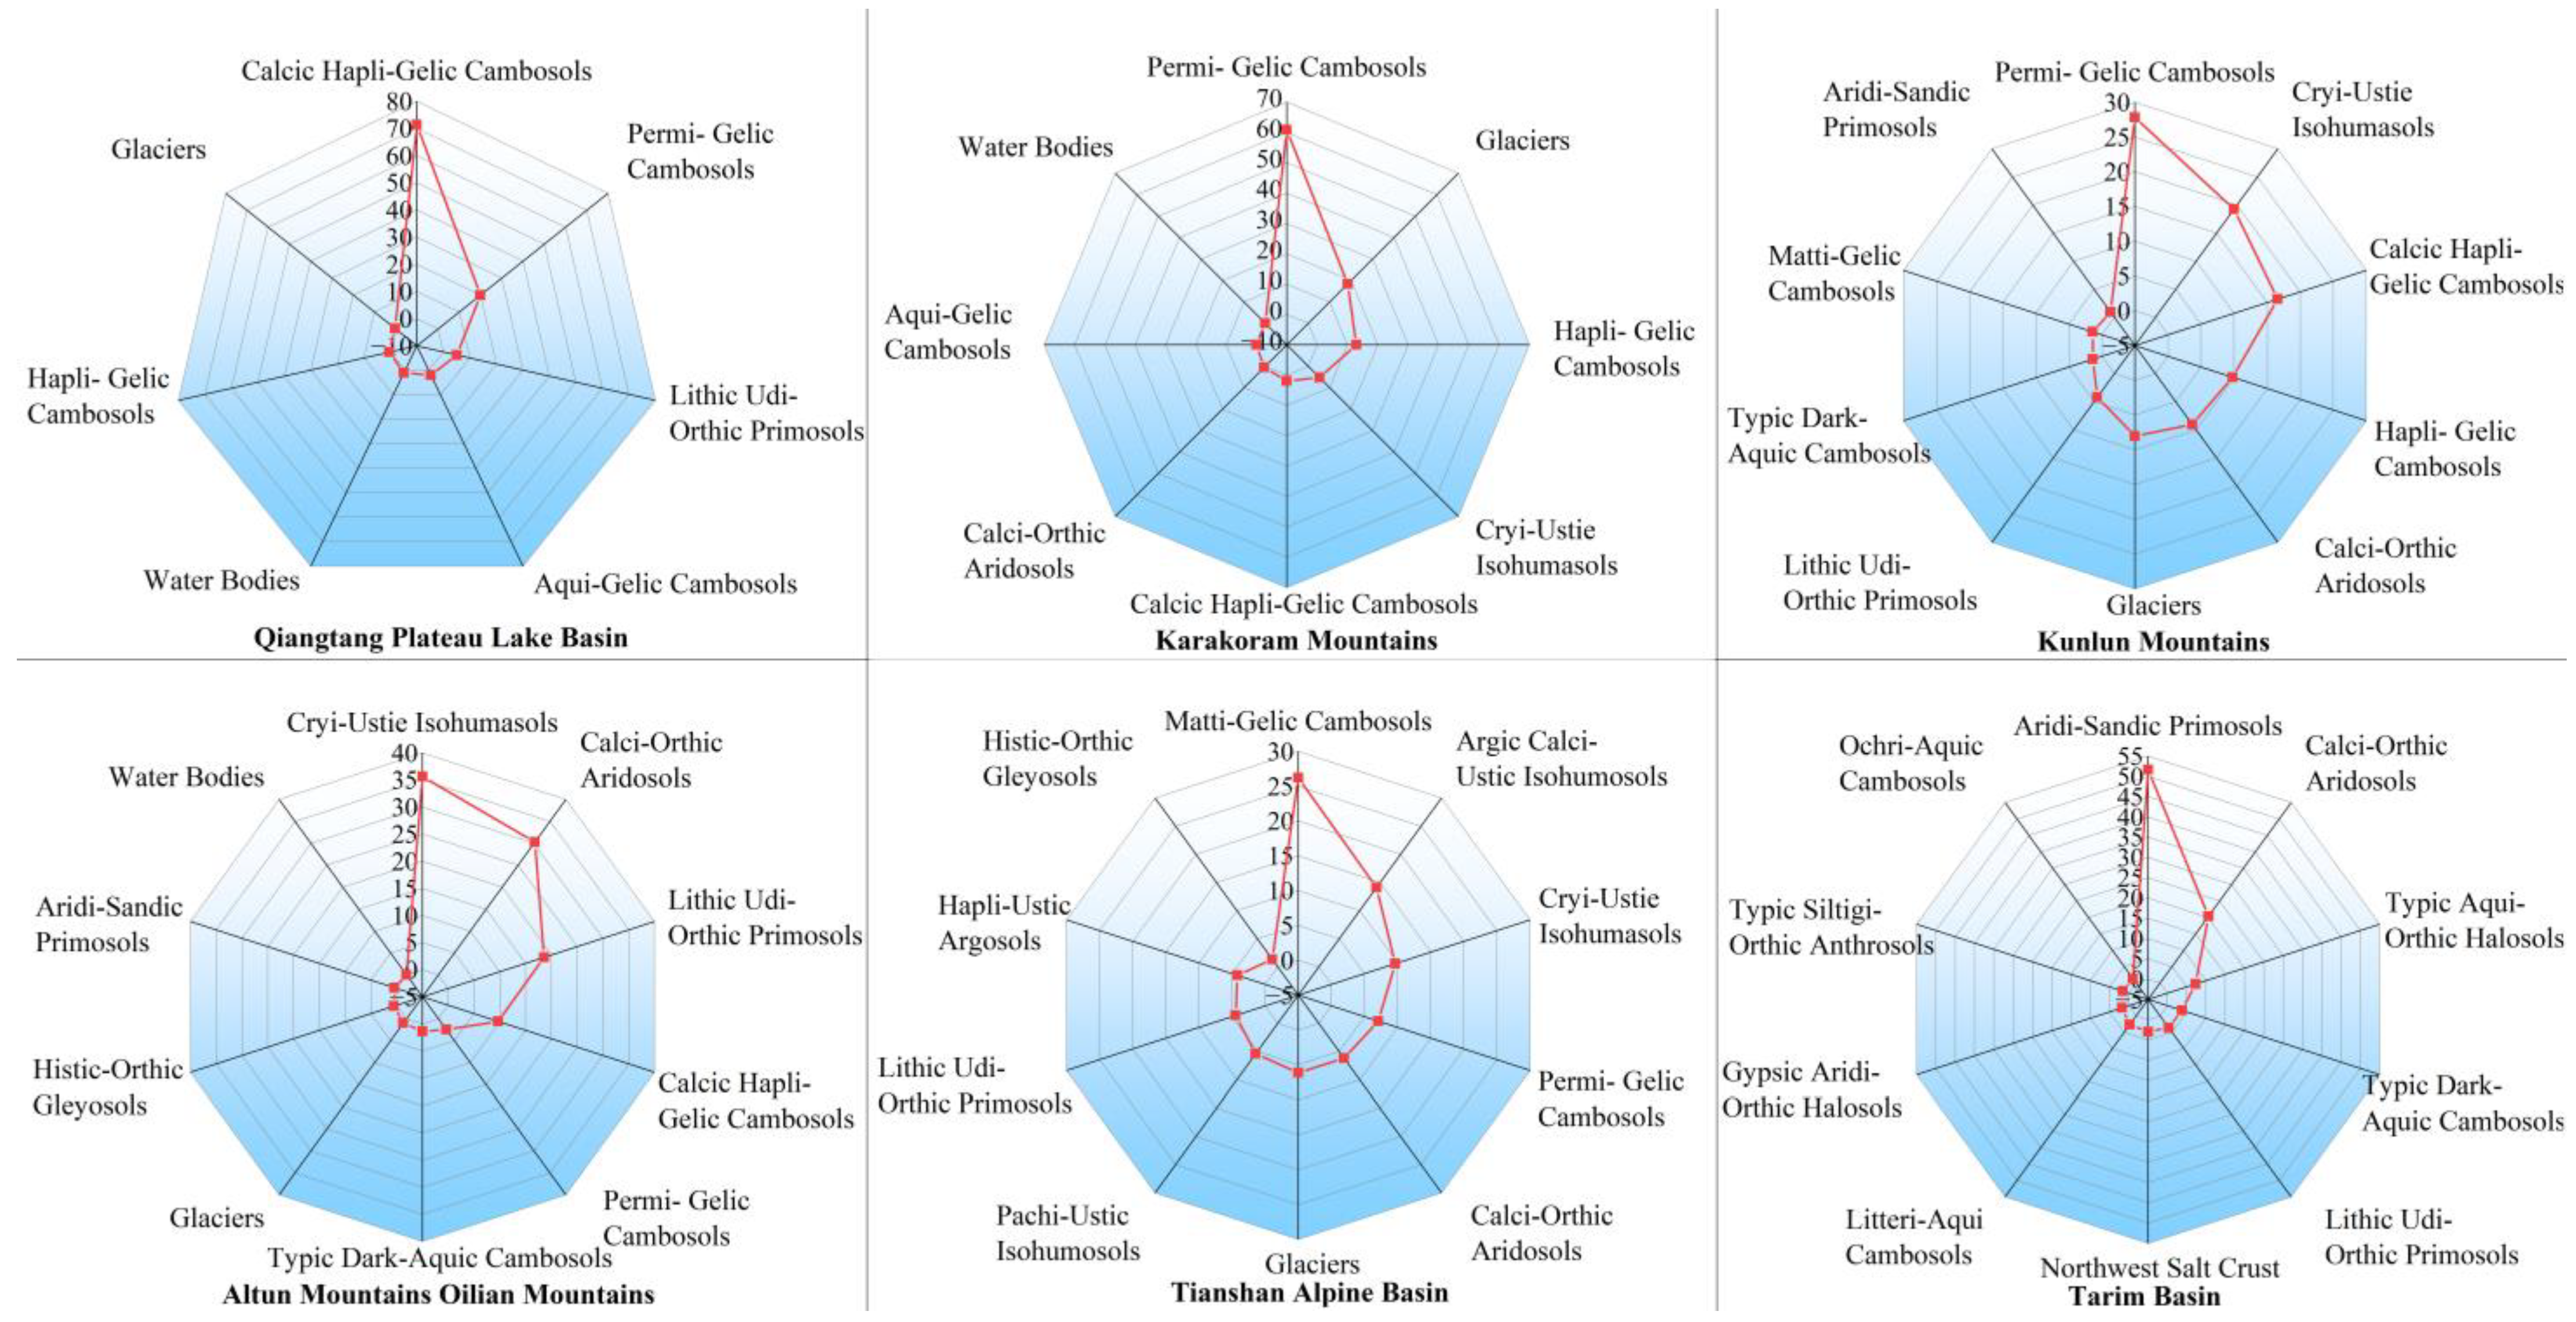
3.2. Distribution of Soil Types and Their Diversity in Southern Xinjiang

We conducted a statistical analysis of the top ten soil types ranked by their proportional area across different geomorphic regions in Southern Xinjiang (Figure 5). The soil type area distribution data vividly represent the rich and diverse soil resources in Southern Xinjiang. These variable soil characteristics serve as the foundation for soil health and agricultural production and also as crucial factors for maintaining ecosystem health and biodiversity. The Qiangtang Plateau Lake Basin is primarily composed of Calcic Hapli-Gelic Cambosol and Permi-Gelic Cambosol soil types, accounting for 71.33% and 19.96% of the respective land areas. In the Karakoram Mountains and Kunlun Mountains, Permi-Gelic Cambosols are the dominant soil types, accounting for 60.84% and 27.79% of the respective land areas. In the Altun Mountains Qilian Mountains, Cryi-Ustic Isohumasols and Calci-Orthic Aridosols are the predominant soil types, accounting for 35.61% and 30.28% of the respective land areas. Further observation revealed that Matti-Gelic Cambosols are dominant in the Tianshan Alpine Basin, which accounts for 26.35% of the respective land areas. By contrast, the Tarim Basin shows a soil composition distinct from other regions, with Aridi-Sandic Primosols dominating by covering an area of 51.60%, which is twice the area of any other soil type in that region.
In Table 2, using the optimal analysis window and applying Equations (5)–(7), we comprehensively calculated soil diversity and evenness. Significant variations were observed among different geomorphic regions in terms of soil abundance, diversity, and evenness. Among the six major geomorphic regions, the Tarim Basin covers the largest area, accounting for 60.35% of the entire Southern Xinjiang region. By contrast, the Qiangtang Plateau Lake Basin covers a smaller area, representing 2.84%. The Tarim Basin demonstrates high soil richness, whereas the Qiangtang Plateau Lake Basin has comparatively lower richness. The ranking of soil diversity across different geomorphic regions from the highest to lowest is as follows: Tianshan Alpine Basin > Altun Mountains Qilian Mountains > Kunlun Mountains > Karakoram Mountains > Tarim Basin > Qiangtang Plateau Lake Basin. Regarding soil evenness, the Tianshan Alpine Basin showed the highest evenness at 0.786, whereas the Tarim Basin had the lowest at only 0.395.

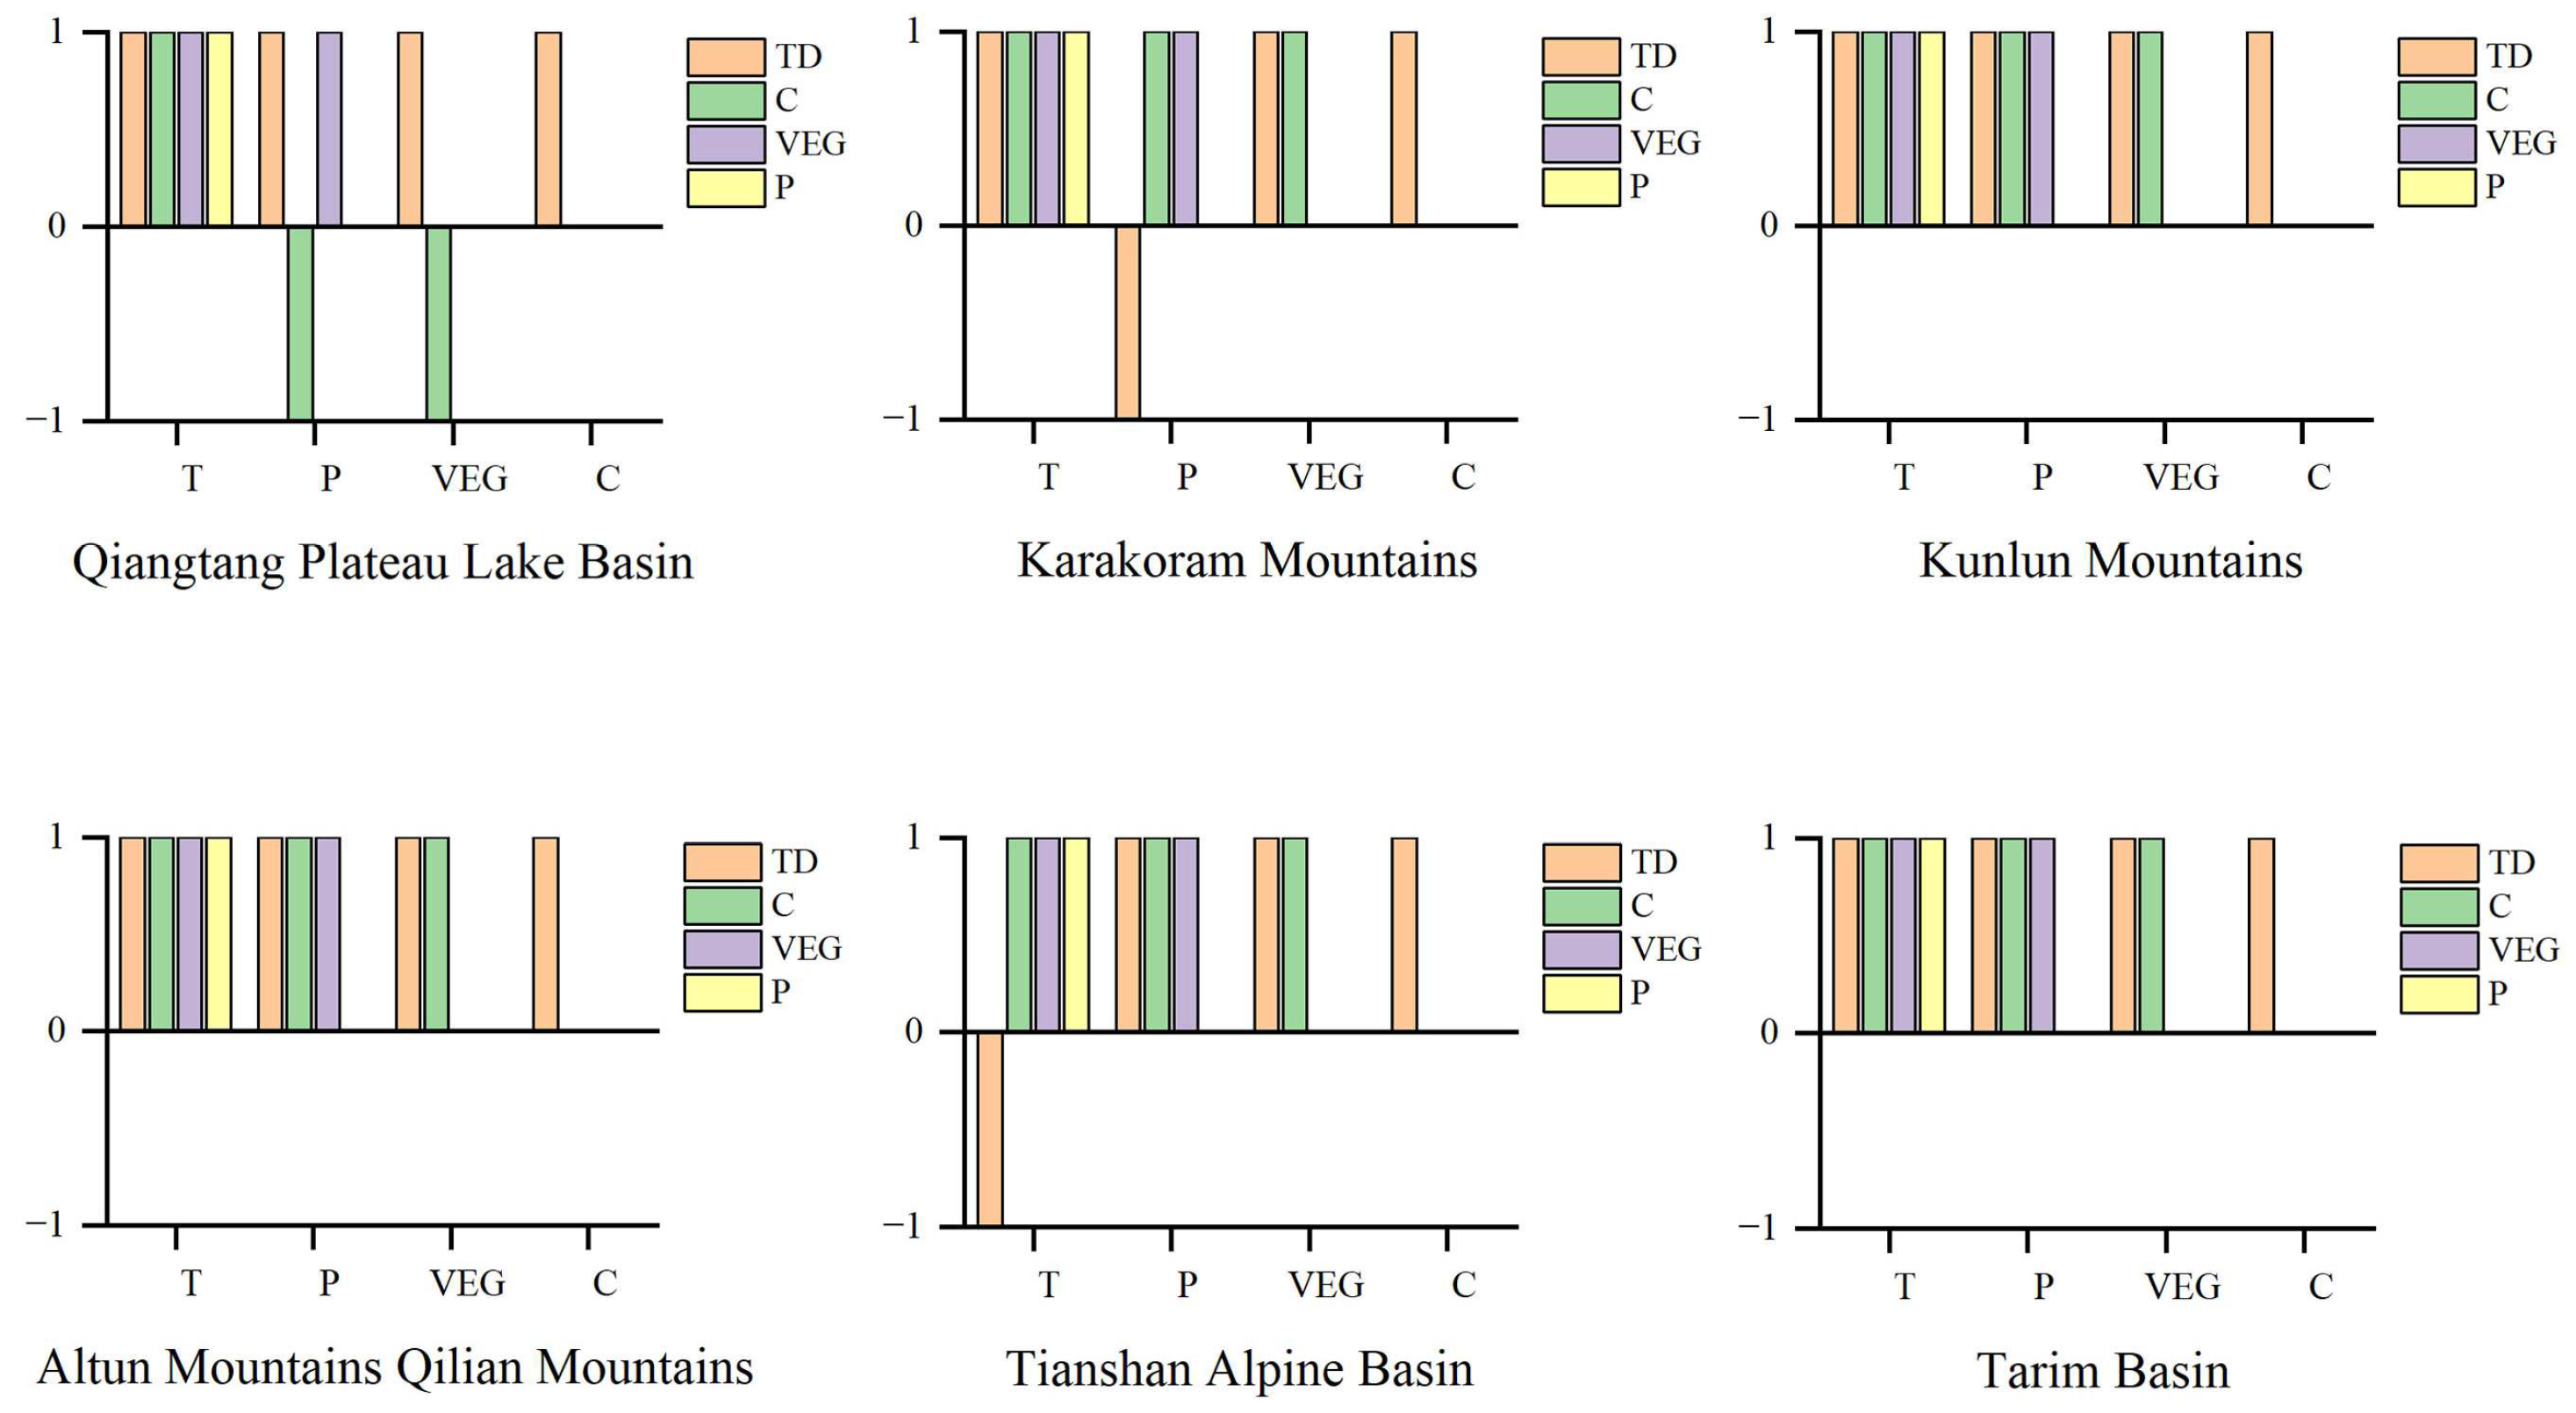
3.3. Identification of the Primary Influencing Factors of Soil Diversity

Understanding the factors influencing soil diversity in Southern Xinjiang is particularly crucial for ensuring soil health and agricultural production stability. By analyzing the data collected from the factor detector (Figure 6), we observed distinct influencing factors across various geomorphic regions. In the regions of the Altun Mountains Qilian Mountains, temperature emerged as the predominant factor influencing soil diversity. Since the region is located in the northwestern desert, at an average altitude of over 3000 m, the effect of altitude on temperature exceeds the effect of latitudinal position, resulting in an arid region with little rainfall and large temperature fluctuations. This environmental situation affects microbial activity, the rate of decomposition of organic matter, and mineral weathering processes, thus having a profound effect on soil properties [43]. This contrasts with the significantly different dominant factors in the Karakoram Mountains. The results from the factor detector indicate that precipitation and topography have similar explanatory powers for soil diversity, accounting for 16.52% and 14.77%, respectively, which are higher than other environmental factors (Figure 6). However, the results from the ecological detector reveal that the difference in explanatory power between precipitation and topography for soil diversity is not significant (Figure 7). This suggests that precipitation and topography are the primary driving factors for soil diversity in the Karakoram Mountains. The intricate interplay between rainfall runoff and mountainous topography has given rise to diverse soils rich in minerals and organic matter. In the Qiangtang Plateau Lake Basin, topography is a uniquely prominent factor. The subtle variations in topography determine the soil’s water retention capacity, thereby influencing the entire process of soil development. The other three geomorphic regions, not previously mentioned, were primarily influenced by the parent material. The factor detector indicates that within the delineated six regions, the single-factor p-values for all factors were <0.05, demonstrating the reliability of the calculations performed by the factor detector.

4. Discussion

The diversity of soils is increasingly drawing attention from scholars [44,45,46]. In a 3-year study, Li et al. [47] determined the impact of different cultivation management practices on soil quality in saline cotton fields in Southern Xinjiang. However, they focused only on certain cultivated soils. Our study draws on previous theories regarding the ecological diversity of desertification-prone areas [48], combining the species–area curve model, moving window technique, and geographic detector to analyze the distribution characteristics of soil diversity and its influencing factors in Southern Xinjiang. This differs from the study conducted by Duan et al. [8], which employed an enhanced Shannon entropy index to investigate the spatial distribution diversity of soils in various regions.

4.1. Soil Diversity in Southern Xinjiang: Mountain Diversity Is Greater Than Basins, but Human Impact Is Unignorable

Southern Xinjiang has a vast area, diverse topography, and varied climatic conditions, resulting in the formation of multiple soil types. Overall, the soil diversity index in high-altitude regions is higher than in basin areas, and this is related to natural environmental factors. Taking the Tianshan Alpine Basin as an example, its soil diversity index is significantly higher than in other areas, reaching 1.728. This is because the Tianshan Mountains block the hot winds from the southern Taklamakan Desert and also shield the cold air currents from northern Siberia. Moist and warm air currents from India flow into the Tianshan Alpine Basin, bringing abundant rainfall and providing favorable conditions for soil development in that region [49]. At the same time, these areas are primarily focused on animal husbandry, with a relatively limited development of cultivation. This is also a key factor influencing changes in soil diversity, as cultivation often has a more direct and profound impact on the soil [50]. In contrast, in these high-altitude and harsh climatic conditions, the impact of livestock farming on the soil is generally limited, particularly in areas which humans and animals face challenges to reach.
The Tarim Basin, due to the presence of the world’s second-largest mobile desert, is a unique landscape dominated by mobile sand dunes. However, despite being the largest region in Southern Xinjiang, the evenness and diversity indices in this area are relatively low. This contrasts with the findings of Minasny et al. [51], who calculated the global soil diversity index using the World Soil Map and discovered a positive correlation between the land area of soil types and the diversity index. It also indicates that the soil diversity index in the Tarim Basin has undergone irregular changes. While there is a certain correlation with the harsh natural conditions of the desert, the pressure brought about by human activities cannot be ignored. As the primary production and living area in Southern Xinjiang, this region has a relatively high population density, as well as significant industrial and agricultural activity. For thousands of years, continuous soil development and agricultural activities by humans have profoundly influenced the soil and ecological environment in the area. This disrupts the balanced development of soil, imposing significant pressure on soil health and the sustainability of agricultural production. Papa et al. [25] similarly concluded in their study on Mount Etna in Sicily that human activities, such as urbanization and agricultural development, significantly impact the evolution of soil and land-use diversity.
Additionally, our study found that the soil richness index in Southern Xinjiang increases with the expansion of the study area. When exploring the impact of mountainous soil diversity on ecosystem services, Fu et al. [52] also found that richness and area exhibit the same trend. In the entire Southern Xinjiang region, the distribution pattern of the soil evenness index shows that mountainous areas have higher evenness compared to basins. The uneven distribution of soil in basin areas will increase the complexity and challenges associated with soil restoration and conservation efforts after soil degradation. Soil conservation efforts are, therefore, imperative.

4.2. Factors Influencing Soil Diversity Vary across Different Regions

Soil diversity is influenced by various factors, as demonstrated by Fu et al. [53], who conducted partial correlation analysis and canonical correspondence analysis to analyze the impacts of altitude, slope, precipitation, temperature, and the proportion of cultivated land on soil diversity. The results revealed that the magnitude of influence of each factor on soil diversity occurs in the following order: altitude > proportion of cultivated land > slope > population density > precipitation. Mikhailova et al. [54], in their discussion on soil ecosystem services and ecosystem damages, found that climate change will have a direct impact on soil diversity and soil classification. In our study, it was observed that the soil diversity in mountainous areas is influenced by temperature, precipitation, and topography. Temperature fluctuations, precipitation patterns, and intricate topography intertwine to create favorable environments for various soil formation processes. Under the influence of changing altitudes, a rich variety of soil types has developed. The role of parent material is equally significant, especially in hilly plains and basins. Over extended periods of development, the parent material gradually transforms into mature soil types through numerous natural changes. This fundamentally influences soil diversity, as soils formed from different parent materials exhibit extensive variations in their physical and chemical properties [33]. From a spatial perspective, these natural changes occur synchronously, and even under identical environmental conditions, soils at various developmental stages may coexist. This phenomenon might also be a reason why soil classification systems define various soils as distinct types [33].
In conclusion, different geomorphic regions in Xinjiang exhibit unique climates, topographies, and parent materials, each playing a distinct role in shaping soil diversity. This agrees with the findings of Gerasimova et al. [55]. The intricate interactions, governed by natural processes spanning thousands of years, make each soil type a testament to the dynamic and evolving landscape of the Earth.

4.3. Limitations and Perspectives

In this study, Southern Xinjiang serves as a representative case for the exploration of soil diversity in arid regions. As we delve further into understanding the intricate dynamics of soil in similar climates, future research endeavors will increasingly concentrate on strategies to preserve and enhance soil health, fostering sustainable agricultural practices. The intensification of global climate change poses challenges, particularly for arid regions, where ecological conditions may become increasingly adverse. The study of soil diversity not only contributes basic scientific information, but also offers insights for developing adaptive agricultural technologies resilient to challenges like drought and salinity. However, it is essential to acknowledge the limitations of this study, which currently focuses solely on soil diversity in arid regions. A more comprehensive understanding could be achieved through comparative analyses involving regions or countries with diverse geographical and climatic conditions, enhancing the applicability of the findings to a variety of settings.

5. Conclusions

This study reconfirms the positive correlation between soil richness and area under specific conditions. The soil evenness index shows distinct vertical zonation, with mountainous areas surpassing hilly plains and basin regions. Simultaneously, anthropogenic activities have a certain impact on soil diversity, emphasizing the need to enhance soil conservation efforts in arid regions. The characteristics of soil diversity vary by region and are influenced by the interaction of a range of factors, including temperature, precipitation, topography, and parent material. Among these factors, temperature, precipitation, and topography play a critical role in shaping soil diversity in mountainous areas, while the influence of parent material is more pronounced in basin regions. This suggests that the diversity of the surrounding environment contributes to the complex patterns of soil diversity across different geomorphic regions. The research findings can provide valuable insights for the development of sustainable agriculture, soil conservation, and addressing climate change challenges in arid regions.

Author Contributions

Y.F. and H.W. were responsible for the research design and the manuscript’s design. J.L. drafted the manuscript and was responsible for data preparation, experiments, and analyses. R.Y. and J.C. were responsible for the research design and reviewing the manuscript. Resources and funding were procured by H.W., J.C. and K.Z. performed the data processing work. All authors have read and agreed to the published version of the manuscript.

Funding

This research was funded by the National Natural Science Foundation of China (32260280).

Institutional Review Board Statement

Not applicable.

Informed Consent Statement

Not applicable.

Data Availability Statement

The data presented in this study are available on request from the corresponding author.

Acknowledgments

The authors also thank the anonymous reviewers for their constructive comments on the manuscript.

Conflicts of Interest

The authors declare no conflicts of interest.

References

  1. Bockheim, J.G.; Gennadiyev, A.N.; Hartemink, A.E.; Brevik, E.C. Soil-forming factors and soil taxonomy. Geoderma 2014, 226, 231–237. [Google Scholar] [CrossRef]
  2. Dazzi, C.; Lo Papa, G.L. Taxonomic and environmental implication of pedotechnique in large scale farming. Int. Soil Water Conserv. Res. 2016, 4, 137–141. [Google Scholar] [CrossRef]
  3. de Brito Neto, J.F.; Chaves, F.d.F.A.; da Silva, A.L.P.; de Mesquita, E.F.; Soares, C.S.; da Cruz, G.K.G.; Ferraz, R.L.d.S.; de Paiva, F.R.; Araújo, K.R.d.C.; Macedo, R.S.; et al. Soil Health in an Integrated Production System in a Brazilian Semiarid Region. Land 2023, 12, 2107. [Google Scholar] [CrossRef]
  4. Silva, L.C.; Lambers, H. Soil-plant-atmosphere interactions: Structure, function, and predictive scaling for climate change mitigation. Plant Soil 2021, 461, 5–27. [Google Scholar] [CrossRef]
  5. Ye, L.; Xu, Y.; Zhu, G.; Zhang, W.; Jiao, Y. Effects of Different Mulch Types on Farmland Soil Moisture in an Artificial Oasis Area. Land 2024, 13, 34. [Google Scholar] [CrossRef]
  6. Lal, R. Soil quality and sustainability. In Methods for Assessment of Soil Degradation; CRC Press: Boca Raton, FL, USA, 2020; pp. 17–30. [Google Scholar]
  7. Amundson, R.; Guo, Y.; Gong, P. Soil diversity and land use in the United States. Ecosystems 2003, 6, 470–482. [Google Scholar] [CrossRef]
  8. Duan, J.; Zhang, X. Correlative comparison of pedodiversity and land use diversity between case areas from the developed east and less developed central China. J. Geogr. Sci. 2012, 22, 1101–1116. [Google Scholar] [CrossRef]
  9. Luo, M.; Wang, T.; Li, Z.; Zhang, T.; Yang, J.; Li, N.; Li, Z. Spatial distribution characteristics of pedodiversity and its major driving factors in China based on analysis units of different sizes. Catena 2021, 207, 105701. [Google Scholar] [CrossRef]
  10. Delang, C.O. The consequences of soil degradation in China: A review. GeoScape 2018, 12, 92–103. [Google Scholar] [CrossRef]
  11. Ren, Y.; Feng, H.; Gao, T. Risk cognition, social learning, and farmers’ adoption of conservation agriculture technology. Agriculture 2023, 13, 1644. [Google Scholar] [CrossRef]
  12. Kang, J.; Zhang, Y.; Biswas, A. Land degradation and development processes and their response to climate change and human activity in China from 1982 to 2015. Remote Sens. 2021, 13, 3516. [Google Scholar] [CrossRef]
  13. Gong, Z.T.; Zhang, G.L.; Chen, Z.C. Development of soil classification in China. In Soil Classification; CRC Press: Boca Raton, FL, USA, 2002; pp. 101–126. [Google Scholar]
  14. Amundson, R.; Berhe, A.A.; Hopmans, J.W.; Olson, C.; Sztein, A.E.; Sparks, D.L. Soil and human security in the 21st century. Science 2015, 348, 1261071. [Google Scholar] [CrossRef] [PubMed]
  15. Chen, Y.; Huang, X.; Lang, X.; Tang, R.; Zhang, R.; Li, S.; Su, J. Effects of plant diversity, soil microbial diversity, and network complexity on ecosystem multifunctionality in a tropical rainforest. Front. Plant Sci. 2023, 14, 40–51. [Google Scholar] [CrossRef] [PubMed]
  16. Costantini, E.A.; Mocali, S. Soil health, soil genetic horizons and biodiversity#. J. Plant Nutr. Soil Sci. 2022, 185, 24–34. [Google Scholar]
  17. Ibáñez, J.J.; Feoli, E. Global relationships of pedodiversity and biodiversity. Vadose Zone J. 2013, 12, 0186. [Google Scholar] [CrossRef]
  18. Ibañez, J.J.; De-Alba, S.; Lobo, A.; Zucarello, V. Pedodiversity and global soil patterns at coarse scales (with discussion). Geoderma 1998, 83, 171–192. [Google Scholar] [CrossRef]
  19. Phillips, J.D.; Marion, D.A. Biomechanical effects, lithological variations, and local pedodiversity in some forest soils of Arkansas. Geoderma 2005, 124, 73–89. [Google Scholar] [CrossRef]
  20. Phillips, J.D.; Marion, D.A. Soil geomorphic classification, soil taxonomy, and effects on soil richness assessments. Geoderma 2007, 141, 89–97. [Google Scholar] [CrossRef]
  21. Guo, Y.; Amundson, R.; Gong, P.; Ahrens, R. Taxonomic structure, distribution, and abundance of the soils in the USA. Soil Sci. Soc. Am. J. 2003, 67, 1507–1516. [Google Scholar] [CrossRef]
  22. Guo, Y.; Gong, P.; Amundson, R. Pedodiversity in the United States of America. Geoderma 2003, 117, 99–115. [Google Scholar] [CrossRef]
  23. Bennett, J.M.; McBratney, A.; Field, D.; Kidd, D.; Stockmann, U.; Liddicoat, C.; Grover, S. Soil security for Australia. Sustainability 2019, 11, 3416. [Google Scholar] [CrossRef]
  24. Techen, A.K.; Helming, K. Pressures on soil functions from soil management in Germany. A foresight review. Agron. Sustain. Dev. 2017, 37, 64. [Google Scholar] [CrossRef]
  25. Papa, G.L.; Palermo, V.; Dazzi, C. Is land-use change a cause of loss of pedodiversity? The case of the Mazzarrone study area, Sicily. Geomorphology 2011, 135, 332–342. [Google Scholar] [CrossRef]
  26. Bhattacharyya, T. Soil diversity in India. J. Indian Soc. Soil Sci. 2016, 64, S41–S52. [Google Scholar]
  27. Krasilnikov, P.V.; Gerasimova, M.I.; Golovanov, D.L.; Konyushkova, M.V.; Sidorova, V.A.; Sorokin, A.S. Pedodiversity and its significance in the context of modern soil geography. Eurasian Soil Sci. 2018, 51, 1–13. [Google Scholar] [CrossRef]
  28. Smirnova, M.; Bocharnikov, M. Ecosystem, Vegetation and Soil Diversity of the Mountain Forest-Steppe of West Altai (a Case Study of The Tigirek State Natural Reserve). Proc. IOP Conf. Ser. Earth Environ. Sci. 2021, 908, 012028. [Google Scholar] [CrossRef]
  29. Fu, T.; Han, L.; Gao, H.; Liang, H.; Liu, J. Geostatistical analysis of pedodiversity in Taihang mountain region in north China. Geoderma 2018, 328, 91–99. [Google Scholar] [CrossRef]
  30. Samec, P.; Volánek, J.; Kučera, M.; Cudlín, P. Effect of soil diversity on forest plant species abundance: A case study from central-European highlands. Forests 2021, 12, 534. [Google Scholar] [CrossRef]
  31. Zhou, Y.; Li, Y.; Li, W.; Li, F.; Xin, Q. Ecological responses to climate change and human activities in the arid and semi-arid regions of Xinjiang in China. Remote Sens. 2022, 14, 3911. [Google Scholar] [CrossRef]
  32. Yu, X.; Lei, J.; Gao, X. An over review of desertification in Xinjiang, northwest China. J. Arid Land 2022, 14, 1181–1195. [Google Scholar] [CrossRef]
  33. Wilson, M.J. The importance of parent material in soil classification: A review in a historical context. Catena 2019, 182, 104131. [Google Scholar] [CrossRef]
  34. Patil, A.; Lamnganbi, M. Impact of climate change on soil health: A review. Int. J. Chem. Stud 2018, 6, 2399–2404. [Google Scholar]
  35. Rothacker, L.; Dosseto, A.; Francke, A.; Chivas, A.R.; Vigier, N. Impact of climate change and human activity on soil landscapes over the past 12,300 years. Sci. Rep. 2018, 8, 247. [Google Scholar] [CrossRef] [PubMed]
  36. Wieder, W.L.; Shoop, S.A. State of the knowledge of vegetation impact on soil strength and trafficability. J. Terramech. 2018, 78, 1–14. [Google Scholar] [CrossRef]
  37. Zhu, M.; Feng, Q.; Qin, Y.; Cao, J.; Zhang, M. The role of topography in shaping the spatial patterns of soil organic carbon. Catena 2019, 176, 296–305. [Google Scholar] [CrossRef]
  38. Wang, N.; Cheng, W.; Wang, B.; Liu, Q.; Zhou, C. Geomorphological regionalization theory system and division methodology of China. J. Geogr. Sci. 2020, 30, 212–223. [Google Scholar] [CrossRef]
  39. Li, B.; Pan, B.; Cheng, W.; Han, J.; Qi, D.; Zhu, C. Research on geomorphological regionalization of China. Acta Geogr. Sin. 2013, 68, 291–306. [Google Scholar]
  40. Guan, X.; Shen, H.; Wang, Y.; Chu, D.; Li, X.; Yue, L.; Liu, X.; Zhang, L. Fusing MODIS and AVHRR products to generate a global 1-km continuous NDVI time series covering four decades. Earth Syst. Sci. Data Discuss. 2021, 12, 1–32. [Google Scholar]
  41. Ibáñez, J.J.; Caniego, J.; San José, F.; Carrera, C. Pedodiversity-area relationships for islands. Ecol. Modell. 2005, 182, 257–269. [Google Scholar] [CrossRef]
  42. Zhu, L.; Meng, J.; Zhu, L. Applying Geodetector to disentangle the contributions of natural and anthropogenic factors to NDVI variations in the middle reaches of the Heihe river basin. Ecol. Indic. 2020, 117, 106545. [Google Scholar] [CrossRef]
  43. Jansson, J.K.; Hofmockel, K.S. Soil microbiomes and climate change. Nat. Rev. Microbiol. 2020, 18, 35–46. [Google Scholar] [CrossRef]
  44. Gracheva, R. Formation of soil diversity in the mountainous tropics and subtropics: Rocks, time, and erosion. Geomorphology 2011, 135, 224–231. [Google Scholar] [CrossRef]
  45. Ibáñez, J.; Caniego, J.; Garcıa-Alvarez, A. Nested subset analysis and taxa-range size distributions of pedological assemblages: Implications for biodiversity studies. Ecol. Modell. 2005, 182, 239–256. [Google Scholar] [CrossRef]
  46. Yakovenko, V.; Kunakh, O.; Tutova, H.; Zhukov, O. Diversity of soils in the Dnipro river valley (based on the example of the Dnipro-Orilsky nature reserve). Folia Oecol. 2023, 50, 119–133. [Google Scholar] [CrossRef]
  47. Li, Z.; Liu, H.; Yang, H.; Wang, T. Effects of deep vertical rotary tillage management methods on soil quality in saline cotton fields in southern Xinjiang. Agriculture 2023, 13, 1864. [Google Scholar] [CrossRef]
  48. Ma, T.; Deng, X.; Chen, L.; Xiang, W. The soil properties and their effects on plant diversity in different degrees of rocky desertification. Sci. Total Environ. 2020, 736, 139667. [Google Scholar] [CrossRef] [PubMed]
  49. Jin, C.; Wang, B.; Cheng, T.F.; Dai, L.; Wang, T. How much we know about precipitation climatology over Tianshan Mountains––the Central Asian water tower. NPJ Clim. Atmos. Sci. 2019, 7, 21. [Google Scholar] [CrossRef]
  50. Yang, T.; Siddique, K.H.M.; Liu, K. Cropping systems in agriculture and their impact on soil health—A review. Glob. Ecol. Conserv. 2020, 23, e01118. [Google Scholar] [CrossRef]
  51. Minasny, B.; McBratney, A.B.; Hartemink, A.E. Global pedodiversity, taxonomic distance, and the world reference base. Geoderma 2010, 155, 132–139. [Google Scholar] [CrossRef]
  52. Fu, T.; Liu, J.; Jiang, G.; Gao, H.; Qi, F.; Wang, F. Influences of pedodiversity on ecosystem services in a mountainous area. Catena 2022, 217, 106505. [Google Scholar] [CrossRef]
  53. Fu, T.; Han, L.; Gao, H.; Liang, H.; Li, X.; Liu, J. Pedodiversity and its controlling factors in mountain regions—A case study of Taihang mountain, China. Geoderma 2018, 310, 230–237. [Google Scholar] [CrossRef]
  54. Mikhailova, E.A.; Zurqani, H.A.; Post, C.J.; Schlautman, M.A.; Post, G.C. Soil diversity (pedodiversity) and ecosystem services. Land 2021, 10, 288. [Google Scholar] [CrossRef]
  55. Gerasimova, M.I.; Golovleva, I.A.; Konyushkova, M.V.; Sorokin, A.S.; Krasilnikov, P.V. Assessment of soil diversity using soil maps with different scales in eastern Fennoscandia, Russia. Geoderma Reg. 2020, 21, e00274. [Google Scholar] [CrossRef]
Figure 1. Schematic map of the study area.
Sustainability 16 02561 g001
Figure 2. Distribution of different influencing factors. (A) shows the distribution of average air temperature in Xinjiang South Xinjiang from 1982 to 1985; (B) shows the distribution of average precipitation in Xinjiang South Xinjiang from 1982 to 1985; (C) shows the secondary geomorphologic zoning in Xinjiang South Xinjiang; (D) shows the distribution of average NDVI in Xinjiang South Xinjiang from 1982 to 1985; (E) shows the distribution of distribution map of soil parent material in Xinjiang South Xinjiang; (F) shows the distribution map of topography in Xinjiang South Xinjiang.
Sustainability 16 02561 g002
Figure 3. Analysis workflow chart.
Sustainability 16 02561 g003
Figure 4. Curve of window area–soil richness relationship and optimal analysis window. (A) shows the curves of window area and richness index in different geomorphic zones; (B) shows the optimal analyzed windows in different geomorphic zones.
Sustainability 16 02561 g004
Figure 5. Percentage of top ten soil types in different geomorphic regions.
Sustainability 16 02561 g005
Figure 6. Interpretation degree of various factors in the different geomorphologic regions. I indicates Qiangtang Plateau Lake Basin, II indicates Karakoram Mountains, III indicates Kunlun Mountains, IV indicates Altun Mountains Qilian Mountains, V indicates Tianshan Alpine Basin, VI indicates Tarim Basin. TD indicates topographic relief, C indicates parent material, P indicates precipitation, T indicates temperature, and VEG indicates vegetation.
Sustainability 16 02561 g006
Figure 7. Ecological detector results in the different geomorphologic regions. 1 indicates a significant difference in the effect of environmental factors on soil diversity and −1 indicates no significant difference.
Sustainability 16 02561 g007
Table 1. Fitting results of different geomorphologic regions.
Geomorphologic RegionS = aln(bA + 1)S = aAb
abR2abR2
Qiangtang Plateau Lake Basin0.492 ± 0.0260.374 ± 0.1190.971 ± 0.0160.718 ± 0.0220.199 ± 0.0040.996 ± 0.002
Karakoram Mountains0.396 ± 0.0142.543 ± 0.5160.986 ± 0.0071.163 ± 0.0660.140 ± 0.0070.971 ± 0.011
Kunlun Mountains1.790 ± 0.1460.014 ± 0.0050.942 ± 0.3170.532 ± 0.0320.312 ± 0.0070.994 ± 0.034
Altun Mountains Qilian Mountains2.305 ± 0.2590.007 ± 0.0020.934 ± 0.4170.323 ± 0.0370.380 ± 0.0140.987 ± 0.081
Tianshan Alpine Basin2.152 ± 0.1470.019 ± 0.0050.957 ± 0.3750.797 ± 0.0370.294 ± 0.0040.997 ± 0.020
Tarim Basin1.021 ± 0.0640.034 ± 0.0100.957 ± 0.0930.548 ± 0.0160.265 ± 0.030.998 ± 0.004
Table 2. Richness index, diversity index, and evenness index of soil types in different geomorphologic regions.
Geomorphologic RegionArea Proportion (%)Richness IndexDiversity IndexEvenness Index
Qiangtang Plateau Lake Basin2.8470.528 ± 0.1190.575 ± 0.123
Karakoram Mountains3.3480.748 ± 0.0830.633 ± 0.086
Kunlun Mountains18.80191.247 ± 0.1030.670 ± 0.122
Altun Mountains Qilian Mountains3.37121.383 ± 0.0910.743 ± 0.082
Tianshan Alpine Basin11.31181.728 ± 0.1650.786 ± 0.078
Tarim Basin60.35230.677 ± 0.0110.395 ± 0.096
Disclaimer/Publisher’s Note: The statements, opinions and data contained in all publications are solely those of the individual author(s) and contributor(s) and not of MDPI and/or the editor(s). MDPI and/or the editor(s) disclaim responsibility for any injury to people or property resulting from any ideas, methods, instructions or products referred to in the content.

