Article

Anaerobic Co-Digestion of Agro-Industrial Waste Mixtures for Biogas Production: An Energetically Sustainable Solution

by
Diógenes Hernández
1,2,
Fernando Pinilla
1,
Ricardo Rebolledo-Leiva
3,4,*,
Joaquín Aburto-Hole
1,
Joaquín Díaz
1,
Guillermo Quijano
5,
Sara González-García
3 and
Claudio Tenreiro
1
1
Departamento de Tecnologías Industriales, Faculty of Engineering, Universidad de Talca, Merced 437, Curicó 3341717, Chile
2
Institute of Chemistry of Natural Resources, University of Talca, Talca 3460000, Chile
3
CRETUS, Department of Chemical Engineering, School of Engineering, University of Santiago de Compostela, 15782 Santiago de Compostela, Spain
4
Department of Computing and Industries, Faculty of Engineering Sciences, Universidad Católica del Maule, Av. San Miguel 3605, Talca 3460000, Chile
5
Laboratory for Research on Advanced Processes of Water Treatment, Juriquilla Academic Unit, Engineering Institute, Universidad Nacional Autónoma de México, Blvd. Juriquilla 3001, Queretaro 76230, Mexico
*
Author to whom correspondence should be addressed.
Sustainability 2024, 16(6), 2565; https://doi.org/10.3390/su16062565
Submission received: 30 December 2023 / Revised: 29 February 2024 / Accepted: 14 March 2024 / Published: 21 March 2024

Abstract

:
In a climate crisis, searching for renewable energy sources is urgent and mandatory to achieve a low-carbon society. The food industry is an attractive source for providing different organic waste with great potential for energy generation, avoiding the environmental impacts of its inadequate management at the disposal stage. This manuscript determines the feasibility of using three agro-industrial byproducts for biogas production with a mesophilic anaerobic digestion process. Three mixture samples such as tomato pulp with olive cake (TP-OC), apple pomace with olive cake (AP-OC), and tomato pulp with apple pomace (TP-AP) at a 1:1 w/w ratio were evaluated using bovine manure as inoculum. During 7 to 12 days of operation, results indicate that TP-OC achieved the highest biogas production yield with 1096 mL/L (with up to 70% methane), followed by AP-OC and TP-AP with 885 (62% methane) and 574 mL/L (69% methane), respectively. Experimentally, TP-OC consistently encompassed the highest biogas and methane production and fit the kinetic models, whereas the modified Gompertz model produced the best fit (R2 = 99.7%). This manuscript supports the preference for mixing byproducts from the agro-industrial sector rather than using them individually for biogas production.

1. Introduction

In regions with agri-food business as their main economic activity, the large volume of waste is a major concern. The accumulation of organic waste is an issue that requires attention due to the contamination risk to human health and the environment [1], with odorous effects in nearby communities from the emanation of volatile organic compounds from their long-time storage [2]. Furthermore, the inappropriate management of accumulation lies in damage to the land, surface effluents, and groundwater [3,4], as well as the traditional disposal of organic waste in landfills generating annual costs ranging from 250 to 850 USD/t, depending on the type and amount of waste generated [5].
Food waste stands out as one of the most attractive sources for valorization routes focusing on the generation of energy and value-added products (e.g., biochemicals and animal feed). The great volumes of waste generated along the food value chain (cultivation, manufacturing, distribution, and consumption), its low cost, and its composition are some of the reasons for its attractiveness [6]. Different studies in the literature affirm that the most used agro-industrial wastes for energy purposes are related to fruit components [7,8], highlighting the use of peels, leaves, stems, and pomace [9]. In this regard, feedstock selection for a valorization process should be based on its composition, the quality of its components, and the quantity that is generated in the region where the bio-based platform could be installed to ensure its operation [10].
Chile is a leading producer and exporter of agri-food products in the southern hemisphere [11], but their massive production also lies in the generation of high levels of organic waste. For instance, apple pomace (composed of shells, seeds, fibrous pulp, and juice fibrous) reached an annual production of about 164 kt in 2021 from the 31 thousand hectares of apple trees planted in Chile [12], while at least 6 kt of tomato pomace were generated in 2020 from the nearly 152 kt of tomato processed in the food industry to make paste, juice, puree, ketchup, and other products [13]. Olive cake is another byproduct relevant in Chile, where the oil process generates annually about 70 kt of olive cake, which represents 80% of the total olives processed in this country [14,15]. The great availability of these byproducts and their valuable composition represent an attractive source for energy generation. In addition, Chile stands out for its continuous interest in energy production based on renewable sources, such as solar, hydro, and wind energy, as well as bio-based sources such as biofuels and biogas under a circularity approach [14].
Biogas is mainly composed of methane (CH4) and carbon dioxide (CO2), and includes other gases (e.g., H2S, H2O and H2,) in lower concentrations [16]. It can be obtained from a biological process known as anaerobic digestion (AD) using organic residues as substrates [17]. In this regard, the literature has described the viability of using agro-industrial byproducts in AD processes for energy generation. For instance, Alonso-Fariñas et al. [18] proposed a combined anaerobic and aerobic process for producing biogas using olive cake as feedstock. Castro et al. [19] determined proportions between tomato pomace and inoculum for maximizing biogas production, while Ampese et al. [20] evaluated biogas production based on apple pomace.
In this sense, the use of byproducts from the agro-industrial sector emerges as a feasible alternative to produce renewable energy and reduce the massive levels of accumulation due to inappropriate management at the industrial scale. Based on the relevance of apple, olive, and tomato in the food industry in Chile and its potential applicability in other countries with similar economic activity, this research aims to evaluate methane production by co-digestion of apple pomace, tomato pomace, and olive cake. Thus, combining these byproducts avoids the dependence on a single raw material to ensure energy supply and promote industrial symbiosis among food companies in a potential agro-industrial region. Furthermore, statistical analyses were used to determine the best-performing mixture, which has practical applications for organic waste valorization in Chile.

2. Materials and Methods

2.1. Organic Waste Characterization

Samples were collected directly from the food companies that process apples, tomatoes, and olives for their respective markets. Apple pomace (AP) was obtained from SURFRUT company in Romeral, Chile, which processes different varieties of apples such as Royal Gala, Richared Delicious, Granny Smith, Gala, and Tenroy Royal Gala. Tomato pomace (TP) was collected from Agrozzi company in Teno, Chile. Meanwhile, olive cake (OC) was donated by Terramater company located in Sagrada Familia, Chile. Olive cake samples are derived from Arbequina, Leccino, and Picual varieties. The samples were transported in plastic containers of 50 L to the facilities of the University of Talca, Chile, and no other conditions (e.g., cooling) were necessary for the raw materials collected.
After collection, each sample (AP, TP, and OC) was analyzed in triplicate to determine their physicochemical properties (see Figure 1). The parameters evaluated and methods performed were total solids (gravimetric method—Equip M214Ai, BEL®, Bolzano, Italy); fixed solids (muffle method—Equip Vulcan, A-550, Yucaipa, CA, USA); volatile solids (muffle method—Equip Vulcan, A-550 Yucaipa, CA, USA); pH (dimensionless—Equip EZDO, PL-700AL, Taiwan); chemical oxygen demand (COD) (spectrophotometer UV—Equip Mecasys, Optizen POP, Daejeon, Republic of Korea); biochemical oxygen demand (BOD5) (respirometric method—Equip Velp Scientifica, BMS, Europe); moisture content (oven method—AOAC 945.15—Equip Yihder, DK-600DT, Xinbei, China); proteins (Kjeldahl method—AOAC 979.09—Equip Velp Scientifica, DKL Heating Digester, Europe); fats (Soxhlet method—AOAC 963.15); carbohydrates [21] (Equip Mecasys, Optizen POP, Republic of Korea); fiber (gravimetric method—AOAC 920.169—Equip Velp Scientifica, FIWE, Europe); ashes (muffle method—AOAC 940.26—Equip Vulcan, A-550, Yucaipa, CA, USA); calorific value (DIN Serie 51.900—Equip Cal2k, ECO, Northcliff, South Africa); standard total phenolic (Folin–Ciocalteu methods as gallic acid equivalents—Equip Mecasys, Optizen POP, Republic of Korea); total organic carbon (TOC) (method DUMA—Equip Mecasys, Optizen POP, Republic of Korea); and metals (method of Spectrometer AA—Equip Analytikjena, novAA800, Jena, Germany). The characterization of these parameters is relevant for anticipating the potential of the organic waste to produce biogas [22].
After physicochemical analysis, each sample was grinded using industrial mixing (CALVAC®, San Bernardo, Chile). Then, using a balance (Sauter, RC2022, Basel, Switzerland), 500 g of each sample was weighed and mixed in a 1:1% w/w ratio (Equip Bel, M214Ai, Italy) as follows: TP-OC, AP-OC, and TP-AP. Each mixture was prepared in triplicate and the anaerobic digestion (AD) process was carried out to produce biogas.

2.2. Anaerobic Digestion Process

Each AD process was performed using 85% (w/w) of the mixture (TP-OC, AP-OC, and TP-AP), while the remaining 15% (w/w) corresponds to cow manure as inoculum. The AD processes were performed in a 3 L bioreactor (Evo FS-07, Winpact, Taiwan) in a solid content of ≤15% w/v of solids, where the dilution was carried out with 2.7 L of HPLC water, as previously recommended by Hernández et al. [9]. The reactor was operated at 35 °C, with an agitation of 100 rpm during 10 min every eight hours of operation, as recommended by Bolen et al. [23]. The experiments lasted 25 days. The reactor automatically controlled the pH at 7.5 by adding 0.1 M NaOH or 0.1 M H3PO4, accordingly.

2.3. Gas Sample

Biogas production was measured through a burette and then stored in a Tedlar® bag. Methane concentration in biogas was measured through an MQ4 methane sensor (Atmel, ATmega328P, Milan, Italy) connected to an Arduino circuit and a computer data logger. The measuring of gas yield is based on the reactor filling, so, in general, it is milliliter of product (biogas or methane) per liter of reactor.

2.4. Kinetic Modeling

As shown in Table 1, different models reported by Parra-Orobio et al. [24] were tested to determine the methane production (VCH4(t)) from the three organic waste mixtures in terms of the lag-phase time (λ, days), the maximum methane production ( P m a x , mL CH4/L), and the maximum rate of methane production ( R m a x , mL CH4/L day). Variance analysis tests (ANOVA, p < 0.05) were carried out to identify significant differences in the kinetic data obtained for each organic waste mixture. The mean square error (MSE) and coefficient of determination (R2) were calculated for each model fitting. Then, MATLAB® version 9.12 was used to identify the model that maximizes the coefficient R2 and minimizes the MSE value.

3. Results and Discussion

3.1. Initial Characterization

Table 2 shows the initial physicochemical characterization of the samples. Regarding the total solids, it is possible to observe that the three mixtures present values between 4.5% and 7.5%. This is in line with the amount indicated by Dennis and Burke [25], with samples containing 6–12% of total solids for an AD process. Volatile solids are another relevant parameter to be considered according to Jeldres et al. [26], since they represent the proportion that will convert into methane. In this sense, the values obtained in this research are between 40.5 and 67.6 g VS/L, which entails a considerable amount of material for the generation of methane. Furthermore, the work by Gerardi [27] determined that the recommended pH to produce methane ranges between 6.5 and 7.5. For this reason, the mean pH of the samples was adjusted using NaOH to maintain pH levels at 7.5 throughout this research. The pH is an interesting parameter because, although studies are recommending neutral values, there are studies such as Luongo et al. [28] that used acidic samples in their processes with success.
The BOD/COD ratio allowed the biodegradability of the sample to be estimated and confirmed that the organic matter was degraded during the AD process, because the value obtained was close to 1 [29]. The work of Ahmed et al. [30] in insects as raw materials for methane production reported protein and fat values around 55.8% and 11.8%, respectively, for their samples. In this manuscript, the values of these parameters (see Table 2) are lower than those estimated by Ahmed et al., but the research of Alibaldi and Cossu [31] showed that protein and fats for different waste mixtures used to produce methane had no significant contributions. In addition, carbohydrates are also essential for the AD process; studies conducted by Alibaldi and Cossu [31] and Markou et al. [32] have similar carbohydrate values (around 50%) to those reported in Table 2, demonstrating that this parameter has a positive correlation with biogas production. Here, a higher content of carbohydrates in the AP-OC mixture was obtained, possibly associated with the great amount of sugar from the apple pomace.
Table 3 indicates the concentration of the metals observed in the samples. From this, it is possible to identify that all of them do not achieve values that can be potentially toxic for the AD microbial community. In this regard, lead (Pb) and cadmium (Cd) are those with particular interest, with values lower than 0.5 mg/kg in all samples. Moreover, copper (Cu), which can also be toxic, reached values below the threshold allowed in Chile (1200 mg/kg) to be applied in soils, according to the standard DS04/2009 [33]. In the same way, zinc (Zn) values are below 2800 mg/kg, which is the threshold allowed by the same standard. Finally, the values of arsenic (As) and mercury (Hg) in each sample were lower than 0.5 mg/kg; thus, they do not represent a restriction in the biodegradability of the organic matter.

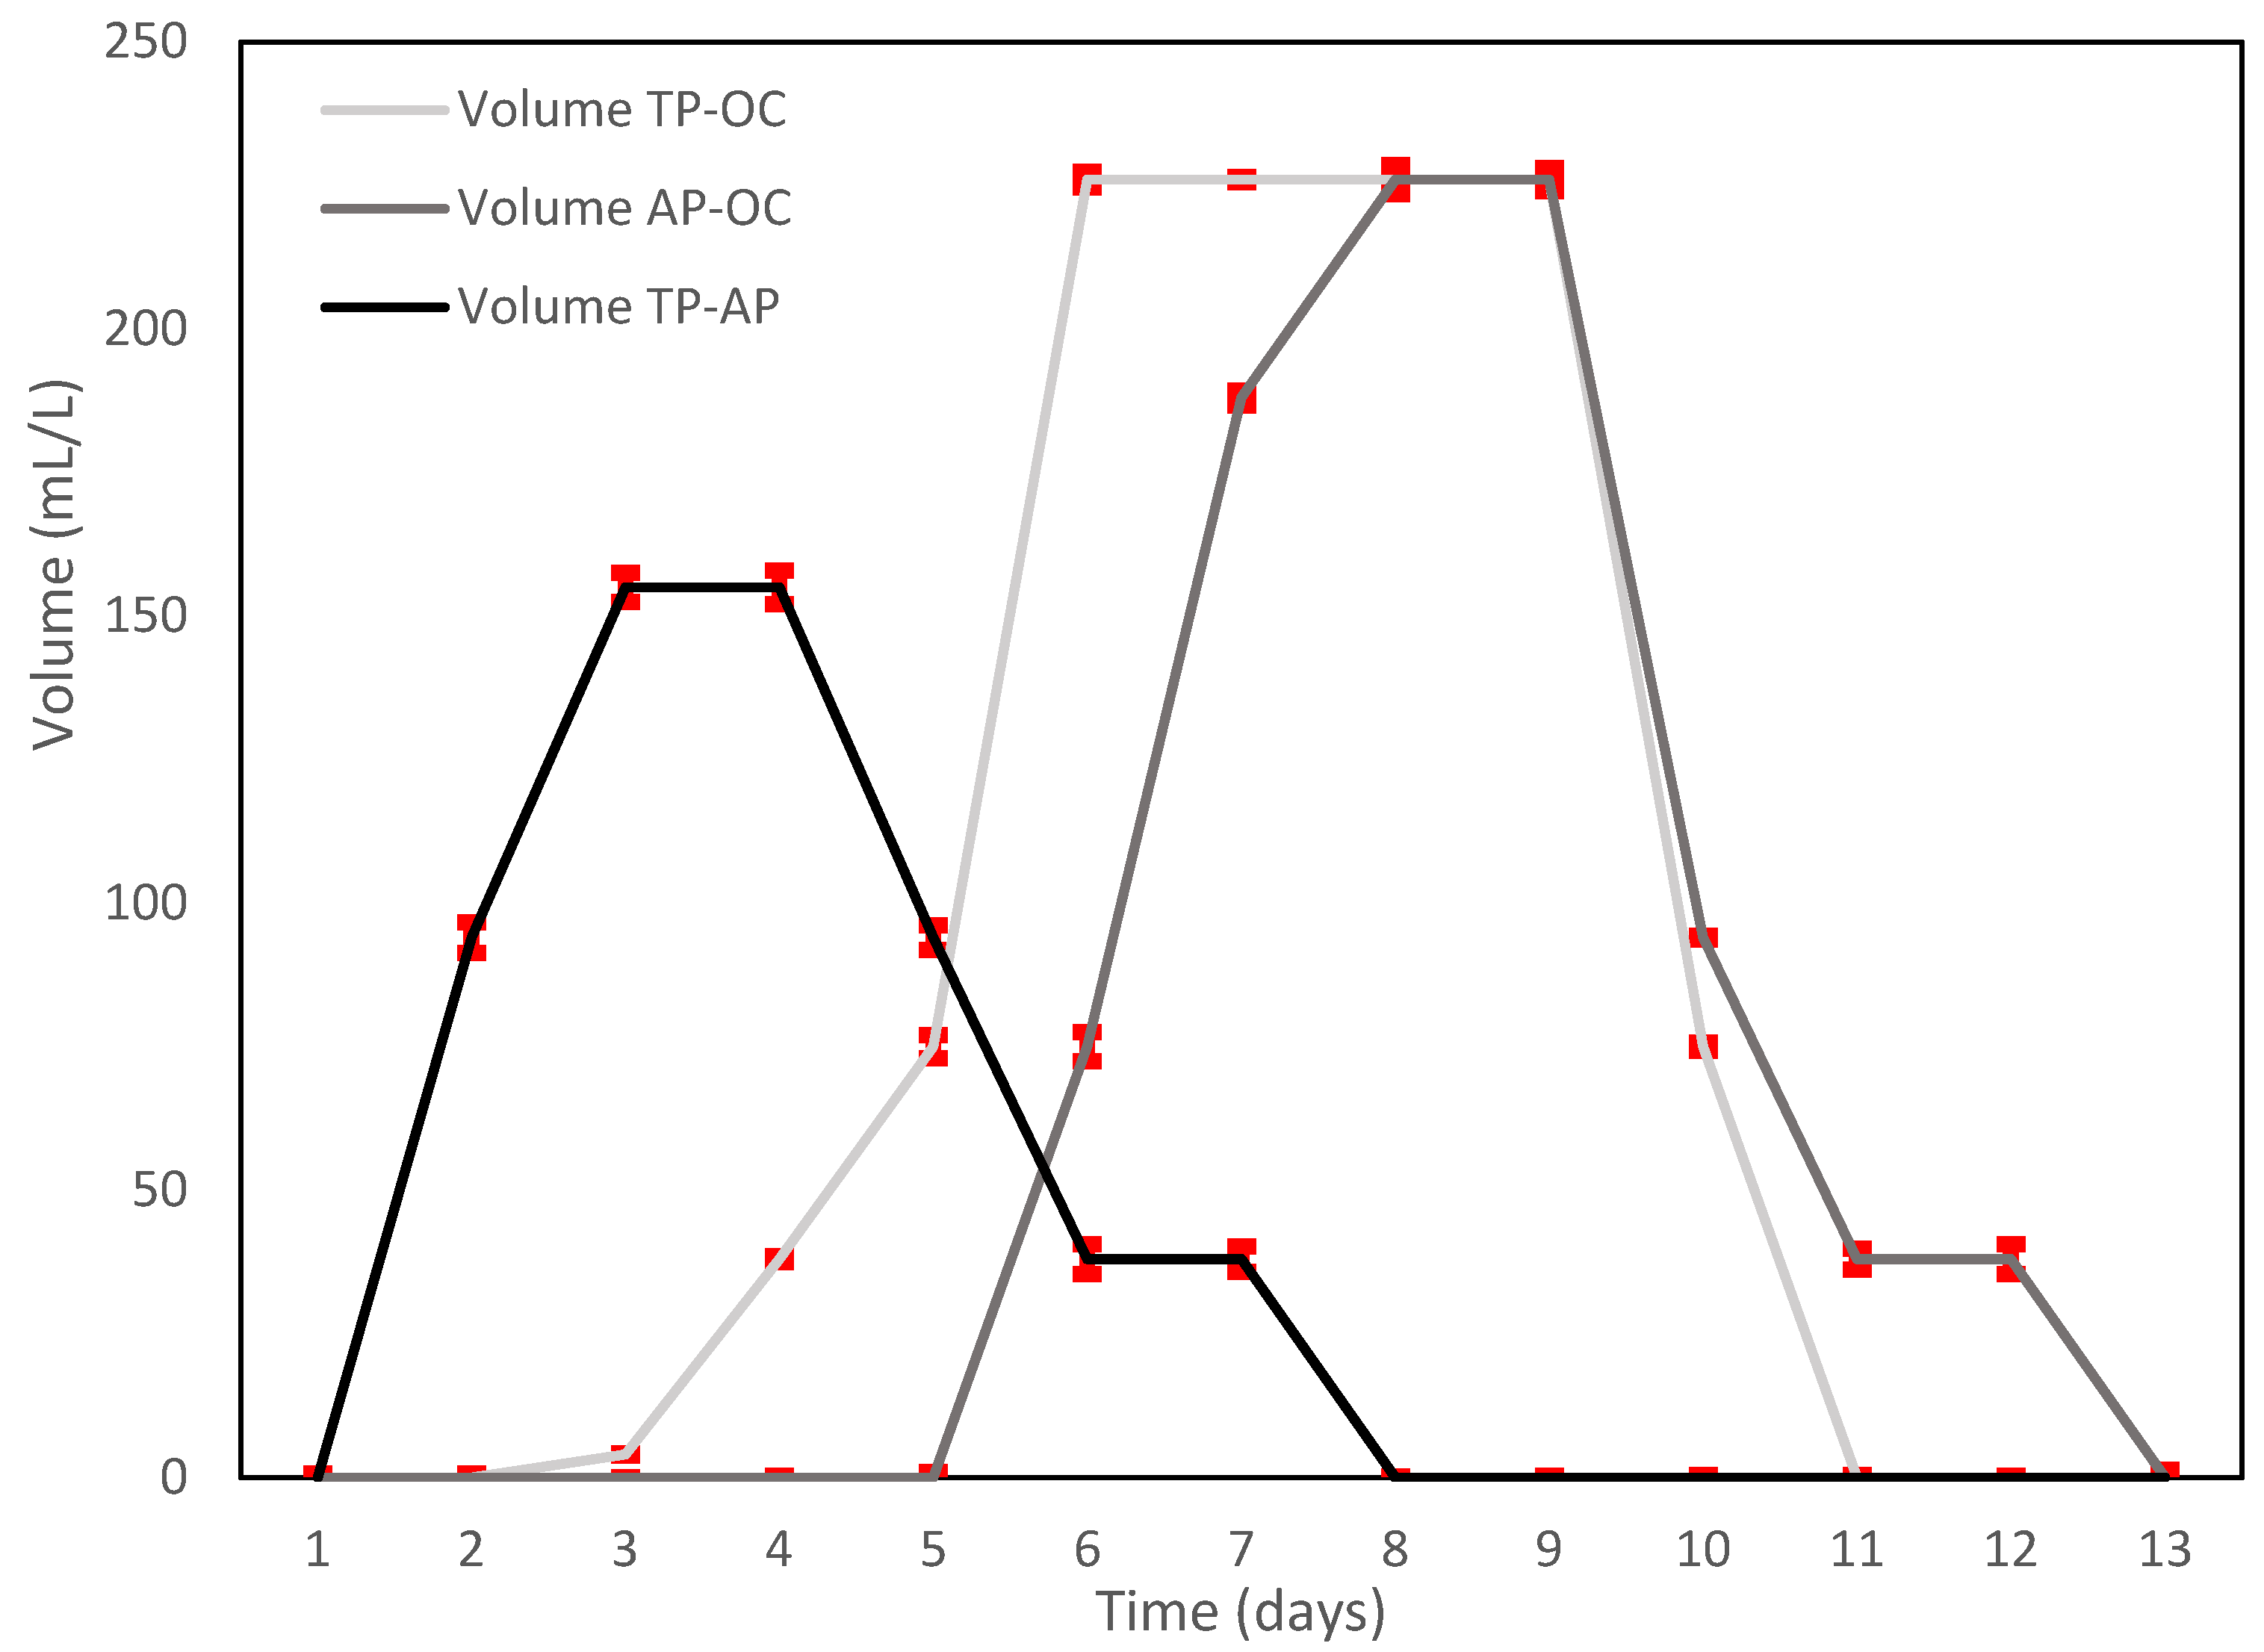
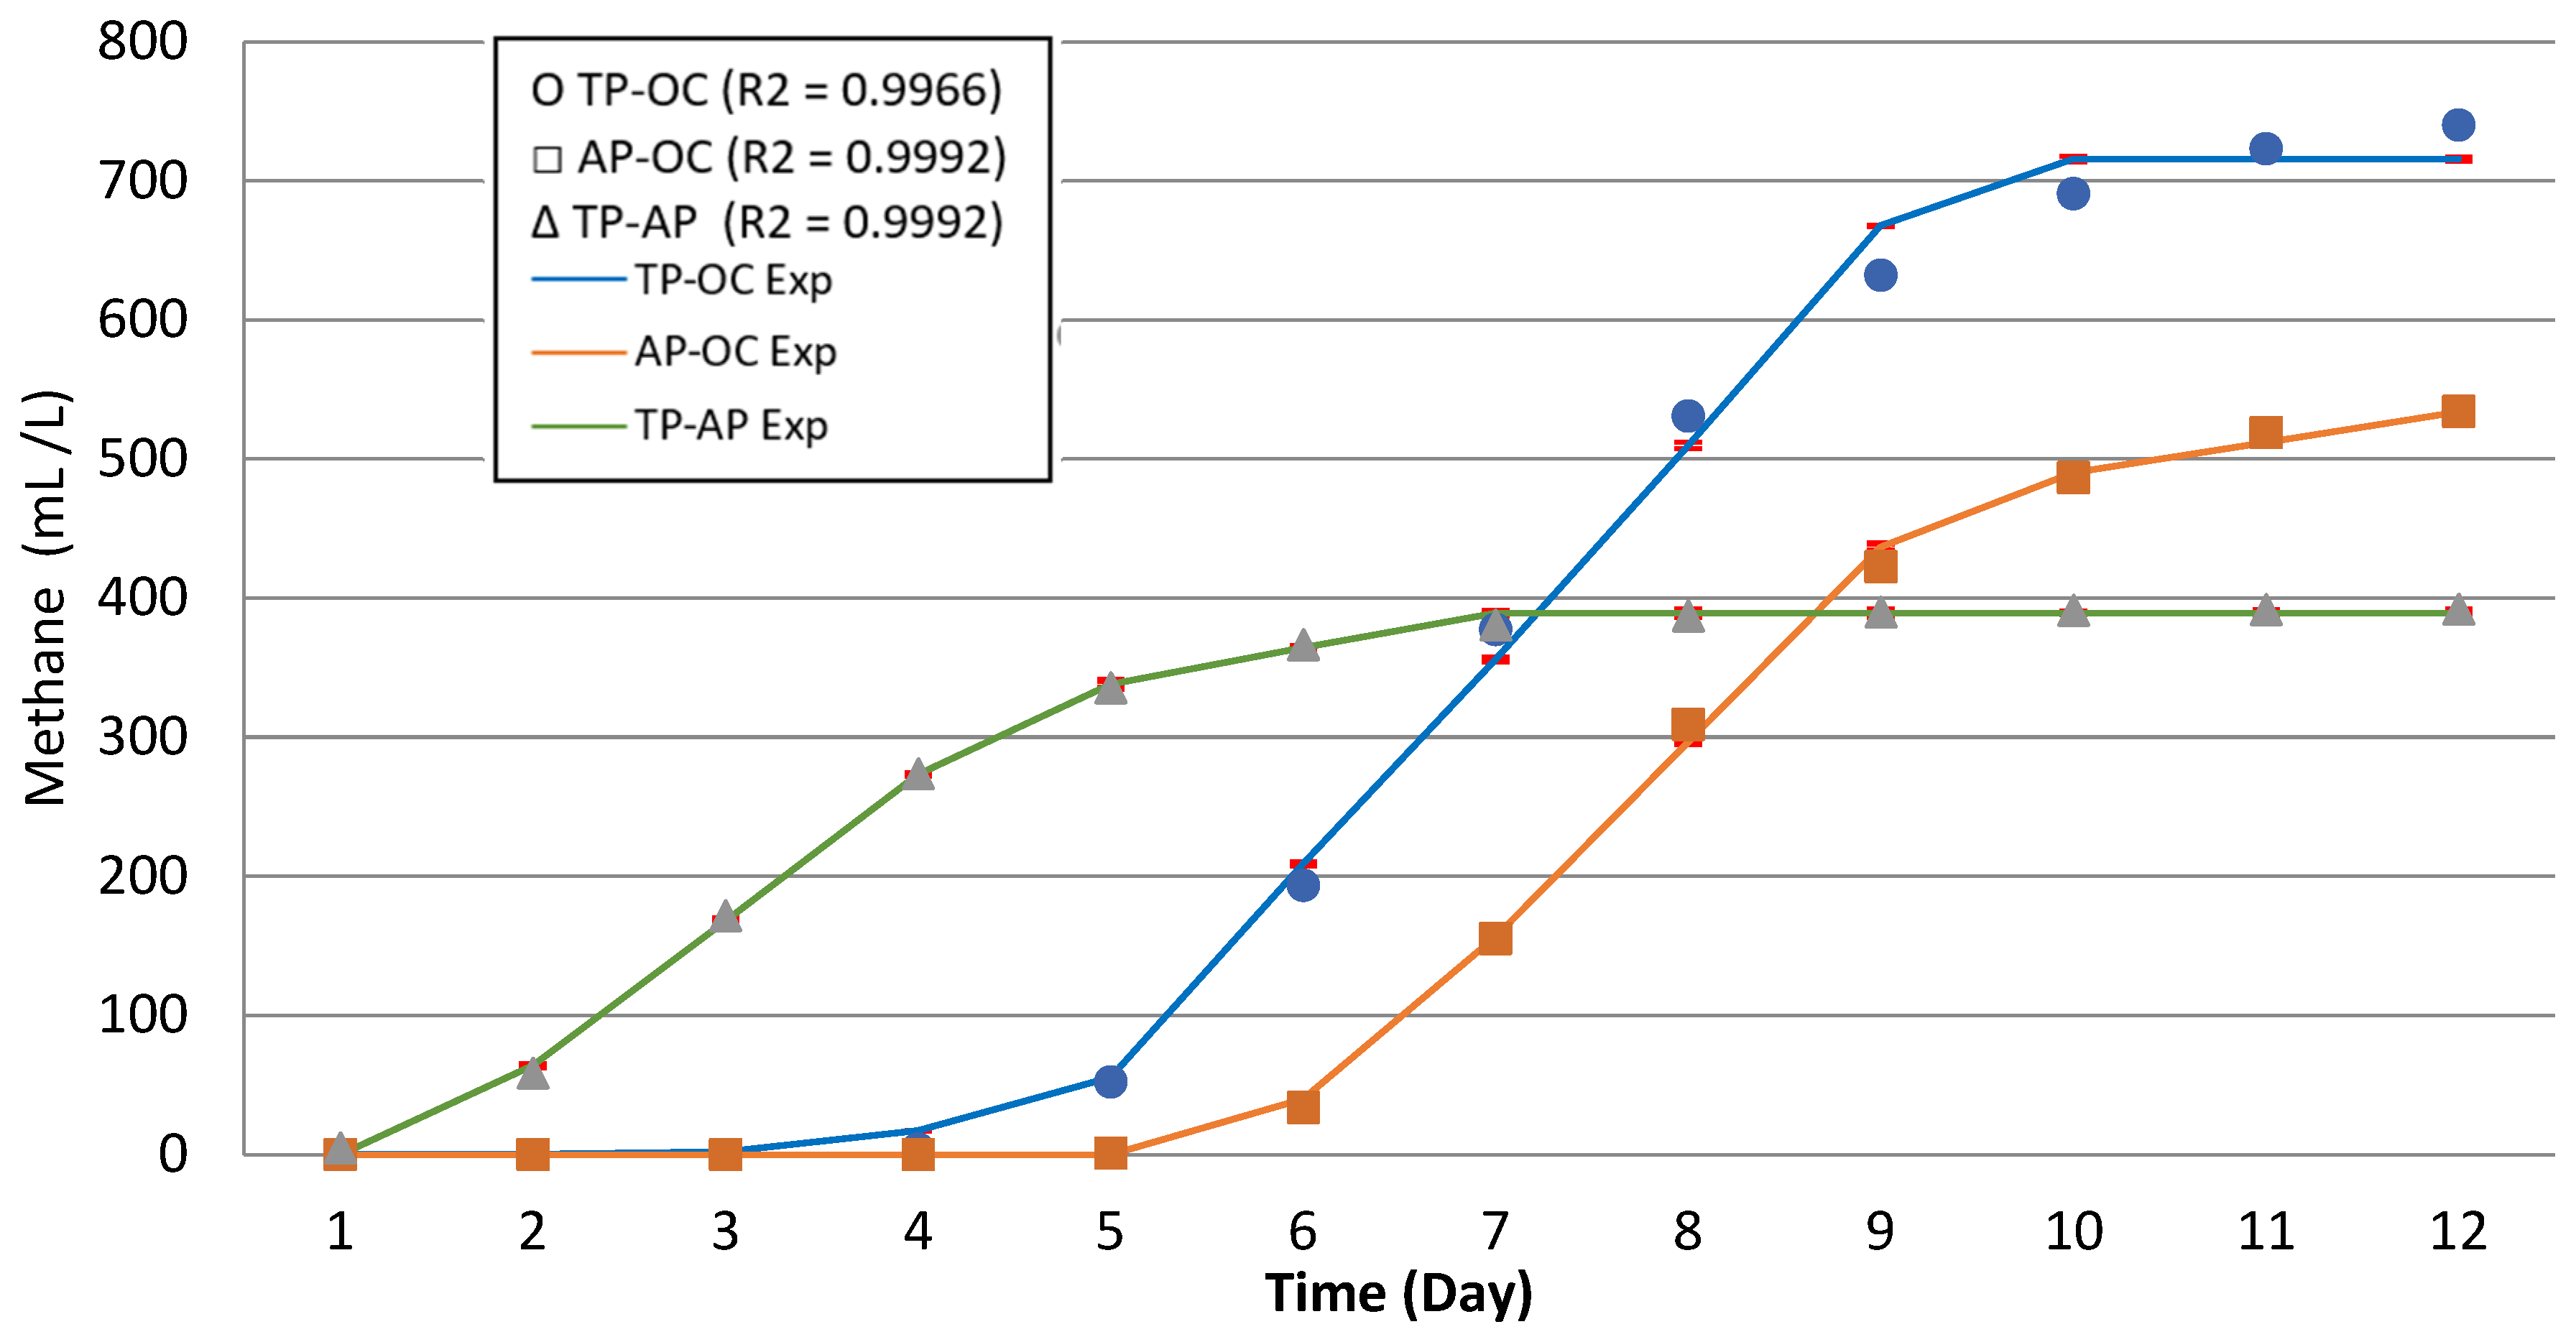
3.2. Biogas Production

The AD tests lasted 25 days and biogas generation was observed mainly during the first 12 days. Thus, the results obtained for each mixture are presented and discussed over a 12-day period.

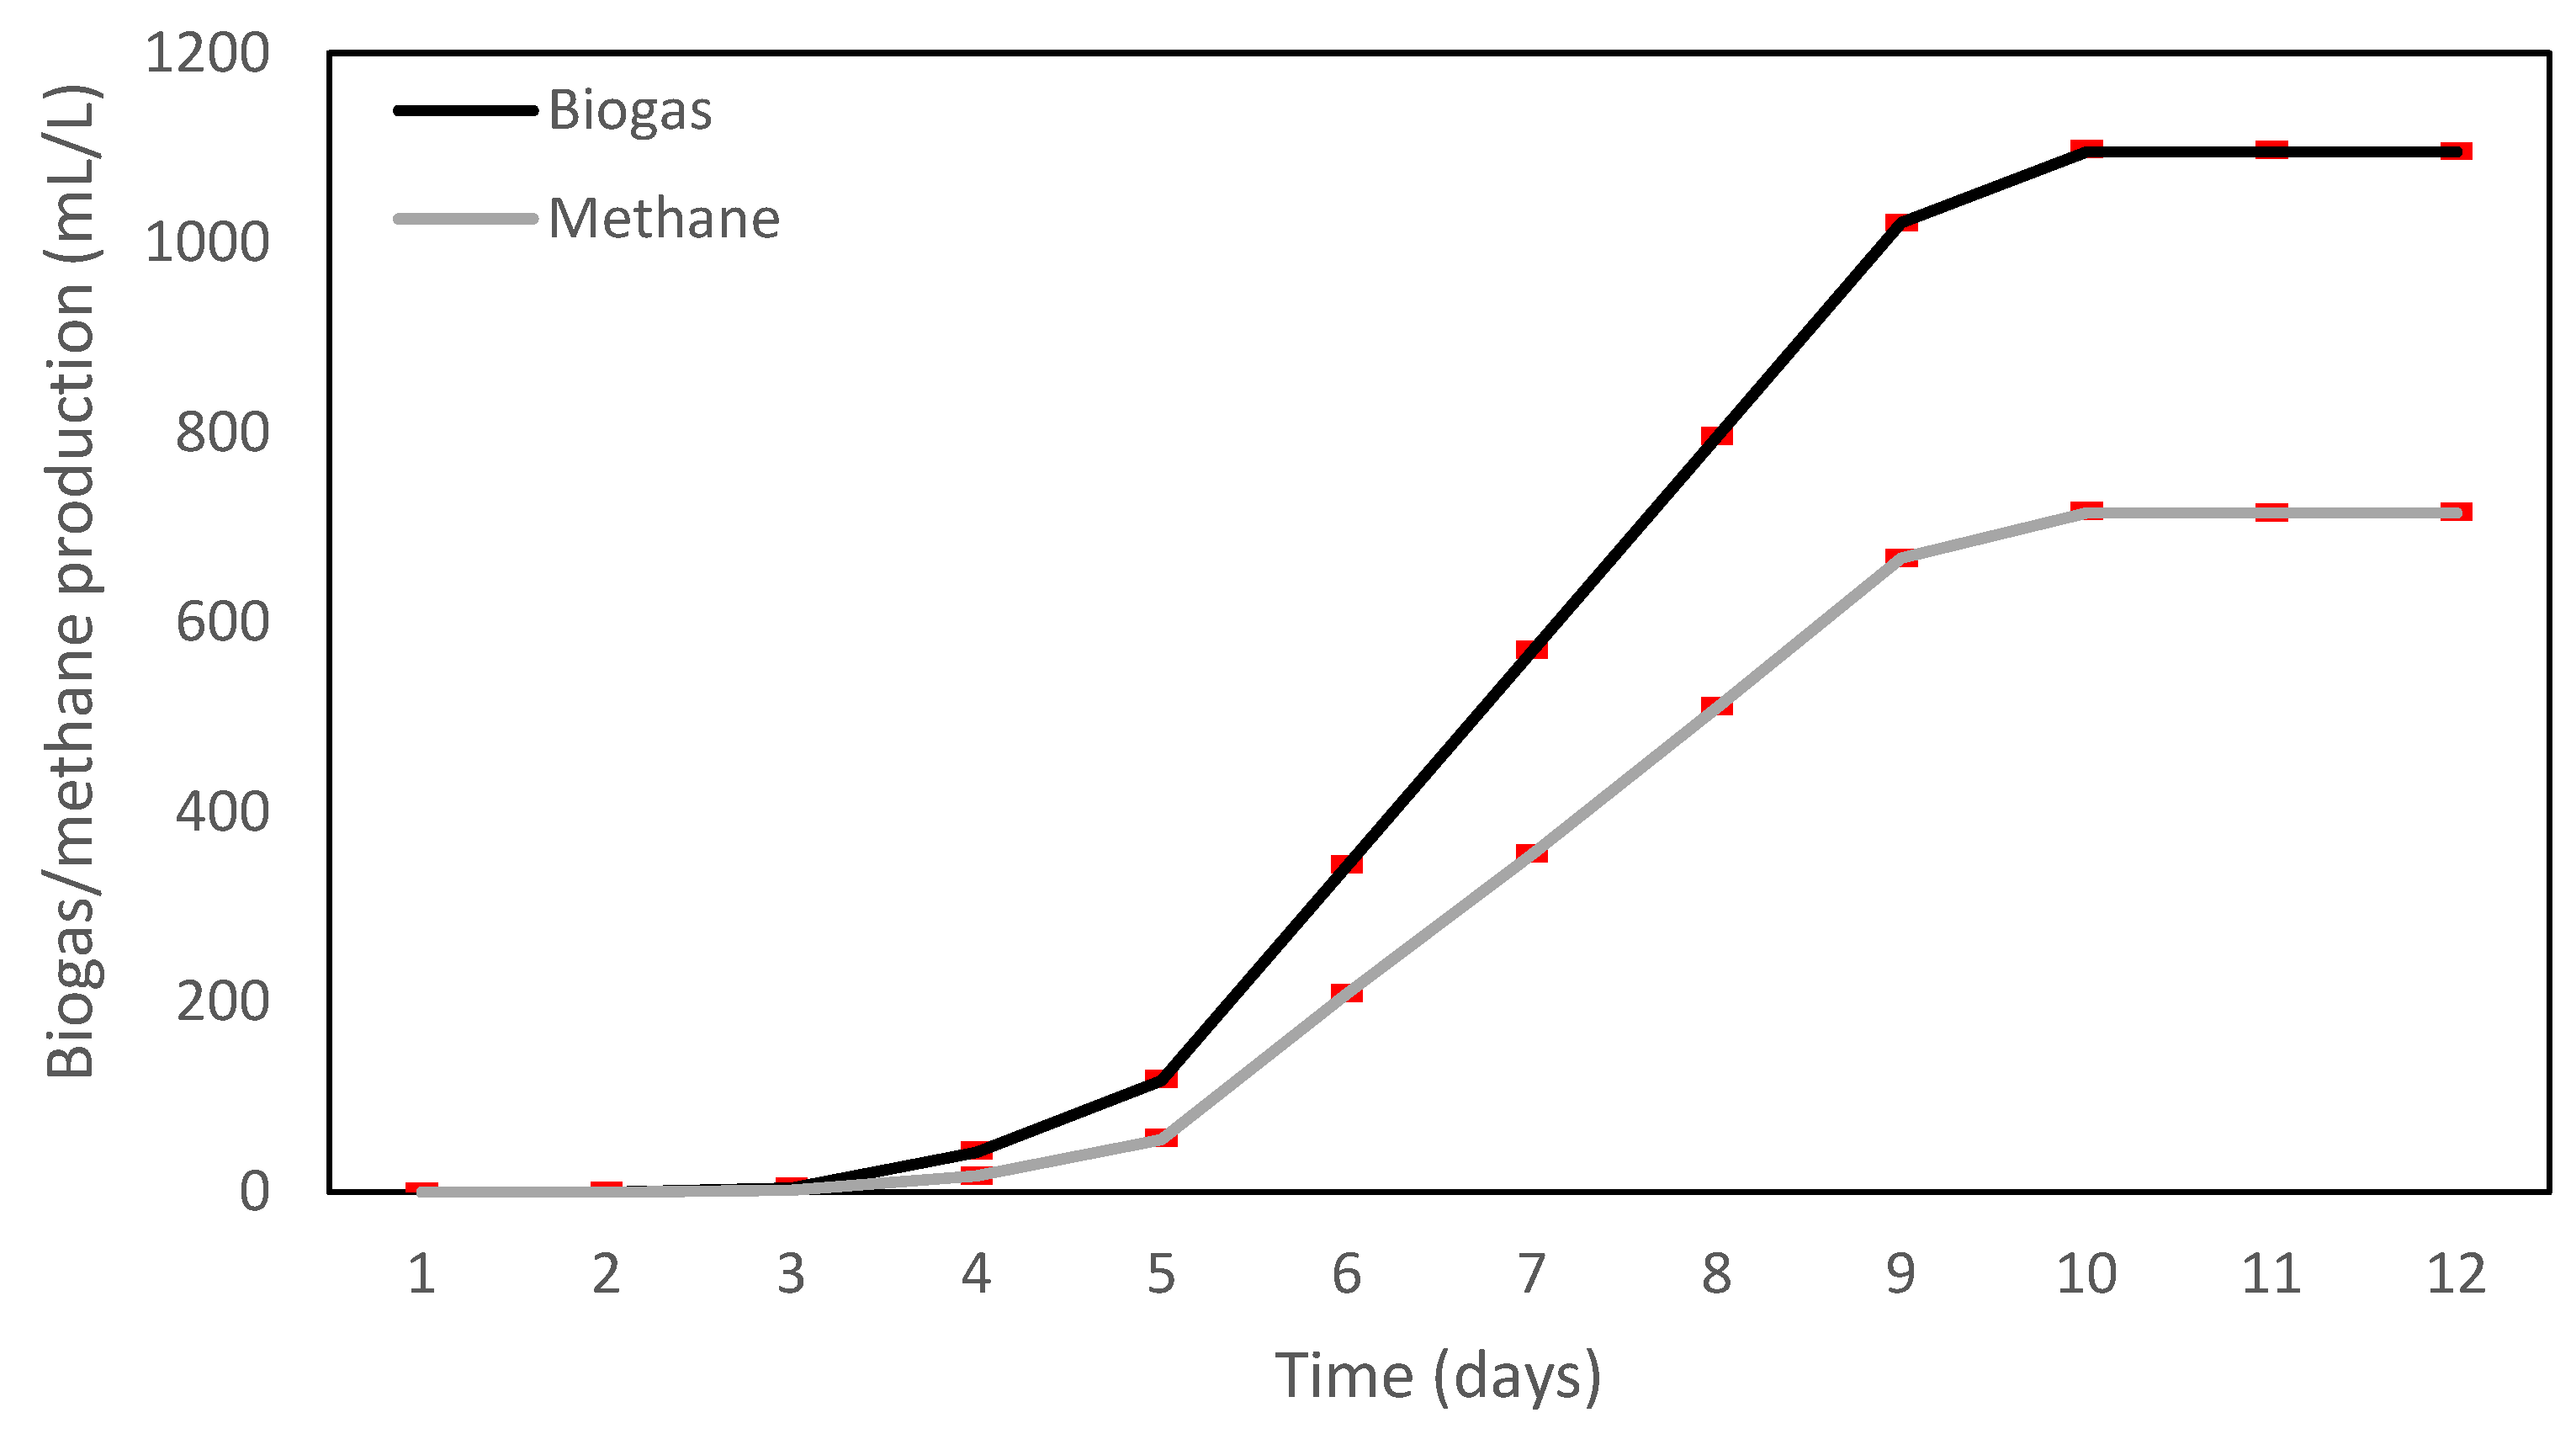
3.2.1. Tomato Pomace and Olive Cake Mixture (TP-OC)

Biogas production increased linearly until the eighth day when it reached the highest concentration (1341 mg/L), like sample B8 (saccharine sorghum straw, inoculum sewage treatment plant, and batch reactors) presented by de Rossi et al. [34], who show that some samples can reach a plateau of biogas generation, starting on about the sixth day. Since the ninth day, the concentration started to quickly decrease until the final value of 453 mg/L. The methane concentration presents a similar behavior to biogas; the minimum value was obtained on the first day with 166 mg/L, representing a quantity of 37% in the biogas; meanwhile, the remaining 63% corresponded to other gases. According to Dai et al. [22], a percentage of methane between 60 and 70% should be obtained to use the biogas generated. This percentage range was measured during the sixth to the eleventh day in this research. The highest percentage of methane was measured on the ninth day with 70% and an average concentration of 695 mg/L. However, the highest methane concentration was achieved during the eighth day with 918 mg/L (equal to 68% of the biogas). Methane and biogas concentrations for all mixtures can be found in Table A1 and Table A2, respectively.
Figure 2 shows the cumulative biogas and methane production measured in the TP-OC mixture during the first 12 days of the period evaluated. After this period, no biogas generation occurred. It is possible to observe that the production of biogas and methane occurs until the 10th day, when maximum values of 1096 mL/L and 716 mL/L of biogas and methane were obtained, respectively. During the last three days, the behavior of biogas and methane production was similar, stopping the production after the 11th day. The initial methane production obtained was in line with Appels et al. [35], where a significant difference with respect to the first day was observed only at the fifth day. Day five reached a biogas production of about 117 mL/L, with 51% of methane and a cumulative methane value of 55 mL/L. This is due to bacteria needing time to adapt to the new conditions and start their production from the fifth until the tenth day [35].
The work of Castro et al. [19] obtained a biogas production of 0.035 L/day and 0.021 L/day of methane from tomato pomace. Meanwhile, Dhamodharan et al. [2] achieved a biogas production of 0.039 L/day with a hydraulic retention time of eight days also for tomato pomace. This production is lower than the amount obtained by the TP-OC sample in this study, since, at the end of the cycle, a total of 1.09 L/day of biogas with an average of 0.09 L/day was generated. Moreover, the methane production registered a total of 0.72 L/day with an average of 0.06 L/day during the 12 days of the AD process.

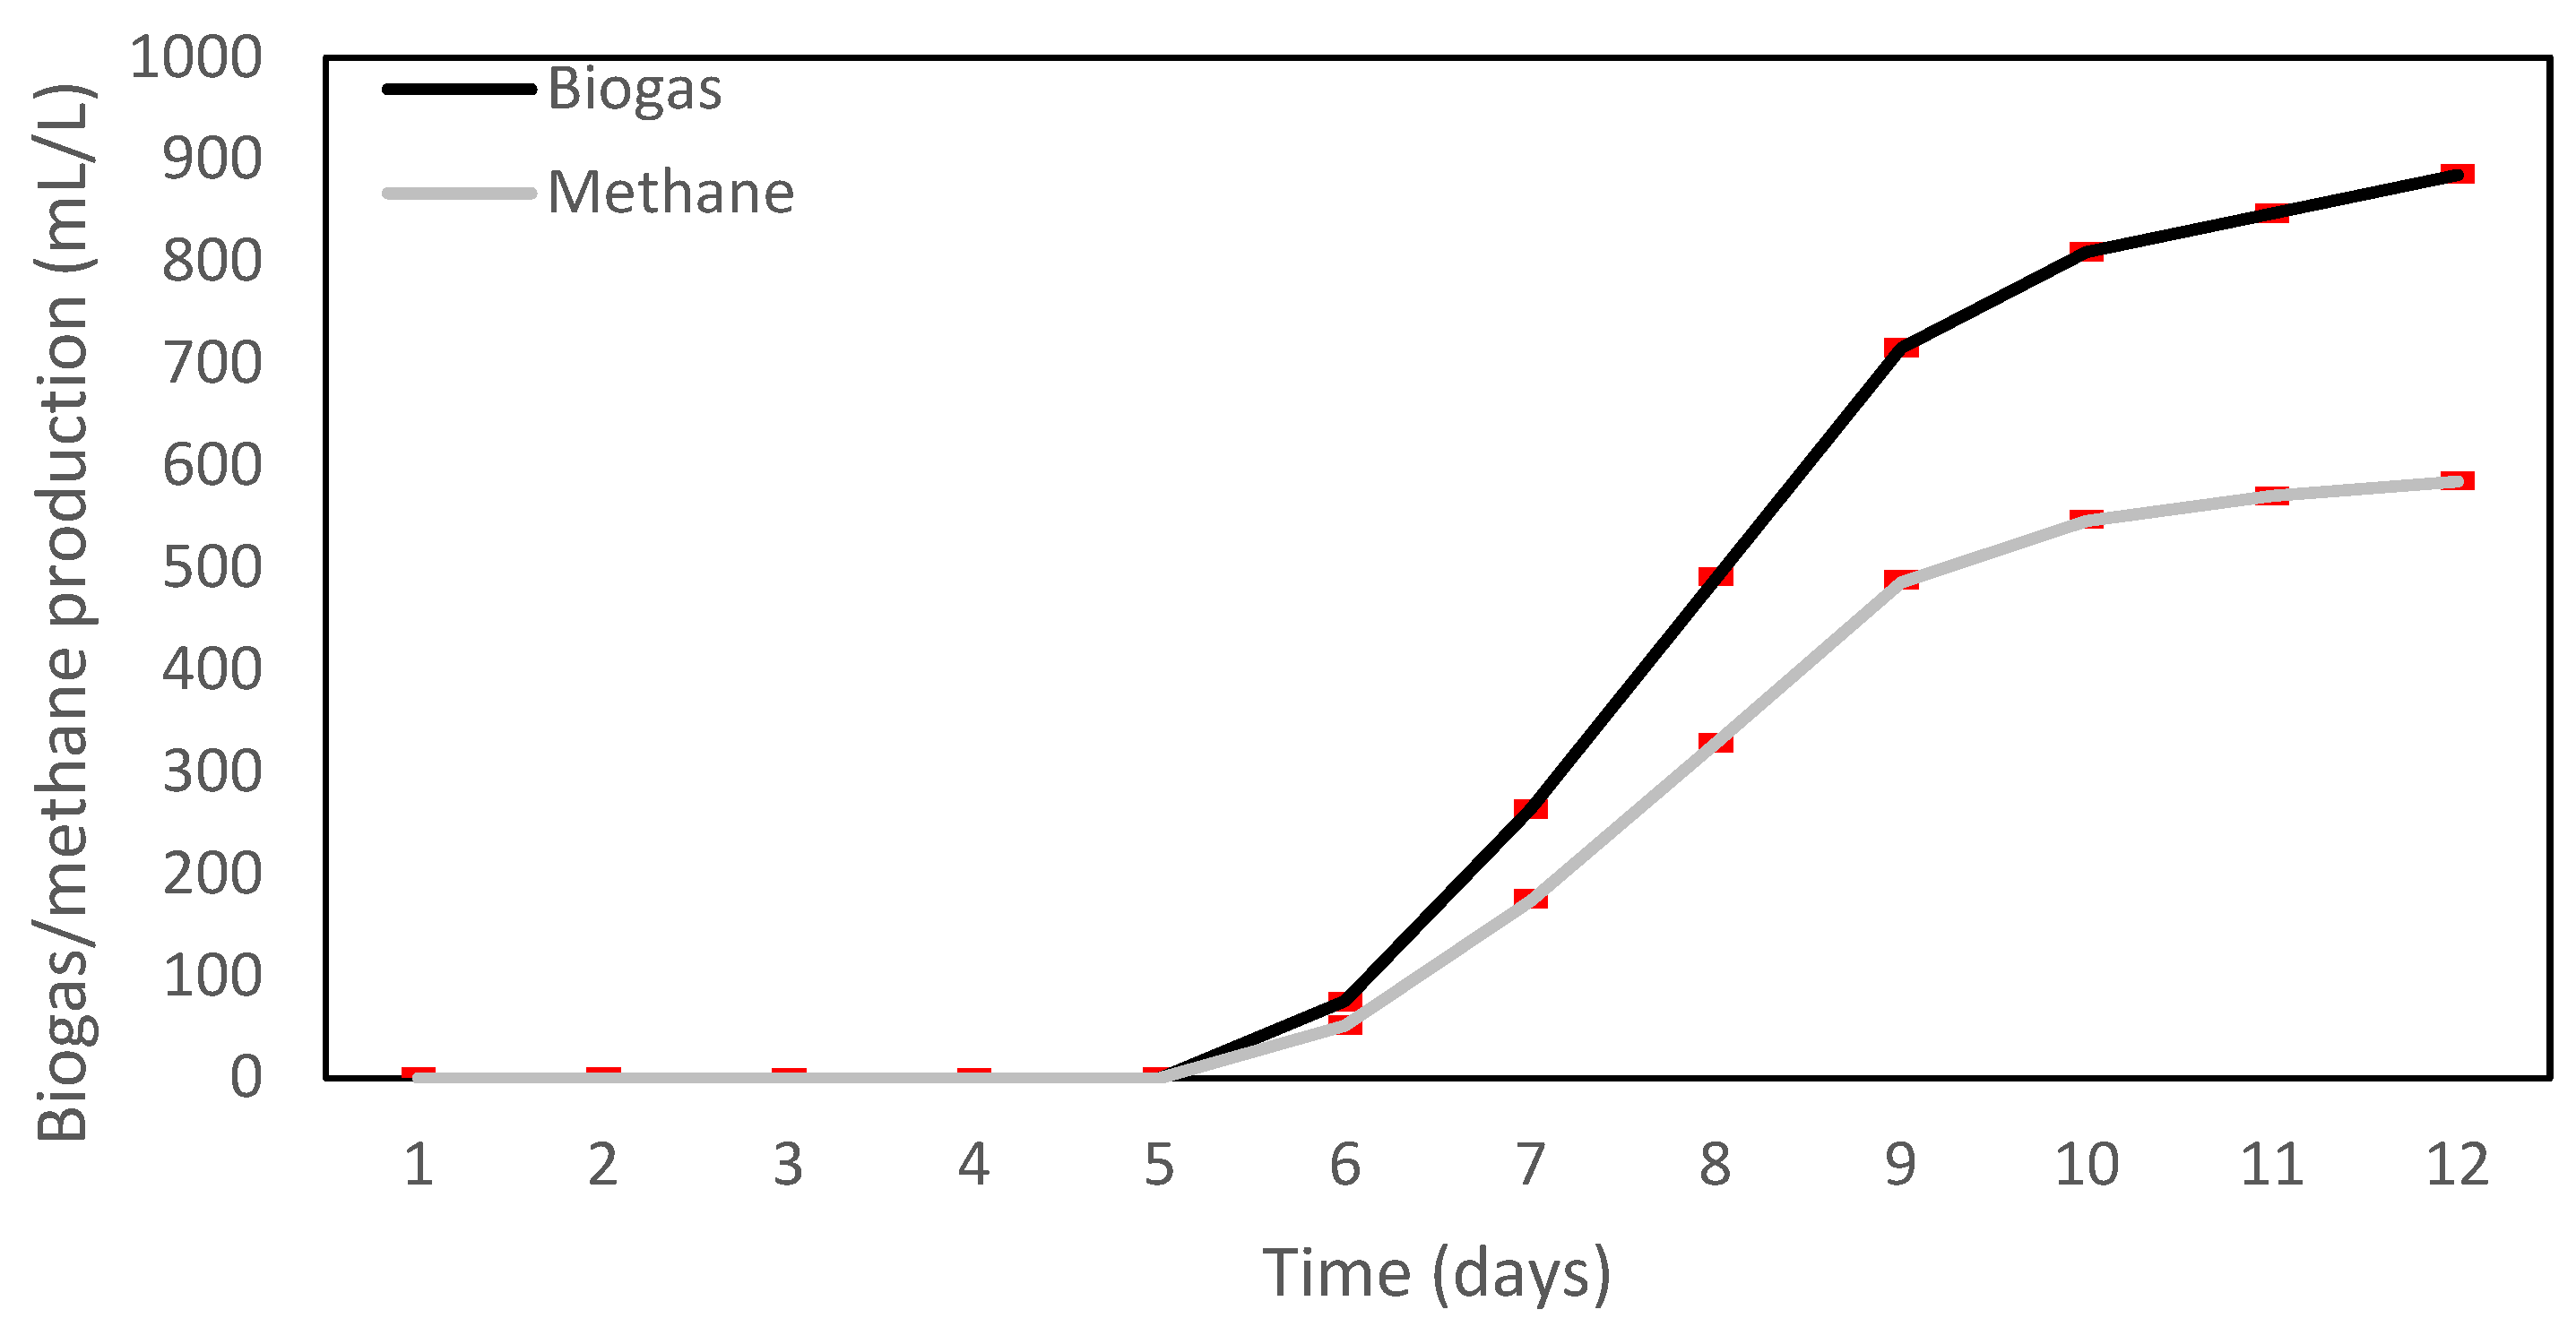
3.2.2. Apple Pomace and Olive Cake Mixture (AP-OC)

The biogas concentration raised linearly until the seventh day, when it reached the highest value with about 937 mg/L generated. From this day, the volume concentration started to decrease slowly, with an initial decrease of 3 mg/L in the eighth day related to the previous one but still higher than the previous six days. For the last day of operation, the concentration was 770 mg/L for this mixture, which is higher than the TP-OC sample (453 mg/L). This means that, in day 12, the AD process had not yet reached the end of its cycle and biogas production would still be produced until the complete reduction of the organic matter.
The average methane concentration in AP-OC measured by the sensor MQ4 on the first day was 105 mg/L, which represents about 22% of the total biogas. On the seventh day, the percentage of methane was under the range of 64–54%, as described by Dai et al. [22]. The measured values for days 7, 8, and 9 were about 62% of methane and the maximum concentration was detected during the seventh day with a value of 584 mg/L. During the end of the AD process, the measured concentration was about 449 mg/L, which is higher than the concentration of the first day. This means that methane production continued in the reactor. However, continuing with the AD process would not be recommended, since the amount of methane in the biogas is 42%, which is out of the range recommended by Dai et al. [22]. Methane and biogas concentrations for all mixtures can be found in Table A1 and Table A2, respectively.
Figure 3 presents the cumulative biogas and methane production during the AD process of the AP-OC sample during the first 12 days of the period evaluated, due to no considerable biogas generation occurring after this period. It was observed that both biogas and methane cumulative production reached their maximum values on the 12th day, meaning that the AD process has not yet come to an end. During the first five days, there was no production of biogas and methane, and the production started during the sixth day, reaching the highest growth during days seven and nine. After that, on the 10th day, the production was slow due to the scarce substrate. In this regard, the biogas and methane production behavior were like the work of Appels et al. [35], with a lag phase until the fifth day, when the material biodegradation starts.
Biogas production from olive mill solid waste performed by Rincón et al. [36] demonstrated that 0.2 L and 0.38 L of methane were obtained during the first five days and at the end of the AD process, respectively. At the beginning of the process, these values were higher than the methane production of this study (0.06 L). However, at the end of the process, the methane production in the TP-OC sample is almost twice (0.72 L) the value obtained by Rincón et al. [36].

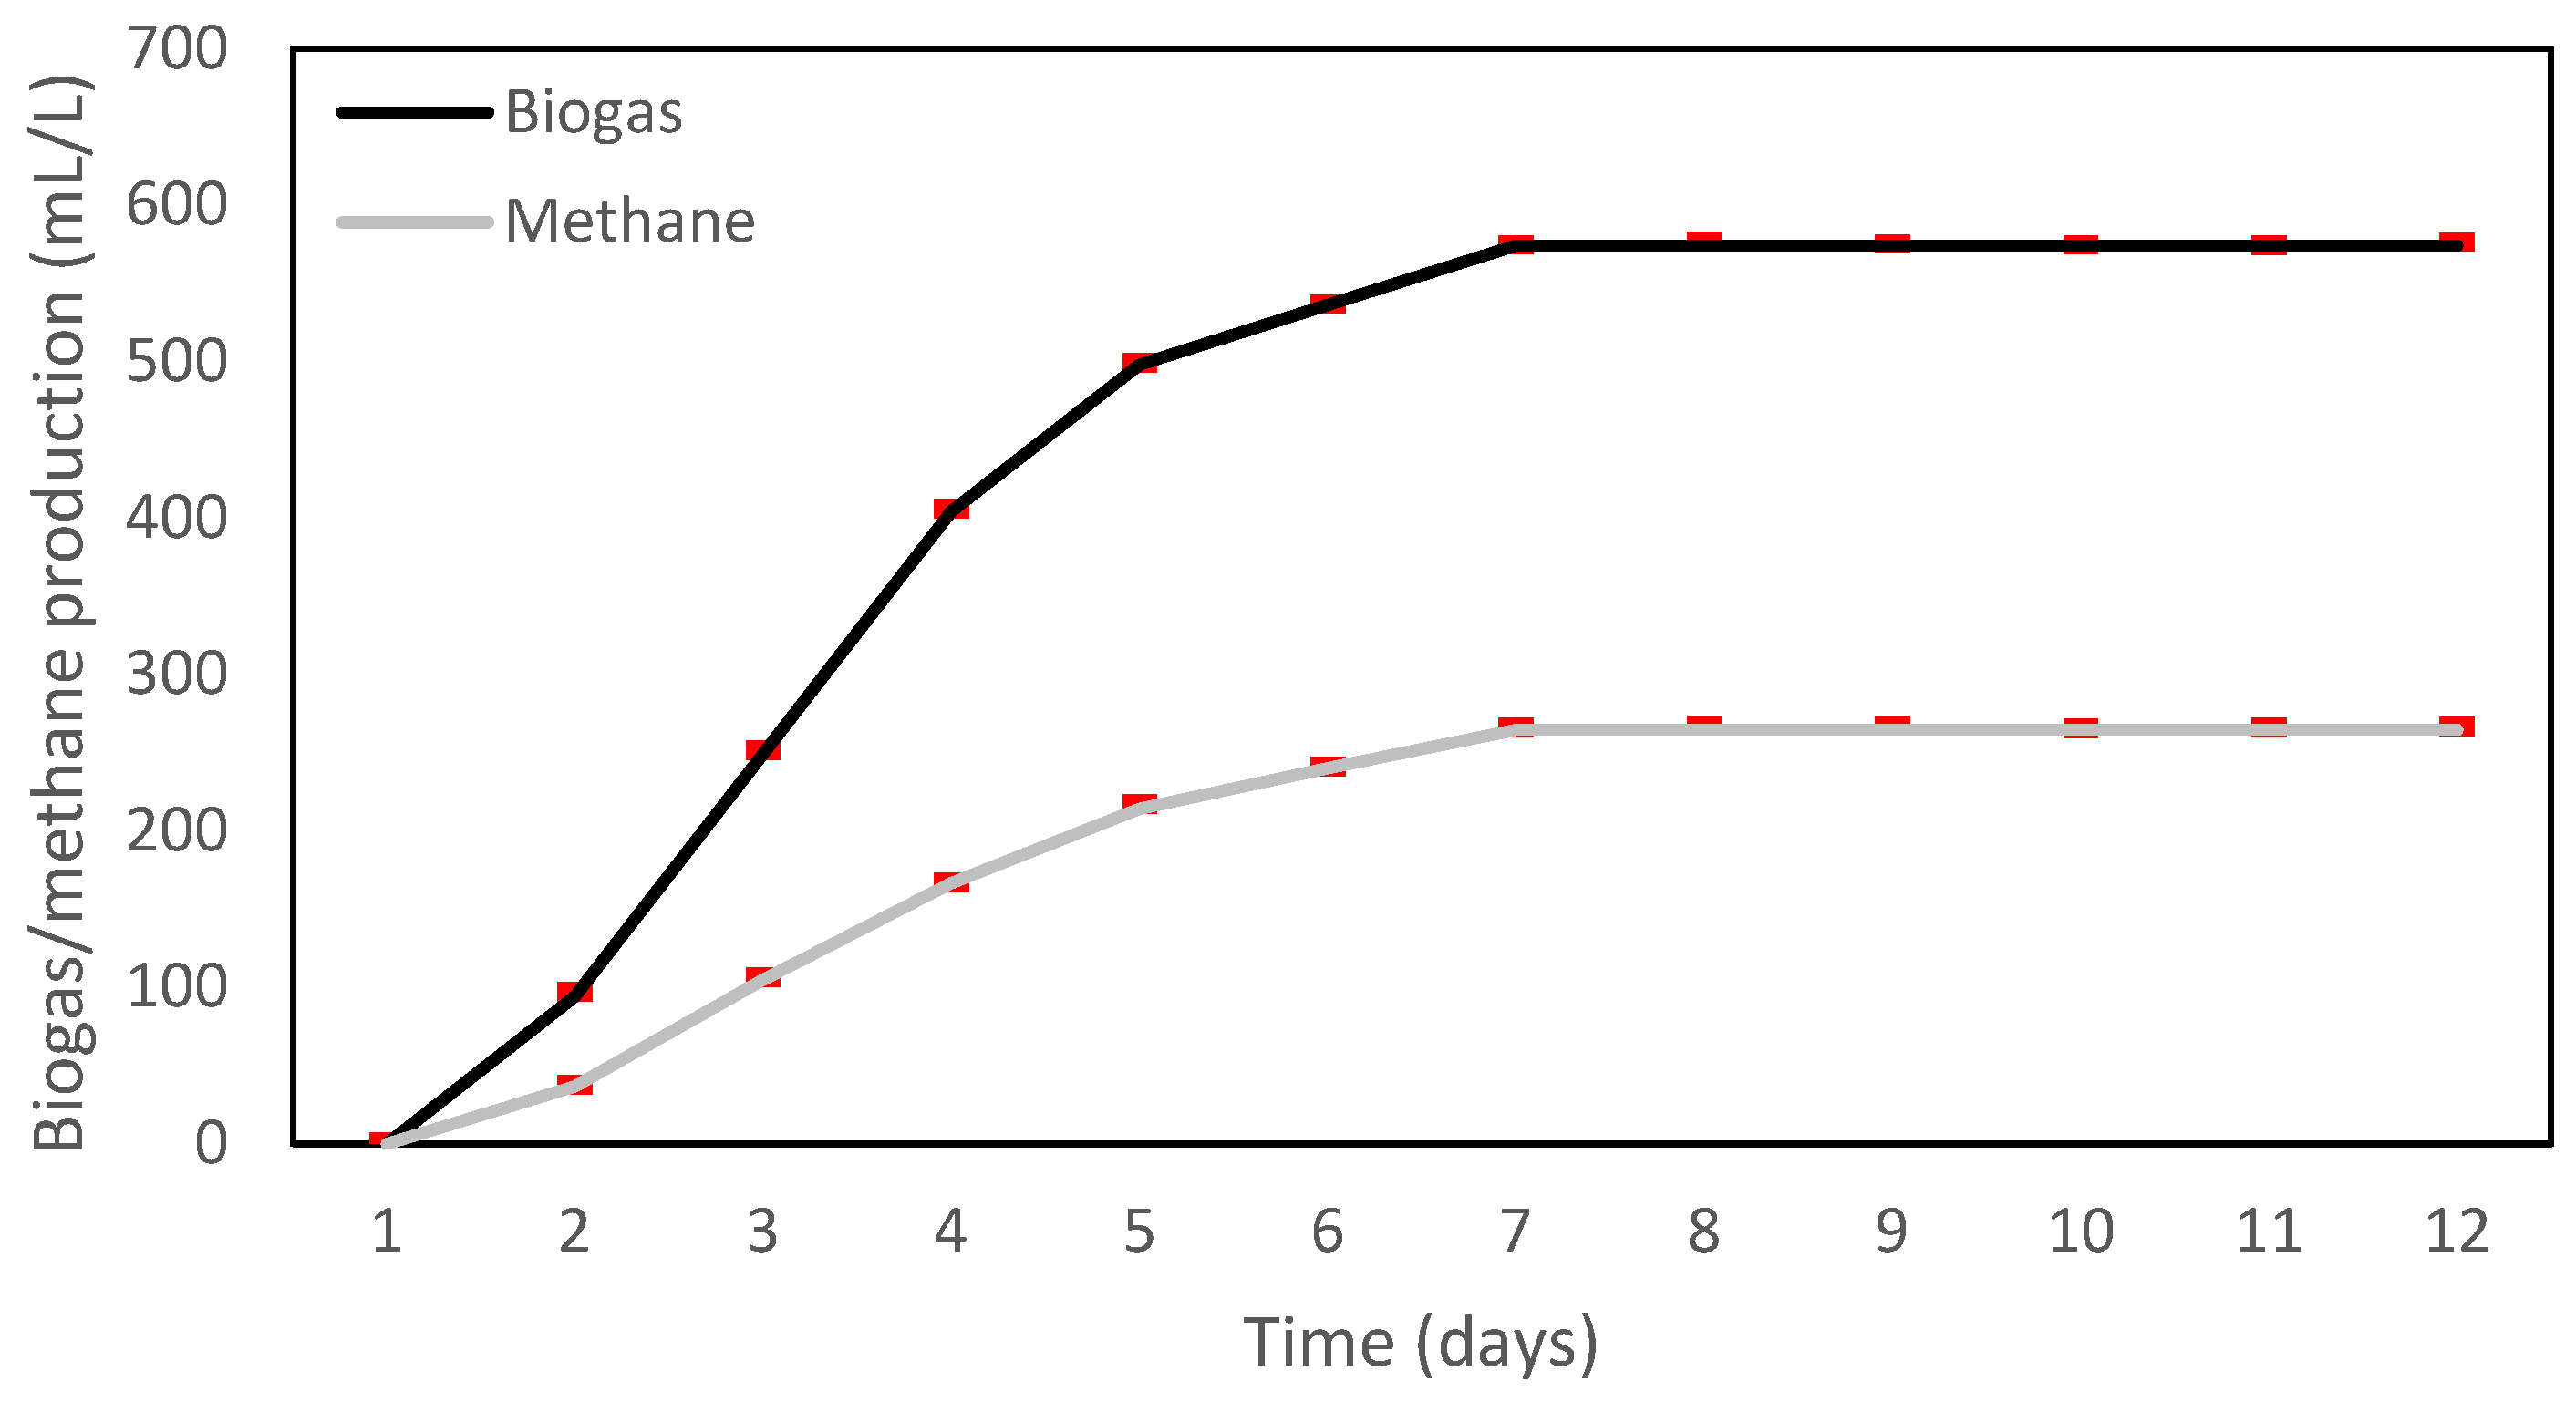
3.2.3. Tomato and Apple Pomace Mixture (TP-AP)

The initial biogas average concentration of this sample was 505 mg/L, reaching the highest value of 653 mg/L during the third day. Then, the concentration decreased to its minimum value (328 mg/L) on the last day. The methane concentration was in line with the value range indicated by Dai et al. [22] for usable biogas. The highest methane concentration was registered during the fifth and sixth days with a value of 69%. Methane and biogas concentrations for all mixtures can be found in Table A1 and Table A2, respectively.
Figure 4 shows the cumulative production of biogas and methane registered in the TP-AP mixture, which present a similar behavior during the first 12 days of the period evaluated. The material biodegraded quickly during the first days of the AD process; however, the production cycle ends early, since the curve stabilized from the seventh day possibly due to the inhibition of the process or lack of organic matter. The maximized cumulative production of biogas was 574 mL/L; meanwhile, in the case of methane, it was 265 mL/L.
The methane production based on apple pomace performed by Yu et al. [37] registered a cumulative generation of 200 mL during the first three days of the process, and the production stabilized in this value during the remaining time of the evaluation. In this regard, it is possible to indicate that the production registered with the TP-AP sample was higher with a value of 265 mL at the end of the production cycle (i.e., on the seventh day).
Figure 5 presents the volume variation of the biogas per day in the three samples evaluated. From this, the highest quantity of biogas was generated by the TP-OC and AP-OC samples with a value of about 226 mL/L. However, this maximum value remains during four days in the TP-OC and only two days in the AP-OC sample. The TP-AP sample achieved the lowest yield (155 mL/L) during the third and fourth days, while the total biogas generated by the TP-OC sample was 1096 mL/L, followed by the AP-OC (885 mL/L) and TP-AP (574 mL/L) samples. This last value represents a difference of about 48% and 35% compared to TP-OC and AP-OC, respectively. Biogas and methane concentrations for all mixtures can be found in Table A1 and Table A2, respectively.
The sample TP-AP has the lower amount of total, fixed, and volatile solids, COD, and BOD (see Table 2). These parameters indicate that the mixture has high carbohydrate (65.3 ± 0.01%) and fiber levels (86.7 ± 0.01%), which motivated the fermentation process to occur fast and, as the reactor was not reloaded, the generation of biogas lasted for a shorter period. This situation has been reported by other authors in the literature, attributed to the presence of carbohydrates, which are consumed quickly in an anaerobic process, as well as the formation of volatile fatty acids that produce lower values of pH in the reactor and toxic conditions [38]. This motivates the production of biogas from the TP-AP sample to begin on the first day, since the carbohydrates in a fermentation process are quickly converted into biogas, where the fermentation of nonstructural (or soluble) carbohydrates occurs in the first 24 h. After this time, the structural carbohydrates are fermented and, after 48 h, the unfolding of the structural carbohydrates intertwined with lignin occurs [39].
As was mentioned in the methodology section, the CH4 production depends on multiple parameters; the VS is one of them. In this regard, assuming that the methane production can be effective, the final VS value should be reduced concerning the initial characterization, since they are the organic components that, once degraded, convert into methane [40]. Based on Table 4, the quantity of VS decreased in all samples. Thus, it could be confirmed that CH4 production was generated in each one of them. In the TP-OC mixture, the reduction was almost the total amount available (98%). Meanwhile, a decrease of about 96% and 93% of the VS was found in the AP-OC and TP-AP, respectively. These values were higher than those obtained by Castro et al. [19], who determined a reduction of about 52% in the VS from the tomato pomace in an AD process. The difference could be explained by the mixture of the tomato pomace with olive cake and the operative conditions (pH, temperature, material origin, among others).
Regarding the pH parameter, the sample should stabilize at a value close to 7.5. In this way, bacteria can adapt to the environment, consume organic matter, and generate gasses [27]. In this context, all samples reached a pH above 7, confirming the generation of biogas and methane. The reduction in COD and BOD values represents the degradation of organic matter in the samples analyzed [37]. According to Table 4, the COD value decreased in the three mixtures. The highest reduction was obtained in the TP-OC mixture with about 75%, representing the best mixture to generate biogas and CH4 (the highest volume and concentration). Then, AP-OC and TP-AP mixtures decreased by about 44% and 41% in the COD parameter, regarding the initial characterization, respectively. Thus, it was confirmed that the TP-AP mixture obtained the lowest biogas levels of the three mixtures. Concerning the BOD values, the highest reduction was produced in the TP-OC mixture with 75%, distantly followed by AP-OC and TP-AP, both with 25%.
Based on the afore-mentioned, it is possible to indicate that the mixture with the highest biogas production was the TP-OC sample in a hydraulic retention time of 12 days. This mixture obtained a total of 1096 mL/L of biogas with the highest concentration between days six and nine with a quantity of about 226 mL/L per day. Moreover, this mixture generated the highest CH4 production (about 1341 mg/L) during the eighth day of the AD process. The second one was the mixture AP-OC with a biogas and methane concentration of 937 and 584 mg/L on the seventh day, respectively. The TP-AP mixture achieved the lowest concentration with about 653 and 437 mg/L on the third day for biogas and methane, respectively.

3.3. Kinetic Model

The ANOVA (p < 0.05) analysis showed the statistical results related to the experimentation, where differences between F and critic F factors were observed. The F critic factor was about four times higher than the F factor in the ANOVA with respect to the methane produced by the mixtures. Furthermore, the P factor (probability) is above 0.5, which means a great similarity for the CH4 produced by the mixtures, as well as the accumulated productions. Therefore, statistically, it can be corroborated that the percentages of methane produced in relation to biogas were similar, but the TP-OC mixture stands out, producing more than 700 mL of CH4 throughout the experiment. On the other hand, the modified Gompertz model was the kinetic model that could best reproduce the results obtained with an R2 > 0.99, as can be seen in Figure 6. In addition, when observing the accumulated CH4 production from the models with the values obtained during the experimentation work (see Figure 6), their degree of similarity is observed, as well as the highest production that the TP-OC presents with the other mixtures.
Figure 7 presents methane production (mL/L), considering the modified Gompertz predictive model (model with a more tightly fitted R2 to real data). For TP-OC, an R2 of 0.9966 was achieved; λ = 4.98; R m a x = 187.4 mL CH4/L; P m a x = 758.3 mL CH4/L. For AP-OC, an R2 of 0.9992 was reached; λ = 6.03; R m a x = 159.5 mL CH4/L; P m a x = 547.2 mL CH4/L. Meanwhile, for the TP-AP sample, an R2 of 0.9992 was obtained; λ = 1.57; R m a x = 120.3 mL CH4/L; P m a x = 392.3 mL CH4/L. The kinetic fitting performed using the modified Gompertz growth model established that the TP-OC sample would project a maximum cumulative methane production of 758.3 mL/L. Over the 12 days, the model predicts a CH4 volume of 740.09 mL/L, in contrast to the experimental analysis indicating a production of 715.81 mL/L of methane. So, despite having missed methane production until day 12, it is suggested that the organic material in the reactor holds untapped production potential. This difference can be attributed to factors such as latency (λ) in production, interferences in methane generation, the production of contaminating biogas, or nonlinear performance values ( R m a x ). Regarding latency differences (λ), the TP-OC mixture showed methane production starting around day 5, in contrast to the TP-AP mixture, which starts during day 2 (λ = 1.57). The latter, despite starting earlier, also finished its methane production earlier than TP-OC.
With this information, it will be possible to begin projecting and predicting potential variations in waste concentrations as VS changes within the reactor for the optimization of the co-digestion process.

4. Conclusions

This research evaluated biogas production, through an AD process, using mixture samples based on three byproducts from the agroindustry in Chile under a waste-to-energy philosophy. In this regard, this manuscript aims to provide a new strategy of valorization for an industry that generates high levels of byproducts, especially in countries where the production and exportation of food products is a central point of their economy.
The AD process considers a hydraulic retention time of 25 days total, although it is identified that the production of biogas is reached in a shorter period (12 days). Thus, the feasibility of producing biogas from different mixtures in less time than other AD processes reported in the literature that used these feedstocks individually is demonstrated. From the results, the TP-OC sample was the alternative with the highest yield of biogas production (1096 mL/L) between the sixth and ninth day, followed by AP-OC (885 mL/L). The TP-AP sample was the fastest in generating biogas (third day) but reached the lowest yield (155 mL/L).
Furthermore, it would be appropriate to carry out further studies to determine the presence of other gases that could be contaminants of the biogas (e.g., H2S, H2O, H2, among others). In addition, it would also be recommended to evaluate different proportions of the feedstocks used in the mixtures studied here to identify potential yield variations in the generation of biogas. The seasonality of these feedstocks and logistic plans are also relevant to determine the economic viability of this strategy, as well as analyze the amount of nutrients obtained in the digestate that could be another co-product of this system (i.e., bio-fertilizer).
This research provides a solution to reduce and avoid the environmental impacts caused by waste accumulation in the agro-industrial sector but simultaneously provide a strategy in favor of the decarbonization and diversification of the energy sector, which plays a key role in the current climate crisis.

Author Contributions

Conceptualization, D.H.; methodology, D.H., F.P., J.A.-H. and J.D.; software, F.P., J.A.-H. and J.D.; validation, D.H., G.Q. and C.T.; formal analysis, F.P., J.A.-H. and R.R.-L.; investigation, D.H., R.R.-L., F.P., J.A.-H. and J.D.; resources, D.H.; data curation, D.H., F.P., J.A.-H. and G.Q.; writing—original draft preparation, D.H., F.P. and J.A.-H.; writing—review and editing, R.R.-L., J.D., S.G.-G., G.Q. and C.T.; visualization, R.R.-L., S.G.-G., G.Q. and C.T.; supervision, D.H.; project administration, D.H.; funding acquisition, D.H. All authors have read and agreed to the published version of the manuscript.

Funding

This research was funded by the project FONDECYT, Chile (Grant No. 11200398), “Characterization of VOCs, a way to determine the degradation, storage and recovery of agro-industrial waste” and by the project “Transition to sustainable agri-food sector bundling life cycle assessment and ecosystem services approaches” (ALISE) (TED2021-130309B-I00), funded by MCIN/AEI/10.13039/501100011033/ and the European Union NextGenerationEU/PRTR.

Institutional Review Board Statement

Not applicable.

Informed Consent Statement

Not applicable.

Data Availability Statement

Data are contained within the article.

Acknowledgments

González-García, S. belong to the Galician Competitive Research Group (GRC ED431C-2021/37) and to the Cross-disciplinary Research in Environmental Technologies (CRETUS Research Center. ED431E 2018/01).

Conflicts of Interest

The authors declare no conflicts of interest.

Appendix A

Table A1. Biogas generation of TP-OC, AP-OC, and TP-AP mixtures. Standard deviation (SD) values are shown as ±SD.
DayBiogas (mg/L) MinimumBiogas (mg/L) MaximumBiogas (mg/L) Average
TP-OCAP-OCTP-APTP-OCAP-OCTP-APTP-OCAP-OCTP-AP
1432 ± 2.52469 ± 2.97498 ± 1.28454 ± 1.01488 ± 0.16512 ± 1.99443 ± 0.44479 ± 0.35505 ± 2.54
2440 ± 1.29470 ± 0.82554 ± 2.78452 ± 0.78479 ± 1.71569 ± 2.89446 ± 1.48475 ± 2.27562 ± 0.25
3526 ± 2.38498 ± 1.13645 ± 2.85562 ± 2.48505 ± 1.19661 ± 0.92544 ± 1.08502 ± 2.79653 ± 0.56
4642 ± 2.58488 ± 1.48589 ± 1.48678 ± 0.81502 ± 2.19598 ± 1.33660 ± 0.04495 ± 0.19594 ± 2.87
5878 ± 0.96656 ± 1.04476 ± 0.63892 ± 2.59679 ± 0.16487 ± 1.46885 ± 0.63668 ± 0.61482 ± 1.56
6978 ± 2.21867 ± 1.92366 ± 2.44985 ± 2.02871 ± 0.37369 ± 1.03982 ± 2.17869 ± 0.27368 ± 2.95
71297 ± 2.78922 ± 2.35344 ± 2.221356 ± 0.82952 ± 2.79356 ± 1.301327 ± 0.25937 ± 2.09350 ± 0.58
81330 ± 2.13925 ± 1.14357 ± 1.831352 ± 1.20943 ± 2.27372 ± 2.881341 ± 0.59934 ± 0.28365 ± 1.53
9992 ± 0.45917 ± 2.00332 ± 0.42998 ± 0.66932 ± 0.24341 ± 0.97995 ± 1.42925 ± 0.32337 ± 0.58
10622 ± 0.83879 ± 1.51331 ± 2.79650 ± 2.31892 ± 2.13335 ± 1.19636 ± 0.68886 ± 0.48333 ± 1.61
11622 ± 0.22790 ± 2.40328 ± 0.49634 ± 2.53802 ± 2.67336 ± 2.69628 ± 2.11796 ± 2.61332 ± 1.08
12438 ± 1.64759 ± 2.48317 ± 0.29468 ± 2.59781 ± 0.80338 ± 2.16453 ± 2.11770 ± 1.29328 ± 2.25
TP-OC: tomato pomace–olive cake; AP-OC: apple pomace–olive cake; TP-AP: tomato pomace–apple pomace.
Table A2. Methane concentration of TP-OC, AP-OC, and TP-AP mixtures. Standard deviation (SD) values are shown as ±SD.
DayMethane (mg/L)
Minimum
Methane (mg/L)
Maximum
Methane (mg/L)
Average
Methane (%)Other Gases (%)
TP-OCAP-OCTP-APTP-OCAP-OCTP-APTP-OCAP-OCTP-APTP-OCAP-OCTP-APTP-OCAP-OC TP-AP
1150 ± 2.4698 ± 1.15312 ± 1.15182 ± 1.08112 ± 2.42342 ± 2.00166 ± 0.45105 ± 0.46327 ± 2.6837 ± 0.7022 ± 0.0865 ± 0.0763 ± 0.778 ± 0.4535 ± 0.75
2164 ± 2.35105 ± 0.19376 ± 0.65182 ± 0.36111 ± 0.59391 ± 0.53173 ± 1.57108 ± 1.66384 ± 1.9739 ± 0.2223 ± 0.9568 ± 0.8161 ± 0.477 ± 0.5732 ± 0.81
3230 ± 2.72143 ± 2.82412 ± 1.93249 ± 2.98147 ± 2.64461 ± 2.27240 ± 2.23145 ± 1.34437 ± 2.3144 ± 0.3229 ± 0.1367 ± 0.0156 ± 0.3771 ± 0.9533 ± 0.54
4249 ± 1.43134 ± 0.44401 ± 0.09276 ± 1.72145 ± 1.98411 ± 1.45263 ± 2.3140 ± 1.31406 ± 2.0940 ± 0.8328 ± 0.5468 ± 0.6160 ± 0.7472 ± 0.3732 ± 0.50
5435 ± 0.69230 ± 1.58328 ± 1.96464 ± 2.54252 ± 1.74339 ± 1.00450 ± 2.56241 ± 1.34334 ± 1.4251 ± 0.6436 ± 0.3169 ± 0.1049 ± 0.3964 ± 0.5631 ± 0.38
6689 ± 2.78450 ± 1.89248 ± 0.29645 ± 0.15467 ± 0.92259 ± 1.07667 ± 1.57459 ± 0.01254 ± 2.1168 ± 0.8953 ± 0.5069 ± 0.8632 ± 0.7347 ± 0.2631 ± 0.29
7843 ± 2.81579 ± 0.01225 ± 0.04878 ± 1.14588 ± 2.35239 ± 1.06861 ± 1.13584 ± 0.55232 ± 2.6665 ± 0.5062 ± 0.7766 ± 0.3835 ± 0.0138 ± 0.2834 ± 0.16
8895 ± 1.88571 ± 2.27203 ± 0.50940 ± 2.57581 ± 1.73221 ± 1.10918 ± 0.22576 ± 1.28212 ± 2.3368 ± 0.5262 ± 0.7258 ± 0.2432 ± 0.5338 ± 0.9542 ± 0.15
9688 ± 0.4568 ± 1.94192 ± 0.34702 ± 1.85572 ± 2.99206 ± 1.73695 ± 1.78570 ± 1.57199 ± 2.1970 ± 0.9162 ± 1.0059 ± 0.2930 ± 0.4538 ± 0.8341 ± 0.71
10402 ± 0.54498 ± 2.02147 ± 2.78412 ± 2.69511 ± 1.96163 ± 0.29407 ± 0.53505 ± 0.21155 ± 2.1564 ± 0.9257 ± 0.4347 ± 0.1536 ± 0.9743 ± 0.6853 ± 0.13
11399 ± 2.62449 ± 0.49142 ± 2.77411 ± 2.52461 ± 2.21160 ± 1.92405 ± 0.78455 ± 1.75151 ± 2.6264 ± 0.7557 ± 0.7245 ± 1.0036 ± 0.0743 ± 0.9755 ± 0.64
12162 ± 1.40445 ± 2.81139 ± 0.49180 ± 1.40453 ± 0.39143 ± 1.34171 ± 2.44449 ± 0.22141 ± 1.3738 ± 0.0158 ± 0.4343 ± 0.3262 ± 0.0542 ± 0.2057 ± 0.39
TP-OC: tomato pomace–olive cake; AP-OC: apple pomace–olive cake; TP-AP: tomato pomace–apple pomace.

References

  1. Perussello, C.A.; Zhang, Z.; Marzocchella, A.; Tiwari, B.K. Valorization of Apple Pomace by Extraction of Valuable Compounds. Compr. Rev. Food Sci. Food Saf. 2017, 16, 776–796. [Google Scholar] [CrossRef] [PubMed]
  2. Jiang, Y.; Huang, J.; Luo, W.; Chen, K.; Yu, W.; Zhang, W.; Huang, C.; Yang, J.; Huang, Y. Prediction for odor gas generation from domestic waste based on machine learning. Waste Manag. 2023, 156, 264–271. [Google Scholar] [CrossRef] [PubMed]
  3. Kılmanoğlu, H.; Hoşoğlu, M.İ.; Güneşer, O.; Yüceer, Y.K. Optimization of pretreatment and enzymatic hydrolysis conditions of tomato pomace for production of alcohols and esters by Kluyveromyces marxianus. LWT 2021, 138, 110728. [Google Scholar] [CrossRef]
  4. Lorenzini, M.; Simonato, B.; Slaghenaufi, D.; Ugliano, M.; Zapparoli, G. Assessment of yeasts for apple juice fermentation and production of cider volatile compounds. LWT 2019, 99, 224–230. [Google Scholar] [CrossRef]
  5. Molinos-Senante, M.; Maziotis, A. The Cost of Reducing Municipal Unsorted Solid Waste: Evidence from Municipalities in Chile. Sustainability 2021, 13, 6607. [Google Scholar] [CrossRef]
  6. Dhamodharan, K.; Kumar, V.; Kalamdhad, A.S. Effect of different livestock dungs as inoculum on food waste anaerobic digestion and its kinetics. Bioresour. Technol. 2015, 180, 237–241. [Google Scholar] [CrossRef]
  7. Suhartini, S.; Nurika, I.; Paul, R.; Melville, L. Estimation of Biogas Production and the Emission Savings from Anaerobic Digestion of Fruit-based Agro-industrial Waste and Agricultural crops residues. Bioenergy Res. 2021, 14, 844–859. [Google Scholar] [CrossRef]
  8. Yaashikaa, P.R.; Senthil Kumar, P.; Varjani, S. Valorization of agro-industrial wastes for biorefinery process and circular bioeconomy: A critical review. Bioresour. Technol. 2022, 343, 126126. [Google Scholar] [CrossRef]
  9. Aravani, V.P.; Sun, H.; Yang, Z.; Liu, G.; Wang, W.; Anagnostopoulos, G.; Syriopoulos, G.; Charisiou, N.D.; Goula, M.A.; Kornaros, M.; et al. Agricultural and livestock sector’s residues in Greece & China: Comparative qualitative and quantitative characterization for assessing their potential for biogas production. Renew. Sustain. Energy Rev. 2022, 154, 111821. [Google Scholar] [CrossRef]
  10. Gomez, C. Biogas as an energy option: An overview. In The Biogas Handbook; Woodhead Publishing Limited: Cambridge, UK, 2013; pp. 1–16. [Google Scholar] [CrossRef]
  11. Iriarte, A.; Yáñez, P.; Villalobos, P.; Huenchuleo, C.; Rebolledo-Leiva, R. Carbon footprint of southern hemisphere fruit exported to Europe: The case of Chilean apple to the UK. J. Clean. Prod. 2021, 293, 126118. [Google Scholar] [CrossRef]
  12. Schwartz, M.; Marchant, R.; Kern, W.; Wicha, J. Circular bioeconomy and valorization of waste from the apple processing industry. IDESIA 2022, 40, 95–102. [Google Scholar] [CrossRef]
  13. ODEPA. Boletín de Hortalizas, Junio 2021. Ministerio de Agricultura, Gobierno de Chile. Available online: https://www.odepa.gob.cl/publicaciones/boletines/boletin-de-hortalizas-junio-2021 (accessed on 21 February 2024).
  14. Hernández, D.; Fernández, H.; Rebolledo, R.; Tenreiro., C.; Gabriel, D. Evaluation of sustainable manufacturing of pellets combining wastes from olive oil and forestry industries. Ind. Crops Prod. 2019, 134, 338–346. [Google Scholar] [CrossRef]
  15. Rodríguez-Monroy, C.; Mármol-Acitores, G.; Nilsson-Cifuentes, G. Electricity generation in Chile using non-conventional renewable energy sources—A focus on biomass. Renew. Sustain. Energy Rev. 2018, 81, 937–945. [Google Scholar] [CrossRef]
  16. Scarlat, N.; Dallemand, J.F.; Fahl, F. Biogas: Developments and perspectives in Europe. Renew. Energy 2018, 129, 457–472. [Google Scholar] [CrossRef]
  17. Xu, Y.; Lu, Y.; Zheng, L.; Wang, Z.; Dai, X. Perspective on enhancing the anaerobic digestion of waste activated sludge. J. Hazard. Mater. 2020, 389, 121847. [Google Scholar] [CrossRef] [PubMed]
  18. Alonso-Fariñas, B.; Oliva, A.; Rodríguez-Galán, M.; Esposito, G.; García-Martín, J.F.; Rodríguez-Gutiérrez, G.; Serrano, A.; Fermoso, F. Environmental assessment of olive mill solid waste valorization via anaerobic digestion versus olive pomace oil extraction. Processes 2020, 8, 626. [Google Scholar] [CrossRef]
  19. Castro, R.; Solís, M.; Chicatto, V.; Solís, A. Biogas production through co-digestion of cattle waste and agricultural residues of tomato cultivation (Solanum lycopersicum L.). Rev. Int. Contam. Ambient. 2020, 36, 529–539. [Google Scholar] [CrossRef]
  20. Ampese, L.C.; Ziero, H.D.D.; Velásquez, J.; Sganzerla, W.G.; Martins, G.; Forster-Carneiro, T. Apple pomace management by anaerobic digestion and composting: A life cycle assessment. Biofuels Bioprod. Biorefining 2023, 17, 29–45. [Google Scholar] [CrossRef]
  21. Miller, G.L. Use of Dinitrosalicylic Acid Reagent for Determination of Reducing Sugar. Anal. Chem. 1959, 31, 426–428. [Google Scholar] [CrossRef]
  22. Dai, X.; Li, X.; Zhang, D.; Chen, Y.; Dai, L. Simultaneous enhancement of methane production and methane content in biogas from waste activated sludge and perennial ryegrass anaerobic co-digestion: The effects of pH and C/N ratio. Bioresour. Technol. 2016, 216, 323–330. [Google Scholar] [CrossRef]
  23. Bolen, T.J.; Hasan, M.; Conway, T.; Sanchez, P.; Rahman, A.; Azam, H. Feasibility assessment of biogas production from the anaerobic co-digestion of cheese whey, grease interceptor waste and pulped food waste for WRRF. Energy 2022, 254, 124144. [Google Scholar] [CrossRef]
  24. Parra-Orobio, B.A.; Donoso-Bravo, A.; Torres-Lozada, P. Digestión anaerobia de residuos de alimentos. Predicción de la producción de metano mediante la comparación de modelos cinéticos. Ing. Compet. 2017, 19, 210. [Google Scholar] [CrossRef]
  25. Dennis, A.; Burke, P.E. Dairy Waste Anaerobic Digestion Handbook. In Options for Recovering Beneficial Products from Dairy Manure; Environmental Energy Company: Olympia, WA, USA, 2001; pp. 17–19. Available online: https://www.build-a-biogas-plant.com/PDF/DigesterBiogasHandbook.pdf (accessed on 17 February 2023).
  26. Jeldres, R.I.; Uribe, L.; Cisternas, L.A.; Gutierrez, L.; Leiva, W.H.; Valenzuela, J. The effect of clay minerals on the process of flotation of copper ores—A critical review. Appl. Clay Sci. 2019, 170, 57–69. [Google Scholar] [CrossRef]
  27. Gerardi, M.H. The Microbiology of Anaerobic Digesters; John Wiley & Sons: Hoboken, NJ, USA, 2003. [Google Scholar] [CrossRef]
  28. Luongo, V.; Policastro, G.; Ghimire, A.; Pirozzi, F.; Fabbricino, M. Repeated-Batch Fermentation of Cheese Whey for Semi-Continuous Lactic Acid Production Using Mixed Cultures at Uncontrolled pH. Sustainability 2019, 11, 3330. [Google Scholar] [CrossRef]
  29. Mihelcic, J.R.; Zimmerman, J.B. Environmental Engineering: Fundamentals, Sustainability, Design; John Wiley & Sons: Hoboken, NJ, USA, 2010. [Google Scholar]
  30. Ahmed, E.; Fukuma, N.; Hanada, M.; Nishida, T. Insects as novel ruminant feed and a potential mitigation strategy for methane emissions. Animals 2021, 11, 2648. [Google Scholar] [CrossRef] [PubMed]
  31. Alibardi, L.; Cossu, R. Effects of carbohydrate, protein and lipid content of organic waste on hydrogen production and fermentation products. Waste Manag. 2016, 47, 69–77. [Google Scholar] [CrossRef] [PubMed]
  32. Markou, G.; Angelidaki, I.; Georgakakis, D. Carbohydrate-enriched cyanobacterial biomass as feedstock for bio-methane production through anaerobic digestion. Fuel 2013, 111, 872–879. [Google Scholar] [CrossRef]
  33. Ministerio Secretaría General de la Presidencia, Chile. Decreto 4. Reglamento Para el Manejo de Lodos Generados en Plantas de Tratamiento de Aguas Servidas. Available online: https://www.bcn.cl/leychile/navegar?i=1007456&f=2010-04-26 (accessed on 5 January 2023).
  34. de Rossi, E.; Tavares, M.H.F.; Teleken, J.G.; Cremonez, P.A.; Christ, D.; Gomes, S.D.; Aparecido Bariccatti, R. Production of biogas by microorganisms with saccharine sorghum straw as substrate with or without alkaline and citric pretreatment. Renew. Energy 2022, 197, 617–626. [Google Scholar] [CrossRef]
  35. Appels, L.; Baeyens, J.; Degrève, J.; Dewil, R. Principles and potential of the anaerobic digestion of waste-activated sludge. Prog. Energy Combust. Sci. 2008, 34, 755–781. [Google Scholar] [CrossRef]
  36. Rincon, M.; Rincon, N.; Alvarez, J.M.; Chirinos, I. Biodegradability of prepared food waste under mesophilic and thermophilics conditions using a complete mix anaerobic reactor. Cienc. Ing. Neogranadina 2014, 24, 29. [Google Scholar] [CrossRef]
  37. Yu, H.Q.; Fang, H.H.P. Acidification of mid- and high-strength dairy wastewaters. Water Res. 2001, 35, 3697–3705. [Google Scholar] [CrossRef] [PubMed]
  38. Akbay, H.E.G.; Deniz, F.; Mazmanci, M.A.; Deepanraj, B.; Dizge, N. Investigation of anaerobic degradability and biogas production of the starch and industrial sewage mixtures. Sustain. Energy Technol. Assess. 2022, 52, 102054. [Google Scholar] [CrossRef]
  39. Sánchez-Santillán, P.; Meneses-Mayo, M.; Miranda-Romero, L.A.; Santellano-Estrada, E.; Alarcón-Zúñiga, B. Fribrinolytic activity and gas production by Pleurotus ostreatus-IE8 and Fomes fomentarius—EUM1 in bagasse cane. Rev. MVZ Córdoba 2015, 20, 4907–4916. [Google Scholar] [CrossRef]
  40. Devi, M.K.; Manikandan, S.; Oviyapriya, M.; Selvaraj, M.; Assiri, M.A.; Vickram, S.; Subbaiya, R.; Karmegam, N.; Ravindran, B.; Chang, S.W.; et al. Recent advances in biogas production using Agro-Industrial Waste: A comprehensive review outlook of Techno-Economic analysis. Bioresour. Technol. 2022, 363, 127871. [Google Scholar] [CrossRef]
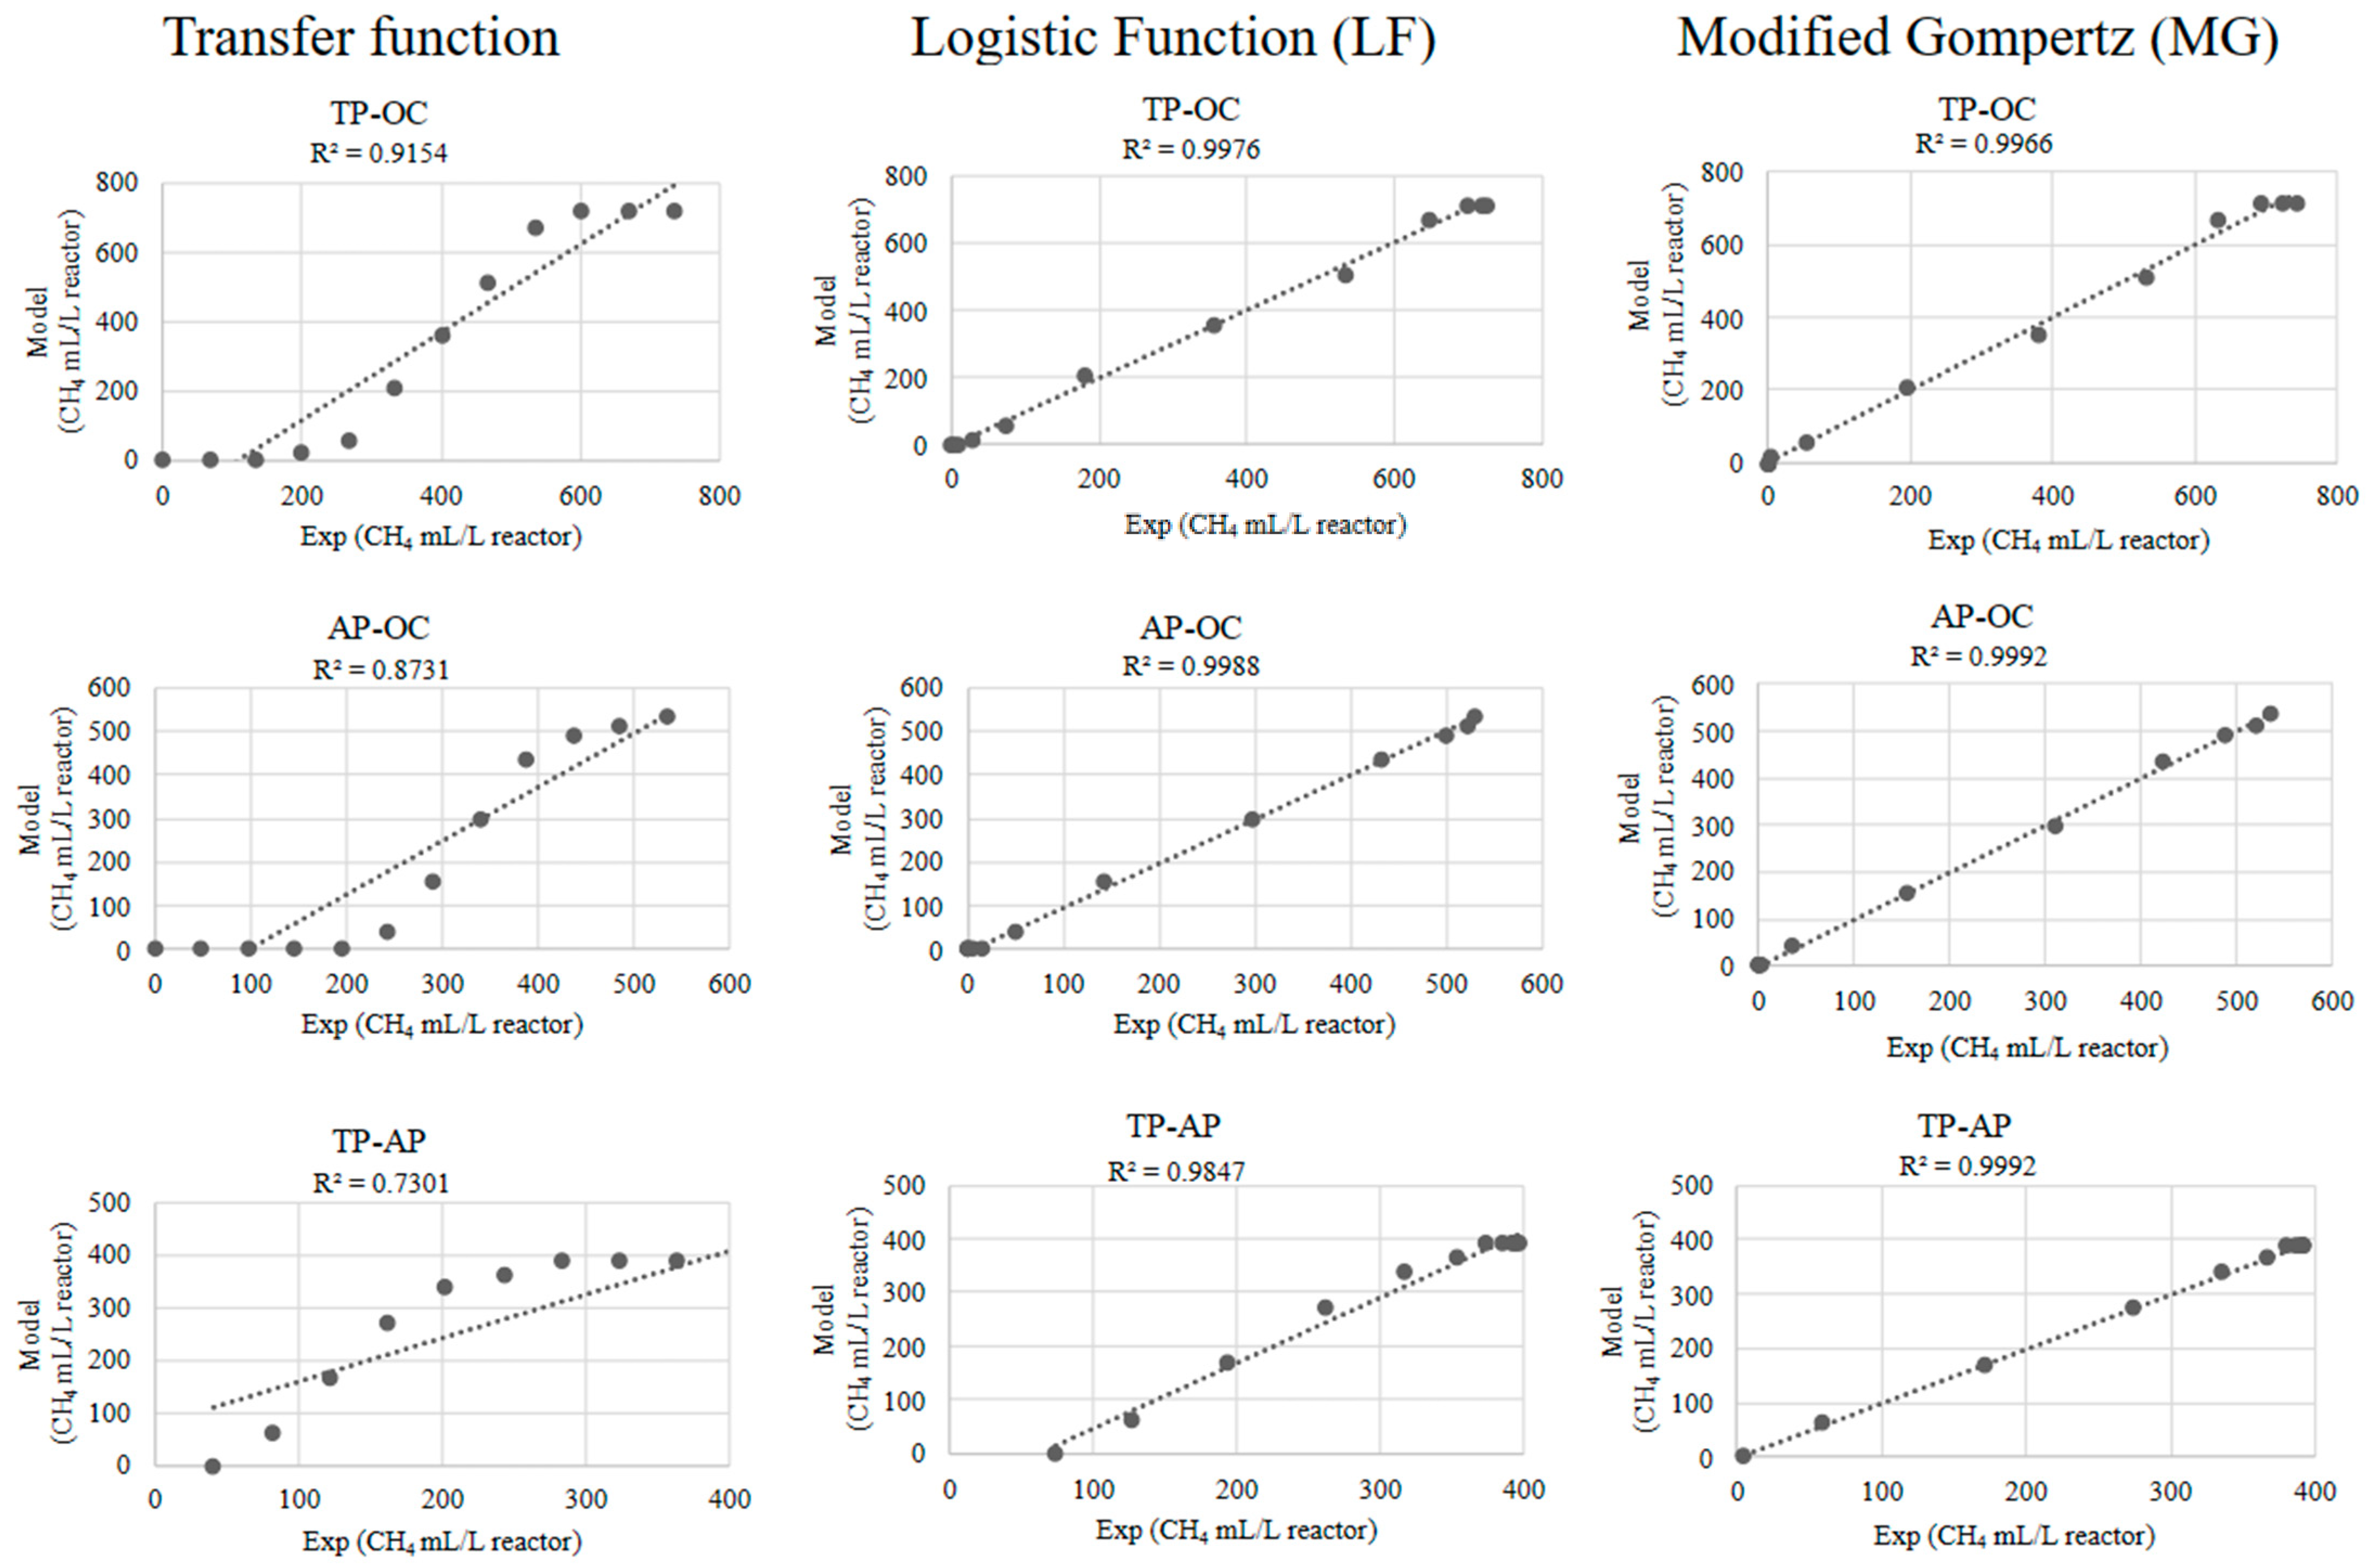
Figure 1. Byproducts collected and used for the production of biogas.
Sustainability 16 02565 g001
Figure 2. Cumulative production of biogas and methane in TP-OC sample (standard deviation in red).
Sustainability 16 02565 g002
Figure 3. Cumulative production of biogas and methane production in the AP-OC sample (standard deviation in red).
Sustainability 16 02565 g003
Figure 4. Cumulative production of biogas and methane in the TP-AP samples (standard deviation in red).
Sustainability 16 02565 g004
Figure 5. Volume of biogas produced per day in the samples (standard deviation in red).
Sustainability 16 02565 g005
Figure 6. Fitting performance of the kinetic models to experimental methane (CH4) production data.
Sustainability 16 02565 g006
Figure 7. Modeled and experimental cumulative methane (CH4) production for the three mixtures. TP-OC: tomato pomace–olive cake; AP-OC: apple pomace–olive cake; TP-AP: tomato pomace–apple pomace. Standard deviation in red.
Sustainability 16 02565 g007
Table 1. Kinetic models tested for describing the methane production from TP-OC, AP-OC, and TP-AP mixtures.
ModelEquation
Transfer function V C H 4 t = P m a x 1 e x p R m a x ( t λ ) P m a x
Logistic Function (LF) V C H 4 t = P m a x 1 + e x p 4 R m a x ( λ t ) P m a x + 2
Modified Gompertz (MG) V C H 4 t = P m a x × e x p e x p R m a x e x p ( 1 ) P m a x λ t + 1
Table 2. Initial physicochemical characterization of the samples. Standard deviation (SD) values are shown as ±SD.
PropertiesUnitTP-OCAP-OCTP-AP
Total Solids (TS)g TS/L 71.7 ± 0.0178.6 ± 0.0150.1 ± 0.02
Total Solids Mass %7.0 ± 0.017.5 ± 0.014.5 ± 0.01
Fixed Solids (FS)g FS/L12.26 ± 0.0311 ± 0.029.43 ± 0.01
Volatile Solids (VS)g VS/L59.5 ± 0.0167.6 ± 0.0340.5 ± 0.01
pHDI4.8 ± 0.024.68 ± 0.024.19 ± 0.02
CODmgO2/L 9670 ± 2.008716 ± 1.008444 ± 1.20
BODmgO2/L 8850 ± 1.507700 ± 1.007350 ± 1.40
Moisture content aMass % 85.58 ± 0.0183.42 ± 0.0158.3 ± 0.01
Proteins bMass %7.62 ± 0.0230.95 ± 0.018.7 ± 0.01
Fats bMass %4.68 ± 0.018.67 ± 0.018.7 ± 0.03
Carbohydrates bMass %25.45 ± 0.0557.1 ± 0.0465.3 ± 0.01
Fiber bMass %52.45 ± 0.0251.75 ± 0.0686.7 ± 0.01
Ashes bMass %2.78 ± 0.023.17 ± 0.011.8 ± 0.01
Calorific value bMJ/kg18.04 ± 0.0121.30 ± 0.0121.92 ± 0.01
Total phenolic content amg/g GAE3.08 ± 0.05234.1 ± 0.0413.23 ± 0.03
a humid base, b dry base.
Table 3. Metal concentration in input samples. Standard deviation (SD) values are shown as ±SD.
PropertiesUnitApple
Pomace
Tomato
Pomace
Olive Cake
Camg/kg3702.00 ± 0.174201.00 ± 0.152232.00 ± 0.20
Mgmg/kg112.00 ± 0.031052.00 ± 0.012054.00 ± 0.01
Cdmg/kg<0.5 <0.5 <0.5
Pbmg/kg<0.5 <0.5 <0.5
Cumg/kg3.95 ± 0.012.95 ± 0.011.35 ± 0.01
Femg/kg0.49 ± 0.01140.49 ± 0.01150.43 ± 0.01
Mnmg/kg0.57 ± 0.01334.24 ± 0.01464.24 ± 0.01
Znmg/kg1.50 ± 0.0121.50 ± 0.0111.50 ± 0.01
Hgmg/kg<0.5 <0.5 <0.5
Asmg/kg<0.5 <0.5 <0.5
Table 4. Physicochemical characterization of the organic waste mixtures at the end of the AD process. Standard deviation (SD) values are shown as ±SD.
PropertiesUnitTP-OCAP-OCTP-AP
Total Solids (TS)g TS/L5.24 ± 0.016.03 ± 0.016.48 ± 0.01
Fixed Solids (FS)g FS/L4.39 ± 0.013.59 ± 0.013.99 ± 0.02
Volatile Solids (VS)g VS/L0.84 ± 0.012.44 ± 0.032.48 ± 0.01
pHDI7.26 ± 0.017.17 ± 0.017.31 ± 0.01
CODmgO2/L2475 ± 1.104850 ± 1.304978 ± 1.00
BODmgO2/L4900 ± 0.905800 ± 1.605500 ± 1.20
BOD/CODDI1.98 ± 0.011.19 ± 0.011.10 ± 0.01
Disclaimer/Publisher’s Note: The statements, opinions and data contained in all publications are solely those of the individual author(s) and contributor(s) and not of MDPI and/or the editor(s). MDPI and/or the editor(s) disclaim responsibility for any injury to people or property resulting from any ideas, methods, instructions or products referred to in the content.

