Article

Application of the Black–Scholes Financial Model to Support Adaptability as a Sustainability Strategy for Buildings: A Case Study of an Adaptable Campus Parking Garage

by
Miranda Reed-Grice
* and
Brandon E. Ross
*
Glenn Department of Civil Engineering, Clemson University, Clemson, SC 29634, USA
*
Authors to whom correspondence should be addressed.
Sustainability 2024, 16(7), 2610; https://doi.org/10.3390/su16072610
Submission received: 9 February 2024 / Revised: 15 March 2024 / Accepted: 17 March 2024 / Published: 22 March 2024
(This article belongs to the Section Sustainable Urban and Rural Development)

Abstract

:
In many construction projects, a “green premium” must be paid to implement sustainable designs that reduce environmental costs. Design for Adaptability (DfA) is a sustainable design philosophy that facilitates incremental renewal and infrastructure adaptation, thereby delaying future demolition and reconstruction. This paper focuses on the potential economic benefits of DfA. Notably, the paper contributes to answering the following question: is the green premium paid for an adaptable design justified by the potential long-term economic benefits? A modified version of the Black–Scholes financial options model is developed and demonstrated to address this question. A hypothetical case study of a parking garage is explored. This case study compares traditional and adaptable three-level parking garages and their potential expansion to a five-level garage at a future time. The “real option value” (i.e., the economic benefit of having the option to expand in the future) is calculated and compared under various assumptions and input parameters. The selection of reasonable model parameters for a given situation and the limitations of the Black–Scholes approach for valuing adaptable buildings are discussed. The model was developed for institutional (i.e., government or university) owners who consider their buildings as a cost of doing business without a direct relationship to revenue. It is concluded from the case study that the option value from the adaptable features of the parking garage exceeds the green premium given certain conditions. The payoff is most sensitive to the green premium, construction costs, and the owner’s inflation value on future additional parking. The work contributes to an economic case for DfA as a sustainability strategy for buildings.

1. Introduction

Construction is essential to society, affecting the societal, economic, and environmental aspects of modern life. The built environment is responsible for roughly 40% of global energy use [1], and there are signs of resource depletion as populations and per capita consumption grows [2]. Approximately 600 million tons of construction and demolition waste (CDW) was produced in the United States in 2018 [3], with most of this waste resulting from demolitions [4]. Furthermore, in 2018, CDW was more than double the municipal solid waste produced [3]. Reducing and slowing CDW flows are current challenges but offer an opportunity for the design, engineering, and construction industry to find solutions.
Circular economy (CE) concepts have recently become of interest as the construction industry rethinks ways to minimize CDW and other environmental impacts. Typical construction follows a “linear economy” in which materials end up as CDW after initial use [5]. In contrast, CE is a “regenerative system in which resource input and waste, emission, and energy leakage are minimized by slowing, closing, and narrowing material and energy loops” [6] and is a means to “eliminate waste of valuable natural materials and reuse materials once the initial design life of a construction project has come to an end” [7]. These ideas differ from the traditional linear thinking of the construction sector, which tends to be more conservative [8] and risk-averse than other industries [9].
A CE in construction guides the industry towards resiliency, contributing to a sustainable built environment for the future. One way of supporting a sustainable CE in the construction sector is to implement design strategies for buildings (and other infrastructure) to be readily adapted to suit future needs; such buildings slow material flows as they are adapted and reused instead of demolished and turned into CDW. However, many adaptable design features come with an increased upfront cost, which can be a barrier to their use [4,10,11,12]. Case studies have calculated that adaptable designs can come at a premium of up to 20–25% over traditional designs [13,14,15].
Although adaptable designs may come at a premium, these designs also open future options to building owners. It is understood in finance and business that there is inherent economic value in having options [16,17]. Despite the cost premium, qualitative surveys have demonstrated that real estate professionals recognize the value of adaptable designs to prepare for uncertainties [18]. Such uncertainties could include, but are not limited to, changing market demands, changes in workplace expectations, technology advancements, and increased occupancy demands. The current paper applies the Black–Scholes option pricing model [19] from the field of finance to evaluate the economic value of adaptable buildings, mainly focused on the option value of having a three-story adaptable parking garage located on a college campus. In doing so, the paper contributes to answering the following questions: How can the real option value of an adaptable design be calculated? Is the premium paid for an adaptable design justified by the potential long-term economic benefits? Toward the larger goal of answering these questions, this paper makes the following specific contributions:
Contribution 1:Develop a model based on the Black–Scholes financial options model (BSM), to determine the real option value of an adaptable building. The model includes the effects of inflation and is suited to conditions where the building’s value is not directly linked to revenue.
Contribution 2:Demonstrate the model through a hypothetical case study of a college campus parking garage expansion project.
Dr. George Hazelrigg [20], past United States National Science Foundation Engineering Design program director and current adjunct professor at George Mason University, presented four possible approaches to frame engineering research. Hazelrigg’s fourth approach is: “The research objective of this project is to apply method Q from field F to solve problem R in field G”. Following this framing, the current paper applies the BSM from the field of finance to solve the problem of valuing adaptable buildings in the field of engineering economics. To do so, this paper presents modifications to the BSM to fit the situation of adaptable building design and uses a case study to demonstrate the model and conduct a sensitivity study to identify key variables.
In developing the model, the authors will also discuss the limitations of the BSM and how these limitations are addressed in the modified option model. It should be recognized that the presented model is intended for long-term owners who view the building as a means of doing business with an indirect impact on revenue, such as higher education institutions and governmental institutions. Institutional owners were selected for this study because of their prominence in the real estate and construction markets. For example, the General Services Administration (GSA) in the United States “owns and leases over 363 million square feet (roughly 33.7 million square meters) of space in 8397 buildings in more than 2200 communities nationwide” [21]. In contrast to the current paper, real options valuation models for owners who can directly link revenue and option value have been presented elsewhere (e.g., Allahaim and Leifer (2010) [22], Elvarsson et al. (2020) [23]).

2. Background

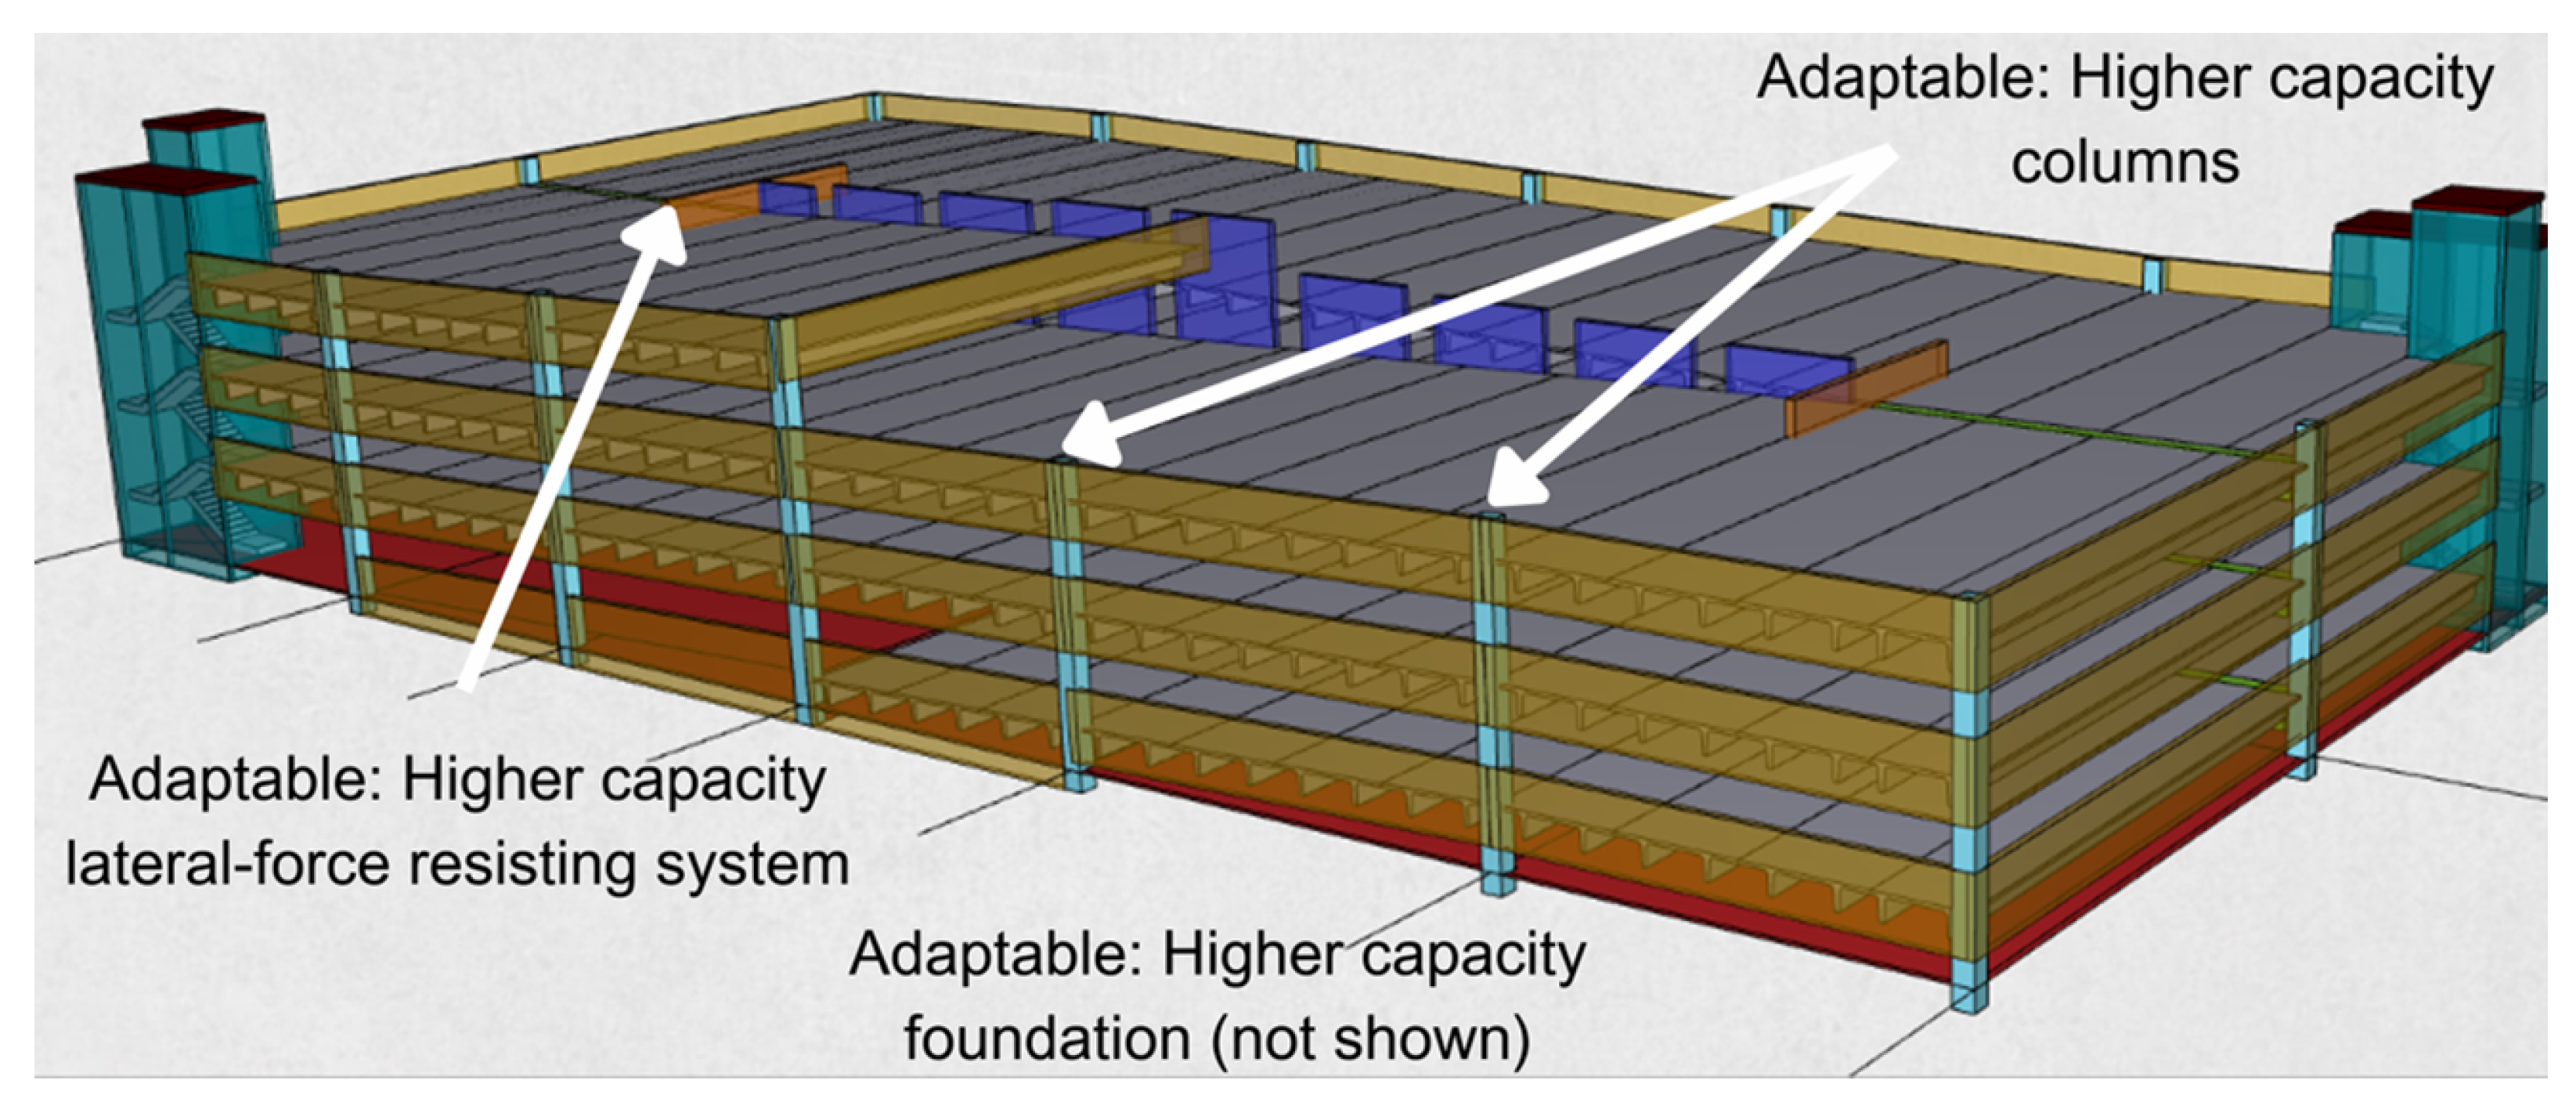
2.1. Design for Adaptability

Design for Adaptability (DfA) is the purposeful design of a building to be easily changed or modified to remain useful despite changes in stakeholders’ needs or technological advances [24]. If a building is difficult to update or change, it is likely to become obsolete and demolished before the end of its intended design life [4,25,26,27]. Building adaptations can contribute to inventories of low-impact materials for future construction [28,29], encourage sustainable design agendas [30,31], and support potential economic drivers [31].
The ability to easily modify or change a building is valuable, particularly when there is high uncertainty regarding the future demand for and uses of a building [4]. It is reasoned that the inherent value of adaptability increases as uncertainty about the future increases. If the future of a system or building were completely predictable, then there would not be a need for adaptable designs [32]. Adaptability has value because owners and occupants are not tied to a fixed building; instead, they can adapt the building to their changing needs.

2.2. Real Options

An “option” in a financial market provides an investor the right, but not the obligation, to buy or sell a stock at a fixed price within a fixed time [33]. A “real option” is distinct from a financial option and is the right, but not the obligation, to undertake a business venture. The options to disband or expand a factory are examples of real options.
“Call” and “put” are two primary types of options. A call option gives the right to buy, whereas a put option gives the right to sell [34]. When a call option expires, the investor has two options. If the asset value is low, the investor will not choose to exercise the option, and the payoff would equal a loss of the initial purchase price of the option contract. If the asset value is high, the investor would exercise the option and choose to purchase the asset for a predetermined strike price. When an investor exercises the option (i.e., purchases the asset for the strike price), then the payoff for the investor is equal to the asset value less the option purchase and strike prices [16].
Options can be structured as “American” options that can be exercised at any time before an expiration date or as “European” options that can only be exercised on a fixed expiration date [34]. In either structure, the time to expiration is critical in calculating the option value.
Real options in business settings can be classified as “on” or “in” projects. “On” projects involve the option to purchase a technical asset or a system at a future time, whereas “in” projects involve the option to change a system at a future time. Structuring an option as an “in” project provides a means of calculating the value of flexibility in a physical asset [35]. The case study presented in the current report is a real option “in” project, as it involves the option of an owner to expand a physical asset (a parking garage).

2.3. Black–Scholes Financial Pricing Model

Different option pricing models have been created [33], with the Black–Scholes model (BSM) being one of the most prominent and straightforward [34]. Although it originated as a means of valuing financial options, the BSM has been applied to fields such as climate change response [36], insurance premiums related to natural disasters [37], industrial systems [38,39], and oil options [40].
The BSM is based on a set of ideal conditions and assumptions listed below [19]:
  • Constant short-term risk-free interest rate;
  • The distribution of stock prices is log-normal and variance is constant (i.e., the stock price follows a “random walk”);
  • No dividends are paid on the stock;
  • Only “European” options are considered; “American” options were not used;
  • No transaction costs are associated with the selling and buying of the stock;
  • Individuals can borrow any amount of the security price to buy or hold it;
  • No penalties for short selling a stock.
Using these assumptions, Black and Scholes derived the following equation for pricing a stock option (Equation (1)).
O V = S N ( d 1 ) X e r t N ( d 2 )
where
d 1 = l n S X + t ( r + σ 2 2 ) σ t
d 2 = d 1 σ t
Terms in Equations (1)–(3) are defined in Table 1.
The advantages and limitations of the BSM for analyzing real options in infrastructure projects were summarized by Martins et al. [41]. The advantage of the BSM is its straightforward calculation; this is a primary reason the BSM was chosen for exploration in the current paper. Limitations of the BSM and approaches for addressing limitations of the BSM are summarized in Table 2.

2.4. Engel, Browning, and Reich (EBR) Model

Engel and Browning [38] and Engel and Reich [39] (from hereon referred to as the EBR model) used a modified version of the BSM to calculate the value of real options in “architecture systems”. Their usage of “architecture” relates to the organization of components in a product (i.e., industrial machines). Like the current paper, EBR was motivated to determine if the premium paid for an upgradeable system is justified by the real option to upgrade in the future. The first term in the EBR model (Equation (4)), S S , is the increase in the component value resulting from the upgrade. The real option value, OV, is the difference between the increased value due to the upgrade and the expected present cost of future upgrades. The variables in Equation (4) are defined in Table 1 in Section 2.3. Calculations of N(d2) are the same in the EBR model as in the BSM.
O V = ( S S ) X e r t N ( d 2 )

2.5. Applications of Real Options to Building Design

The review papers by Martins et al. [41] and Zeng and Zhang [42] summarize applications of real options valuation to civil infrastructure. Specific papers that studied parking garages or used the BSM are summarized in this section; however, applications of real options analysis have been studied beyond parking garages, such as Martello et al’s [43] study of ROA for valuing transit infrastructure.
De Neufville et al. [44] utilized a Monte Carlo simulation (not referred to as such in the paper) and a discounted cash flow analysis to calculate the expected net present value for different parking garage options. The authors created a spreadsheet to perform the calculations and demonstrated it to be easy to use with outputs that designers and decision-makers can readily interpret.
Zhao and Tseng [32] also studied the value of adaptability (“flexibility” in their words) of a parking garage using a trinomial lattice and a Monte Carlo simulation. The authors concluded that adaptable design indeed had value, and failure to consider this value could lead to forgone economic benefits. In other words, ignoring the value of adaptable design could lead to stakeholders rejecting designs that could provide future opportunities.
Elvarrson et al. [23] investigated the real option values of parking garage designs, considering the uncertainty of parking demand and automated vehicle adoption. Their methodology considered design alternatives, switching rules that changed parking to residential occupancy, and sensitivity analyses, among other features. Calculations were probabilistic using Monte Carlo simulations. Consistent with other authors who studied parking garages, they demonstrated that designs with embedded adaptability provide economic benefits over the lifetime of the parking garage.
Pudney et al. [45] applied the BSM to calculate the real option value of designing and contracting mega-infrastructure projects in Australia. They studied whether the upfront cost of front-end engineering (FEE) is worth the option value of having a “shovel-ready” project. The approach allows a government to generate a portfolio of shovel-ready projects for which the option value is greater than or equal to the FEE.

2.6. Distinction and Relationship to Previous Works

Because of the prominence and relative simplicity of the BSM, the current paper investigates its use in calculating the real option value of adaptable building designs. In taking this approach, the authors aim to fill a niche between the expected net present value method of de Neufville et al. [44] and the more computationally and mathematically demanding approaches of Zhao and Tseng [32] and Elvarrson et al. [23]. In doing so, the current paper intends to address the problem identified by Fawcett [46] that “the financial industry employs many high-powered mathematicians [to calculate option values], but there are few working in construction or the environment”. The original BSM was rigorously derived from probability concepts but is straightforward to apply when performing calculations. In addition to the BSM, the current paper also takes cues from the EBR model, specifically the notion of increased value due to upgrade benefits, S S , in place of stock price.
The current paper demonstrates how the effects of construction cost inflation can be accounted for in real options valuations of buildings. Recent trends [47] highlight the importance of considering inflation and its effects on construction projects. As will be shown, inflation can significantly affect real option values; however, there is a dearth of information in the literature on how to account for inflation in real options valuation of civil infrastructure. Additionally, the inclusion of user-defined inflation was added to allow for situations in which the inflation value a building owner places on their building does not match the monetary inflation value.
Previous works were based on a direct link between revenue and parking spots. However, for some owners, such as colleges and universities, the cost of constructing and maintaining infrastructure may be indirectly linked to revenue. Classrooms and parking are required, but tuition may not be specifically tied to buildings and parking spots. Such is the situation for the parking garage case study presented in the current paper. Hence, this paper’s novelty lies in its applicability to institutional owners, its usability for non-finance savvy designers, and its explicit, but separate, consideration of construction cost and owner-defined value inflation.

3. Modified BSM

This section introduces a case study that compares a traditionally designed parking garage and a garage designed for future expansion. Although the traditional parking garage has lower initial construction costs, the advantage of the adaptable parking garage has the option to expand in the future. To explore the economic benefits of the DfA sustainability strategy, the current paper utilizes real options valuation for this case study. From the background discussion, the current paper applies a modified model from the research of Black and Scholes [19] and takes cues from the EBR [38,39] model. A modified BSM is herein developed and demonstrated with the case study.

3.1. Garage Designs

Two different designs are considered for the hypothetical case study located in Clemson, SC, USA: a traditional parking structure and an adaptable parking structure. The designs (Figure 1) are based in part on a paper by Bitter et al. [14], discussions with an experienced precast concrete engineer [48], and discussions with Clemson University parking services [49].
The “traditional” structure is a three-story parking garage that minimizes initial costs. Many of the features that minimize initial costs also make it difficult to adapt or expand in the future, such as lower capacity columns and foundations. The benefit of the traditional garage is a lower initial cost (as compared to an adaptable parking garage); however, the drawback of the traditional garage is that adding more parking levels would require substantial retrofitting or complete demolition and rebuilding.
The “adaptable” structure is also a three-story parking garage; however, it includes features that facilitate expansion to a five-story garage (Figure 1). In particular, the foundations, columns, and lateral force-resisting systems are sized to support two additional parking levels. The benefit of the adaptable parking garage is the lower cost required for future adaptation (as compared to the traditional parking garage); however, the drawback is a higher upfront cost for initial construction. Based on the work by Bitter et al. [14] and discussions with an industry expert [48], the cost premium for the adaptable garage was assumed to be 20% over the traditional parking garage cost. For both designs, each parking level has 100 parking spaces, for a total of 300 spaces for the three-story parking garage and 500 spaces for the five-story garage.
Adaptable designs lend themselves to environmental sustainability in addition to real option values. A complete lifecycle assessment (LCA) of the parking garages is beyond the scope of this paper. However, to demonstrate the impact on sustainability, a simple comparison was performed on the amount of concrete needed for the traditional and adaptable parking garages. Figure 2 illustrates the comparison, with the dark gray color indicating the initial material use, while the light gray indicates additional material used for replacement (in the case of the traditional garage) or expansion (in the case of the adaptable garage). Concrete quantities were estimated based on an existing parking garage in Clemson, South Carolina, USA.
Two points are made regarding Figure 2. First, the initial construction of the adaptable parking garage requires an investment of more material than the traditional garage. In this scenario, the adaptable garage requires roughly 169 m3 more concrete material, which is approximately an 11% premium. This initial investment in materials creates risk if the owner does not pursue future expansion. The second point concerns comparing concrete used in the traditional + replacement versus the adaptable + expansion garage. By choosing the adaptable design and expanding it to five stories, the concrete requirement is 1799 m3 less, or approximately half as much, as the traditional and replacement option. In the traditional option, the initial 1374 m3 of concrete is demolished to make space for the replacement garage; although a comprehensive LCA is recommended, this simple comparison highlights one aspect of the potential environmental benefits of adaptable designs.

3.2. Model Development

The model used in the case study begins with the BSM (Equation (1)). Variables in the current model are defined in Table 3 in Section 3.3. Subscripts A and T are used in some terms to differentiate between adaptable and traditional designs, respectively.
In the case of the original BSM, the value of the asset, S, is the price of the stock that is being purchased. In the current case study, a different approach is needed because the owner is buying additional parking capacity (an expansion to a current asset) instead of a single asset. For this reason, the price is replaced by the term S*, which is the difference between the cost of a five-story and three-story parking garage after adjusting for inflation and the time value of money. Thus, S* is the change in the garage’s value due to exercising the option (i.e., paying for the expansion). This substitution follows from the EBR model, as previously discussed, and results in the following equation:
O V = S N ( d 1 ) X e r t N ( d 2 )
In the BSM calculations, the stock price is a constant value. The modified model, however, allows for the value of the additional parking to increase over time according to a user-defined value inflation rate, i v . Such a variable has not been used in previous models but is included here to account for potential inflation in the value that the owner places on parking spaces that may be added in the future. In most cases, it is recommended that the value inflation rate be set equal to the construction cost inflation rate. Inflation rates are discussed in greater detail in the following paragraphs.
The current model also discounts the future inflated value of the additional parking using the risk-free interest rate, r, taking a cue from the BSM and EBR models. Hence, the adjusted value added, S*, is calculated as follows:
S = ( S 5 o S 3 o ) t e r t
( S 5 o S 3 o ) t = ( S 5 o S 3 T o ) e i v t
Previous papers on the option value of adaptable parking garages (reviewed in Section 2) calculated the value of parking as a function of revenue. For many institutional owners, an asset value may be indirectly tied to revenue; e.g., the value the university places on parking may be indirectly linked to tuition. To estimate the value of parking in this situation, it is noted that at t = 0, the university is willing to purchase parking spaces at the market rate. It is thus reasonable to assume that the value of parking is at least equal to the purchase price of a traditional (not adaptable) garage. Thus, in Equation (7), the value of a five-story traditional garage is equal to the market rate, which can be determined by a construction cost estimator [50].
The “strike price” in the modified BSM is the future price to expand the parking garage. The present value of the strike price can be determined from a construction cost database (e.g., RSMeans Online [50]). Because the strike is paid in the future, it is inflated to time t using an estimated construction cost inflation rate i c . For the adaptable garage, the strike price is calculated as follows:
X A o = S 5 o S 3 T o
X A = X A o e i c t
The strike price for the traditional garage included the cost of demolishing the original three-story parking garage and then rebuilding a five-story garage in its place. The traditional garage’s strike price is calculated as follows:
X T = X T o e i c t
The use of separate owner-defined and construction cost inflation rates is an intentional feature of the modified model. The time frame for parking structures is many decades, and the inflation of construction costs, i c , can have a significant impact on the strike price and option value. The value an owner places on parking may or may not inflate at the same rate as the construction costs; hence, a separate term, i v , is used to inflate parking value. The situation where i v does not equal i c is discussed further in “Scheme 3” in the next section. The risk-free interest rate is also a separate term and is used to bring future strike prices and parking values back to the present. Consistent with the BSM, calculations of the d 1 and d 2 terms in the current model use the value at t = 0 of the asset being purchased. Thus, the equations below use ( S 5 o S 3 T o ), which is the value of two levels of additional parking at t = 0:
d 1 A = ln ( S 5 o S 3 T o X A ) + t ( r + σ 2 2 ) σ t
d 1 T = ln ( S 5 o S 3 T o X T ) + t ( r + σ 2 2 ) σ t
d 2 A = d 1 A σ t
d 2 T = d 1 T σ t
Combining the above equations, the option value of the adaptable and traditional parking garages can be calculated by Equations (15) and (16), respectively.
O V A = S N ( d 1 A ) X A e r t N ( d 2 A )
O V T = S N ( d 1 T ) X T e r t N ( d 2 T )
Both equations have the same form. The key difference in the equations is the value for the strike price, with the traditional parking garage having a larger strike price due to demolition and rebuilding costs. The next sections will discuss the values used in the case study and will introduce the “net payoff ratio”, which can be used to interpret model results.

3.3. Values for Model Parameters

Table 3 defines the model parameters and summarizes the values used in this case study. All values are in US dollars (USD). The construction cost inflation rate was calculated based on historical data over the past 20 years [51]. This inflation rate was taken to be the best fit from an exponential function on the data from years 2002 to 2022, a time frame consistent with the parking data provided. The risk-free interest rate was taken as the July 2022 10-year Treasury Bond rate. The volatility of the asset price is the only volatility considered in the derivation of the original BSM; by analogy, the modified BSM only considers the volatility of parking value. Hence, the modified BSM is conservative because it does not consider other sources of volatility, such as construction costs. The volatility of parking value was taken as the volatility in the number of parking permits for the past 20 years at Clemson University (exempting school year 2020–2021 due to COVID-19 restrictions) [49]. Consistent with the assumptions of the BSM (Table 2), the number of passes had a constant mean and normally distributed random walk for the considered period.
Table 3. Variables used in the modified BSM; all costs taken from RSMeans Online (2022). Monetary values in USD.
VariableDefinitionNotes
S 5 o Cost of the 5-story parking garage at t = 0Taken as USD 8,700,000
S 3 T o Cost of the traditional 3-story parking garage at t = 0Taken as USD 5,100,000
S Adjusted value added through the addition of parking levels (in this example, the addition of 2 parking levels)Equation (6)
S 3 A o Cost of the adaptable 3-story parking garage at t = 0Taken as USD 6,200,000; calculated as 120% of S 3 T o
X A Present value of the price to expand the adaptable parking garage from 3 to 5 storiesEquation (9)
X A o Cost of expanding the adaptable garage from 3 to 5 stories at t = 0. Taken as the cost difference between 5- and 3-story garageEquation (8), taken as USD 3,600,000
X T Present value of the price to demolish the traditional 3-story garage and build a replacement 5-story garageEquation (10)
X T o Cost of demolition of the traditional 3-story parking garage and replacement by a 5-story garage at t = 0Taken as USD 9,300,000
i c Construction cost inflation rateTaken as 2.78%
i v Owner-defined value inflation rateSee discussion in Section 3.2
rAn interest rate under a “no-risk” assumptionTaken as 2.80%, based on the July 2022 US 10-Year Treasury Bond Rate
tTime at which expansion (or demolition and replacement) is undertakenDiscrete times of 5, 10, 15, 20, 25, and 30 years are used
σ Volatility in parking valueTaken as 11.6%
O V A Option value of being able to expand adaptable garage from 3 to 5 storiesEquation (15)
O V T Option value of being able to demolish traditional 3-story garage and replace it with a 5-story garageEquation (16)
O V T Adjusted O V T with the lower-bound value of zeroSee discussion in Section 4.1

3.4. Net Option Values and Net Payoff Ratio

In the case study, the adaptable design is evaluated in comparison to the traditional design. The difference in real option values between the adaptable and traditional garages is the net option value of the adaptable design:
Net option value = O V A O V T
The goal of the case study is to determine if the “green premium” paid to build the adaptable garage is offset by the option value that is generated by the ability to expand in the future at a lower cost. Thus, to determine if the adaptable design is justified, the net option value is compared to the premium paid for the adaptable design. If the ratio of these values is greater than 1.0, then the net value is greater than the premium, and the adaptable design is economically preferable. The net payoff ratio (NPR) is thus calculated as:
Net payoff ratio = O V A O V T S 3 A o S 3 T o
As demonstrated in the next section, Equation (18) is used to determine if the premium paid for an adaptable design is economically justified by its option value, addressing the research question for this paper. The following section will present and interpret the results from the case study.

4. Case Study Results and Discussion

Three different schemes and a sensitivity analysis were used to demonstrate the model and its application to the case study. The inclusion of inflation rates is a novel feature of the model; the schemes demonstrate how different values of i v and i c impact option values. The sensitivity study uses a one-factor-at-a-time approach to compare the impacts of each variable.

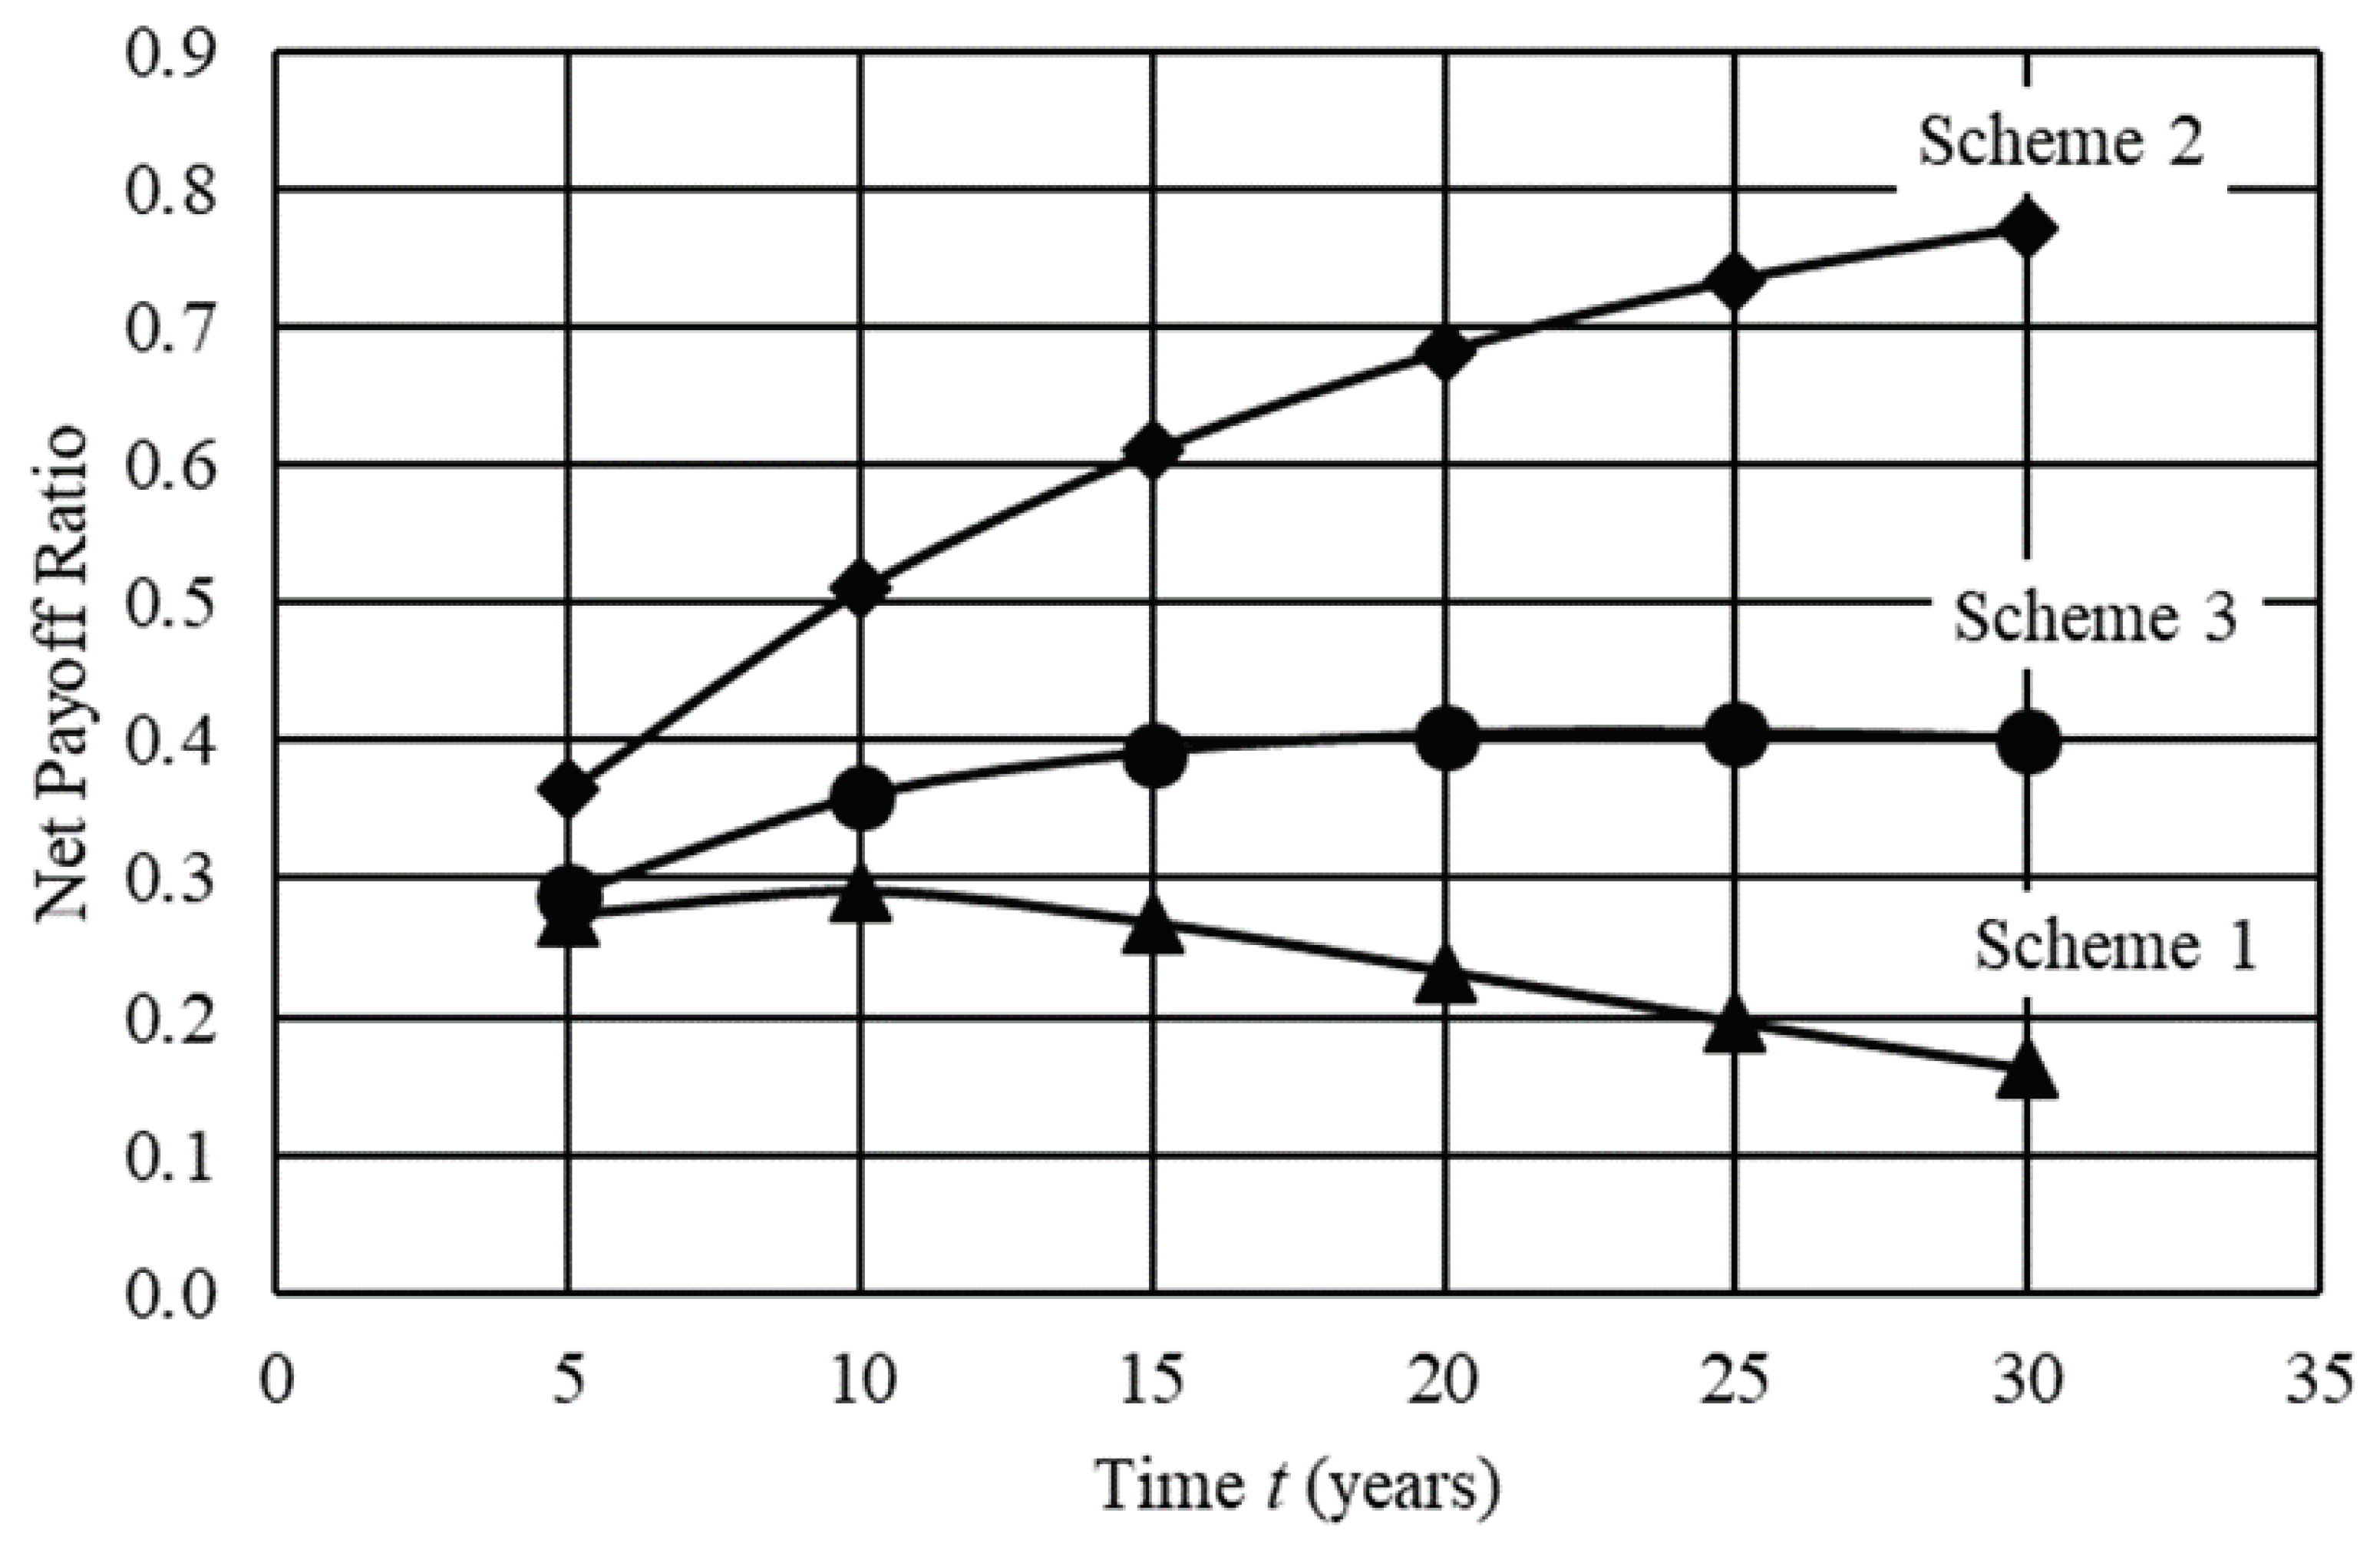
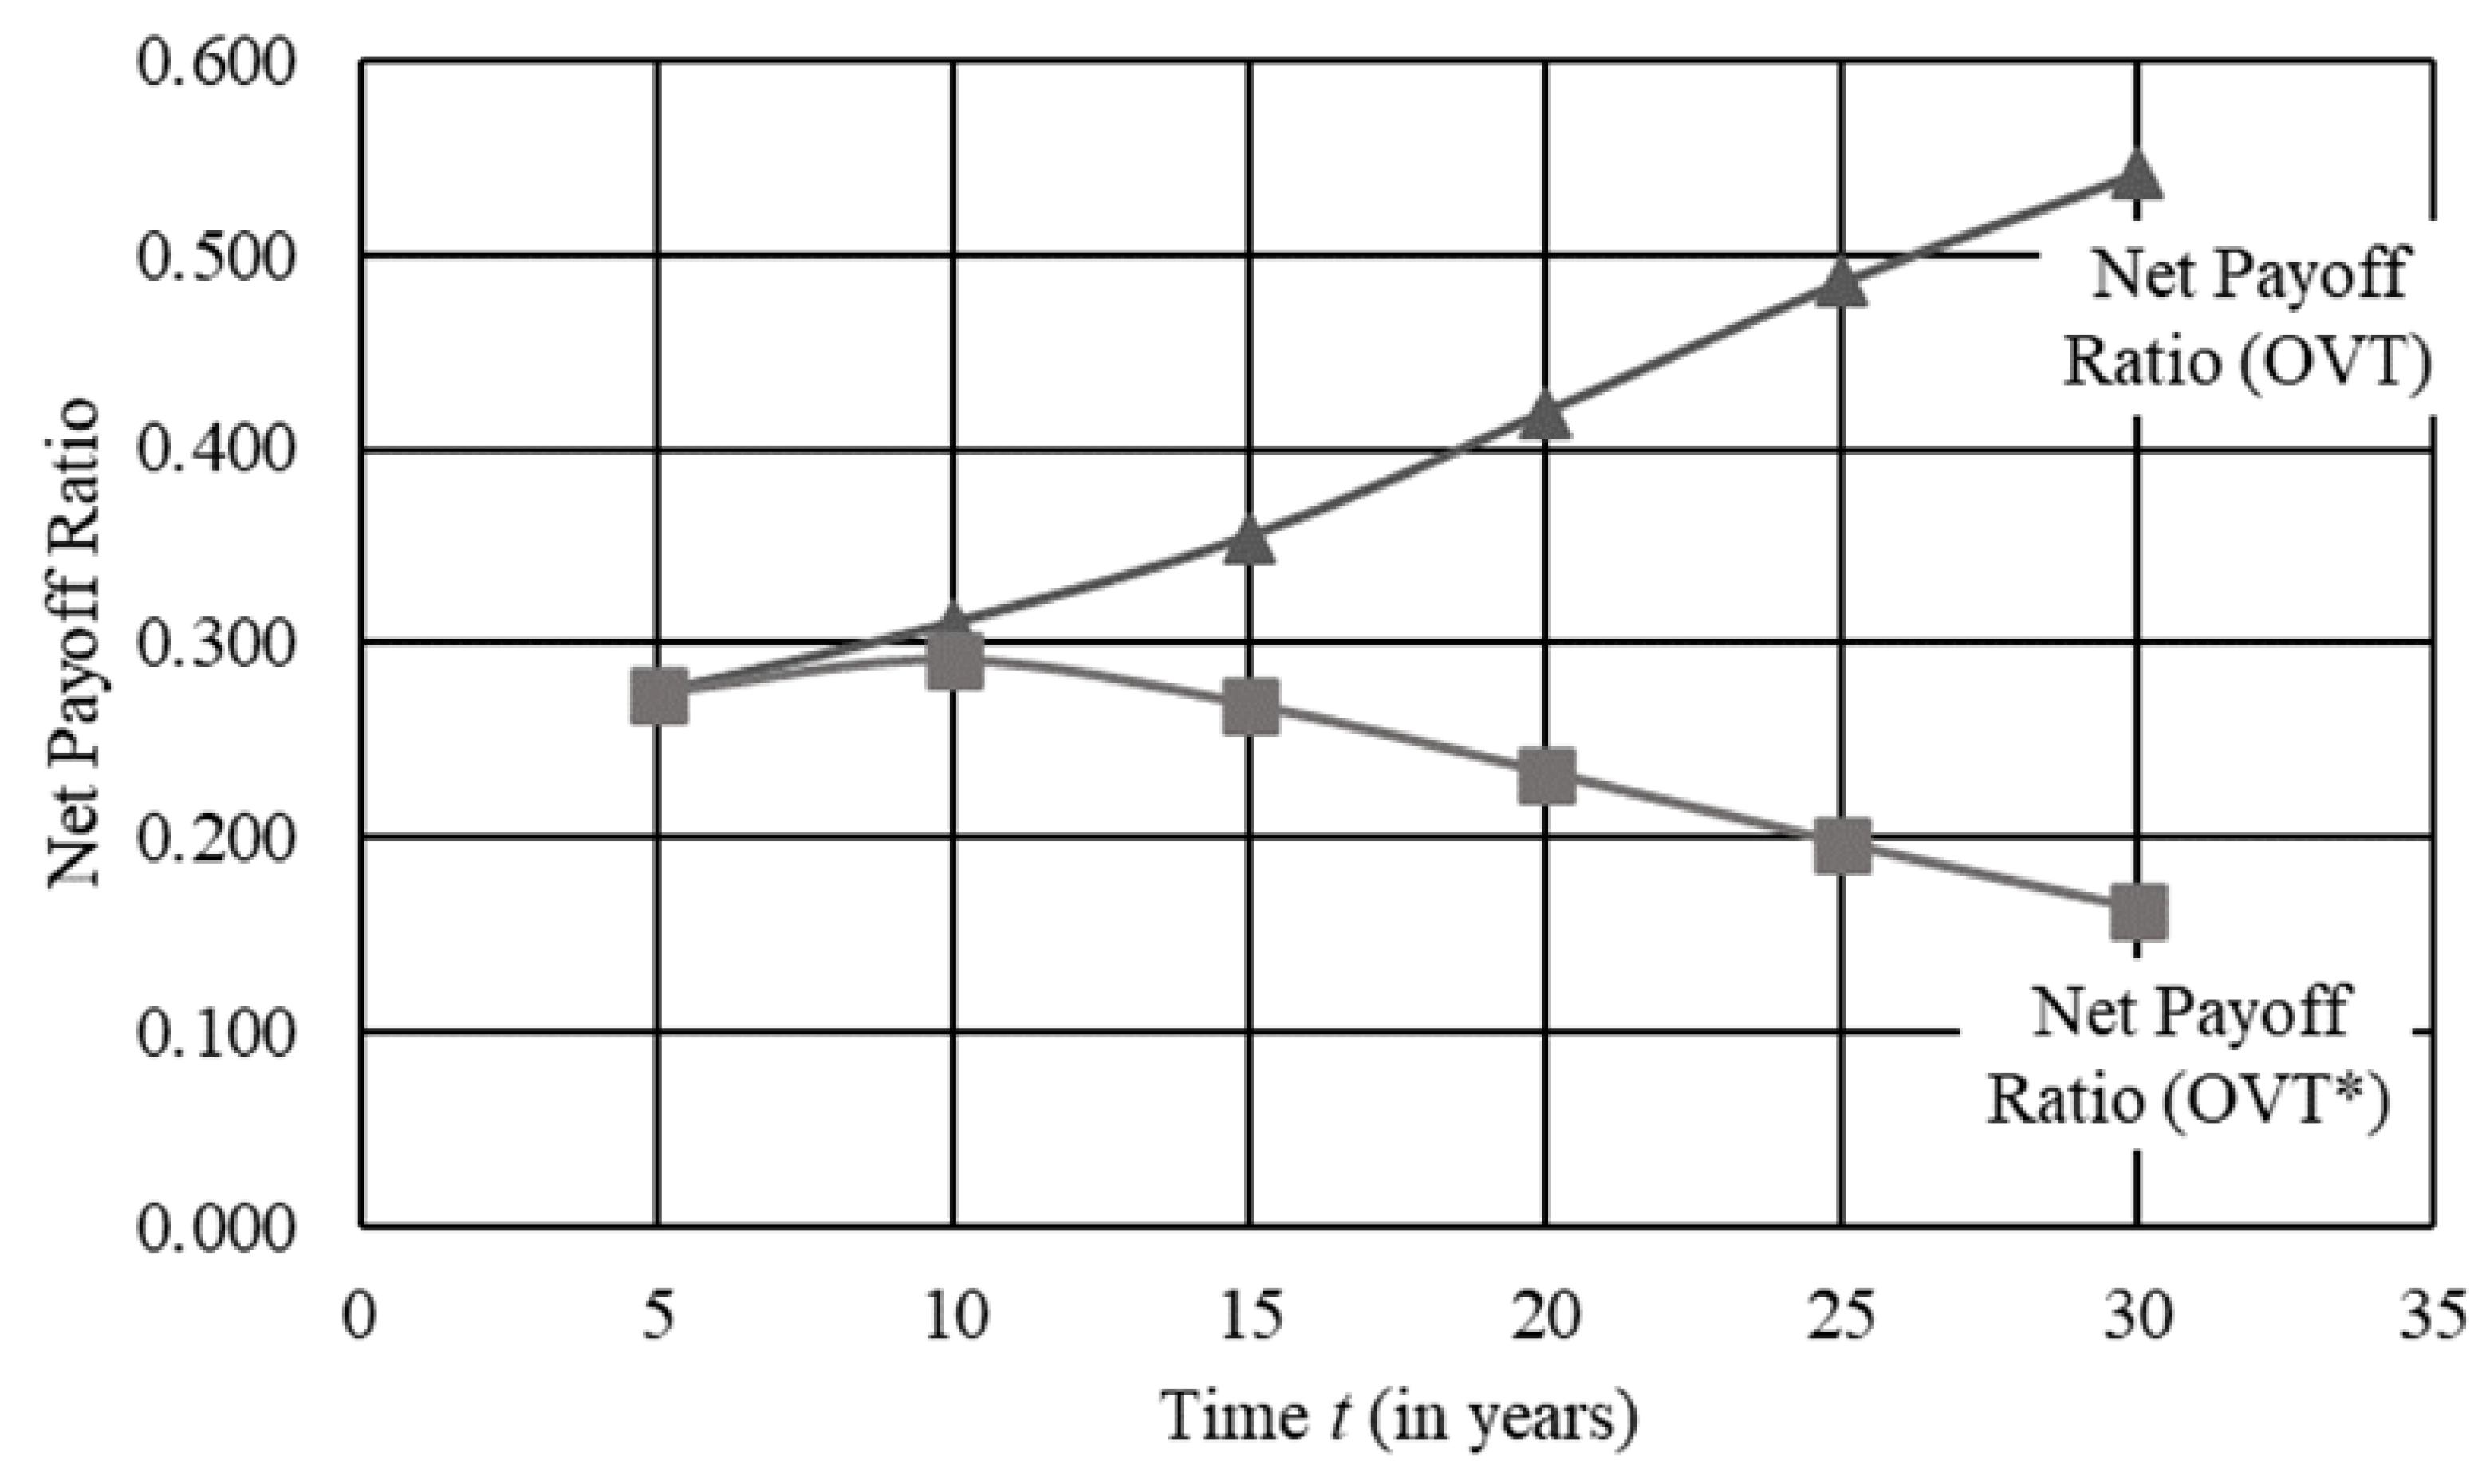
4.1. Scheme 1: No Value Inflation or Construction Cost Inflation ( i v = i c = 0)

For Scheme 1, it is assumed that there is no inflation of construction costs ( i c = 0) or user-defined value ( i v = 0). All other input values for this scheme are as listed in Table 3. Outputs are calculated at discrete 5-year increments, beginning with t = 5 years and ending at t = 30 years. This scheme is unlikely to apply in practical situations and is presented as a benchmark for comparing the impact of inflation on output values. Table 4 lists the option values for the adaptable and traditional parking garages, calculated using Equations (15) and (16). The net payoff ratio, calculated from Equation (18), is also presented.
The option value for the adaptable garage ( O V A ) is always positive, meaning that the options embedded in the adaptable design have positive value for each time considered. In contrast, the option value for the traditional garage ( O V T ) is negative for each year and becomes increasingly negative over time. A negative option value means the cost of demolishing the three-story traditional garage and rebuilding a five-story garage is greater than the additional value that the bigger garage would provide. From an owner’s perspective, this result means they are locked into a parking garage that is too small for their demand, and the cost of demolition and replacement would not generate a positive return. This situation is analogous to a financial option in which the strike price is greater than the value of the asset.
Negative-option values have been observed in finance and indicate that the individual writing the option must pay the option purchaser [52]. Although this situation is mathematically possible, it is impractical because an option seller would not benefit from paying someone to initiate the option. Following the logic used in financial options, a lower-bound option value is introduced. The bounded value, O V T , equals the maximum of O V T and zero. In Scheme 1, the lower bound is realized and the option of demolishing the traditional garage and replacing it with a larger garage has no value. The effect of the lower bound is demonstrated in Figure 3. Scheme 1 is included to highlight the potential of negative OVs; however, this situation is unlikely to occur in practice.
The bounded and unbounded option values were used to generate Figure 4, which shows that the bounded values ( O V T ) produce more conservative NPRs. The case could be made for calculating NPR using the unbounded option values for the traditional garage because NPR is based on the net difference between traditional and adaptable options. In this line of thinking, a negative OV for a traditional garage is meaningful for determining the practical net difference with the adaptable OV. Nevertheless, the authors chose to use the bounded option values for the rest of the schemes, as it is a more conservative approach and is consistent with the BSM.

4.2. Scheme 2: Owner-Defined Value Inflation Equals Construction Cost Inflation ( i v = i c = 2.78%)

All values remain constant from Scheme 1 to Scheme 2 except for the inflation values i v and i c , which are both set to 2.78%, the historical average inflation rate of construction costs between 2002 and 2022 [51]. Setting i v equal to i c assumes that the value an owner gains from additional parking inflates at the same rate as construction costs. Essentially, value inflation is pegged to the inflation of construction costs. This follows the logic discussed in Section 3.2 that an owner who pays to build a parking garage must value parking at least as much as the cost of construction. Values in Scheme 2 are considered the best representation of the circumstances of the case study.
Table 5 lists the outputs for Scheme 2. In this scheme, values for O V A and O V T continually increase with longer expiry periods. This indicates that both the adaptable and the traditional design options hold value to the owner and that the values increase as an owner’s time frame also increases.
Figure 5 shows the NPR for all three schemes. Referring to the figure, the NPRs for Scheme 2 (denoted by diamonds in the graph) are above 0.0 and below 1.0. This means that although the adaptable option holds more value compared to the traditional design option, the initial “green premium” is also less than the net option value. Although not shown in the figure, the NPR for Scheme 2 reaches a plateau around 0.85 circa year 55.
Comparing Schemes 1 and 2 in Figure 5, it is observed that inflation rates have a significant impact on NPR. By considering reasonable values of inflation, the option value at 30 years for the adaptable parking garage changed by 436% relative to Scheme 1 with no inflation. It is possible that an owner may perceive the value received from the expanded garage will inflate faster or slower than construction cost inflation. The next scheme studies such a situation.

4.3. Scheme 3: Owner-Defined Value Inflation Does Not Equal Construction Cost Inflation ( i v  = 2.00%, i c  = 2.78%)

In Scheme 3, the owner-defined value inflation, i v , is 2.00%, which is less than the construction cost inflation rate, i c , of 2.78%. This is representative of an owner who perceives that the value of parking will inflate at a slower rate than the construction costs. This situation would occur when an owner has a modest outlook on how much they will value additional parking in the future.
The results of Scheme 3 are summarized in Table 6. Like Scheme 2, O V T is increasingly positive over greater time periods, and the lower bound of zero was not implemented. O V A is also increasingly positive between years 5 and 25. However, O V A decreases between years 25 and 30. This is because the strike price is inflating faster than the value from the two added levels, making the second half of Equation (15) (the cost paid for upgrading the building) increase faster than the first half.
Comparing the results of Schemes 2 and 3 (Figure 5) demonstrates how a small change in the user-defined inflation can lead to a significant change in the NPR. By changing the i v from 2.78% in Scheme 2 to 2.00% in Scheme 3, the NPR changed by approximately 50% at year 30. Assumptions regarding the value inflation rate, i v , are critical to the results of the option value calculations; careful consideration is required when selecting the user-defined inflation value.
Figure 5. A comparison of the net payoff ratios (Equation (18)) for Scheme 1 (line with triangular points), Scheme 2 (line with diamond points), and Scheme 3 (line with circular points).
Sustainability 16 02610 g005

4.4. Sensitivity Study

A one-factor-at-a-time sensitivity analysis was conducted, considering upper- and lower-bound values of each input variable. The baseline inputs are as listed in Table 3 and i v = 2.78%. For all cost variables, the lower bound was 90% of the baseline and the upper bound was 110% of the baseline. For example, since the baseline initial cost for a three-story parking garage at t = 0 was USD 5,100,000, the lower-bound cost was USD 4,590,000 and the upper-bound cost was USD 5,610,000. Inflation and interest rate values were studied under a +/−1% change. For example, since the baseline interest rate r was 2.8%, the lower-bound interest rate was 1.8% and the upper-bound interest rate was 3.8%. The bounds are not extremes and were based on ranges that could be reasonably expected. Results of the sensitivity analysis at expiry dates of 10 and 30 years are presented in Figure 6. These two discrete years were chosen to observe how the same changes in variables impact NPRs over time.
At year 10 (Figure 6, left plot), the baseline NPR was 0.51, and most of the changes resulted in “out-of-the-money” (below 1.0) NPRs. The one exception was the lower-bound initial cost for the adaptable garage option ( S 3 A o ), which directly relates to the “green premium” paid for the adaptable design. As would be expected, a low premium results in a beneficial NPR and the adaptable garage is a good buy. Note that the initial cost of the adaptable garage only impacts the NPR and is not used in calculating the OVs.
Figure 6. Net payoff ratio sensitivity to input variables at t = 10 and t = 30.
Sustainability 16 02610 g006
After S 3 A o , the NPR was most sensitive to changes to the initial cost of a three-story garage ( S 3 T o ) and the user-defined inflation of parking value ( i v ). Understandably, if the initial cost of the traditional parking garage increases, the NPR benefit is greater to the owner as the difference in the premium paid is smaller (see Equation (18)). If the green premium is low, the cost of the adaptable parking garage S 3 A o will be similar to the cost of the traditional parking garage S 3 T o , and it will always make sense to choose the adaptable option. The user-defined inflation of parking value is closely related to the projected benefit that an owner will gain through an expanded garage; the greater the benefit the higher the NPR. Although the NPR was sensitive to S 3 T o and i v , changes did not produce “in-the-money” situations at 10 years. Changes to X A o are not included in the sensitivity study as this variable is a function of the cost for a three-story and five-story parking garage at t = 0.
The sensitivity analysis for year 30 paints a slightly different picture than that for year 10. The order of variables with the greatest sensitivity changed, and the effects the variables had on the NPR were greater due to the later expiry time. At 30 years, the lower bound for i v resulted in the largest reduction in NPR, whereas the upper bound resulted in the second-highest positive change to the NPR. Recall that the i v rate is the most loosely defined variable in the model; due to its impact on NPR, careful consideration should be given to this variable. The strike price of the traditional garage, X T o , had the smallest impact on NPR at 10 and 30 years. This is because the price of “striking” (i.e., demolishing and rebuilding) the traditional garage is relatively high even at its lower bound, and the option value of the traditional garage is always at or near zero in the case study. The NPR was also relatively insensitive to the volatility of parking demand, suggesting that uncertainty in year-to-year fluctuation is not as critical to decision-making as are the time effects of interest rate, construction cost inflation, and value inflation.

5. Conclusions and Recommendations

In working towards a circular economy in the construction industry, sustainable strategies must be implemented. One such strategy is Design for Adaptability (DfA), a design strategy that facilitates future options, such as building expansion, thereby slowing waste associated with the disposal of buildings. It is known that having options inherently holds value. Therefore, this paper sought to explore the economic value of DfA as a sustainable strategy. The potential economic benefits of adaptable buildings have been widely reported, and a few models for quantifying these benefits have been previously presented. The current paper developed and demonstrated a model for the case of institutional owners for whom benefits derived from a building are not directly tied to revenue (i.e., a parking garage on a college campus). Such owners are common in the real estate and construction markets. The model is based on the Black–Scholes financial options model and also takes cues from the engineering options model presented by Engels, Browning, and Reich. The model includes the effect of construction cost inflation and inflation of the value resulting from building expansion.
The developed model was demonstrated through a case study of a parking garage on a college campus. The case study compared a low first-cost “traditional” garage and a premium adaptable (in this case, expandable) garage. A net payoff ratio (NPR) was used to interpret the case study results. When this ratio is greater than 1.0, the adaptable garage is “in-the-money”, and the economic value of the option exceeds the premium. Salient observations and conclusions from the case study include:
  • The NPR has the highest sensitivity to the initial cost for an adaptable parking garage. Therefore, if the premium for the adaptable option is relatively low, then it would be preferable to invest in the adaptable option. In the case study, a 10% decrease in the initial cost of the adaptable building affected an increase in NPR of approximately 120%.
  • The NPR is highly sensitive to the owner-defined inflation rate for the value of additional parking, especially at more distant expiry dates. A 1% increase in value inflation affected an approximately 60% increase in NPR at year 30. This rate is the most loosely defined variable in the model, and care should be taken when selecting its value. If an owner is willing to pay the market rate to construct parking, then it is suggested that the value inflation rate be set equal to the construction cost inflation rate.
  • For baseline parameters that best reflect the real-world conditions of the case study, the premium paid for an adaptable garage would not be justified. This result is sensitive to input values and circumstances that are specific to the case study.
While working toward the stated research questions, the development of the model raised questions and ideas for improvement. It is recommended that future works on this topic explore:
  • Alternatives for calculating the value of assets that are only indirectly related to revenue (i.e., parking spaces on many college campuses). The current model implemented a user-defined inflation parameter that was loosely defined but had a critical impact on the model output.
  • Methods for modeling trends in asset demand. Analogous to the original assumption of the BSM, demand for parking spaces in the current model is based on a constant mean across time and volatility of demand follows a “random walk”. Future models could account for growth/loss of demand. It is possible that the owner-defined value inflation rate could be used for this purpose.
  • The economic value associated with other types of options, such as occupancy change. For example, future work could address the option value of a parking garage that can be adapted into a residential or lab building.
  • Application of other option pricing models such as the Margrabe [53] model or the Datar–Mathews [54] model.
  • Considerations in the model for asset depreciation and other potential factors within the model.
  • An LCA comparison of traditional and adaptable designs and options. In addition to an LCA of the case study, general explorations of LCA and adaptable designs are also warranted.

Author Contributions

Conceptualization, M.R.-G. and B.E.R.; Methodology, M.R.-G. and B.E.R.; Investigation, M.R.-G. and B.E.R.; Data curation, M.R.-G. and B.E.R.; Writing—original draft, M.R.-G. and B.E.R.; Writing—review & editing, M.R.-G. and B.E.R.; Visualization, M.R.-G. and B.E.R. All authors have read and agreed to the published version of the manuscript.

Funding

This research has been performed in part using funding received from the National Science Foundation under CAREER Grant No. 1553565. Additionally, this work has been supported in part by the National Science Foundation Graduate Research Fellowship under Grant no. 2139915. Any opinions, findings, and conclusions or recommendations expressed in this material are those of the authors and do not necessarily reflect the views of the National Science Foundation.

Institutional Review Board Statement

Not applicable.

Informed Consent Statement

Not applicable.

Data Availability Statement

Some or all data that support the findings of this study are available from the corresponding author upon reasonable request.

Acknowledgments

The authors thank Michal Jerzmanowski, in the College of Business at Clemson University, and Anna Kate Becker for their assistance in reviewing the subject material. Contributions from Susan Aultman and Kat Moreland, who provided project data, are also acknowledged with gratitude.

Conflicts of Interest

The authors declare no conflicts of interest. The funders had no role in the design of the study; in the collection, analyses, or interpretation of data; in the writing of the manuscript; or in the decision to publish the results.

References

  1. Architecture 2030. Available online: https://architecture2030.org/why-the-building-sector/ (accessed on 14 June 2023).
  2. Sabnis, A.; Mysore, P.; Anant, S. Construction Materials—Embodied Energy Footprint—Global Warming; Interaction. In Proceedings of the Structural Engineers World Congress, Singapore, 19–22 October 2015. [Google Scholar]
  3. United States Environmental Protection Agency (EPA). Available online: https://www.epa.gov/smm/sustainable-management-construction-and-demolition-materials (accessed on 26 August 2022).
  4. The American Institute of Architects. Buildings That Last: Design for Adaptability, Deconstruction and Reuse [PDF]. Available online: https://www.aia.org/resource-center/design-adaptability-deconstruction-reuse (accessed on 14 June 2023).
  5. Construction Industry Institute. Circularity in Capital Projects: Innovations and Opportunities; Final Report 380; 1 July 2022. Available online: https://www.construction-institute.org/circularity-in-capital-projects-innovations-and-opportunities (accessed on 23 September 2022).
  6. Geissdoerfer, M.; Savaget, P.; Bocken, N.M.P.; Hultink, E.J. The Circular Economy—A new sustainability paradigm? J. Clean. Prod. 2017, 143, 757–768. [Google Scholar] [CrossRef]
  7. Dams, B.; Maskell, D.; Shea, A.; Allen, S.; Driesser, M.; Kretschmann, T.; Walker, P.; Emmitt, S. A circular construction evaluation framework to promote designing for disassembly and adaptability. J. Clean. Prod. 2021, 316, 128122. [Google Scholar] [CrossRef]
  8. Salama, W. Design of concrete buildings for disassembly: An explorative review. Int. J. Sustain. Built Environ. 2017, 6, 617–635. [Google Scholar] [CrossRef]
  9. Arora, S.K.; Foley, R.W.; Youtie, J.; Shapira, P.; Wiek, A. Drivers of technology adoption—The case of nanomaterials in building construction. Technol. Forecast. Soc. Change 2014, 87, 232–244. [Google Scholar] [CrossRef]
  10. Bourke, K.; Adams, K. The Business Case for Re-Usable Buildings—Business Models, Systems Diagnosis and Case for Action. In Proceedings of the 15th International Conference on Durability of Building Materials and Components, Barcelona, Spain, 20–23 October 2020. [Google Scholar]
  11. Cruz Rios, F.; Grau, D.; Bilec, M. Barriers and Enablers to Circular Building Design in the US: An Empirical Study. J. Constr. Eng. Manag. 2021, 147, 04021117. [Google Scholar] [CrossRef]
  12. Heidrich, O.; Kamara, J.; Maltese, S.; Re Cecconi, F.; Dejaco, M.C. A critical review of the developments in building adaptability. Int. J. Build. Pathol. Adapt. 2017, 35, 284–303. [Google Scholar] [CrossRef]
  13. Arge, K. Adaptable office buildings: Theory and practice. Facilities 2005, 23, 119–127. [Google Scholar] [CrossRef]
  14. Bitter, C.M.; Ross, B.E.; Parker, S.; Milkovitz, M. Cost Comparison of Typical and Adaptable Precast Parking Structures in the US. In Proceedings of the 2nd International Conference of Circular Systems for the Built Environment, Eindhoven, The Netherlands, 9 December 2021. [Google Scholar]
  15. Brigante, J.; Ross, B.E.; Bladow, M. Costs of Implementing Design for Adaptability Strategies in Wood-Framed Multifamily Housing. J. Archit. Eng. 2023, 29, 05022013. [Google Scholar] [CrossRef]
  16. Damodaran, A. The Promise of Real Options. J. Appl. Corp. Financ. 2000, 13, 29–44. [Google Scholar] [CrossRef]
  17. Sick, G.; Gamba, A. Some Important Issues Involving Real Options: An Overview. Multinatl. Financ. J. 2010, 14, 73–123. [Google Scholar]
  18. Coppens, T.; Van Acker, M.; Machiels, T.; Compernolle, T. A real options framework for adaptive urban design. J. Urban Des. 2021, 26, 681–698. [Google Scholar] [CrossRef]
  19. Black, F.; Scholes, M. The Pricing of Options and Corporate Liabilities. J. Political Econ. 1973, 81, 637–654. [Google Scholar] [CrossRef]
  20. Hazelrigg, G. Research 101 for Engineers. Available online: https://hw898.ise.msstate.edu/files/research_101_for_engineers.pdf (accessed on 21 February 2013).
  21. U.S. General Services Administration. Available online: https://www.gsa.gov/ (accessed on 3 January 2024).
  22. Allahaim, F.; Leifer, D. Towards Changeability: The Adaptable Buildings Design (ABD) Framework. In Proceedings of the 5th International Conference of Arab Society for Computer Aided Architectural Design, Fes, Morocco, 19–21 October 2010. [Google Scholar]
  23. Elvarrson, A.B.; Martani, C.; Adey, B.T. Considering automated vehicle deployment uncertainty in the design of optimal parking garages using real options. J. Build. Eng. 2021, 34, 101703. [Google Scholar] [CrossRef]
  24. Rockow, Z.R.; Ross, B.E.; Becker, A.K. Comparison of Building Adaptation Projects and Design for Adaptability Strategies. J. Archit. Eng. 2021, 27, 04021022. [Google Scholar] [CrossRef]
  25. O’Connor, J. Survey on actual service lives for North American buildings. In Proceedings of the Woodframe Housing Durability and Disaster Issues Conference, Conference Paper, Las Vegas, NV, USA, 4–6 October 2004. [Google Scholar]
  26. The Athena Institute. Minnesota Demolition Survey: Phase Two Report [PDF]. 2004. Available online: https://www.athenasmi.org/ (accessed on 27 September 2022).
  27. Thomsen, A.; van der Flier, K. Understanding obsolescence: A conceptual model for buildings. Build. Res. Inf. 2011, 39, 352–362. [Google Scholar] [CrossRef]
  28. Kasarda, M.E.; Terpenny, J.P.; Inman, D.; Precoda, K.R.; Jelesko, J.; Sahin, A.; Park, J. Design for adaptability (DFAD)—A new concept for achieving sustainable design. Robot. -Comput.-Integr. Manuf. 2007, 23, 727–734. [Google Scholar] [CrossRef]
  29. Webster, M.D. Structural design for adaptability and deconstruction: A strategy for closing the materials loop and increasing building value. New Horizons Better Pract. 2007, 1–6. [Google Scholar] [CrossRef]
  30. Carroon, J. Sustainable Preservation: Greening Existing Buildings; Wiley: Hoboken, NJ, USA, 2010. [Google Scholar]
  31. Gosling, J.; Sassi, P.; Naim, M.; Lark, R. Adaptable buildings: A systems approach. Sustain. Cities Soc. 2013, 7, 44–51. [Google Scholar] [CrossRef]
  32. Zhao, T.; Tseng, C.L. Valuing Flexibility in Infrastructure Expansion. J. Infrastruct. Syst. 2003, 9, 89–97. [Google Scholar] [CrossRef]
  33. Leslie, K.J.; Michaels, M.P. The real power of real options. Mckinsey Q. 1997, 3, 5–22. [Google Scholar]
  34. Sutherland, A.G.; Williams, J.R. Valuing Real Options: Insights from Competitive Strategy; Research Showcase @ CMU: Pittsburgh, PA, USA, 2008; pp. 1–30. [Google Scholar]
  35. Wang, T.; de Neufville, R. Real Options “in” Projects. In Proceedings of the 9th Real Options Annual International Conference, Conference Paper, Paris, France, 22–25 June 2005. [Google Scholar]
  36. Sturm, M.; Goldstein, M.A.; Huntington, H.; Douglas, T.A. Using an option pricing approach to evaluate strategic decisions in a rapidly changing climate: Black-Scholes and climate change. Clim. Change 2017, 140, 437–449. [Google Scholar] [CrossRef]
  37. Kalfin; Sukono, S.S.; Mamat, M.; Bon, A.T. Model for Determining Natural Disaster Insurance Premiums in Indonesia Using the Black Scholes Method. In Proceedings of the International Conference on Industrial Engineering and Operations Management, Detroit, MI, USA, 10–14 August 2020. [Google Scholar]
  38. Engels, A.; Browning, T.R. Designing Systems for Adaptability by Means of Architecture Options. Syst. Eng. 2008, 11, 125–146. [Google Scholar] [CrossRef]
  39. Engels, A.; Reich, Y. Advancing Architecture Options Theory: Six Industrial Case Studies. Syst. Eng. 2015, 18, 396–414. [Google Scholar] [CrossRef]
  40. Nafia, H.; Agmour, I.; El Foutayeni, Y.; Achtaich, N. Pricing American put options model with application to oil options. Int. J. Comput. Sci. Math. 2023, 17, 67–78. [Google Scholar] [CrossRef]
  41. Martins, J.; Marques, R.C.; Cruz, C.O. Real Options in Infrastructure: Revisiting the Literature. J. Infrastruct. Syst. 2015, 21, 04014026. [Google Scholar] [CrossRef]
  42. Zeng, S.; Zhang, S. Real Options Literature Review. iBusiness 2011, 3, 43. [Google Scholar] [CrossRef]
  43. Martello, M.V.; Whittle, A.J.; Oddo, P.C.; de Neufville, R. Real options analysis for valuation of climate adaptation pathways with application to transit infrastructure. Risk Anal. 2023, 1–21. [Google Scholar] [CrossRef] [PubMed]
  44. de Neufville, R.; Scholtes, S.; Wang, T. Real Options by Spreadsheet: Parking Garage Case Example. J. Infrastruct. Syst. 2006, 12, 107–111. [Google Scholar] [CrossRef]
  45. Pudney, S.G.; Mills, D.E.; Mudunuri, S. The End of Megaproject Uncertainty: Post COVID-19 National Infrastructure Management. In 14th World Congress on Engineering Asset Management Proceedings; Springer International Publishing: Cham, Switzerland, 2021. [Google Scholar]
  46. Fawcett, W. Investing in flexibility: The lifecycle options synthesis. Proj.-Mit J. Plan. 2011, 10, 13–29. [Google Scholar]
  47. Associated General Contractors of America. Construction Inflation Alert [PDF]. 2022. Available online: https://www.agc.org/learn/construction-data/agc-construction-inflation-alert (accessed on 15 February 2023).
  48. Aultman, S.; (Metromont Corporation, Greenville, SC, USA). Interview. Personal communication, 2022. [Google Scholar]
  49. Moreland, K.; (Clemson University Parking and Transportation Services, Clemson, SC, USA). Interview. Personal communication, 2022. [Google Scholar]
  50. RSMeans Online. 2022. Available online: https://www.rsmeansonline.com/ (accessed on 17 November 2022).
  51. United States Army Corps of Engineers (USACE). CWCCIS Indices. 2022. Available online: https://www.usace.army.mil/Cost-Engineering/cwccis/ (accessed on 21 November 2022).
  52. Longstaff, F.A. Are Negative Option Prices Possible? The Callable U.S. Treasury-Bond Puzzle. J. Bus. 1992, 65, 571–592. [Google Scholar] [CrossRef]
  53. Margrabe, W. The Value of an Option to Exchange One Asset for Another. J. Financ. 1978, 33, 177–186. [Google Scholar] [CrossRef]
  54. Datar, V.; Mathews, S. European Real Options: An Intuitive Algorithm for the Black-Scholes Formula. J. Appl. Financ. 2004, 14, 45–51. [Google Scholar]
Figure 1. Traditional parking garage design with callouts where adaptable features are embedded. Adapted from Bitter et al. (2021) [14].
Sustainability 16 02610 g001
Figure 2. Estimated concrete volume needed for traditional and adaptable parking garages.
Sustainability 16 02610 g002
Figure 3. Option values calculated using parameters from Scheme 1 to demonstrate the use of a floor bound at zero.
Sustainability 16 02610 g003
Figure 4. Graphical representation of NPR when O V T and O V T are used for Scheme 1. Note that when O V T is used, the NPR is more conservative.
Sustainability 16 02610 g004
Table 1. Comparison of BSM and EBR model variables and their definitions.
SymbolDefinitions
Black and Scholes, 1973 [19]Engels and Browning, 2008 [38]
SCurrent stock priceCurrent value of a system’s component
S’Not usedEstimated value of a system’s component (after upgrade)
XPrice paid at time t by an investor to exercise option contractEstimated cost to upgrade system’s component at time t
σ Statistical measure of stock price fluctuations (volatility) over timeThe uncertainty value of the upgraded system’s component, determined by stakeholders and translated to a market value over time
tTime at which the stock option will expire, and the investor must choose if they will buy the stock option at the strike priceTime at which the upgraded system’s component is deployed
rThe interest rate under a “no-risk” assumptionThe no-risk interest rate associated with the financial support needed to upgrade the system’s component at time t
OVValue of stock option (option value)Value of the system’s ability to be upgraded
Table 2. Limitations of BSM for application to real options analysis (as discussed in Martins et al., 2015 [41]) in infrastructure projects.
LimitationApproach for Addressing the Limitation in the Parking Garage Case Study
Only applicable to European optionsThe OVs will be calculated at discrete five-year increments after construction. Thus, the calculations will give the option value if the garage were expanded (i.e., the option is exercised) at the time increment. The OVs will then be compared across different increments.
Only works with normal distributionThe volatility of the parking garage value will be taken as the volatility in the number of parking passes issued. The number of passes is normally distributed for the campus parking case study (found through a Jarque–Bera test). The number of parking passes had a constant mean over the 20-year historical period considered.
Requires advanced financial knowledgeThe case study example was selected as a means of “translating” the financial aspects of the BSM to an engineering example, thus making the approach more accessible to non-finance professionals.
Required assumptions limit the use of the model (price, volatility, duration)The case study uses historical construction cost inflation and parking demand data to inform model assumptions. Sensitivity studies are used to demonstrate how assumed inputs impact calculated option values.
Able to deal with only one factor of uncertaintyThis limitation is present in the case study. The only source of volatility in the calculations is the volatility of the parking garage value. Other uncertainties, such as volatility in construction costs, are not considered. It is reasoned that increases in uncertainty will increase the OV; omitting them from the model is conservative.
Table 4. Option values for adaptable and traditional parking garage and net payoff ratios with i v = i c = 0.
Year 5Year 10Year 15Year 20Year 25Year 30
O V A USD 279,404USD 296,846USD 273,565USD 238,070USD 200,917USD 166,394
O V T −USD 311−USD 19,873−USD 88,579−USD 189,533−USD 294,871−USD 386,547
O V T USD 0USD 0USD 0USD 0USD 0USD 0
O V A O V T USD 279,715USD 316,719USD 362,144USD 427,604USD 495,788USD 552,941
O V A O V T USD 279,404USD 296,846USD 273,565USD 238,070USD 200,917USD 166,394
Net Payoff Ratio ( O V T )0.270.310.360.420.490.54
Net Payoff Ratio ( O V T )0.270.290.270.230.200.16
Table 5. Option values for adaptable and traditional parking garage and net payoff ratios with i v = i c = 2.78%.
Year 5Year 10Year 15Year 20Year 25Year 30
O V A USD 371,109USD 522,837USD 637,916USD 733,817USD 817,335USD 891,971
O V T USD 46USD 3184USD 15,871USD 38,604USD 69,013USD 104,743
O V A O V T USD 371,064USD 519,653USD 622,045USD 695,212USD 748,322USD 787,228
Net Payoff Ratio0.360.510.610.680.730.77
Table 6. Option values for adaptable and traditional parking garage and net payoff ratios with i v = 2.00% and i C = 2.78%.
Year 5Year 10Year 15Year 20Year 25Year 30
O V A USD 295,022USD 367,850USD 403,518USD 420,324USD 425,533USD 422,945
O V T USD 17USD 964USD 3991USD 7991USD 11,573USD 13,879
O V A O V T USD 295,006USD 366,887USD 399,527USD 412,334USD 413,961USD 409,066
Net Payoff Ratio0.290.360.390.400.410.40
Disclaimer/Publisher’s Note: The statements, opinions and data contained in all publications are solely those of the individual author(s) and contributor(s) and not of MDPI and/or the editor(s). MDPI and/or the editor(s) disclaim responsibility for any injury to people or property resulting from any ideas, methods, instructions or products referred to in the content.

