Article

Optimal Design of Resilient Carbon Capture, Utilization and Storage (CCUS) Supply Chain Networks under Facility Disruption

1
College of Management, Xi’an University of Science and Technology, Xi’an 710054, China
2
School of Information Engineering, Chang’an University, Xi’an 710064, China
*
Author to whom correspondence should be addressed.
Sustainability 2024, 16(7), 2621; https://doi.org/10.3390/su16072621
Submission received: 9 January 2024 / Revised: 10 March 2024 / Accepted: 20 March 2024 / Published: 22 March 2024

Abstract

:
In recent years, various kinds of carbon dioxide capture, utilization and storage supply chain network design (CCUS SCND) problems have been extensively studied by scholars from the supply chain management community and other fields. The existing works mainly focus on the various deterministic or uncertainty problems; few works consider the CCUS SCND resilience problem in the context of utilization/storage facility disruptions due to unexpected natural disasters or other geological anomaly events. This paper aims to study the CCUS SCND resilience problem under utilization/storage facility capacity disruption risk. We propose a stochastic mixed-integer linear programming model for the considered problem. In the considered problem, the main decisions related to the following areas are taken into account: supply chain design and planning; facility disruption risk handling, including the optimal determination of facility locations and the matching of carbon dioxide emission sources and utilization/storage facilities; carbon dioxide normal transportation planning; and transshipment planning for various disruption scenarios. Finally, an experimental study comprising a case study from China is conducted to validate the effectiveness and performance of our proposed model. The obtained results show that the supply chain networks for the case study obtained by our proposed model are efficient, cost-effective and resilient in mitigating various kinds of utilization/storage facility disruption scenarios, showing the model can be applied to large-scale CCUS projects to help managers effectively deal with disruption risks. Future research should consider multiple disruption events and propose multiple effective resilience strategies.

1. Introduction

The increasing carbon dioxide (CO2) concentration in the atmosphere is generally associated with the increase in CO2 emissions from the burning and consumption of fossil fuels, which has garnered the attention of various environmental protection organizations. In order to achieve an acceptable level of CO2 in the atmosphere and meet the Paris Agreement’s goal of limiting the global average temperature rise to 1.5 °C [1], countries worldwide are taking active measures to advance global climate governance and meet the relevant commitments of the Paris Agreement. However, only reducing carbon dioxide (CO2) emissions is insufficient. CCUS technology is one of the key technologies to achieve China’s carbon neutrality goal and has great strategic significance in realizing the low-carbon use of fossil energy. The use of this technology is crucial for achieving the goals of the Paris Agreement and ensuring its success. CCUS refers to the capture of carbon dioxide from carbon-intensive industries such as fossil-fuel-fired power generation, cement, steel, and other industries. Then, the captured CO2 is compressed to a supercritical state and transported by road/railway, pipelines or ships to suitable storage/utilization sites. Next, it is injected into underground strata for permanent disposal or transported to chemical plants, where it is chemically reacted to produce compounds such as methanol and concrete, generating revenue. By the end of 2023, there were almost one hundred CCUS projects in operation or under development in China. More than half of these projects, already in operation, demonstrate a CO2 capture capacity of approximately 4 million tons per year and an injection capacity of about 2 million tons per year [2]. Given the immense pressure to reduce emissions and the expanding scale of CCUS facilities and pipeline networks, the operation and management of CCUS projects exhibit characteristics such as wide distribution areas and high difficulty and complexity in the planning of pipeline networks. Therefore, research on CCUS supply chain management is crucial for promoting global climate governance and achieving sustainable development.
The CCUS SCN is a complex system that could be affected by various unforeseen disruptions, which may include the unpredictability surrounding geological storage capacity, the potential for CO2 leakage within pipelines, and fluctuations in carbon tax policies. For example, the geological storage capacity of CO2 can be significantly impacted by factors such as reservoir thickness, porosity, permeability, and the probability of earthquakes at the storage site. Additionally, the depth of CO2 injection in the supercritical state must be at least 800 m below ground level. It is also challenging to observe or detect the anomalous movement of CO2 and potential geological tectonic defects, which further increases uncertainty at the storage site. To address potential supply chain disruptions, it is necessary to design a resilient CCUS supply chain system. Enhancing the resilience of the CCUS SCN can mitigate its vulnerability, ensure stable operation and can strengthen the system’s ability to address risks. However, the resilience level of the CCUS supply chain needs to be moderate. A low level of resilience may not be able to cope with the complexity and variability of unexpected risks, while a high level of resilience may increase the total cost of the system.
To ensure the stable and efficient operation of the supply chain under uncertain environments, it is necessary to consider potential disruptions and propose effective measures for the related CCUS SCND resilience problems. This will strengthen the risk management capability of CCUS supply chains. The study of resilient CCUS SCND models under disruption risk scenarios has great theoretical and practical value. It can provide scientific decision support for the resilience design and operation of CCUS supply chains, promoting sustainable development and the application of CCUS technology while coping with potential disruption risks more effectively.
Supply chain management is an evolving research area, which currently focuses on dealing with the low-carbon goals (i.e., a green SC) and uncertain market environments with possible supply chain disruptions that could endanger the survival and growth of supply chains, i.e., resilience SCs [3,4]. Although extensive research has been conducted on the design and optimization of CCUS SCNs, there is still a lack of research on the resilient design and optimization of CCUS SCNs, which consider resilience strategies to mitigate the underlying disruption risks arising from storage/utilization facilities. In this paper, a stochastic mixed-integer linear programming model is formulated to design a resilient CCUS supply chain network under unexpected facility disruptions. The objective is to minimize the total expected cost of the supply chain (SC) while meeting the requirement for reducing CO2 emissions. It determines the optimal network structure and CO2 flow rate between nodes and constructs a resilient CCUS SCN model that can efficiently and effectively respond to underlying facility disruptions. To verify the model’s validity, we conducted a case study in Northeast China and used scenario analysis to simulate storage/utilization facility disruptions. We analyzed the impacts of factors such as sequestration/utilization facility disruptions and transshipment strategy on the CCUS SCN structure and its total cost. The results show that our proposed resilience model can provide efficient and cost-effective decision support for CCUS SC decision makers in the context of CCUS facility disruptions.
The paper is structured as follows: Section 2 provides a review of CCUS SCND and resilience SCND. Section 3 presents the problem definition and mathematical model. The case study from Northeast China and the results obtained by our model are presented and discussed in Section 4. Finally, Section 5 concludes the work.

2. Literature Review

In this section, we present a brief literature review on the works that are primarily related to our research. Since our work mainly focuses on two aspects, namely CCUS SCND and resilient supply chain networks, this section includes three subsections: a literature review on CCUS SCND, a literature review on resilient supply chain networks, and a summary and identification of research gaps.

2.1. Literature Review on CCUS Supply Chain Network Design

The design of CCUS supply chain networks presents a recent challenge in the field of supply chain management. The core of this challenge is to optimize decisions related to the capture, separation, transportation and storage/utilization of carbon dioxide. To achieve this goal, scholars have proposed various mathematical models and methods, including Linear Programming (LP), Mixed-Integer Programming (MIP), Mixed-Integer Linear Programming (MILP), Mixed-Integer Non-Linear Programming (MINLP) and Stochastic Mixed-Integer Linear Programming (SMILP) [5,6,7,8,9]. Existing studies typically investigate single or multi-objective CCUS SCND problems in the context of multiple periods, whether deterministic or uncertain. The goal is to minimize environmental impacts and operational risks while ensuring economic efficiency.
Most studies on single-objective CCUS SCND optimization problems focus on minimizing the total SC cost or maximizing profits. For instance, Lainez-Aguirre et al. developed a MILP model with the aim of maximizing profits while considering environmental impacts as constraints [10]. D’Amore et al. suggested a MILP model, with the objective of minimizing the total SC cost, including the additional cost of risk response [11]. Ostovari et al. investigated a single-objective CCUS SCND that considers environmental impacts. They developed a single-objective MILP model with the aim of maximizing greenhouse gas (GHG) emission reductions [12]. In contrast, multi-objective CCUS SCND optimization problems typically consider economic, environmental and social objectives simultaneously. For instance, Roh et al. proposed a bi-objective LP model to minimize the total SC cost and the CO2 emissions calculated based on emission factors [13]. Similarly, Zhang et al. developed a bi-objective MILP model to minimize both the total SC cost and the financial risk of the CCS project in China [14]. Cristiu et al. proposed a bi-objective MILP model to minimize both total cost and seismic risk [15]. Lee et al. studied a two-phase-two-stage stochastic multi-objective CCUS SCND problem. Their objective was to find a trade-off between the total annual benefit and financial risk, along with the corresponding environmental impact [16].
Additionally, scholars have researched various types of multi-period CCUS SCND problems. For instance, Yue et al. formulated a MINLP model for a multi-period CCUS SCND, considering the seasonal growth characteristics of algal organisms. The objective is to maximize the amount of carbon sequestration in geological formations [17,18]. Morbee et al. addressed a multi-period CCUS SCND problem pertaining to the European power sector from 2015 to 2050. They proposed a multi-period MILP model for the considered problem [19]. Abdoli et al. also proposed a multi-period MILP model for a CCUS SCND problem, incorporating multiple capture technologies. They divided 20 years into four periods of five years. Scholars have, in recent years, studied CCUS SCND problems, considering various uncertainty factors [20]. For instance, Han and Lee developed a stochastic MILP model that uses probability density functions and discrete interval values to describe uncertain parameters, such as operating costs, environmental impacts, and technological losses [21]. He et al. used interval numbers and uniform distribution functions to represent uncertain parameters, such as carbon capture and geological storage capacity, and proposed a worst-case MILP formulation and a robust stochastic two-stage MILP model for the robust optimal source−sink matching problem in CCS supply chains under uncertainty [22]. D’Amore and Bezzo investigated the uncertain CCS SCND problem under different carbon emission target scenarios and proposed a stochastic MILP model based on scenario analysis [23]. Kegl et al. developed a SMILP model using scenario analysis. They studied five different carbon tax price scenarios and performed annual profit sensitivity analyses. Additionally, they proposed a MINLP model aimed at minimizing the total SC cost. The authors proposed a conceptual MINLP model to determine the optimal capacity and deployment time of the CCUS system, as well as the optimal matching of emission sources and storage facilities [24].

2.2. Literature Review on Resilient Supply Chain Network Design

The concept of ‘Supply Chain Resilience’ was first introduced by Professors Rice and Caniato in 2003 [25]. Later, Christopher and Peck provided a formal definition, stating that the term refers to the supply chain’s ability to recover to its original or an improved state after a disruption [26]. Since then, the definition of supply chain resilience has evolved with further research. The current widely recognized definition of supply chain resilience was provided by Ponomarov and Holcomb, who defined it as the preventive preparation for potential contingencies, the rapid response after a disruption occurs and the adaptive capacity to recover from the disruption [27].
In the research field of designing resilient supply chain networks, scholars generally focus on two main aspects: indicators for evaluating supply chain resilience and strategies for enhancing supply chain resilience. For example, Cardoso et al. studied several resilience metrics for the SCND problem, including service level, maintenance flow, node complexity, node criticality, density and flow complexity. These metrics were designed to mitigate disruptions and demand uncertainty [28]. Fahimnia and Jabbarzadeh defined resilience in terms of supplier disruptions and production distribution capacity levels. They quantified the environmental and social impacts of the SCN and proposed a mathematical model based on a sustainability performance scoring methodology. Their proposed model used a fuzzy goal programming approach [29]. Jabbarzadeh et al. developed a resilient SCN model that aimed to minimize the total SC costs and maximize the SC sustainability performance by considering several resilience metrics related to disruptions and multiple sourcing [30]. Kaur et al. considered uncertainties in parameters such as carbon emissions, market demand, machine capacity, suppliers and transporters and developed a supplier selection model using a fuzzy multi-criteria decision-making approach. They developed a MINLP model for procurement and production planning in a resilient, sustainable SCN [31]. Goldbeck et al. defined supply chain resilience as the ability of an SCN to meet user demand disruptions. They developed a multi-stage stochastic planning model that considers logistical uncertainty [32]. Namdar et al. proposed a resilient SCN framework that includes resilience assessment metrics and uses multi-criteria decision-making techniques to quantify the resilience score of each facility in the SCN. They address supply chain operational and disruption risks using a two-stage stochastic planning model [33]. Yazdi et al. used Delphi methodology to identify 20 critical success factors (CSFs) related to the resilience of transport service providers in the supply chain. They developed a novel approach using Multiple Criteria Decision Analysis (MCDA) to rank a group of CSFs [34].
In the context of supply chain resilience strategy, Khalili et al. investigated a two-stage production allocation network design problem by treating disruption risk as a stochastic scenario. They incorporated the strategies of standby inventory, emergency inventory and extra production capacity into the model, thus developing a two-stage stochastic hybrid planning model [35]. Meng compared two resilience contingency strategies for activating flexible operational capacity and repairing failed nodes of the SCN. They also analyzed the advantages and disadvantages of these strategies when the network resilience factor varies [36]. Zhao and You considered the time delays between a disruption event and its restoration operation. They adopted the resilience strategy of setting up additional production capacity and developed a mathematical model to solve the facility siting problem. They also integrated decision making for the pre-disruption facility location problem, considering the resilience strategy and a post-disruption recovery plan [37]. Yavari and Zaker studied a resilient closed-loop SCND problem, considering disruption risks. They used five different risk mitigation strategies to cope with disruptions and developed an MILP model with two objectives to minimize the total desired cost and the total carbon emissions of the SCN [38]. Shi and Ni developed a MILP model for the supply chain recovery problem after disruptions in an uncertain environment. An outsourcing strategy and a capacity expansion strategy are introduced in the model to improve the service level after a supply chain disruption [39]. Gabrielli et al. defined the concept of supply chain resilience as the ability to permanently store captured carbon dioxide within a relevant time horizon and used a multi-modal transportation strategy to improve the resilience of the CCUS SCN [40]. Liu et al. adopted an emergency storage strategy and direct delivery strategies and developed a MILP model to design a multi-level, multi-product, low-carbon resilient coal SCN under the risk of disruptions and demand fluctuations [41].

2.3. Research Gap

From the above descriptions, it is evident that various types of CCUS SCND or resilient SCND problems have been extensively studied, in the single/multi-objective, static/uncertain and multi-period contexts. However, the resilient CCUS SCND problems that incorporate the consideration of uncertain facility disruptions have not received significant attention from the SC community. To the best of our knowledge, there is a limited body of research on resilient CCUS supply chains. Moreover, the existing literature on CCUS supply chains often lacks effective resilience strategies to mitigate the various disruptions that may arise due to unforeseen risks with regard to utilization/storage facilities. This study aims to address this research gap by focusing on the resilient design and operation of CCUS supply chains. It considers a transit strategy for transporting carbon dioxide from disrupted facilities to functional ones or to newly opened facilities, if necessary. Furthermore, it investigates a novel resilient CCUS SCND problem that takes into account unexpected facility disruptions, aiming to effectively recover the supply chain from disruptions while minimizing the overall SC cost.

3. Problem Definition and Mathematical Modeling

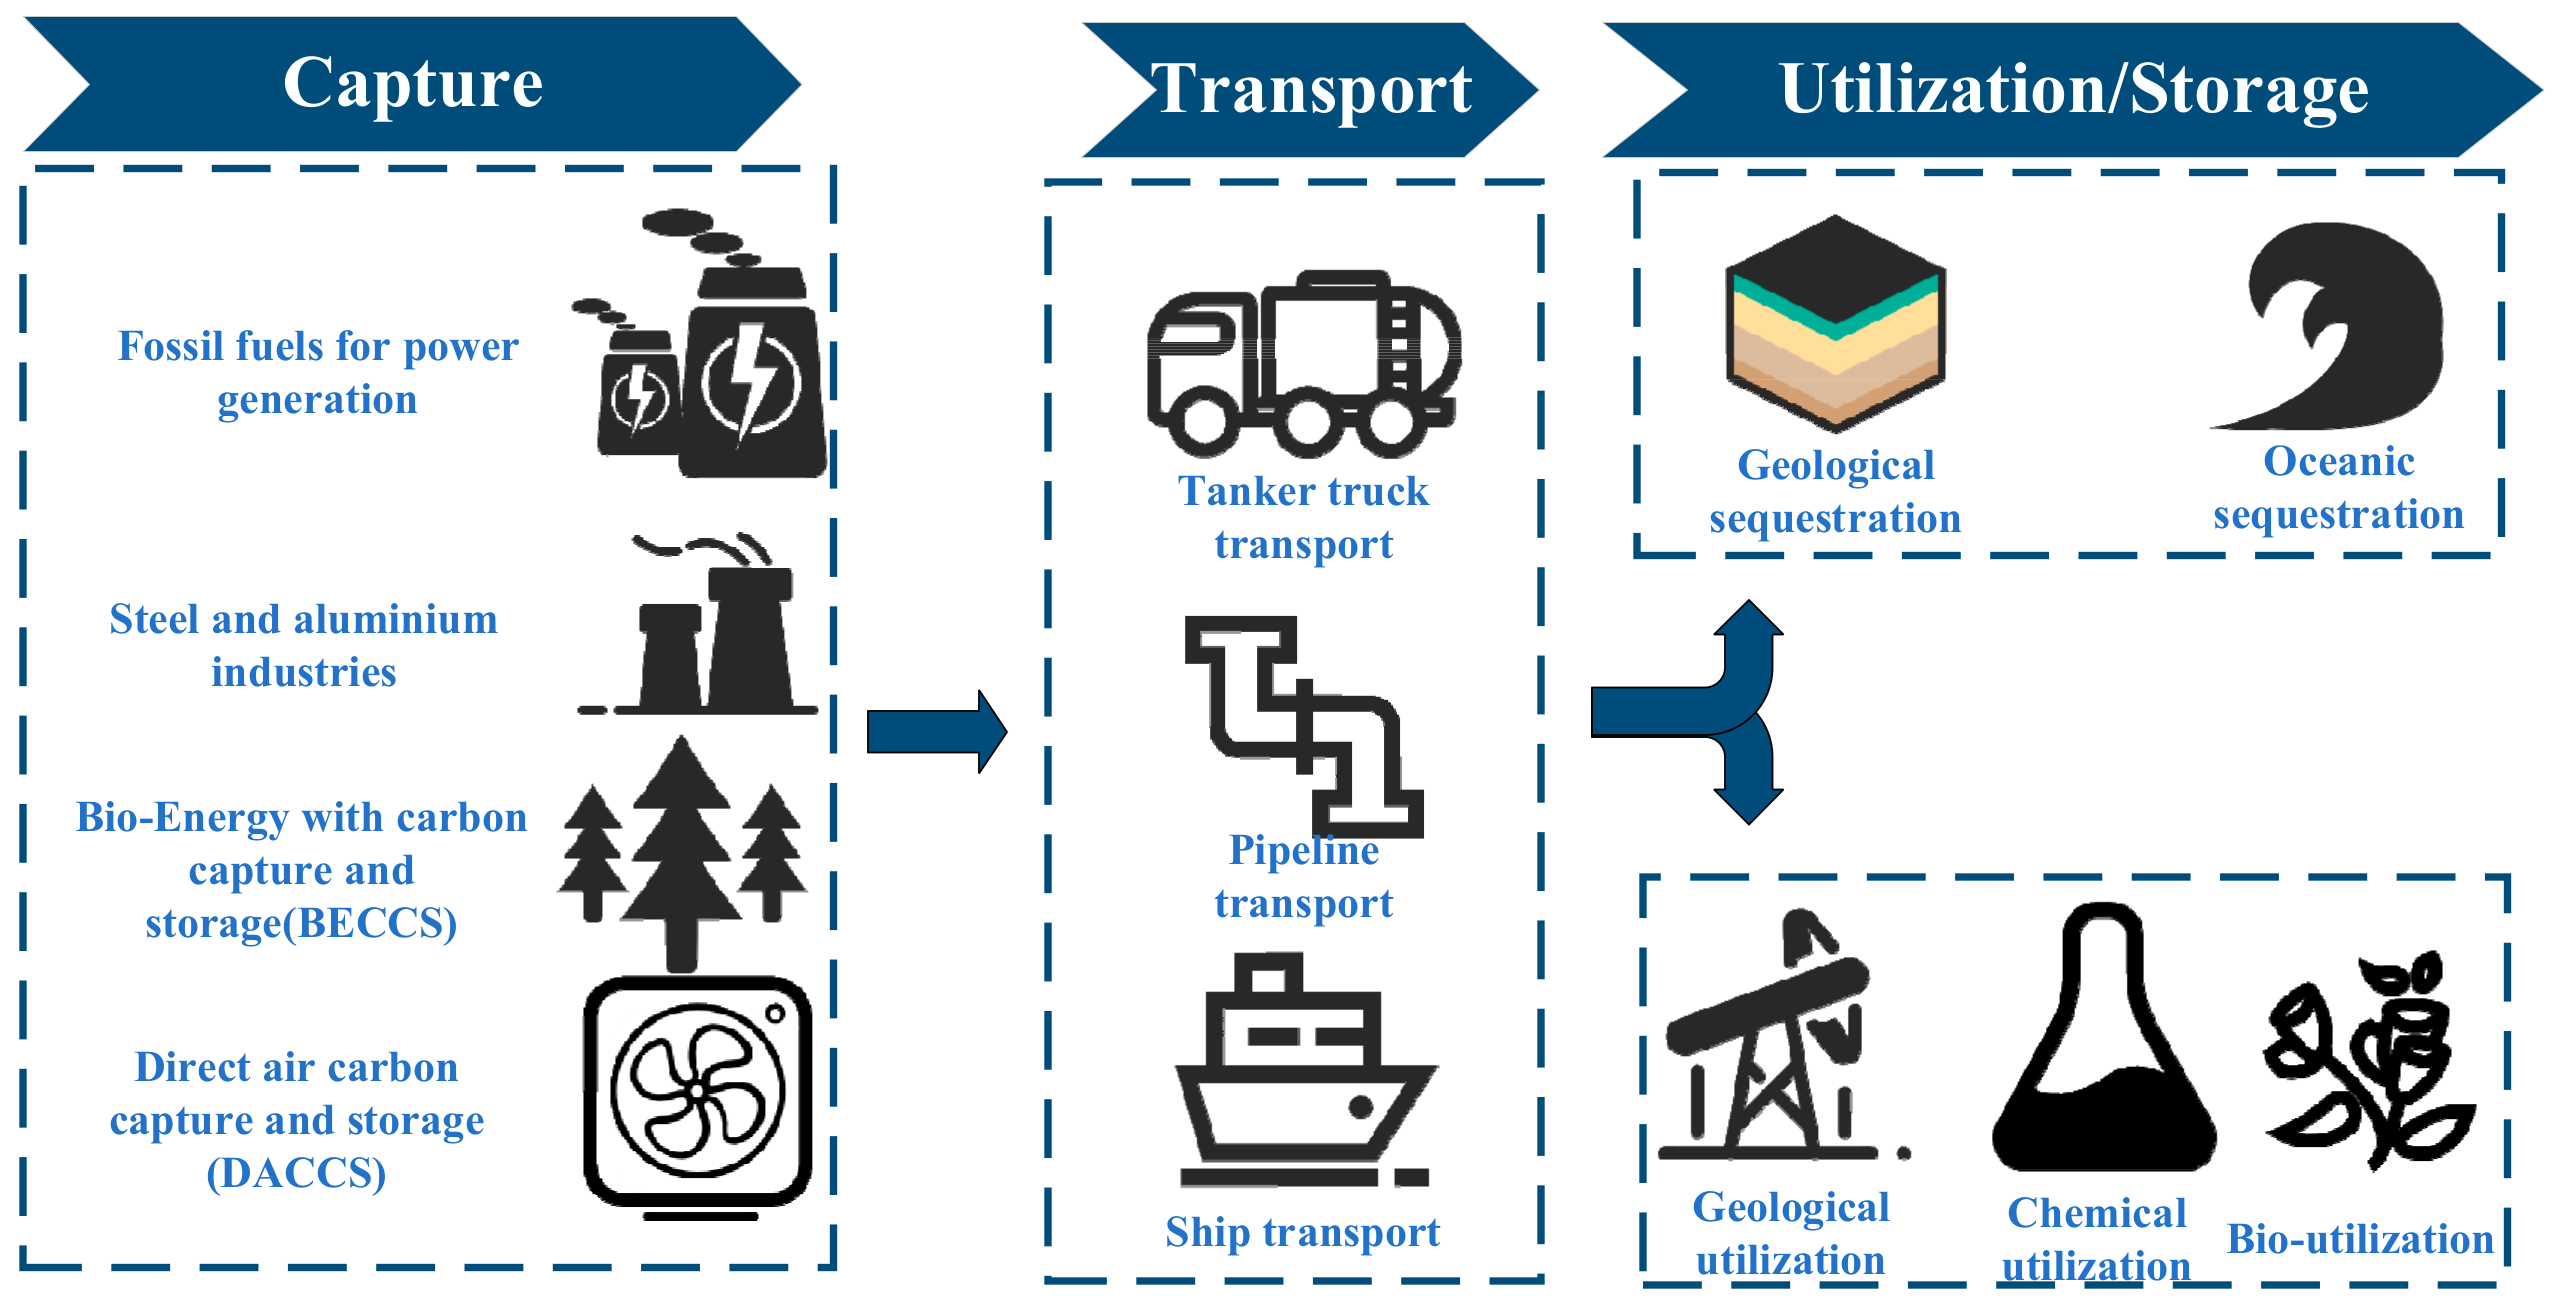
3.1. Problem Definition

The CCUS supply chain network considered in this paper is shown in Figure 1. It consists of carbon emission sources, capture and treatment facilities, transport facilities and utilization and storage facilities [2]. In the considered CCUS supply chain system, carbon emission sources play the role of ‘raw material suppliers’, providing carbon dioxide as ‘raw material’ to capture facilities (equivalent to ‘producers’). Through the use of efficient capture technologies, CO2 is separated, purified and compressed into an easily transportable ‘product’, compressed CO2, which can be in a gaseous, cryogenic liquid, dense or supercritical phase. The compressed CO2 is then transported by road, railway, land pipeline, offshore vessels or submarine pipelines to storage sites or utilization facilities such as deep underground saline aquifers or, in some cases, for efficient use such as chemical production through CO2 hydrotreating or enhanced oil recovery through CO2-EOR technology, to achieve CO2 reductions from high-emitting sources.
In the CCUS SCN, facilities for capture, treatment, transport and storage/utilization may be under unforeseen disruption risks. The geological conditions are complex, leading to uncertainties in key parameters, such as reservoir volume, thickness and porosity. This makes it difficult to accurately predict the geological storage capacity of CCUS. The stability and reliability of the CCUS SCN are challenged by the high degree of uncertainty regarding the extent of damage to storage/utilization facilities after an interruption event.
This study develops a set of disruption scenarios to describe the potential and probability of disruptions to storage and utilization facilities of the considered CCUS SCN in an uncertain environment. In the event of disruptions causing a loss of storage or utilization capacity in these facilities, this study proposes a tanker transfer strategy for quickly recovering the SCN. This involves the rapid transfer of CO2 to other functional storage or utilization facilities. The study aims to design and optimize a resilient CCUS SCN that can cope with potential disruptions by proposing a stochastic mixed-integer linear programming model. The network aims to manage the risk of facility disruption at the lowest possible SC cost while meeting CO2 reduction targets. It also aims to provide decision makers with a scientifically effective response plan to minimize the damage caused by disruption when it occurs.
This study is based on the following assumptions [42,43]:
  • Capture plants are considered to be located near emission sources to avoid the transportation of flue gas.
  • An emission source node can be linked to only one storage/utilization node (i.e., no branching is allowed), but a storage/utilization node can receive CO2 from multiple source nodes.
  • All the capture alternatives are considered to capture up to 90% of CO2 after flue gas capture and compression (at 15 Mpa).
  • The CO2 flow in the pipeline r, installed between emission source m and storage/utilization facility i, must be greater than a minimum volume (Krmin) but smaller than a maximal volume (Krmax), due to the technological requirements of pipeline r.
  • Pipelines are chosen as the sole option for CO2 transportation, and tanker trucks are for emergency transportation under risks.
  • In an uncertain environment, each storage/utilization facility has a certain probability to be damaged, resulting in a partial capacity loss.
  • The impact of disruptions on the supply chain is mainly reflected in the reductions in storage/utilization capacity.

3.2. Symbol Definition

The parameters and decision variables used in the mathematical formulation are listed in Table 1 and Table 2.

3.3. Mathematical Modeling

In this paper, the studied resilient CCUS SCND problem aims to minimize the total expected SC cost for all scenarios, including the network fixed investment cost associated with the first stage variables and the network operating cost associated with the second stage variables, while satisfying the constraints of facility location, transport capacity, flow balance and sequestration utilization capacity. As the objective function and problem constraints presented later in this study are linear, a two-stage stochastic MILP model is proposed for the considered problem.
The first stage incurs fixed costs for facility siting, which include establishing capture, sequestration and utilization facilities, as well as pipelines between sources and facilities. These costs can be formulated as Equation (1).
T F C = m M f m o v m + i N f i d x i + m M i N r R f m i r y m i r l m i
The costs of the second phase of capture, transport, storage and utilization, as well as the carbon tax, are given as Equation (2).
T P C = s S w s [ m M i N c o m z m i s + m M i N r R F m i r z m i s l m i + m M i N c d i z m i s + m M p ( K m o i N z m i s ) ]
Transit costs can be formulated as Equation (3).
T T C = s S w s ( i N j N c i j t i j s d i j )
Therefore, the total SC cost can be formulated as Equation (4).
T C = T F C + T P C + T T C
Thus, the objective function for the considered problem is given as Equation (5).
min T C
The following constraints are introduced. Constraint (6) ensures that the total amount of CO2 captured for storage/utilization must be greater than the minimum emission reduction target.
m M i N z m i s T min , s S .
Constraints (7) and (8) ensure that under disruption scenario s, the CO2 flow (zmis) transported through the pipeline between captured emission source m and storage/utilization facility i must be within the minimum and maximum limits for the pipeline with a radius of r if it is constructed between source s and facility i. That is, if ymir = 0, then no pipeline with a radius of r exists between the two points, and constraints (7) and (8) will force the flow zmis to be 0.
z m i s r R K r max y m i r , m M , i N , s S .
z m i s r R K r min y m i r , m M , i N , s S .
Constraint (9) ensures that under disruption scenario s, if source m is captured, then the CO2 volume captured from source m cannot exceed its maximum capture capacity due to the technological limits; otherwise (vm = 0), constraint (9) will force the flow zmis to be 0.
i N z m i s K m o ρ m v m , m M , s S .
Constraint (10) ensures that each source is connected to no more than one storage/utilization facility, with each connection having a unique pipeline radius.
i N r R y m i r 1 , m M .
Constraint (11) ensures that the 0–1 and related integer variables are well defined. Constraint (12) ensures that the amount of CO2 transported through the pipeline to facility i cannot exceed its maximum capacity.
z m i s B r R y m i r , m M , i N , s S .
m M z m i s K i d + B ( 1 x i ) , i N , s S .
Constraints (13) and (14) ensure that the two types of 0–1 decision variables are well defined.
r R y m i r v m , m M , i N .
r R y m i r x i , m M , i N .
Constraint (15) ensures that the total amount of CO2 transported to storage/utilization facility j from all emission sources and disrupted facilities under scenario s cannot exceed its maximum capacity. Constraint (16) means that when storage/utilization facility i is disrupted under scenario s, the total CO2 flow from emission sources to it does not exceed the sum of its remaining capacity, and the CO2 flows out from it to other storage/utilization facilities. Constraint (17) ensures that if gis or xi is equal to 0, that is, facility i is not disrupted under scenario s or is not open, then the CO2 flow out from it to other facilities is forced to be 0; if facility i is disrupted under scenario s and is open, then the total flow from it to other facilities may be equal to or greater than 0 but limited by constraints (15) and (16). Constraint (18) ensures that if facility j is not open, the CO2 flowing to it from other facilities is forced to be 0; otherwise, the latter is also limited by constraints (15) and (16).
m M z m j s + i N t i j s K j d + B ( 1 x j ) , i , j N , j i , s S .
m M z m i s K i d ( 1 α i s ) + j N \ i t i j s , i N , s S .
j N \ i t i j s B g i s x i , i N \ j , s S .
i N \ j t i j s B x j , j N \ i , s S .
Finally, constraints (19)–(23) define 0–1 decision variables and non-negative integer ones.
v m 0 , 1 , m M .
x i 0 , 1 , i N .
y i j r 0 , 1 , i N , j N , r R .
z m i s 0 , m M , i N , s S .
t i j s 0 , i N , j N , s S .

4. Case Study

To verify the validity of the proposed resilient CCUS SCND model, this section outlines a series of numerical experiments. It also presents a sensitivity analysis on the key parameters of the considered problem. Finally, the results of the numerical experiments are summarized and discussed, which are intended to provide some valuable implications for decision makers to deploy a cost-effective and resilient CCUS SCN in the context of unforeseen disruptions. In this section, our formulated single-objective SMILP model is coded in C++ and solved using the CPLEX12.8 solver. All experimental studies were performed on a laptop equipped with a 2.40 GHz CPU, 16 GB RAM, and Windows 10 system.

4.1. Data and Scenario Settings

In this paper, a case study (Zhang et al., 2020) from the northeastern region of China is used to validate the effectiveness of our proposed resilient CCUS SCND method [14]. This test case has 6 (M = 6) emission sources and 3 (N = 3) storage/utilization facilities. The parameter settings in the numerical experiments are as follows.
The relevant data for 6 emission sources m and 3 storage/utilization facilities i are shown in Table 3 and Table 4.
Next, Equation (24) is employed to calculate the distance dij between storage/utilization facility i and storage/utilization facility j. The distances between facilities are presented in Table 5 and Table 6.
d i j = cos ( L a t i ) × cos ( L a t j ) × cos ( L o n g j L o n g i ) + sin ( L a t i ) × sin ( L a t j ) , i N , j N , i j .
In terms of cost parameters, parameter p (i.e., carbon dioxide tax) is set as 50 USD/t according to a report published by the Global CCS Institute in 2023 [2], and parameter cij (i.e., the unit transfer cost for tanker trucks) is set as 0.2 USD/t/km according to the report published by the International Energy Agency in 2021 [44]. In accordance with Zhang et al. and Yue et al. [14,18], pipelines with a radius of 4 inches, 6 inches, 8 inches, 10 inches and 12 inches were selected. The corresponding transport capacity, investment cost and operation cost for each pipeline with radius r are detailed in Table 7.
Considering the uncertain environment of CCUS supply chains, this paper assumes that each storage/utilization facility has the possibility of damage and applies a scenario analysis method to simulate the facility disruption as well as the related capacity loss. Under such an assumption, two states exist in each storage/utilization facility: the normal state and partial disruption state. The degree of facility capacity loss resulting from disruptions is determined by the risk level and the degree of disruption. Assuming that only one storage/utilization facility is disrupted at any given time, four scenarios are generated. These include one normal scenario and three disruption scenarios in which just one storage/utilization facility is partially damaged. Considering the likelihood of CCUS supply chain disruptions, our numerical experiment sets a probability of 0.7 for the normal scenario, while the remaining disruption scenarios each have a probability of 0.3 divided by 3, which ensures that the sum probability of all the scenarios in the experiment is equal to 1.

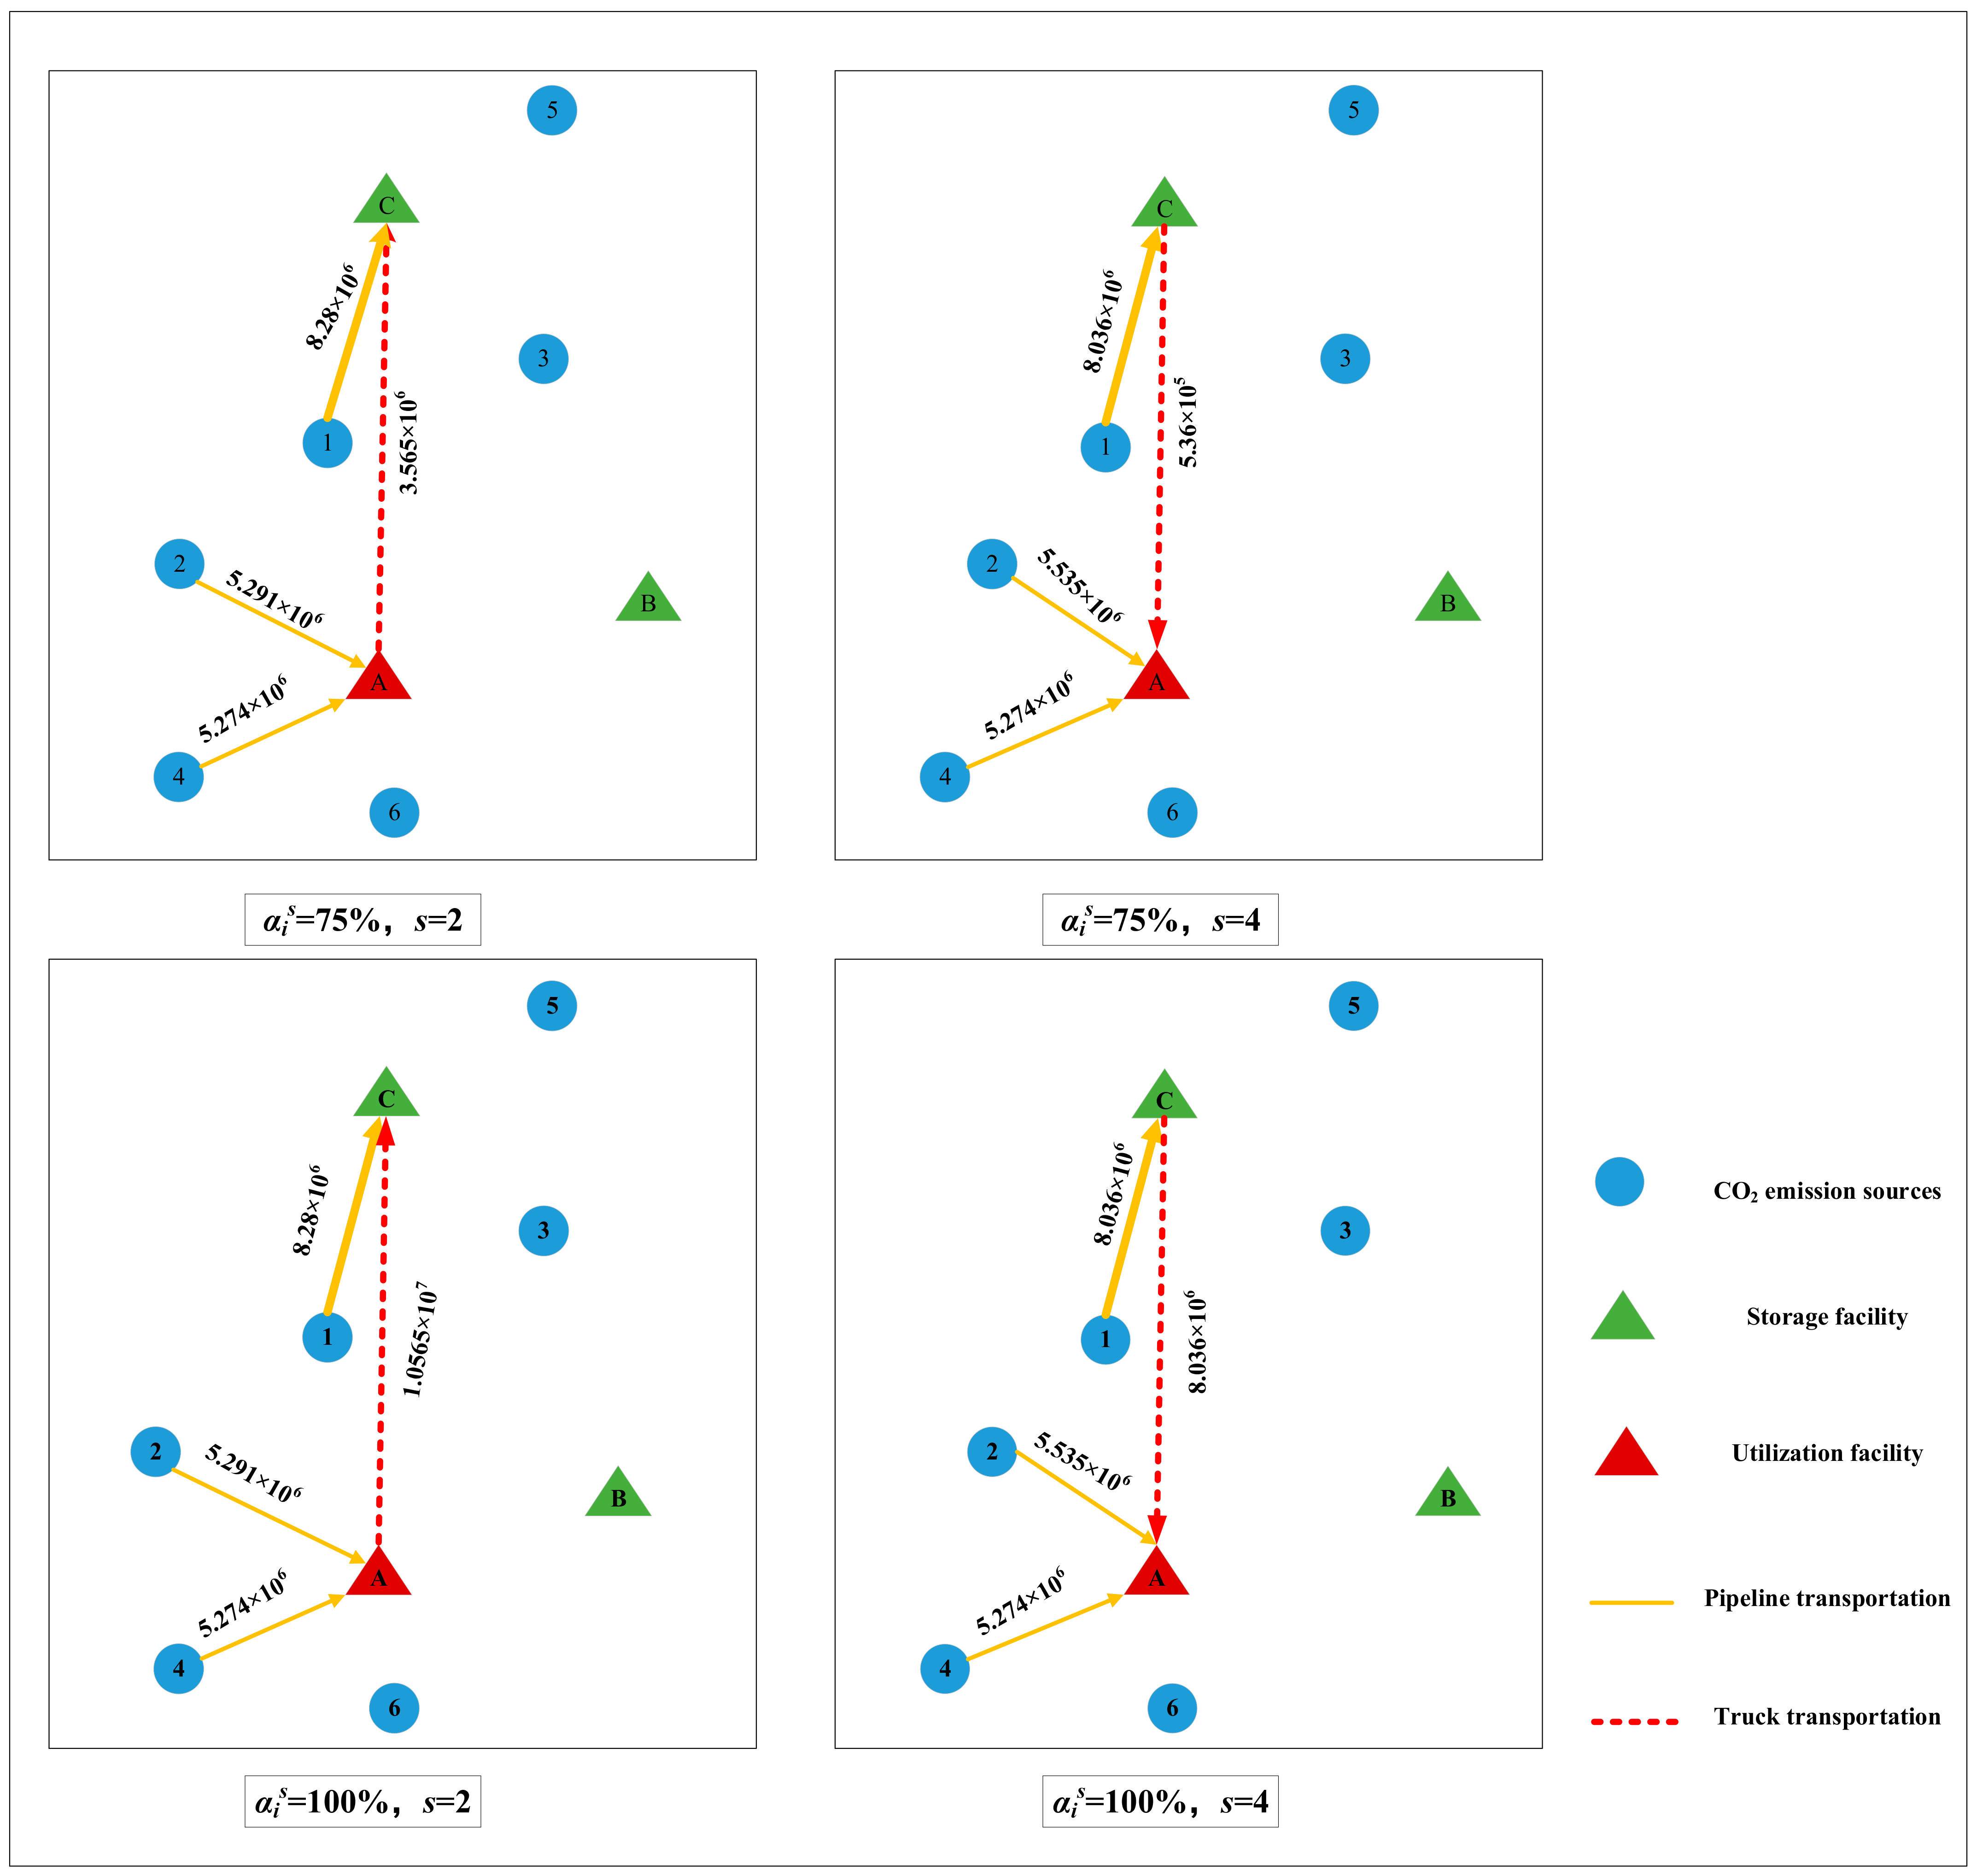
4.2. Results for the Case Study

In the context of achieving the emission target of a 50% reduction in CO2 emissions per year (i.e., 18.845 × 10⁶ t) [14], Figure 2 illustrates the results of our proposed resilient CCUS SCND model, considering various levels of capacity reduction resulting from potential facility disruptions.
As can be seen from Figure 2, as the damage degree of storage/utilization facilities caused by disruptions increases, the total expected cost for case study obtained by our proposed resilient CCUS SCND model increases from USD 3,882,680,000 (normal state) to USD 4,634,500,000 (100% failure or capacity loss), resulting in an increase of 19.36% in the SC cost. Specifically, when storage/utilization facility capacity losses (i.e., damage degrees) are between 0–30% and 40–60%, the total expected cost of the network remains unchanged or changes slightly; when the damage degree is in the range of 30–40%, there is a sharp increase in the total expected cost of the CCUS SCN. When the damage degree is in the range of 60–100%, the remaining capacity of the storage/utilization facility is insufficient, and the amount of CO2 that has to be transported continues to increase; therefore, the total expected cost shows a relatively slow increase.
Table 8 and Table 9 present the results for the CCUS network structures under the disruption risk concerning the damage degree of the storage/utilization facilities at 0–30% and 40–60%, respectively. The CCUS supply chain network structures and the CO2 flow between nodes remain relatively stable under such scenarios. In addition, no transshipment between the partially disrupted facility and other utilization/storage facilities is required, that is, it is less affected by facility disruption with αis = 0–30% and αis = 40–60%. From Table 8 and Table 9, it is evident that the amount of CO2 captured from sources 1, 2 and 4 remains the same for scenarios with damage degrees of 0–30% and 40–60%. However, the difference is that when the damage degree is 0–30%, the CO2 captured from source 1 is transported to utilization facility A, whereas when the damage degree is 40–60%, it is transported to sequestration facility C. This is due to the fact that as the damage degree increases, merely opening utilization facility A cannot meet the CO2 reduction target. Therefore, other new storage/utilization facilities need to be opened. As a result, sequestration facility C is opened, as it has more storage capacity, with relatively lower cost, and it is closer to source 1 than sequestration facility B.
As shown in Figure 3, the optimal SCN structures for the case study differ significantly when the damage degrees of the storage and use facilities are 30%, 35% and 40%. When the damage degree is not higher than 30%, only facility A is open for CO2 utilization; when the damage degree increases to 35%, the remaining utilization capacity of facility A cannot meet the need for CO2 reduction; thus, facility C, with a larger storage capacity, is chosen to be opened, and the CO2 emitted from source 2 is no longer captured, while the CO2 emitted from source 3, which is closer to storage facility C, is captured and transported to storage facility C through the pipeline with an 8-inch radius; the total expected cost increases from USD 3,882,680,000 to USD 4,117,400,000. When the damage degree increases to 40%, utilization facility A and sequestration facility C are both open in our proposed model; the CO2 emitted from source 1 is captured and transported to sequestration facility C through a pipeline with a radius of 12 inches, while the CO2 emitted from sources 2 and 4 is captured and transported to utilization facility A through a pipeline with a radius of 8 inches. The total expected cost of the supply chain network is USD 4,377,750,000.
Figure 4 shows the optimal network structure for the case study with a facility capacity disruption with a 65–70% damage degree. From Figure 4, we can see that utilization facility A and sequestration facility C are both open. The associated flows are given in Table 10. As shown in Table 10, when the damage degree of facility A is 65%, since the CO2 flow transported from emission sources 2 and 4 to facility A via the pipeline is 1.0565 × 10⁷ t, and due to the above-defined disruption, facility A thus cannot utilize 7.64999 × 10⁵ tons (10.565 × 10⁶–28 × 106 × 35%) of CO2. Therefore, our proposed stochastic optimization model suggests immediately transferring 7.64999 × 10⁵ tons of CO2 from utilization facility A to sequestration facility C via tanker trucks. From the last two columns of Table 10, we can see that when the damage degree of utilization facility A is increased to 70%, its remaining utilization capacity continues to decrease, resulting in 2.165 × 10⁶ t (10.565 × 10⁶–28 × 106 × 30%) CO2, which is transferred to storage facility C by tanker trucks.
Table 11 shows the optimal CCUS resilient SCN schemes and the CO2 volumes transported by pipelines and by tanker trucks under the damage degree of 75–100%, where CO2 emitted from sources 1, 2 and 4 is transported through pipelines with a 12-inch and 8-inch radius to storage facility C and utilization facility A, respectively. Since the optimization results show that there is no need to open storage facility B, the network structure remains the same as the normal state (s = 1) for the considered scenarios. However, when the capacities of utilization facility A (s = 2) and storage facility C (s = 4) are partially impaired, the CO2 volumes transported through pipelines from emission sources to storage/utilization facilities change, and the amount of CO2 transported to disrupted facility decreases due to the requirement of satisfying the CO2 reduction target, e.g., when the disruption results in a reduction in capacity of utilization facility A, the CO2 flow rate from emission source 2 to facility A decreases from 5.535 × 10⁶ t to 5.291 × 10⁶ t. When the disruption causes a reduction in capacity of storage facility C, the CO2 flow transported from emission source 1 to facility C is reduced from 8.28 × 10⁶ t to 8.036 × 10⁶ t.
Table 12 and Figure 5 present the detailed results for the case study obtained by our model under the disruption scenarios, with the facility capacity damage degree αis set at 75% and 100%. From Table 12 and Figure 5, we can observe that for all cases, the CO2 transit activities only occur between utilization facility A and sequestration facility C, that is, a certain amount of CO2 is transported by tanker trucks either from the former (with partial capacity reduction) to the latter or from the latter to the former (with partial capacity reduction). For example, if there is a disruption in facility A (i.e., s = 2), and its capacity damage degree is in the range of 75–100%, the amount of CO2 transferred from it to facility C increases from 3.565 × 10⁶ t (10.565 × 10⁶–28 × 106 × 25%) to 1.0565 × 10⁷ t; as for s = 4, the amount of CO2 transferred from the partially disrupted facility C to the normal facility A increases from 5.36 × 10⁵ t (8.036 × 10⁶–30 × 106 × 25%) to 8.036 × 10⁶ t. Our explanation for the above observation is that facility B is not open in any of the cases according to our proposed model. This implies that opening facility B is not a globally cost-effective or optimal choice for the considered disruption scenarios, even though it is relatively closer to facility A than C. This result is basically consistent with the data given in Table 3, Table 4, Table 5 and Table 6, from which we can see that although facility B is closer to facility A and to most emission sources than facility C, facility C generally has greater advantages than facility B in terms of (greater) CO2 storage capacity, (lower) fixed investment and utilization costs. This means that distances between sources/facilities have a weaker impact on the SCN structure for the case study, and cost-related parameters show a greater impact. This is mainly due to the structural properties of the defined objective function in our proposed model.
Based on the above works, we can conclude that the model proposed for the optimal design of the resilient CCUS supply chain network problem under facility disruption is effective in terms of solution quality. Our proposed resilient CCUS SCND model could help SC managers build more cost-effective and resilience networks, with a strong ability to recover from facility disruption risks.

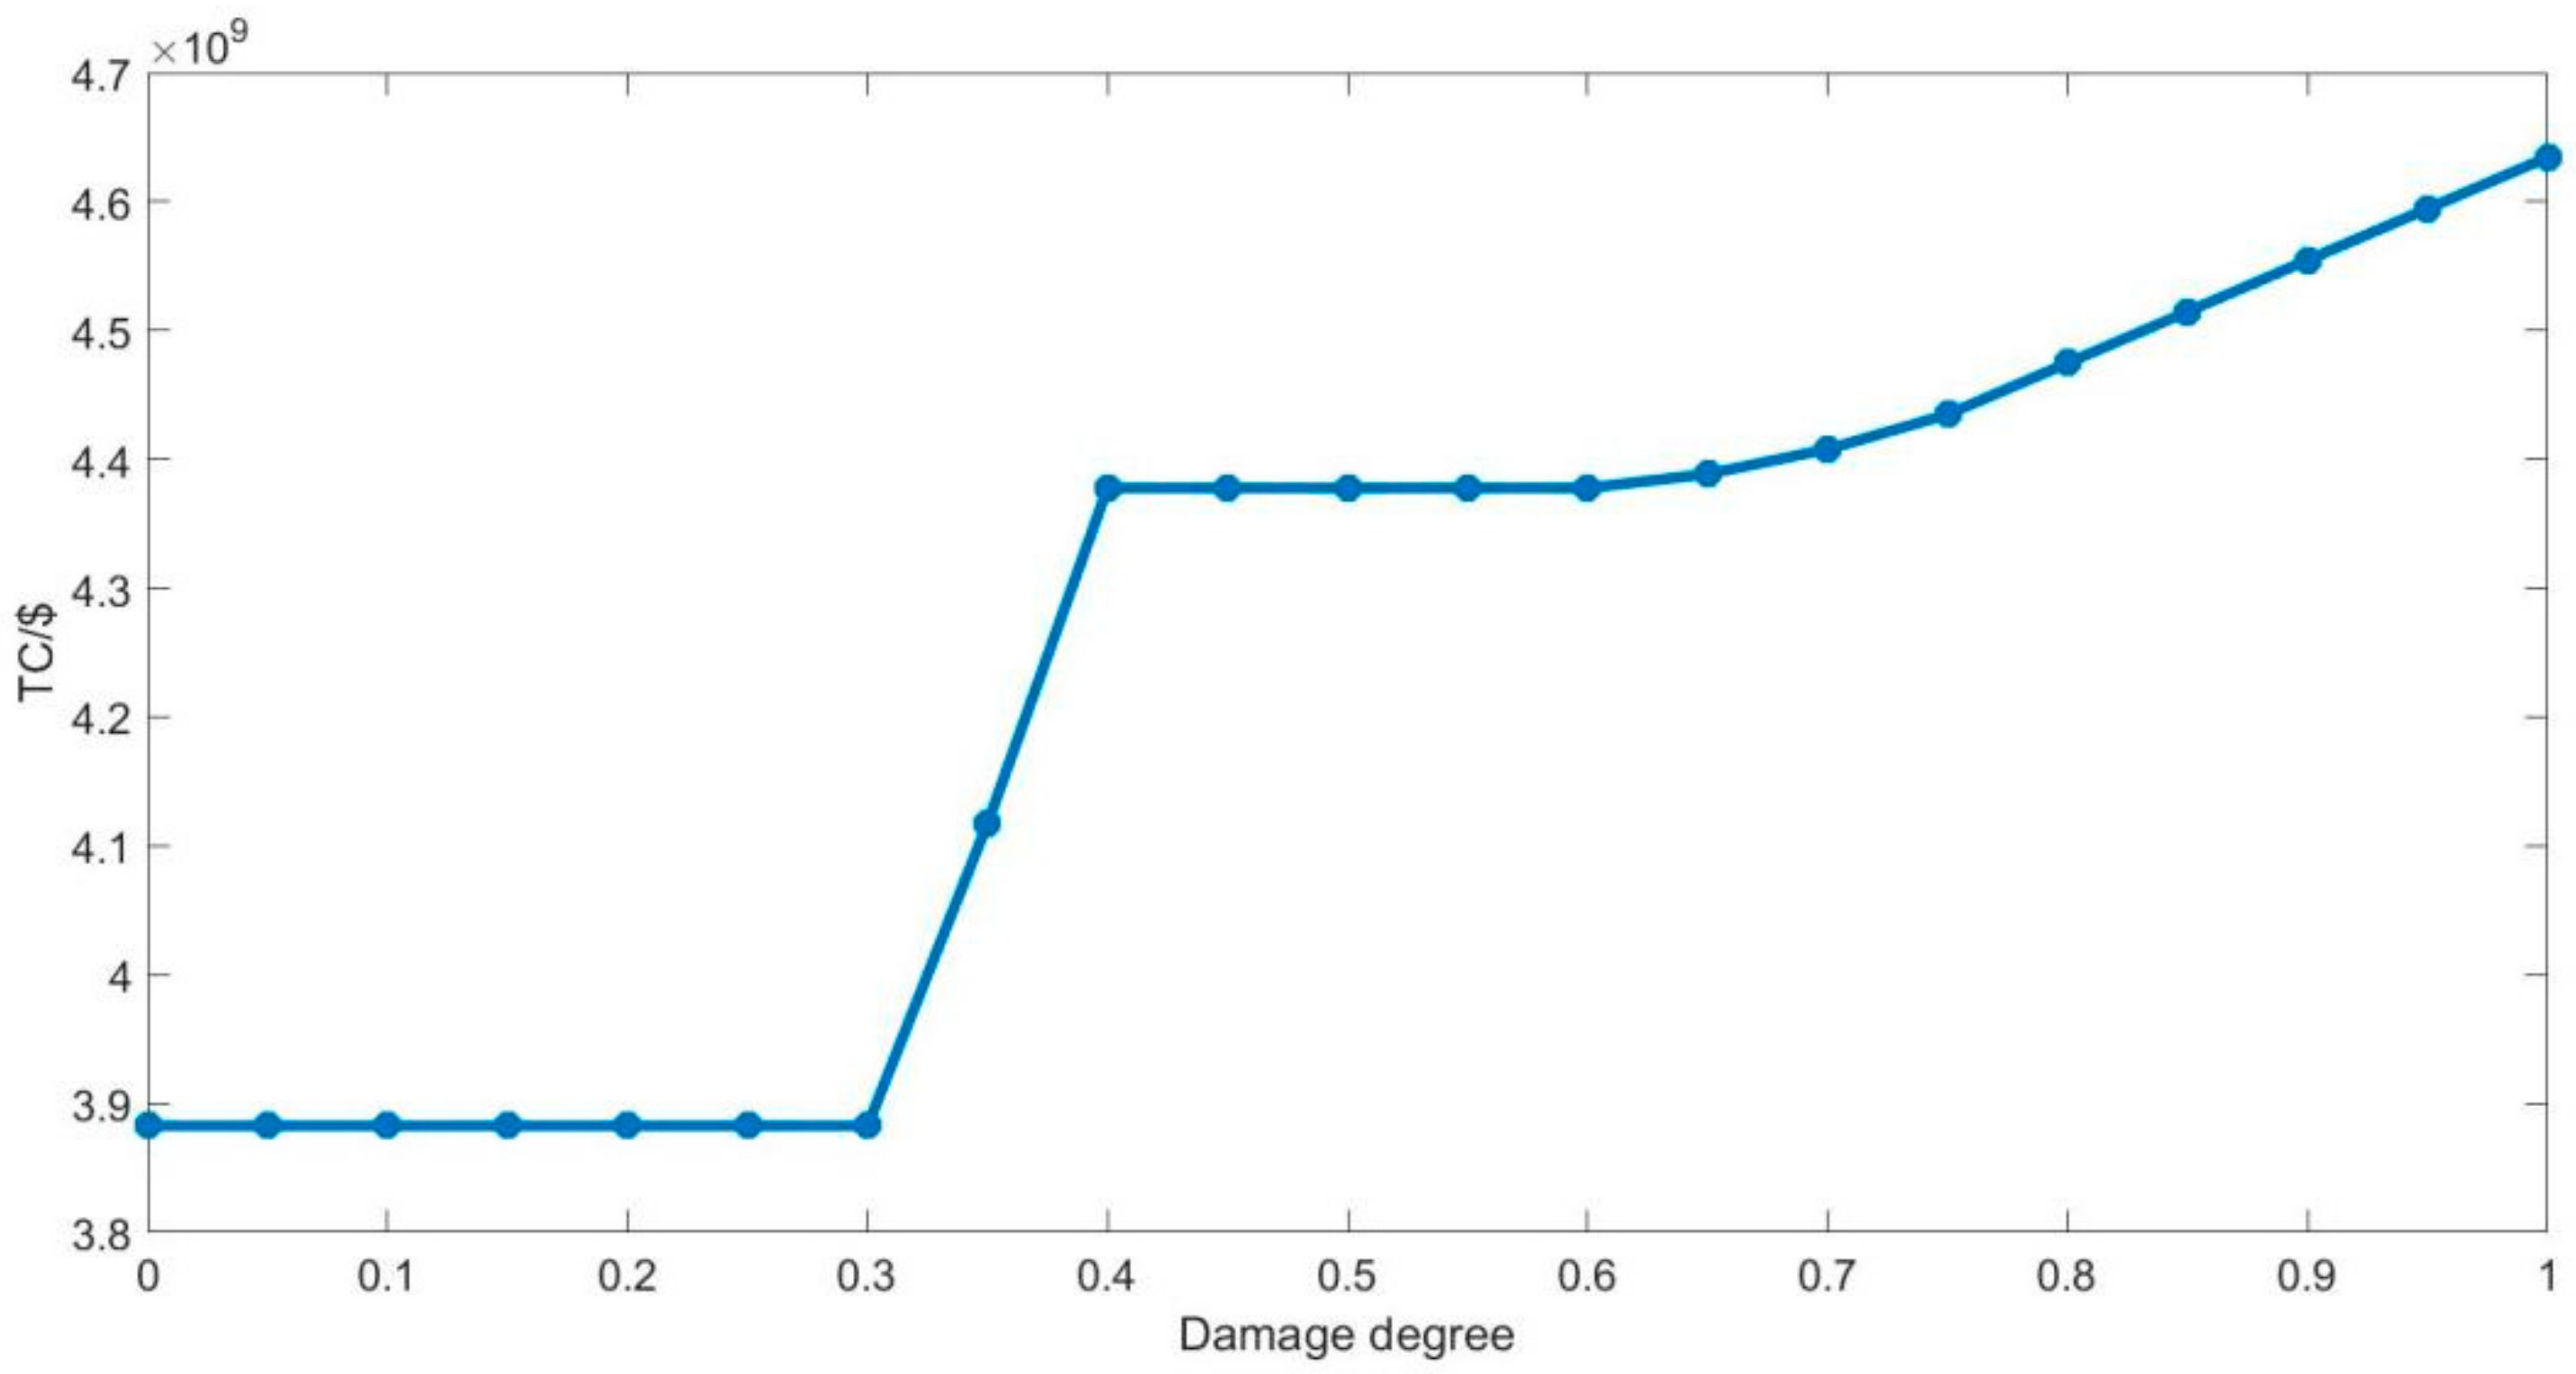
4.3. Sensitivity Analysis

In this section, we outline the sensitivity analysis of the case study. To be specific, we mainly discuss the impact of parameter p (i.e., carbon dioxide tax) on the total CCUS SC cost and the total amount of captured CO2, due to the fact that carbon trading policies are generally designed based on these factors. That is, the relationships among the CCUS SCN cost (including CO2 capture cost), the carbon tax p and the CO2 reduction target (which relates to the total amount of captured CO2) need to be explored, as they are highly relevant to general carbon trading policies.
Figure 6 reports the trends of total CCUS SC cost and the total amount of captured CO2 with different parameter p values. Specifically, parameter p is set as 10, 20, 30, … 60. The detailed computational results are presented in Figure 6. As can be seen from Figure 6, as parameter p increases from 10 USD/t to 60 USD/t, the total CCUS SCN cost increases continuously from USD 3,130,250,000 to USD 4,068,690,000, leading to about a 32% increase in total CCUS SC cost. This shows that parameter p has a large impact on the total CCUS SCN cost. In addition, we can see from Figure 6 that if the value of parameter p is not higher than 45 USD/t, the amount of captured CO2 (which is transported to storage/utilization facilities) remains unchanged while meeting the CO2 reduction target, i.e., Tmin = 18.845 × 10⁶ t. But, if the value of parameter p is higher than 45 USD/t, then the unit cost of CO2 for storage/utilization is lower than the value of the tax required to be paid for the release of CO2 into the atmosphere, thus the amount of captured CO2 increases to 19.089 × 10⁶ t, which is a little higher than the required CO2 reduction target. From these results, we can conclude that setting suitably higher carbon taxes could encourage companies to actively reduce CO2 emissions without a significant increase in total cost, with minimal impact on the total cost increases, while relatively lower carbon taxes may not push companies to reduce CO2 emissions, as under such settings, the cost is sensitive to the changes in carbon taxes; a small increase in carbon tax may lead to a relatively greater increase in the total SC cost, which may have a negligible influence on the reduction of CO2 emissions.
From above observations, we can establish some managerial and policy implications. On one hand, our proposed CCUS SCND model could be easily adopted by CCUS SC decision makers or managers to develop more effective and highly flexible supply chain networks under facility disruptions. On the other hand, the relationships among the carbon tax, the total cost and the total amount of capture of CO2 are complex and possibly non-linear. Note that the existing carbon tax policies are stable to some extent but have poor flexibility. Therefore, it is suggested for policymakers to design adaptive carbon pricing mechanisms (for example, dynamic pricing or differential pricing) to guide or motivate enterprises to reduce their environmental effluents as much as they can. It is easy to see that all participants (such as government, emission producers and CCUS project managers) could benefit a lot in different aspects from applying our proposed novel model.

5. Conclusions

Most of the previous studies considered only the environmental or economic aspects of a CCUS SCN, but little has been done to address the optimal design of resilient CCUS supply chains in the context of facility disruptions. Utilization/storage facility disruption is one of the most unpredictable and important risks in CCUS supply chains and has a significant impact on the performance of the latter. In this work, a resilient CCUS supply chain network design addressing planning problems under unforeseen facility disruption risks has been established. To effectively mitigate both the utilization and storage facility capacity disruption and guarantee the CCUS supply chain resilience under different unexpected disruption scenarios, an effective resilience strategy (i.e., transshipment from a disrupted facility to a normal or newly open facility, if necessary) is suggested, which bridges the research gap in resilient CCUS SCN research and enriches work in the resilient SCND field. A novel CCUS SCND resilient model was developed for optimal cost-effective and resilient solutions to the considered problem. This work provides a novel approach for CCUS SCND problems with utilization or storage facility capacity disruption or uncertainty, making the proposed model more adaptable to real conditions. At the same time, we performed a sensitivity analysis of parameter p, which may help policymakers establish a reasonable and flexible pricing policy (tax) on carbon dioxide emissions. Finally, computational results on a real CCUS SCND case study from Northeastern China were established to verify the effectiveness and efficiency of our suggested resilience strategy and the developed model, and showed that our proposed approach could be easily used by CCUS supply chain managers to design a more cost-effective and resilient network, with strong resilience capability to various unforeseen disruption events, which could provide constructive insights for government to implement the CCUS system nationwide under uncertainty.
In future, our work can be extended in the following aspects. First, it is very valuable to consider multiple disruption events and propose various resilience strategies at the same time, such as the partial loss of capture capacity at more than one facility as well as pipeline capacity disruptions. In addition, as the considered problem under various disruptions is NP-hard, it is desirable to propose effective heuristic approaches to solve the problems on a large scale.

Author Contributions

Conceptualization, W.L. and W.Z.; methodology, W.L., W.Z. and J.Z.; software, W.L. and W.Z.; validation, W.L., W.Z. and J.Z.; formal analysis, W.L. and W.Z.; writing—original draft preparation, W.L. and W.Z.; writing—review and editing, W.L., W.Z. and J.Z.; supervision, W.L. All authors have read and agreed to the published version of the manuscript.

Funding

This research was supported by the “Innovation Capability Support Plan” project of Shaanxi Province in 2024 (2024ZC-YBXM-128), the Natural Science Basic Research Plan in Shaanxi Province of China (2024JC-YBQN-0749), the Humanity and Social Science Youth Foundation of the Ministry of Education of China (23XJCZH016), and the China Postdoctoral Science Foundation (2023M733068).

Institutional Review Board Statement

Not applicable.

Informed Consent Statement

Not applicable.

Data Availability Statement

Data are contained within the article.

Acknowledgments

We are very grateful to the reviewers for their valuable comments, which greatly improved the quality of our manuscript.

Conflicts of Interest

The authors declare no conflicts of interest.

References

  1. Lee, H.; Romero, J. Summary for policymakers. In Climate change 2023: Synthesis Report; IPCC: Geneva, Switzerland, 2023; pp. 1–34. [Google Scholar]
  2. Zhang, X.; Yang, X.; Lu, X. China Carbon Dioxide Capture, Utilisation and Storage (CCUS) Annual Report (2023); The administrative center for China’s agenda 21; Global CCS Institute, Tsinghua University: Beijing, China, 2023. [Google Scholar]
  3. Ghosh, S.; Mandal, M.; Ray, A. A PDCA based approach to evaluate green supply chain management performance under fuzzy environment. Int. J. Manag. Sci. Eng. Manag. 2023, 18, 1–15. [Google Scholar] [CrossRef]
  4. Ying, G.; Zhuo, F.; Shuibo, Z. Managing supply chain resilience in the era of VUCA. Front. Eng. 2021, 8, 465–470. [Google Scholar]
  5. Wei, Y.; Kang, J.; Liu, L.; Li, Q.; Wang, P.; Hou, J.; Liang, Q.; Liao, H.; Huang, S.; Yu, B. A proposed global layout of carbon capture and storage in line with a 2 °C climate target. Nat. Clim. Chang. 2021, 11, 112–118. [Google Scholar] [CrossRef]
  6. Chung, W.; Lim, H.; Lee, J. Computer-aided identification and evaluation of technologies for sustainable carbon capture and utilization using a superstructure approach. J. CO2 Util. 2022, 61, 102032. [Google Scholar] [CrossRef]
  7. Presser, D.; Cafaro, V.; Cafaro, D. Optimal sourcing, supply and development of carbon dioxide networks for enhanced oil recovery in CCUS systems. Comput. Aided Chem. Eng. 2022, 49, 493–498. [Google Scholar]
  8. Ahn, Y.; Han, J. A stochastic programming approach for the integrated network with utility supply and carbon dioxide mitigation systems in uncertain utility demand. Energy Convers. 2018, 176, 299–308. [Google Scholar] [CrossRef]
  9. Li, Y.; Wei, J.; Yuan, Z.; Chen, B.; Gani, R. Sustainable synthesis of integrated process, water treatment, energy supply, and CCUS networks under uncertainty. Comput. Chem. Eng. 2022, 157, 107636. [Google Scholar] [CrossRef]
  10. Lainez-Aguirre, J.; Perez, F.; Puigjaner, L. Economic evaluation of bio-based supply chains with CO2 capture and utilisation. Comput. Chem. Eng. 2016, 102, 213–225. [Google Scholar] [CrossRef]
  11. D’Amore, F.; Mocellin, P.; Vianello, C.; Maschio, G.; Bezzo, F. Towards the economic optimisation of European supply chains for CO2 capture, transport and sequestration, including societal risk analysis. Comput. Aided Chem. Eng. 2018, 44, 2305–2310. [Google Scholar]
  12. Ostovari, H.; Mueller, L.; Mayer, F.; Bardow, A. A climate-optimal supply chain for CO2 capture, utilization, and storage by mineralization. J. Clean. Prod. 2022, 360, 131750. [Google Scholar] [CrossRef]
  13. Roh, K.; Al-Hunaidy, A.; Imran, H.; Lee, J. Optimization-based identification of CO2 capture and utilization processing paths for life cycle greenhouse gas reduction and economic benefits. AIChE J. 2019, 65, 16580. [Google Scholar] [CrossRef]
  14. Zhang, S.; Zhuang, Y.; Liu, L.; Zhang, L.; Du, J. Risk management optimization framework for the optimal deployment of carbon capture and storage system under uncertainty. Renew. Sust. Energ. Rev. 2019, 113, 109280. [Google Scholar] [CrossRef]
  15. Cristiu, D.; D’Amore, F.; Mocellin, P.; Bezzo, F. Optimizing carbon capture and sequestration chains from industrial sources under seismic risk constraints. Chem. Eng. Trans. 2022, 96, 85–90. [Google Scholar]
  16. Lee, S.; Lee, I.; Han, J. Design under uncertainty of carbon capture, utilization and storage infrastructure considering profit, environmental impact, and risk preference. Appl. Energy 2019, 238, 34–44. [Google Scholar] [CrossRef]
  17. Yue, D.; You, F. Integration of geological sequestration and microalgae biofixation supply chains for better greenhouse gas emission abatement. Chem. Eng. Trans. 2015, 45, 487–492. [Google Scholar]
  18. Yue, D.; Gong, J.; You, F. Synergies between geological sequestration and microalgae biofixation for greenhouse gas abatement: Life cycle design of carbon capture, utilization, and storage supply chains. ACS Sustain. Chem. Eng. 2015, 3, 841–861. [Google Scholar] [CrossRef]
  19. Morbee, J.; Serpa, J.; Tzimas, E. Optimised deployment of a European CO2 transport network. Int. J. Greenh. Gas Control 2012, 7, 48–61. [Google Scholar] [CrossRef]
  20. Abdoli, B.; Hooshmand, F.; MirHassani, S. A novel stochastic programming model under endogenous uncertainty for the CCS-EOR planning problem. Appl. Energy 2023, 338, 120605. [Google Scholar] [CrossRef]
  21. Han, J.; Lee, I. A Comprehensive infrastructure assessment model for carbon capture and storage responding to climate change under uncertainty. Ind. Eng. Chem. Res. 2013, 52, 3805–3815. [Google Scholar] [CrossRef]
  22. He, Y.; Zhang, Y.; Ma, Z.; Sahinidis, N.; Tan, R.; Foo, D. Optimal source-sink matching in carbon capture and storage systems under uncertainty. Ind. Eng. Chem. 2014, 53, 778–785. [Google Scholar] [CrossRef]
  23. D’Amore, F.; Bezzo, F. Economic optimisation of European supply chains for CO2 capture, transport and sequestration. Int. J. Greenh. Gas Control 2017, 65, 99–116. [Google Scholar] [CrossRef]
  24. Kegl, T.; Uek, L.; Kralj, A.; Kravanja, Z. Conceptual MINLP approach to the development of a CO2 supply chain network-simultaneous consideration of capture and utilization process flowsheets. J. Clean. Prod. 2021, 314, 128008. [Google Scholar] [CrossRef]
  25. Rice, J.; Caniato, F. Building a secure and resilient supply network. Supply Chain. Manag. Rev. 2003, 7, 22–30. [Google Scholar]
  26. Christopher, M.; Peck, H. Building the resilient supply chain. Int. J. Logist. Manag. 2004, 15, 1–13. [Google Scholar] [CrossRef]
  27. Ponomarov, S.; Holcomb, M. Understanding the concept of supply chain resilience. Int. J. Logist. Manag. 2009, 20, 124–143. [Google Scholar] [CrossRef]
  28. Cardoso, S.; Barbosa-Póvoa, A.; Relvas, S.; Novais, A. Resilience metrics in the assessment of complex supply-chains performance operating under demand uncertainty. Omega 2015, 56, 53–73. [Google Scholar] [CrossRef]
  29. Fahimnia, B.; Jabbarzadeh, A. Marrying supply chain sustainability and resilience: A match made in heaven. Transp. Res. E-Log. 2016, 91, 306–324. [Google Scholar] [CrossRef]
  30. Jabbarzadeh, A.; Fahimnia, B.; Sabouhi, F. Resilient and sustainable supply chain design: Sustainability analysis under disruption risks. Prod. Res. 2018, 56, 5945–5968. [Google Scholar] [CrossRef]
  31. Kaur, H.; Singh, S.; Garza-Reyes, J.; Mishra, N. Sustainable stochastic production and procurement problem for resilient supply chain. Comput. Ind. Eng. 2020, 139, 105560. [Google Scholar] [CrossRef]
  32. Goldbeck, N.; Angeloudis, P.; Ochieng, W. Optimal supply chain resilience with consideration of failure propagation and repair logistics. Transp. Res. E-Log. 2020, 133, 101830. [Google Scholar] [CrossRef]
  33. Namdar, J.; Torabi, S.; Sahebjamnia, N.; Pradhan, N. Business continuity-inspired resilient supply chain network design. Int. J. Prod. Res. 2021, 59, 1331–1367. [Google Scholar] [CrossRef]
  34. Yazdi, A.; Mehdiabadi, A.; Wanke, P.; Monajemzadeh, N.; Correa, H.; Tan, Y. Developing supply chain resilience: A robust multi-criteria decision analysis method for transportation service provider selection under uncertainty. Int. J. Manag. Sci. Eng. Manag. 2023, 18, 51–64. [Google Scholar]
  35. Khalili, S.; Jolai, F.; Torabi, S. Integrated production-distribution planning in two-echelon systems: A resilience view. Int. J. Prod. Res. 2017, 55, 1040–1064. [Google Scholar] [CrossRef]
  36. Meng, H. Design of elastic supply chain network based on interruption response. Logist. Technol. 2018, 37, 110–114. [Google Scholar]
  37. Zhao, S.; You, F. Resilient supply chain design and operations with decision- dependent uncertainty using a data-driven robust optimization. AIChE J. 2019, 65, 1006–1021. [Google Scholar] [CrossRef]
  38. Yavari, M.; Zaker, H. Designing a resilient-green closed loop supply chain network for perishable products by considering disruption in both supply chain and power networks. Comput. Chem. Eng. 2020, 134, 106680. [Google Scholar] [CrossRef]
  39. Shi, H.; Ni, Y. Multiple strategies for supply chain to recover from major disruptions. J. Intell. Fuzzy Syst. 2021, 40, 9669–9686. [Google Scholar] [CrossRef]
  40. Gabrielli, P.; Campos, J.; Becattini, V.; Mazzotti, M.; Sansavini, G. Optimization and assessment of carbon capture, transport and storage supply chains for industrial sectors: The cost of resilience. Int. J. Greenh. Gas Control 2022, 121, 103797. [Google Scholar] [CrossRef]
  41. Liu, S.; Zeng, Y.; Li, Y. A resilient coal supply chain network design model considering carbon emissions. J. Chongqing Norm. Univ. Nat. Sci. Ed. 2023, 40, 34–43. [Google Scholar]
  42. Zhang, S.; Zhang, Y.; Tao, R.; Liu, L.; Zhang, L.; Du, J. Multi-objective optimization for the deployment of carbon capture utilization and storage supply chain considering economic and environmental performance. J. Clean. Prod. 2020, 270, 122481. [Google Scholar] [CrossRef]
  43. Santibañez-Gonzalez, E. A modelling approach that combines pricing policies with a carbon capture and storage supply chain network. J. Clean. Prod. 2017, 167, 1354–1369. [Google Scholar] [CrossRef]
  44. IEA. An Energy Sector Roadmap to Carbon Neutrality in China; IEA: Paris, France, 2021. [Google Scholar]
Figure 1. Illustration of typical CCUS supply chain networks.
Sustainability 16 02621 g001
Figure 2. Total costs and different levels of damage (i.e., capacity loss) for the case study.
Sustainability 16 02621 g002
Figure 3. Illustration of CCUS SCN schemes for αis = 30–40%.
Sustainability 16 02621 g003
Figure 4. Illustration of CCUS SCN scheme for αis = 65–70%.
Sustainability 16 02621 g004
Figure 5. Illustration of CCUS SCN schemes for αis = 75% and αis = 100%.
Sustainability 16 02621 g005
Figure 6. Trends of the total SC cost and the total amount of captured CO2 with p =10–60 USD/t.
Sustainability 16 02621 g006
Table 1. Parameters in the mathematical modeling.
SymbolDefinition
MSet of all sources of CO2 emissions, indexed by m.
NSet of all candidate facilities that can store/utilize CO2, indexed by i.
RSet of all alternative pipes r, characterized by their radius (capacities) (inch).
SSet of all possible disruption scenarios, indexed by s.
|M|Total number of emission sources.
|N|Total number of storage/utilization facilities.
TminMinimum target overall carbon dioxide reduction (ton/year).
KrmaxThe maximum flow operating capacity of tube r (ton/year).
KrminThe minimum flow operating capacity of tube r (ton/year).
KmoThe capture capacity of each source m (ton).
KidThe capacity of storage/utilization facility i (ton).
ρmThe efficiency factor (between 0 and 1) of the CO2 capture plant installed at source m.
fmoThe cost of capturing CO2 from source m (USD).
fidThe cost of operating and injecting CO2 into the storage/utilization facility i (USD).
fmirThe installation cost of the tube r between emission source m and storage/utilization facility i (USD/ton).
comThe cost of capturing CO2 from source m (USD/ton).
cdiThe cost of operating and injecting CO2 into the storage/utilization facility i (USD/ton).
FmirThe unit transport cost of a pipeline of radius r between emission source m and storage/utilization facility i (USD/ton/km).
cijThe unit transfer cost for tanker trucks between storage/utilization facility i and storage/utilization facility j (USD/ton/km).
LatiLatitude of storage/utilization facility i.
LongiLongitude of storage/utilization facility i.
lmiDistance between emission source m and storage/utilization facility i (km).
dijDistance between storage/utilization facility i and storage/utilization facility j (km).
pCarbon dioxide tax (USD/ton).
gisThe status of the storage/utilization facility i for scenario s.
If CO2 storage/utilization facility i is disrupted under scenario s, then gis = 1; otherwise, gis = 0.
αisDamage degree of facility capacity under scenario s.
wsProbability of scenario s.
Table 2. Decision variables in the mathematical modeling.
SymbolDefinition
vmIf a CO2 capture plant m is open, then vm = 1; otherwise, vm = 0.
xiIf a CO2 storage/utilization facility i is open, then xi = 1; otherwise, xi = 0.
ymirIf a pipeline with tube type (radius) r is constructed between m and i, then ymir = 1; otherwise, ymir = 0.
zmisThe CO2 flow between source m and facility i for scenario s (ton/year).
tijsThe CO2 flow transferred between facility i and facility j for scenario s (ton/year).
The binary variable vm is used to determine whether CO2 emitted from source m is captured or not, xi is used to determine whether facility i is open or not, ymir is used to determine whether the pipeline is established or not and integer variables zmis and tijs are used to determine the CO2 flow between facilities under disruption scenario s.
Table 3. Data related to emission sources for the case study [14].
CO2 Emission SourcesCO2 Emissions/t/YearInvestment/USDCapture Costs/USD/t
Source 19.20 × 106250.17 × 10730.28
Source 26.15 × 106173.92 × 10723.78
Source 35.90 × 106182.82 × 10723.19
Source 45.86 × 106168.80 × 10723.10
Source 55.58 × 106165.78 × 10722.43
Source 65.00 × 106151.81 × 10721.12
Table 4. Data related to storage/utilization facilities for the case study [14].
Storage/
Utilization Facility i
(Longi, Lati)TypeCapacity/tInvestment/USDSequestration/Utilization Costs/USD/t
A(120.36, 42.61)Oilfields28 × 10640 × 10712
B(122.14, 46.52)Saline Aquifer20 × 10666 × 1078
C(128.51, 44.48)Saline Aquifer30 × 10650 × 1075
Table 5. Distance lmi between emission source m and storage/utilization facility i [14].
Distance lmi/kmABC
Source 1285.0483.9447.4
Source 2273.6648.0653.9
Source 3626.4363.3218.3
Source 4166.3616.4820.9
Source 5921.8701.9245.3
Source 6173.1412.9787.4
Table 6. Distance dij between storage/utilization facility i and j.
Distance dij/kmABC
A0457.0688.6
B457.00545.6
C688.6545.60
Table 7. Types of pipeline tubes, capacities and costs for the case study [14,18].
Tube Radius/in4681012
Capacity (min)/t/y0.43 × 1060.9 × 1062.6 × 1065.49 × 1069.81 × 106
Capacity (max)/t/y1.13 × 1063.25 × 1066.86 × 10612.26 × 10619.69 × 106
Investment cost/USD/km42.44 × 10395.50 × 103169.79 × 103265.29 × 103382.02 × 103
Operating cost/USD/km/t2.0 × 10−31.8 × 10−31.4 × 10−31.2 × 10−31.0 × 10−3
Table 8. CCUS SCN scheme for αis = 0–30% and carbon dioxide flow.
CO2 Emission SourcesStorage/Utilization FacilitiesTube Radius/inTube Flow zmis/t
Source 1A128.28 × 106
Source 2A85.535 × 106
Source 4A85.274 × 106
Table 9. CCUS SCN scheme for αis = 40–60% and carbon dioxide flow.
CO2 Emission SourcesStorage/Utilization FacilitiesTube Radius/inTube Flow zmis/t
Source 1C128.28 × 106
Source 2A85.535 × 106
Source 4A85.274 × 106
Table 10. CCUS SCN scheme for αis = 65–70% and carbon dioxide flow for each scenario.
Tube
Connection
Tube
Radius/in
Tube Flow zmis/tTransshipment Flow tijs/t
65%70%
s = 1s = 2s = 3s = 4s = 2s = 2
1-C128.28 × 1068.28 × 1068.28 × 1068.28 × 106A–C
764,999
A–C
2.165 × 10⁶
2-A85.535 × 1065.291 × 1065.535 × 1065.535 × 106
4-A85.274 × 1065.274 × 1065.274 × 1065.274 × 106
Table 11. CCUS SCN scheme for αis = 75–100% and carbon dioxide flow for each scenario.
Tube
Connection
Tube Radius/inTube Flow zmis/t
s = 1s = 2s = 3s = 4
1-C128.28 × 1068.28 × 1068.28 × 1068.036 × 106
2-A85.535 × 1065.291 × 1065.535 × 1065.535 × 106
4-A85.274 × 1065.274 × 1065.274 × 1065.274 × 106
Table 12. Carbon dioxide transshipment flow for each scenario under αis = 75–100%.
Damage Degree αisScenarios sTransshipmentTransshipment Flow tijs/t
75%s = 2A-C3.565 × 106
s = 4C-A5.36 × 105
80%s = 2A-C4.965 × 106
s = 4C-A2.036 × 106
85%s = 2A-C6.365 × 106
s = 4C-A3.536 × 106
90%s = 2A-C7.765 × 106
s = 4C-A5.036 × 106
95%s = 2A-C9.165 × 106
s = 4C-A6.536 × 106
100%s = 2A-C1.0565 × 107
s = 4C-A8.036 × 106
Disclaimer/Publisher’s Note: The statements, opinions and data contained in all publications are solely those of the individual author(s) and contributor(s) and not of MDPI and/or the editor(s). MDPI and/or the editor(s) disclaim responsibility for any injury to people or property resulting from any ideas, methods, instructions or products referred to in the content.

