Article

A Sustainable Water Resources Management Assessment Framework (SWRM-AF) for Arid and Semi-Arid Regions—Part 1: Developing the Conceptual Framework

by
Badir S. Alsaeed
1,2,*,
Dexter V. L. Hunt
1 and
Soroosh Sharifi
1
1
Department of Civil Engineering, School of Engineering, University of Birmingham, Edgbaston, Birmingham B15 2TT, UK
2
Department of Civil Engineering, College of Engineering, Qassim University, Buraydah 52571, Saudi Arabia
*
Author to whom correspondence should be addressed.
Sustainability 2024, 16(7), 2634; https://doi.org/10.3390/su16072634
Submission received: 30 January 2024 / Revised: 6 March 2024 / Accepted: 15 March 2024 / Published: 22 March 2024

Abstract

:
The evaluation of water resources management practices is essential for water usage decisions in regions with limited water resources. The literature provides numerous assessment frameworks, but many ignore the unique characteristics and conditions of some special arid and semi-arid regions, such as the Gulf Cooperation Council (GCC) countries, which lack any permanent rivers or lakes. Thus, this study, the first in a two-part series, seeks to develop a conceptual Sustainable Water Resources Management Assessment Framework (SWRM-AF). General and particular criteria explain how components and indicators were identified. The conceptual SWRM-AF provided here has four components (environment, economy, society, and infrastructure) and 24 indicators. Almost every indicator has been selected from the literature and is briefly explained and justified. This research presents, possibly for the first time, clear and straightforward directions for evaluating each indicator in colour-coded tables. To create a more holistic framework for arid and semi-arid regions, social indicators like “intervention acceptability” and environmental indicators for assessing the impacts of desalination treatment plants have been added to form a unique framework applicable to such regions. Therefore, the components and indicators of conceptual SWRM-AF could work collectively to aid the process of decision-making. The next phase is validating this framework using a participatory approach.

1. Introduction

The importance of water resources management (WRM) has increased during the last few decades due to rapid increases in global populations, not least in urban areas. Simply put, this means more supplies are required to cover the increasing demand for water from different end-users (and uses). However, water resources (WR) are finite, and in some regions, they are limited or scarce. Therefore, careful planning and the appropriate management of these resources are highly significant to avoid any future water crisis that might affect the current or future generation(s), including water shortages and deterioration in water quality.
This goal is similar to and parallel with the pursuit of sustainable development, where the satisfaction of the current generation’s needs should not impact the life requirements of the next generation [1]. However, sustainability generally has a broad range of applications and many descriptions to be targeted as an overall goal. Meanwhile, the complex connection between culture and nature in terms of their spatial, temporal, and personal factors makes it challenging to have a single definition of sustainability that can handle particular environmental and social problems related to different contexts and local conditions [2]. Therefore, it would be more beneficial to individually treat specific fields (i.e., place-based) that share common features, such as WRM systems. This could be achieved by considering the sustainability assessment of such systems to be measurable or, more importantly, in the domain of specific, measurable, achievable, realistic/relevant, and tangible/time-bound (SMART) goals. Therefore, all elements of a SMART goal should be considered during the design stages of any practical sustainability assessment.
On the other hand, questions might arise about the meaning of “sustainability assessment” and why it should be used for WRM. Sustainability assessment is defined as “… a process to determine whether or not a particular proposal, initiative or activity is, or is not, sustainable” [3], and it should be used as “a tool that can help decision-makers and policy-makers decide which actions they should or should not take in an attempt to make society more sustainable” [4]. Thus, a WRM system includes several activities that need to be measured and evaluated to help water authorities and stakeholders choose the right actions and apply the best management methods to advocate sustainability.
While several Sustainable Development Goals (SDGs) are related, whether directly or indirectly, to the aspects of WRM, the purpose of this study is more aligned with SDG6, which aims to “ensure availability and sustainable management of water and sanitation for all” [5]. Hence, considering the sustainability assessment of WRM as a sustainable water resources management (SWRM) strategy is a must and would play a vital role in the flourishment of any society. Vice versa, ignoring such a strategy would cause numerous difficulties sooner or later and could exacerbate the WR situation year after year.
To develop and accomplish such a strategy, specific elements are required. One of these elements is an indicator—something that “helps you understand where you are, which way you are going and how far you are from where you want to be” [6]. Indicators help narrow down and sum up numerous data into one or few numbers and metrics that would be easier to follow by both stakeholders and decision-makers. Therein, metrics “give a unit of measurement to indicate progress against that criterion” [6]. Indeed, using indicators would help measure, assess, and inform the sustainability level of a complex system [7,8], such as SWRM, in a less complicated way. Nevertheless, in the case of a WRM system, indicators often represent different unrelated aspects of the system. Therefore, they would require a more extensive umbrella akin to a structured framework [9].
Moreover, developing a bespoke indicator-based water sustainability framework (IBWSF) can be helpful in the following:
  • Containing all elements of WRM that can assist in the improvement of WR [2,10,11,12,13];
  • Providing definitions for the variables included in the framework and drawing attention to significant connections between them [14];
  • Helping in identifying and understanding the most critical issues by both users [14] and decision-makers, which is vital for the process of prioritising tasks and identifying trade-offs [2,13];
  • Communicating the current status of WR to a bigger group of stakeholders [12,13];
  • Where applicable, setting benchmarks—where a benchmark is “a quantification that reflects a desired level of performance for an indicator” [6].
For the aforementioned condition and benefits, different IBWSFs have, in the past, been developed for several purposes related to WRM, not least as an evaluation tool. These indicators can be classified as measuring the conservation level of the environment [15,16,17], the socio-economic impact [18,19,20], or the effectiveness of the physical factor (i.e., infrastructure) [21,22,23]. Examples of indices that prioritise the environment are either those with a target of comparing the ecological health of the freshwater system(s) [24,25,26,27] or those that aim to quantify the environmental impacts of material inputs and outputs by using life cycle assessment methods [28,29,30].
Another preferred method that has been developed is to combine a range of indicators in one framework that aims to assess the overall level of sustainability of WR [2,31,32]. This method mainly considers the assessment of all three main pillars of sustainability (i.e., environment, economic, and social). This framework’s purpose is similar to sustainable development’s goal, in that it seeks to find the right balance between these three pillars [33,34]; it is the “triple bottom line” (TBL) concept, where equal significance should be given to the environmental, social, and economic aspects during the decision-making process [3]. Therefore, the framework provided here focusses on relating each indicator to one of the three pillars of sustainability, such as other previous frameworks plus the physical factor represented here by the infrastructure pillar, which is essential to any WRM system.
Conversely, one might question the necessity of developing a new sustainability framework for WRM, given the abundance of existing frameworks in the literature, such as those included and discussed previously [35]. The simple answer is that it is known that each place, region, or continent has both common and unique features related to the weather, geographic location, culture, economic condition, etc. Indeed, the mutual specifications of some particular regions can help use a previous assessment framework to some extent to obtain or improve their SWRM system. However, this approach may not be feasible for areas with markedly distinct and challenging conditions. Similarly, Juwana et al. [13] reported that the successful application of existing WRM indices does not mean they are highly applicable to be reused in a different place; therefore, developing a unique framework becomes necessary to fit with the natural and socio-economic characteristics of that region.
For example, some arid and semi-arid region (ASAR) are basically deserts in nature without any permanent rivers or lakes. The term arid is used for areas that receive an average rainfall < 100 mm/year and experience high temperatures [36], and the term semi-arid is used to describe the climate of regions that receive an average rainfall in the range of 250–500 mm/year [37]. Moreover, both regions are characterised by potential evapotranspiration that is higher than the precipitation [38], and they are subjected to frequent and severe droughts and infrequent but significant floods [39]. In addition, these regions are naturally considered to be the most water-stressed areas in the world, where groundwater (GW) is the primary water resource [40]. Hence, all these factors show the importance of designing a bespoke framework that can enhance and/or maintain the sustainability of WR among countries in these regions.

Aim and Objectives

This study aims to develop a Sustainable Water Resources Management Assessment Framework (SWRM-AF) for some ASAR with harsh climate conditions, such as the Gulf Cooperation Council (GCC) countries. To discover the importance of this aim, an illustration of the WRM situation in GCC countries is given first (see Section 2). Then, general and specific guidelines are required and would be explored and presented, as the first objective, to help in understanding the rules that govern such a process (see Section 3). The methodology used to reach this goal needs, in general, two stages:
  • Stage One: searching the literature to identify appropriate components, as the second objective, and indicators, as the third objective, that suit the temporal and spatial conditions of the understudied region [11,13,41,42]. The suggested set of components/indicators that results from this stage is sometimes called the conceptual framework (see Section 4).
  • Stage Two: presenting the conceptual framework with its selected indicators and metrics to the stakeholders who are in charge of evaluating (i.e., choosing between keeping, adding, removing, and changing) any of these indicators, distilling them down to an appropriate set as required [12,43,44,45]. This is the refinement stage and usually ends with the framework’s final version.
To achieve the first stage, a selection process based on checking the literature review and data availability for components and indicators is required as a first step in the selection process (see Section 4.2). Then, a brief description with justification for each indicator is provided to explain the relevancy (see Section 4). The second stage is based on the participatory method that needs the opinions of both experts and stakeholders about the output of the first step. This stage would work as inclusion and exclusion criteria in parallel to assigning specific weights, and it is an essential part of the validation process.
This paper focusses on Stage 1—developing a novel and conceptual framework; Stage 2 is the focus of a forthcoming paper.

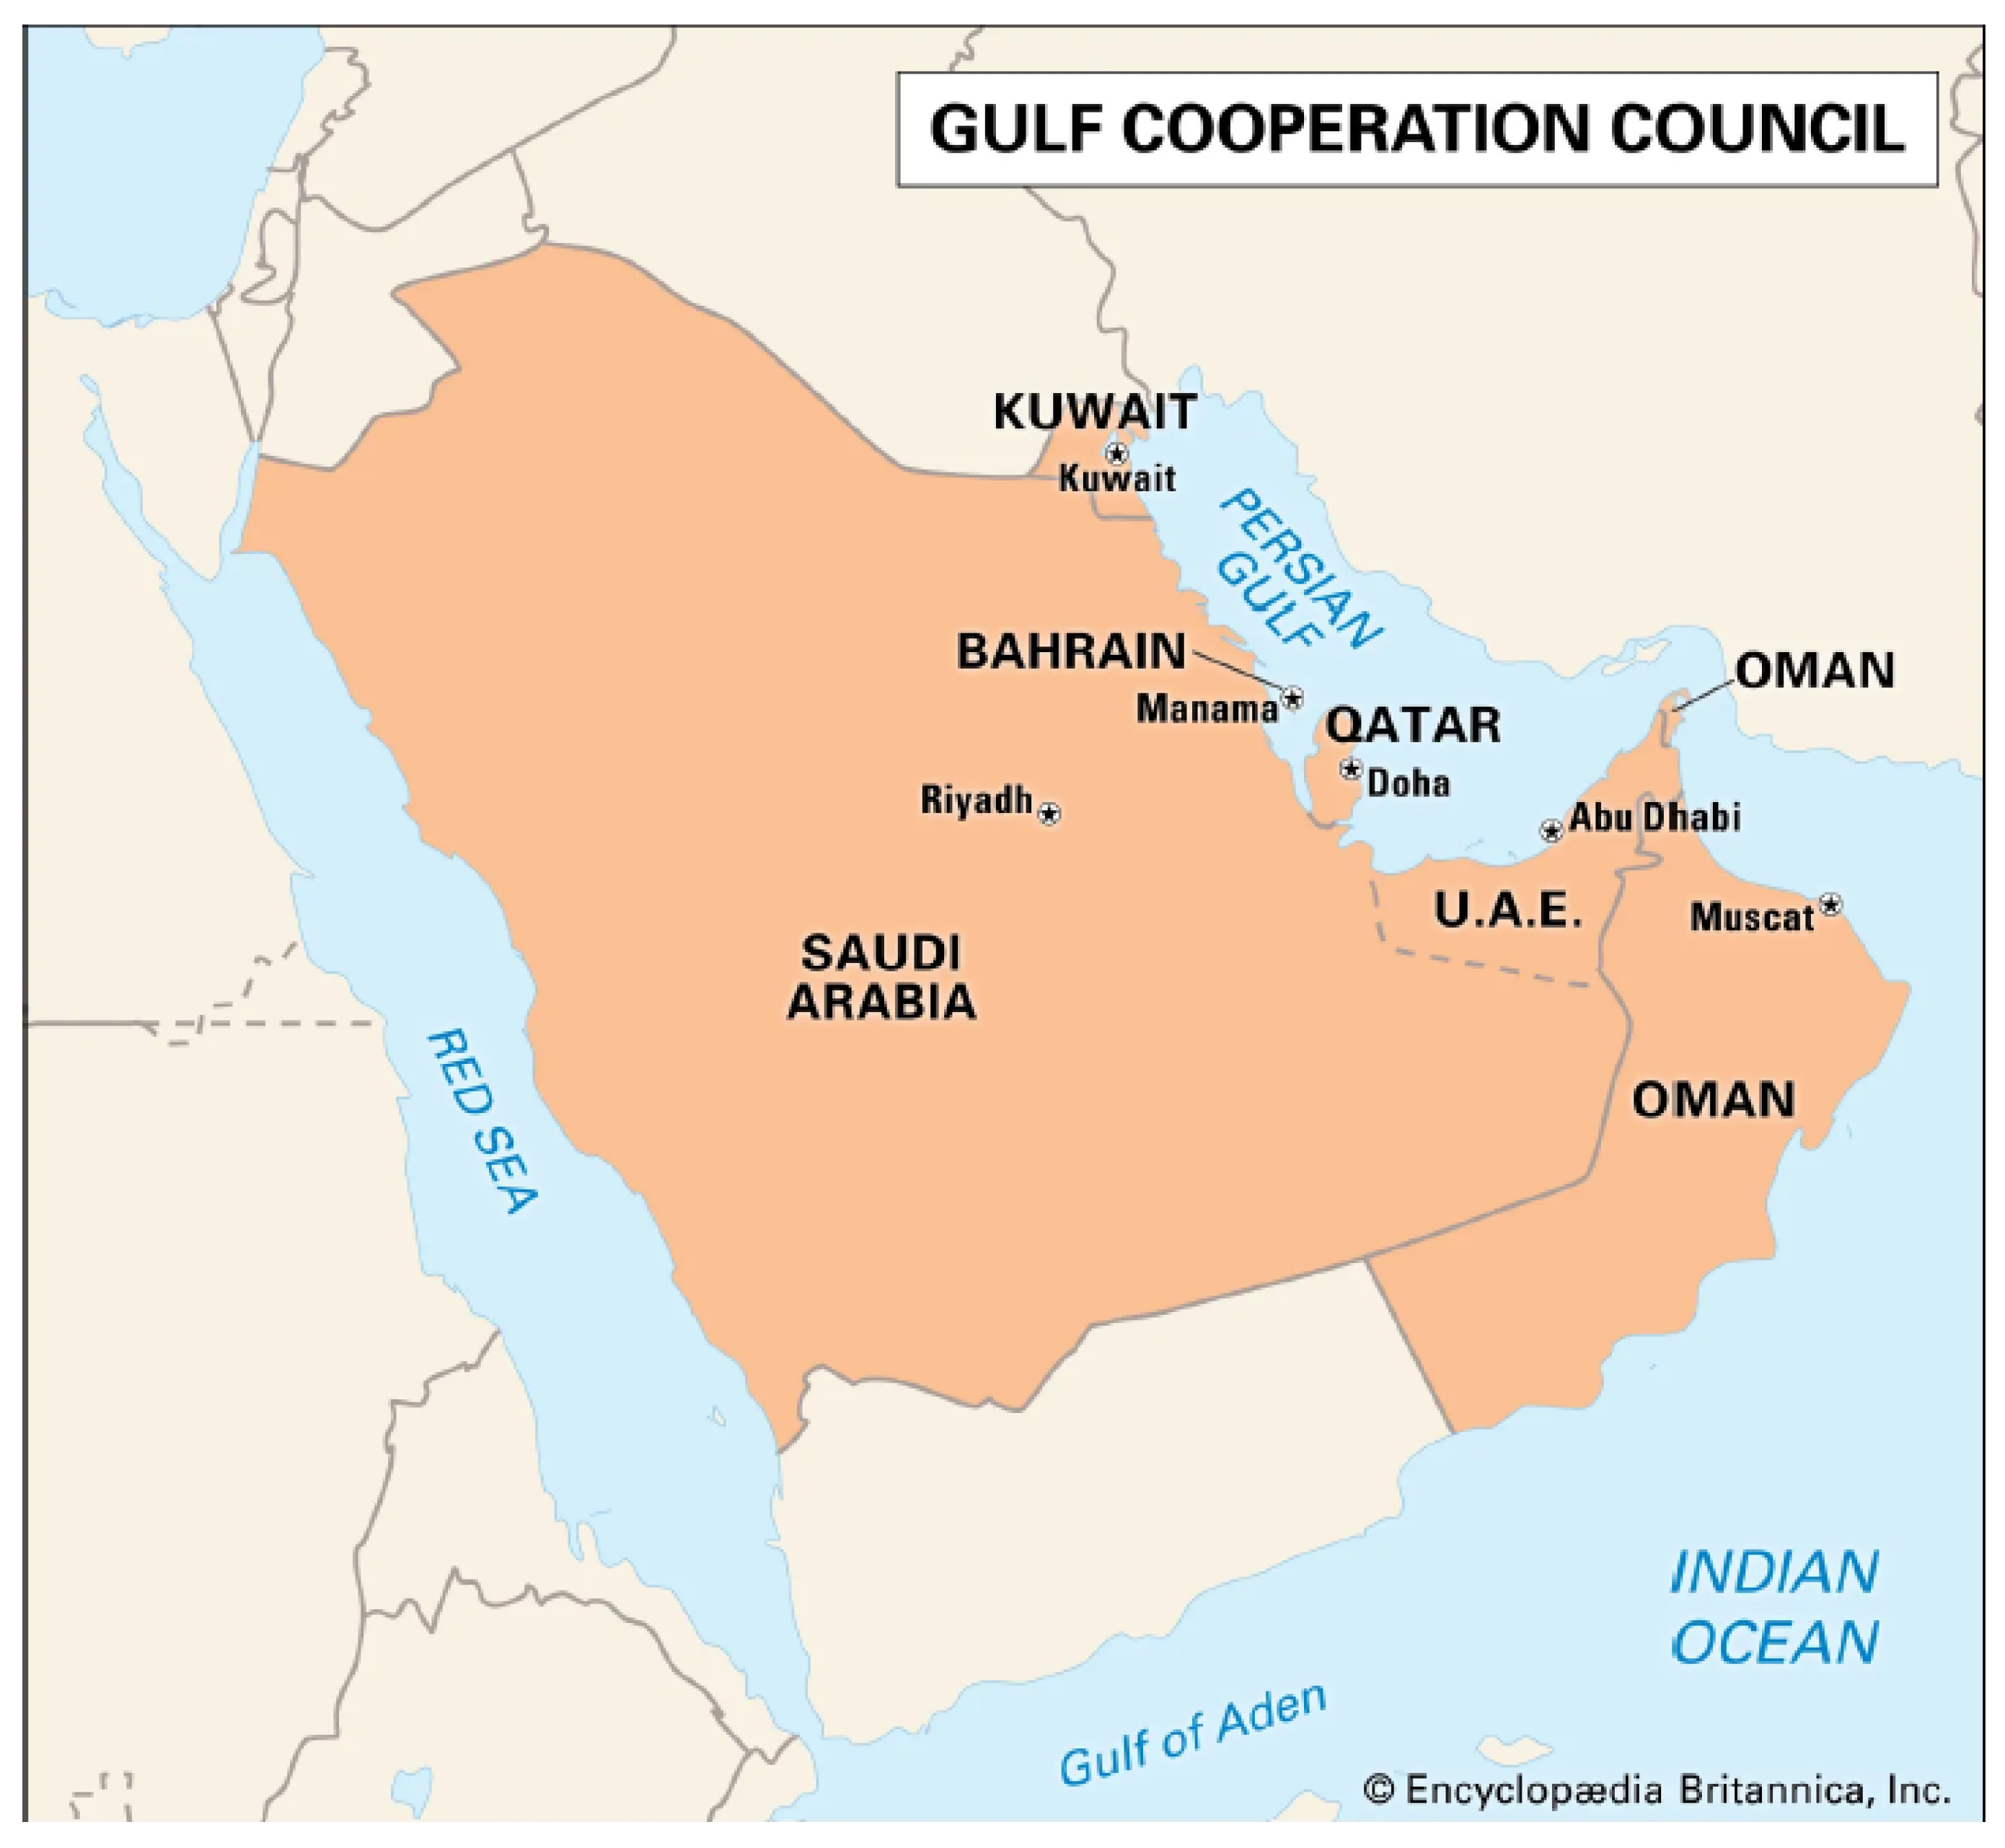
2. Water-Related Issues in Gulf Cooperation Council (GCC) Countries

The GCC countries are located on the southwest side of the Asian continent, which is considered as an ASAR. Moreover, based on the Köppen–Geiger climate classification, the prevailing climate of these countries is described as arid (B), desert (W), and hot (h) [46]. GCC countries belong to Arab countries, which are located in a hyperarid to arid region (<0.2 on the Aridity Index (AI)) with pockets of semi-arid areas (between 0.2 and 0.5 AI) [47]. Aridity is defined as “the degree to which a climate lacks adequate, life-promoting moisture” [48].
On the other hand, the GCC countries are part of what is known in the geopolitical area as the Middle East [49]. More specifically, they are located between latitudes 15° and 30° North and longitudes 35° and 59° East. The GCC countries constitute the biggest part of the Arabian Peninsula, which is known to be surrounded by seas from three directions. One of these seas is the Arabian or the Persian Gulf, to which the name (i.e., Gulf) of GCC countries refers because each has a direct coast. These six countries are the Kingdom of Saudi Arabia (KSA), United Arab Emirates (UAE), Oman, Qatar, Kuwait, and Bahrain. The map of GCC countries is shown in Figure 1.
The water situation in the GCC countries is overly critical since most of their lands are desert-based with limited conventional WR. This inconvenient situation can be seen by the small individual share of renewable water that does not surpass 500 m3/year, while the rainfall is rare and irregular, with an average of around 100 mm/year [51,52]. Moreover, not only is the low rainfall rate an issue, but it combines with a high evaporation rate [53] exceeding 3000 mm/year, making the conditions of having a perennial surface water system impossible to take place [54]. Lastly, the per capita freshwater availability has dropped by almost 30% during the past two decades overall in the Middle East, causing a water scarcity situation [55]. Therefore, careful consideration for the planning and management of WR in GCC countries to ensure that they are sustainable is significant.

2.1. Water Supplies

The main conventional WR in GCC countries is GW, which is classified as non-renewable GW (NRGW) (or deep GW) and renewable GW (RGW) (or shallow GW). In addition, surface water (SW) is the second conventional WR that only provides a very low quantity in most GCC countries. Both types of GW represent the highest share (from 77.7% in 2017 to 70.5% in 2020) among WR in GCC states in supplying water for all purposes, while SW represents the lowest rate, which was 0.5% in 2017 and increased slightly to 0.8% in 2020 [56]. Moreover, the yearly rate of SW runoff is very rare or does not exist in three GCC nations (i.e., Kuwait, Qatar, and Bahrain), while the other three countries received considerable amounts starting from 150 to 3210 million cubic meters (MCM) per year (MCM/year) [57]. Thus, since the focus of this framework is on all GCC countries, less attention might be given to SW.
Furthermore, NRGW is fossil water that is exceedingly difficult to replenish under the current hydrological regime [58]. In general, NRGW provided the largest share (approximately 67%) of water supply in the period from 2012 to 2020 if we take five out of six GCC countries as one block region [57]. Oman is the exception by using more renewable water, SW and RGW, than NRGW [57]. Hence, the continued dependence and high use of NRGW can only ever be considered a temporary solution; moreover, it is far from sustainable for GCC countries. Furthermore, with the depletion rate (i.e., the ratio of conventional WR withdrawal to available WR) of GCC countries being so high in 2020, the remaining lifespans of available WR are assumed to be between 50 years for Oman and <9 years for UAE, Bahrain, and Kuwait [57]. Therefore, with the advent of climate change and further population growth, it will be difficult for GCC countries to withstand more extended periods, not least if they continue to rely only on conventional WR.
On the other hand, the discovery of oil under the land of GCC countries during the 1970s made these countries economically prosperous, which led to a momentous change in their lifestyle and living conditions. As a result, the total population of GCC countries increased dramatically between 1960 to 2020, from 5.34 million to 58.43 million [59], as seen in Figure 2. The increase rate in these 60 years was 994.5%, while the average yearly increase rate was 16.6%. This percentage of population growth is considered as one of the highest on a global scale [60]. Indeed, it was necessary during these years to deal wisely with the increased demand for WR to ensure that these countries could preserve their flourishment while their citizens could survive.
Therefore, the need for extra water supplies was necessary for GCC countries to cover the gap between the supply and demand of water. Thus, the establishment and use of non-conventional WR, such as desalination water (DW), was one of the very crucial solutions for such a situation. Globally, many countries cannot afford or try to avoid DW since it comes with high economic costs, but this has, thus far, not been an issue for the GCC countries. Historically, the first brand-new desalination facilities were built in Saudi Arabia, Kuwait, Bahrain, and Qatar in the 1950s [61]. Nowadays, the six GCC countries together are one of the world’s leading producers of DW in terms of quantity, as we know that more than 60% of the world’s total desalination production capacity is contributed by the GCC nations [62]. However, while the social aspect has been satisfied by this WR, some economic and environmental impacts [63,64,65,66] require special attention to achieve the balance between all three pillars of sustainability.
The second non-conventional WR is treated wastewater (TWW) or, as some GCC countries refer to it, “Renewed Water” (RW). Sometimes, this resource is difficult to use directly for the domestic sector from society’s point of view by looking at its origin [67]. However, it is still one of the strategic solutions in regions with limited WR, like ASAR and GCC countries [68]. Not only this, but using TWW can benefit all three pillars of sustainability. This is because it costs less, which is better for the economy, and contributes positively to preserving the environment from the discharge of polluted water [69], and more importantly, in terms of WRM, it can help save other conventional WR for society. The use of TWW in GCC countries is designated for several reuse applications such as landscaping, recreation, recharging depleted aquifers, and irrigation of parks and plants [57,62] that mainly are not producing any edible fruits or crops. This type of irrigation is called restricted irrigation.
In summary, it can be said that there are five main water supplies in the GCC countries. Three are conventional WR (i.e., NRGW, RGW, SW), while two are non-conventional WR (DW, RW). Although the consideration of these resources is significant, very few IBWSFs in the literature have taken them into account in their indicators.

2.2. Water Demand

GCC countries are classified globally by the World Resources Institute (WRI) as among the most stressed in terms of WR [70]. Moreover, the high population growth in these countries, which means bigger demand, made them consume vast amounts of water that are not proportional to their water provision capability. The total water consumption between 1980 and 2020 is shown in Figure 3, where the biggest share was from Saudi Arabia, UAE, and Oman. This is understandable since these countries have the largest area and population compared to other countries, with the exception of Kuwait, the population of which was higher than that of Oman in two periods (i.e., 1980 and 2010). However, Oman still consumed more water in all periods because its agricultural and industrial water use is bigger [71]. Overall, it should be noted that the GCC countries’ primary water consumers or sectors are agriculture, domestic, and industrial.
The agriculture sector has the largest share of the water demand in GCC nations, with an average percentage of 70% [74], similar to the global trend of 70% for agricultural water use [75]. The vast water consumption by the agriculture sector is because some of these countries had policies to strengthen food security [74], while others, such as Saudi Arabia, sought, by using their lands and natural resources, food self-sufficiency as a key strategy [76,77], However, little consideration was given to the long-term impact of these policies and strategies on water availability and security. Hence, enormous quantities of NRGW and RGW, which were and still are the major water supplies in some GCC countries for matching this sector’s demand, were consumed. Figure 3 above indicates the effects of these policies and strategies on water consumption compared to the population growth between 1990 and 2000.
For example, several programmes for letting the agriculture sector flourish were introduced during the 1980s in Saudi Arabia. At the time ground surveys estimated that there were 500 billion m3 of GW reserves, mostly non-renewable [78]. Following this trend, it was estimated that the extraction of GW between 1980–1999 in Saudi Arabia to support agricultural activities was 300 billion m3 [78], with wheat being exported abroad [79]. Thus, it was not only a mismanagement issue of WR in a region with limited resources to cover the internal need for food security, but also it was going beyond to sell the product of this scarce WR to other countries. This promoted a review of farming policies between 2000 to 2004 because of severe impacts on WR, such as the depletion of GW [80], which led to a decree to gradually phase out wheat production yearly (by 12.5%) starting from 2008 [81].
The other primary water user is the consumption of the domestic sector, where many of the GCC countries, surprisingly and contrary to their limited conventional WR, are among the highest in the world. This fact can be proven by checking the daily water consumption per capita and comparing it to other countries. An estimation of the average annual per capita water use of GCC countries was 560 L/capita/day, which is far away from the global average of 180 L/capita/day [62,82]. Recently, the dominant water supply for domestic or municipal demand has been DW [54], which, as previously stated, is known to be expensive and lacking environmental credentials, not least with current technologies/processes used. This high dependence affects the three pillars of sustainability and needs careful consideration and attention.
The industrial sector is the third and last water user in the GCC countries with the lowest percentage or share (i.e., >10%) among all water sectors or users, as can be seen in Figure 4 below. This might be because the industrial sector in general is not that big in most GCC countries. Another observation that can be realised in Figure 4 is that the consumption of water by the agriculture sector has been fluctuating and overall declining over the last 25 years, while the municipal (or domestic) sector has continued to increase. Meanwhile, the main focus of the conceptual framework provided here is on the assessment of the sustainability of WRM within the domestic sector. Whilst the agricultural sector and industrial sector are important, they are beyond the scope of this research.

3. Guidelines for Developing the SWRM-AF

Having illustrated the water issues of the GCC countries, a case has been made for the development of a unique indicator-based framework to assess the sustainability of their WRM. From here on, this will be referred to as the SWRM-AF.
Firstly, this research follows the idea that the development of SWRM-AF should be based on combining and integrating existing information, including WRM theories, principles, and guidelines [84]. Thus, considering the existing scientific base is essential to ensure the framework’s reliable foundation and keep the knowledge wheel moving forward. Meanwhile, such a study’s uniqueness (or novelty) comes from considering a new area, field, or region where a framework should be appropriate and fit its context. Not only this, but the second contribution of this study is to provide a framework that can be easily replicated in order to be used in different areas and case studies because it was built in a clear and understandable way.

3.1. General Guidelines for Developing an Indicator-Based Framework

Before going further, it would be better to know that this framework should generally follow guidelines that experts previously introduced and have found to be effective.
Initially, it is essential to take into account and link the three dimensions of sustainability (i.e., environmental, economic, and social) [85] that are common to a host of water-related frameworks [86,87,88]. Adding the technical side [89,90] or more precisely infrastructure aspect [91] either explicitly [2,12,44,92,93] or implicitly [41,94,95,96] to these three pillars is no less common. Although it is essential to evaluate the whole sustainability of the WRM system, an effective SWRM-AF would ensure integration and perhaps equal treatment among the above three main pillars of sustainability in addition to the infrastructure that can be considered as the main connection between the supply and demand sides of these delicately balanced scales. This combination is shown in Figure 5, where having infrastructure as a component would play a vital role in checking water utilities’ overall management and continuity ability.
Regarding the structure of SWRM-AF, Alsaeed et al. [35] found that many IBWSFs in the literature have seven important mutual elements that make them clear and easily reusable. These elements, with their descriptions and functions, are summarised in Table 1. The first three elements are essential to know what this framework represents within its clearly defined boundaries. The next three elements can be categorised under the umbrella of the calculation process. The last element can be considered as the aim of making a framework, which is to provide a value that is easy to understand by different stakeholders and represents the overall situation (i.e., level of sustainability) or performance of the system.
Therefore, having these seven elements identified clearly would be helpful for other researchers and decision-makers to reuse or apply the framework in additional and different cases. The first element (i.e., indicator) in Table 1 is considered the cornerstone or base of many sustainable water frameworks. One of the guidelines within the literature stated that a sustainable framework should consist of simple and straightforward indicators that work together as a set, which includes enough data that could be helpful in the decision-making process [97].
Another guideline suggested that the total number of main indicators should not be small, which could result in wrong conclusions being drawn and misleading policies and/or decisions being made [14]. Vice versa, a large number of indicators is not preferred either since it could lead to the following:
  • The complexity of the entire process of application and interpretation [98,99];
  • Making gathering and preserving data more administratively expensive [14].
Therefore, it is worth knowing the right number of indicators that should be in place during the development stage to avoid the above obstacles. One of the suggested methods is to check the number of indicators included in the previous frameworks. This work was performed in an earlier study, which found that an appropriate number of indicators should be between 17 and 18 [35]. However, since this paper is about developing the conceptual framework, the number of indicators suggested here is higher. Stage 2 (forthcoming paper) is used to thin these down to a more appropriate number. A brief overview of the process and the philosophy behind it is captured below:
The thinning process in Stage 2 accords with an important guideline, referred to as the third Dublin principle [100], which emphasises the significance of a participatory approach for any development for WR. Similarly, having a framework to enhance the sustainability of any form of WRM, which is one of the crucial goals of integrated water resources management (IWRM), requires the participation of stakeholders in such a process [101,102,103,104]. As a result, stakeholders’ participation in water management processes has been promoted by several institutions to aid in decision-making [105]. The advantage of a participatory approach is that it can create formalised and shared representations of reality through a deliberate learning activity that draws on stakeholders’ implicit and explicit knowledge [106]. Thus, it would be essential to consider the involvement of stakeholders in the designing process of this SWRM-AF to at least gain their trust that their thoughts are appreciated.
Nevertheless, the initial output of this study, which is the conceptual framework, does not include or require stakeholders’ participation [13], since this occurs in Stage 2 [43]. The second stage is refinement, where the stakeholders can add, remove, and modify indicators forming the conceptual framework. Not only this, but the stakeholders can be involved in assigning weights for each component and indicator; this stage is out of the scope of the current article.
While these guidelines can help shape or form a practical framework, they are still general. Therefore, other guidelines regarding the needed criteria for selecting indicators, and more precisely in the context of ASAR, should be included.

3.2. Specific Guidelines for the Selection of Indicators in ASAR

While the characteristics of indicators that should be examined before integrating them in a sustainability assessment framework are presented in Table 2, it is not anticipated that each indicator will satisfy all of these requirements as their goals may vary depending on the context and scope of use [107]. Thus, wherever possible, it is pertinent to take these guidelines and characteristics into account in the process of indicator selection.
On the other hand, specific criteria should be considered to select indicators that belong to the SWRM-AF for ASAR, such as GCC countries. While many indicators can be selected from the literature, it is vital to check whether they are applicable to the context of ASAR lands that are desert in nature without permanent rivers or lakes. This is because several frameworks were designed mainly to deal with river basins [11,12,42,45,95,108], and even if river basins are located within ASAR, their conditions are different to some extent. Hence, it would not be meaningful to consider many of their indicators during the selection stage. Likewise, the final version of the SWRM-AF is suggested to be flexible and applicable in many aspects for reuse with any city, region, or country in ASAR with similar conditions to GCC countries. Definitely, some changes would be required; not least, the benchmarks of the framework would need to be changed to match the targets or specifications of these new areas.
Another essential criterion is that the selection stage should give special attention to the common water scarcity situation in these regions by having specific measures. For example, measuring the pressure of water users (i.e., water stress) on WR, where any increase in the water demand usually leads to the water scarcity situation being worsened, needs to be considered. This includes any other factor that might affect the already limited WR such as water leakage, which exaggerates water scarcity.
The last specific criterion is that the indicators shall be comprehensive by including all WR, whether from renewable, non-renewable, conventional, or non-conventional sources. This is because several frameworks mainly focussed on renewable and conventional WR [12,45,95], without considering other sources of supply. However, the case is different within some ASAR that depend on all WR to satisfy the overall demand, which requires special treatment and consideration during the evaluation process. Not only this, but the impact of using non-conventional sources, whether positive or harmful to the SWRM, needs to be measured within these indicators. Thus, a clear insight into the level of sustainability of the WRM system can be evaluated and observed.

4. Developing the Conceptual SWRM-AF for ASAR

4.1. Brief Description of the Mechanism of the Framework

It would be meaningful to explain or describe briefly first what the IBWSF is. A visual illustration of how the final IBWSF should look with the direction of the process of calculations is presented in Figure 6. In general, it may be said that the process of obtaining the final framework indicator value is made up of three essential parts:
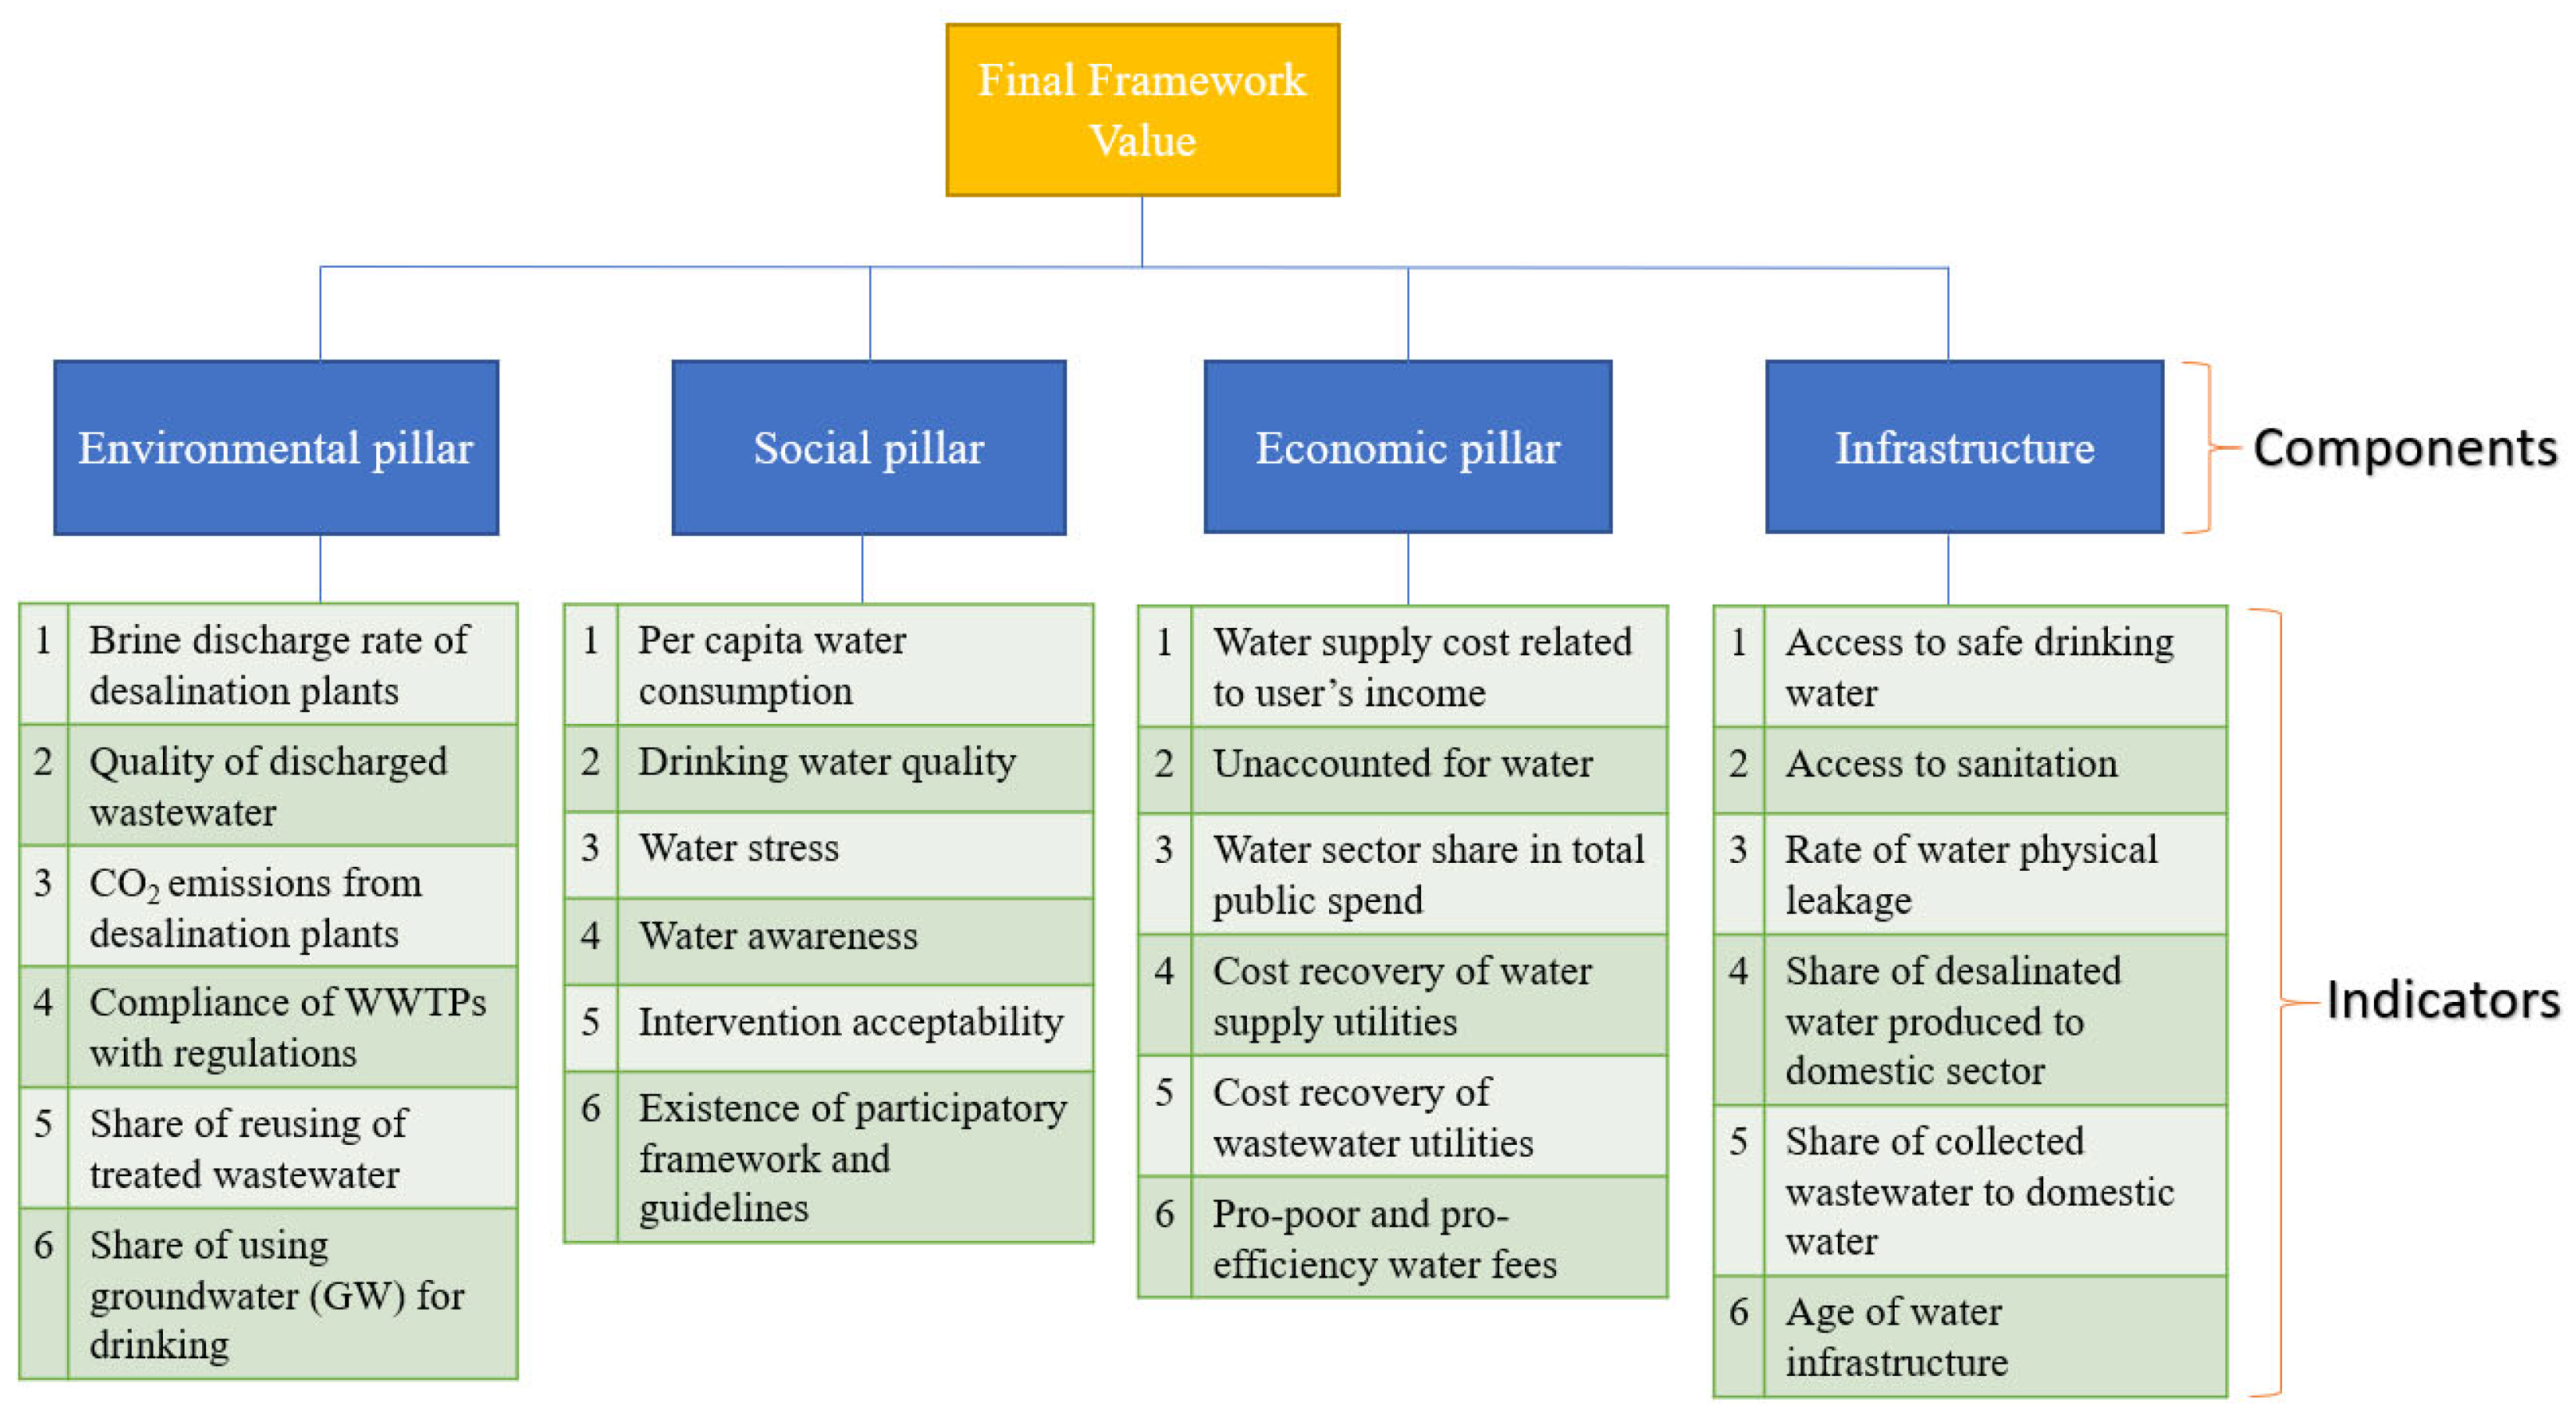
  • A set of headline categories (components);
  • A set of supporting indicators for each component;
  • A set of second-order and possibly third-order sub-indicators [35,109]. [Sub-indicators do not exist in all frameworks; they only exist when some indicators are not sufficient alone because of a diverse set of measures and available data.]
Also, as seen in Figure 6, the framework is organised hierarchically. At the same time, the calculation direction is a bottom-up approach following the red arrow to obtain the final framework value (i.e., level of sustainability). Initially, sub-indicators should be normalised, weighted, combined, and averaged to reach a value for the above indicator. Then, the exact process is repeated for indicators that belong to the same category (i.e., component). Finally, the average of all components times their weights will present the final framework value. As a result, the sustainability level of this framework can be measured theoretically and hence improved by knowing the system’s weak points and working on enhancing them. Regarding the other selected main elements from Table 1 for our framework, these include the consideration of the following:
  • Application scale: national scale (i.e., specific for GCC countries);
  • Normalisation method: continuous rescaling for indicators with quantitative data and categorical scaling for indicators with qualitative data;
  • Aggregation technique: arithmetic (i.e., average);
  • Final index (or framework) value: from 0 to 100.
The last two elements (i.e., benchmark and weighting scheme) will be based on the participatory approach that will validate the framework and be presented in the second part of this research. The benchmark for indicators with quantitative data will be given for only the final list of indicators to save the time and effort required to find them. This is because some selected indicators in this version of the framework (i.e., the conceptual version) will be eliminated based on the evaluation of experts in Stage 2. Similarly, those experts will decide whether the weight of components and indicators should be equal or non-equal.

4.2. Stages of Development

Similar to the methodology of developing previous conceptual frameworks [13,110], the development of the SWRM-AF will follow the steps manifested in Figure 7 below.
The details of the first stage, which is the review of guidelines and features of indicators, were covered in Section 3.1. The second stage is to select appropriate components and was facilitated by investigating several indicator-based frameworks (for further details, see [35]). Indeed, since the framework is designed to evaluate the SWRM, the main components consist of the three pillars of sustainability plus the infrastructure.
The third stage reviewed the guidelines needed to select appropriate indicators for the SWRM-AF and required an intensive literature search of the many indicators that already exist. This process is helpful to build upon where the others have ended and benefit from the cumulative knowledge created. Nevertheless, the majority of potential indicators to be checked were mainly from three sources:
  • A collection of 170 indicators related to water use and management that international experts have evaluated to see whether they fulfil the three pillars of sustainability in addition to the institutional component [111].
  • Indicators belonging to the SDGs [5], with more focus on those related to water use and management in general (i.e., SDG6).
  • Indicators and targets shown in the GCC Unified Water Strategy (GCC UWS) [54].
Meanwhile, several other indicators were also checked from other sources, such as those belonging to the seventeen plus two frameworks included in the previous article [35], to cover many aspects of ASAR in general and GCC countries in particular. This study aims to manifest all references for all the suggested indicators that would be included to give the selection process more credibility and traceability and to avoid any bias or arbitrary choices as much as possible.
Stage 4 is critical as a filtration process to ensure that the outputs of the previous stage (i.e., potential indicators) are applicable to be included in the final list of indicators if they fulfil two conditions. To pass the first condition or filtration step, each indicator must fit the context of ASAR and GCC countries. Of course, this would include whether these indicators consider both the typical characteristics of the WRM system of GCC countries and the conditions of their WR. If no, then this indicator shall be excluded. If yes, then the indicator can proceed to the second filtration step. To explain, indicators of several IBWSFs were chosen to tackle the issues of the SW that their regions depend on. However, this type of indicator is not effective in frameworks designed for some ASAR whose major WR is different (e.g., GW), and SW might be rare. Hence, indicators that cannot help evaluate sustainability because of their spatial features must be excluded.
The second condition of stage 4 is that the data of each indicator should be sufficient to do the calculations and also with data that is readily available and obtainable. Of course, the adequate data here include the thresholds or benchmarks of every indicator needed during the normalisation process to gain an equivalent value that can be aggregated and compared with other indicator units. In addition, if the data of any indicator are hidden or need special permissions to be collected every time, then it might not be easy and time-consuming to complete the results of the framework. This issue can be more prominent if this kind of framework supports periodic publication (e.g., yearly or bi-annually) of performance results. Therefore, only indicators with both enough data to be measured or evaluated and open-source information can be kept in the final list of indicators. On the contrary, missing both or one of these criteria or checks will lead to excluding this or that indicator and making it inapplicable to qualify for the next stage.
Stage 5, the last stage presented in Figure 7, provides the final list of components and indicators that comprise the conceptual framework (see Section 4.3). Therein, each indicator should be accompanied by a brief description explaining its purpose and ideology for both expert and non-expert users and stakeholders. Moreover, a brief justification is provided to show the importance of such an indicator. Finally, the references from other frameworks that have used the same indicator are presented to make the selection process more credible and strengthen the justification.

4.3. Results

This section presents the output of Stage 5 as the final list of indicators that came after following the instructions of the flowchart in Figure 7. This list ended with 24 selected indicators representing the previous four components of the conceptual SWRM-AF for ASAR, as shown in Figure 8. Each component has six indicators, to give equal attention to each component and to follow the rule that emphasises that the total number of indicators should be neither too many [98,99] nor too few [14,35]. In addition, a reference, a brief description, and a justification for each indicator are provided below.
The respective four components (i.e., environmental, social, economic, and infrastructure) and underpinning indicators with associated metrics and benchmarks (where applicable) will be further discussed in the next sections. Meanwhile, tables containing actual statistics from GCC countries for some indicators will be presented in Appendix A to guide framework users on the specific information they need to seek during the application or implementation phase.

4.3.1. Environmental Indicators

If the pillars of sustainability are considered as a series of concentric circles, the environment can be considered the bigger circle that contains both the social and economic pillars. This is because if the environment is not well maintained and protected, the impact of this careless act would greatly influence all other aspects of sustainability and life overall. Hence, in the development of this framework, the environment is placed first in this research.
A list of all environmental indicators included in the SWRM-AF is provided in Table 3 with their types and references.

No. 1. Brine Discharge Rate of Desalination Plants

Since WR are commonly scarce in ASAR, alternatives are necessary to reduce the gap between water supply and demand. One of these alternatives that countries now rely upon is the process of extracting pure water from saline water [118], whether from the sea or stored in aquifers. The output of this process became known as desalination water (DW), which requires desalination plants (DPs) to be treated and produced.
The process produces freshwater, and concentrated brine, a wastewater (WW) that includes elevated levels of salt and other chemicals [119,120,121]. Unfortunately, unregulated discharges of this untreated WW to the sea can harm the ecosystem therein [122]. In addition, DPs close to the coast frequently release untreated brine into salty surface water bodies such as oceans and seas [123], while inappropriate surface disposal of other DPs could pollute GW resources [119]. Therefore, identifying the rate and composition of brine discharges is significant. According to Xu et al. [124], the estimation of the brine production rate depends on two factors:
  • Type of desalination technology (e.g., reverse osmosis (RO), multi-stage flash (MSF), and multi-effect distillation (MED));
  • Salinity level of feedwater (e.g., seawater or brackish water) that is used as an input.
To illustrate the point, it was previously estimated that using seawater (SeW) as feedwater with MSF as a technology would produce desalted water with an average rate of 22% (i.e., recovery ratio [125]), while using brackish water (BW) with RO would result in a rate of 65%; the remaining percentage (i.e., 78% and 35%, respectively) in both cases would be brine [126]. Therefore, it is significant to work on reducing brine disposal directly into nature to maintain the environment of that region by having a specific indicator that can measure the brine production rate. In contrast, ignoring this process by at least not having an indicator would affect the environment directly and people’s health indirectly.
Globally, it is worth noting that four nations of the GCC (i.e., KSA, UAE, Kuwait, and Qatar) are responsible for 32% of desalination water production and 55% of the total brine [126]. Hence, to deal with this vast brine discharge rate, some changes for the current practices (i.e., the two factors above) are needed, if not with existing DPs, then at least for any future ones. Jones et al. [126] presented several assumptions about the water recovery ratios resulting from the combinations of feedwater technology, and the important ones related to this study are shown in Table 4. While these technologies and types of feedwaters in Table 4 dominate in GCC countries, an estimation for the average rate or quantity of brine discharge among GCC countries can be calculated if the right data are available. Furthermore, Moossa et al. [66] collected information about the daily DW production in 2020 and the rate of technology used as shown in Table A1. Therefore, by knowing these data plus the water recovery ratio for each technology combined with the type of feedwater, as presented in Table 4, the average quantity of brine discharge can be estimated for each GCC country. Then, this quantity can be considered as the baseline of a previous specific year (e.g., in our case, it can be 2020) and can be monitored and compared with future years. A suggested criterion for evaluating this indicator is presented in Table 5.

No. 2. Quality of Discharged Wastewater

The quality of WW, whether treated or untreated, should be monitored before it is discharged. This action increases in significance when considering that 44% of household WW globally was not safely treated in 2020 [127]. Thus, checking the quality of WW would help eliminate many environmental issues by ensuring that it is at least unharmful before it is released for any purpose. Moreover, deciding whether this indicator should be under the environmental or social pillar was far from straightforward. However, since its impact is more comprehensive than being confined only to humans alone, the choice was to keep it under the environmental pillar.
For example, regulations in KSA stated that several physical, chemical, and microbiological parameters of WW and TWW need to be checked and monitored regularly (e.g., weekly or bi-weekly). These parameters are treated as sub-indicators here and include biochemical oxygen demand (BOD5), chemical oxygen demand (COD), total suspended solids (TSS), total dissolved solids (TDS), potential of hydrogen (pH), ammoniacal nitrogen (NH3-N), nitrates (NO3) and faecal coliforms (FCs). The quality limit of each parameter based on the type of WW is shown in Table A2. The evaluation of this indicator will be based on the average quality of discharged WW in a country by checking the total quantity and its quality produced from sources of WW and TWW and the type of treatment. This includes whether the quality of discharged WW is untreated WW, secondary TWW, or tertiary TWW, which can be known for example by the standard given in Table 6. Then, this average will be taken to Table 6 to be compared and given an appropriate score.

No. 3. Carbon Dioxide Emissions from the Desalination Sector

It is known that the desalination technology in its current procedures requires much energy to produce potable water. This energy requirement imposes an environmental effect mainly represented by the carbon dioxide (CO2) emissions that depend on the type of technology and fuel used. Moreover, CO2 can be considered as a proxy to represent the issue of greenhouse gasses (GHGs) [128,129] to shed light on the issue of traditional and renewable energy within the desalination sector. Meanwhile, CO2 is chosen alone here because its produced quantity from DPs is found to be the largest among other gasses [114].
For example, some DPs use thermal plants that rely on burning fuels to produce electrical energy, which is required to operate these plants [64,130]. On the other hand, RO technology requires less energy [131], meaning lower CO2 emissions [132]. In addition, using renewable energies instead of conventional energy sources is very promising for mitigating and reducing the negative emissions (i.e., CO2) of DPs [133]. Therefore, such an indicator should be included in the assessment of SWRM in regions or countries using this WR, such as ASAR, to stimulate the desire to deal positively with one of the main reasons for the climate change issue. Meanwhile, the target of this indicator would be in line with one of the Sustainable Development Goals (i.e., SDG13) to “take urgent action to combat climate change and its impacts” [5]. Not only this, but also this type of indicator was similarly used somehow in other SWRM frameworks such as the Water Sensitive Cities Index [93], triple bottom line, and multicriteria decision analysis [86].
Moreover, GCC countries, which rely heavily on desalinated water to deal with their limited WR and high population growth, must carefully account for this technology’s environmental impact. For example, it was found in 2019 that the desalination sector in the KSA is in third place among industries for producing CO2 emissions, with a percentage of 13% representing 75 million metric tons per year (mt/year) [132]. In addition, the average apparent emission factor of desalination in 2016 was 21.4 kg CO2/m3 of desalinated water, which was reduced to 15.2 kg CO2/m3 in 2019 due to technological improvements [132]. Therefore, each GCC nation needs to monitor the carbon footprint of its DPs and work toward reducing it to save the environment and decrease the process of climate change.
The required data for evaluating this indicator are the number of DPs in each country, their type of technology, and their yearly actual production. Then, these data should be aggregated and multiplied by the estimated CO2 emissions of each technology, as presented in Table A3. The final output of this process should be compared to a previous year (e.g., 2 or 5 years before), in which its data are available and accurate, as a baseline for that country. A suggested criterion for evaluating this indicator is presented in Table 7.

No. 4. Compliance of Wastewater Treatment Plants (WWTPs) with Regulations

Since wastewater treatment plants (WWTPs) have a critical role in dealing with the used and polluted water, it would be essential to ensure that these plants follow up-to-date regulations to avoid any negative environmental impact and achieve maximum benefit. This would include identifying the (1) type of treatment used, whether primary, secondary, or tertiary; (2) the plant’s age; and (3) the actual production, compared to design capacity, thereby checking the plant’s performance. The values of this indicator are qualitative, based on the previous three criteria, and are illustrated in Table 8.

No. 5. Share of Reusing of Treated Wastewater (TWW)

ASAR are well known to have limited WR, which emphasises the importance of considering/adopting additional non-conventional supplies to reduce the gap between the low supply and high demand of water, which includes, for example, TWW that can be used or RW. The additional benefit of using RW is that the environment is protected from the effluents that might otherwise be discharged into the environment with small or inadequate treatment [134]. Thus, having an indicator that measures the ratio of RW to the total TWW of a region or country would show stakeholders and decision-makers how far their WRM system is from being more sustainable. For instance, KSA and Kuwait have reused TWW with a percentage of 16% and 61%, respectively, in 2010, while the suggested GCC UWS aims to achieve at least 90% by 2035 for all GCC countries [54]. Thus, non-inconsiderable concerted efforts are required by these countries to reach this target within the next few years. Meanwhile, RW can have different uses such as urban area landscaping and municipal park irrigation [135], which help reduce the pressure on other WR. The values of this indicator can be qualitative, as shown in Table 9.

No. 6. Share of Using Groundwater (GW) for Drinking

Since GW is one of the major WR in GCC countries, ensuring this resource is not overused is still significant. A continuing decline in the water table [134] and, worse still, salinity intrusion [136,137] are both environmentally unsustainable. Hence, monitoring this via a specific indicator is required. GW in the GCC countries is divided into types [54]:
  • GW (or RGW) in shallow aquifers, which is considered the only renewable water source;
  • Fossil GW in deep aquifers, which is considered as NRGW.
The issue with both types is that the water recharge rate to the aquifers that contain them should be higher than or at least equal to the drawdown rate [57], which is possible only with type 1. Therefore, the aim of this indicator is to focus on the consumption of the NRGW.
Moreover, all the GCC countries have assigned for their domestic sectors a specific policy that aims to reduce the use of GW in favour of desalination [54]. Nevertheless, some GCC countries have a small reserve of the above types of GW (e.g., Qatar and Bahrain) [54], so using other water supply alternatives based on their conditions is important and should be included in the SWRM-AF. In contrast, while the estimation of the quantity of NRGW in Bahrain and Saudi Arabia is 155 and 400,148 MCM, the yearly withdrawn from this reserve is 58 and 19,460 MCM, respectively [57]. If we assume that the recharge rate of these reserves, which hold this NRGW, is almost zero, then this would mean this natural and strategic storage of water could be depleted within approximately 3 to 20 years.
Therefore, the aim of having such an indicator is to show the importance of reducing the reliance on NRGW in the domestic sector in GCC countries to sustain it and to avoid negative environmental impacts resulting from overconsumption. The values of this indicator can be qualitative, as shown in Table 10.

4.3.2. Social Indicators

While protecting the environment of the SWRM system is significant for the welfare of the planet, taking care of the satisfaction of society is equally important. The advantages and the procedures of having a widely accepted sustainable approach herein are no less powerful. Therefore, this process needs a number of different steps to be adopted, such as illustrating how individual use in parallel to the degree of awareness [138] could directly or indirectly affect the SWRM system. This is more important in regions such as ASAR, which often suffer from water stress, and overcoming the barrier to public acceptance of some interventions is key to ensuring that WR can withstand challenging conditions. Furthermore, the quality of drinking water strongly impacts the health and well-being of society. In addition, all these previous measures work better if stakeholders from the community have a clear role in the regulatory decision-making process. Therefore, an effective SWRM system requires social indicators to be strongly evaluated and not overlooked.
A list of all social indicators included in the SWRM-AF with their types and supporting references is presented in Table 11.

No. 1. Per Capita Water Consumption (Domestic Sector)

This indicator has a graded scale from high to low consumption and reflects the demands of the domestic sector, particularly by focusing on the behaviour of using water or the average consumption of individuals forming that sector. Having such an indicator is essential to avoid being in a difficult water scarcity situation. Water scarcity occurs when the amount of water withdrawn from natural WR (i.e., conventional) is massive and still cannot fulfil all people or ecosystem requirements, which leads to high competition among water users [139].
The main inputs of this indicator are the total domestic water consumption of a city, region, or country, which is usually counted per year, and its population. The output can be simply calculated by dividing the total yearly water consumption by the population and converting the time unit to a day. Thus, this rate can show clearly which rank the people of that region belong to, whether to high, normal, or low water consumption compared to other regions. Then, stakeholders and decision-makers in that area should be aware of their general behaviour in dealing with water and whether they need to carry on or fix it. This measure is more critical in ASAR, which already suffer from limited water resources.
In contrast, the use of non-conventional WR with relatively extremely low water tariffs and high government subsidies until recently made many countries, in our case, among the highest water consumers, which is unsustainable for the short and long run. Hence, a plan with a target to reduce this consumption is required to ensure the longevity of such WR. For instance, GCC countries figured out that their average water consumption is high (e.g., KSA = 278 L/capita/day in 2018 [140], Bahrain = 320, Kuwait = 500, Qatar = 512, Oman = 140, and UAE = 520 L/capita/day [54]). These high levels of most GCC nations let experts decide to put a target in the GCC UWS to reach at least 250 L/capita/day by 2035 [54]. This target aligns with the recommendations that emphasise demand management by motivating the enhancement of consumption behaviour rather than focusing on supply management. The adoption of water-efficient appliances and changes in user behaviour are fundamental to achieving these targets [138,141]. Therefore, while this target (i.e., 250 L/capita/day) is still high, it is still considered in Table 12 with a middle score to match the GCC UWS and to be a benchmark for other GCC countries with huge consumption. Meanwhile, more targets are added in Table 12 to match the global trend and push the boundaries of reducing consumption; achieving them would benefit the water sector greatly.

No. 2. Drinking Water Quality

This should be considered as a pass (5 marks)/fail (0 marks) indicator. Generally, this indicator is among the most significant to be included in any SWRM framework or index. The evidence found in the literature shows that many if not all IBWSFs have included it. Its significance comes from it helping ensure the health and well-being of society by maintaining a decent quality of drinking water. Otherwise, water diseases (e.g., cholera, typhoid) that occur after drinking polluted or low-quality water can take place. Moreover, the importance of this indicator increases in some ASAR, where using non-conventional resources such as DW is essential.
Since the water supplies of any country or region are most likely different, sub-indicators might be essential to distinguish between the quality of each water resource and ensure that they would meet the standards to be appropriate for consumption or discharge. However, since the output (i.e., quality of drinking water) of this treatment process is the target, all these WR are combined here under one category called “water supply”. Meanwhile, the most important parameters would be checked to reduce the complexity, time, and money resources needed for applying the framework.
In this framework, the first option for calculating this indicator is to use scores of overall drinking water quality from other indices, such as the Environmental Performance Index (EPI) [142]. Otherwise, most parameters that were used in many water quality indices (WQIs) are selected to be checked on a timely basis. These parameters and their permitted values based on the Saudi Arabian Standards Organization (SASO) are shown in Table A4 and classified into three main groups:
  • The physical parameters (total dissolved solids, turbidity);
  • The chemical parameters (pH, free chloride);
  • The microbiological parameters (total coliforms).
Another way to measure the value of this indicator in order to be consistent with previous indicators is provided in Table 13. In this table, categorical scaling is used by considering the issue of both urban and rural areas since it fits the context of both ASAR and GCC countries, where some and/or few groups of people still live far away from cities and towns.

No. 3. Water Stress

This indicator was introduced by Falkenmark et al. [143] to measure the population’s pressure on the renewable water supply of a specific city, region, or country. The stress here includes the needs of all major sectors (i.e., domestic, industrial, agricultural, and natural ecosystems) [144]. The renewable supply in this context means the annual amount of conventional WR only (i.e., average yearly stream flow and/or the sustainable groundwater yield) on a per capita basis [12]. Water stress in any specific region starts when there is less than 1700 m3/cap/year, and it becomes severe when there is less than 1000 m3/cap/year [144], while less than 500 m3/cap/year could represent that water availability is a main constraint for having a normal life [12,145]. The renewable water supply of GCC countries is most likely below 500 m3/cap/year, which made them adopt non-conventional WR to reduce the gap between water supply and demand. However, this indicator does not consider these resources since they are categorised as non-renewable or need excessive cost or technology to be treated. Meanwhile, a new indicator that follows the same previous categorisation and combines conventional, including NRGW, and non-conventional WR is suggested to reflect the real water stress in countries like the GCC countries. The equation needed to calculate the water stress (or scarcity) indicator (WSI) is as follows [57]:
W S I i = D T n e t   i ( N R G W i + D S W i +   R U W i S F W A   i × 100
where DTnet i is the net total water demand from all sectors in each country (i) in the GCC. While NRGWi stands for the abstraction quantity of the NRGW, DSWi is the quantity of desalinated water, RUWi represents the reusing quantity of TWW, and SFWAi is the availability of surface freshwater (or SW) availability of that country (i). Moreover, the expression “SFWAi” in the denominator of Equation (1) can be changed to “total recharge from all sources excluding return flow + total runoff volume from all catchments” since GCC nations do not have perennial surface water [57]. Then, the water stress level can be indicated by referring to Table 14.

No. 4. Water Awareness

Raising the community’s awareness about their region’s water situation is significant. Doing this via different methods would let society understand the size of the problem and, more importantly, tackle it by changing consumption behaviour. In addition, disseminating knowledge about water scarcity would make the public cooperate with any initiation or regulation that would rationalise using this precious resource [147,148]. For that reason, it is essential not to ignore this side and to have this type of social indicator that would measure to which extent efforts are provided to increase the water awareness of the society of that region. This is because different studies have stated that some people used to underestimate their actual consumption by thinking they were consuming less water [138,148], which cannot help them reduce their water consumption.
One way to do this is to check the school curriculum and whether it includes information about the water issue with advice. To prove the importance of such an action, Pires et al. [111] found that the “water topics in school curriculum” indicator is one of the 24 indicators among many others found in the literature that can fulfil the majority of sustainability criteria based on different experts’ opinions. Another way is to ensure the water authorities have produced water awareness campaigns in different media. Finally, this indicator would be evaluated as a qualitative measure, as seen in Table 15.

No. 5. Intervention Acceptability

Adopting new technical tools or methods that could reduce domestic water consumption is more critical in areas like ASAR—for example, providing tools that can be attached to water taps to reduce water consumption (i.e., water rationalisation tools (WRTs)) and making their use mandatory. Other examples include smart water meters (SWMs), greywater systems, and rainwater harvesting (RWH) systems.
However, this kind of intervention would require acceptance by the public, who might doubt the benefit of that process and then not react positively to it. Moreover, social resistance might occur if these novel changes need new or extra-economic costs, which some people either cannot afford or are unwilling to pay. Hence, it is crucial to propose such an indicator for evaluating the primary stakeholders’ acceptance of these new interventions before introducing them. In addition, it is worth mentioning that the level of acceptance is qualitative and would correlate with the level of awareness. Therefore, it is suggested that both indicators need special preparation and consideration in any SWRM-AF. Like the previous indicator, each description with its score is presented in Table 16.

No. 6. Existence of Participatory Framework and Guidelines

According to the Dublin principles [100], stakeholders should be involved in the decision-making process of any WRM plan based on a participatory approach. There are different important reasons for such a principle, such as the following:
  • To increase stakeholders’ awareness about the water situation and its real problems.
  • To motivate them to provide or select appropriate objectives or solutions after giving them a chance to understand the main challenges.
  • To ensure their cooperation in applying the approved plan and achieving key objectives.
  • To let them convey the strategies and convince their close social circles about the importance of such strategies.
Thus, the existence of such a framework with specific guidelines that include regulations and the method of application is essential for any SWRM. Moreover, such an indicator could help countries and regions that applied this framework recognise the importance of the participatory approach and fill the institutional gap. In addition to the existence of such a framework and its guidelines, the main criterion for developing this indicator is that most stakeholder groups are represented and have a real contribution to the decision-making process. These groups include, for example, profit and non-profit organisations.
An indicator for checking this is suggested here with different measures to match the Dublin and IWRM principles. The values of this indicator would be from 0 to 5 based on qualitative descriptions or criteria, as shown in Table 17.

4.3.3. Economic Indicators

Like many systems worldwide, the cost and benefit of WRM for the domestic sector shall be assessed to ensure its affordability and feasibility. This would include, for example, figuring out whether the average income of people in a specific region or country is proportional to the water cost they are paying. In addition, the cost recovery of the operation and maintenance of water services is crucial for companies that are already providing or would provide these services to survive. Otherwise, governments and municipalities will face difficulties treating, delivering, and maintaining water by their spending alone without the private sector, whose net-benefit matter is usually their primary goal. Nevertheless, since water is a fundamental element of life, it is necessary to support either special rates for people experiencing poverty and/or provide efficient tools to help them rationalise their water use and hence reduce their water bills. Therefore, it is vital to create and investigate economic indicators related to the WRM system to complete the evaluation of the three pillars of sustainability. Meanwhile, treating this pillar (i.e., economic) with other previous pillars in a balanced way is recommended to prove that they are all equally essential for sustainability.
A list of all economic indicators included in the SWRM-AF with their types and supporting references is presented below in Table 18.

No. 1. Water Supply Cost Related to Users’ Income

It would be tremendous and economically sustainable if the water supply cost is fully recovered by users or customers who have paid to obtain or buy water. Furthermore, this process would be better if it would bring profits to the provider, whether a company or the government. However, since water is one of the basic needs for humans to survive, many governments and/or municipalities have maintained heavily subsidised water to ensure that everyone can afford to buy water [151]. Moreover, most low- and middle-income countries have water tariffs that cannot cover water providers’ daily costs unless financial authorities give compensation [151]. On the other hand, having unaffordable and increased water tariffs can end with a lot of bills that cannot be paid by customers, which prevents expected revenues from being collected on time [152]. This would lead to a loss for water providers either in the short or long run. Hence, monitoring this cost and comparing it to the water users’ income by a particular indicator could assist in reviewing water tariffs to ensure it is affordable and also could generate revenues.
To calculate this, the average number of people living in the same house (or household) would be considered for each GCC country (e.g., 5 people). Then, the country’s average daily water consumption per person (e.g., 260 L/cap/day) would be converted to m3/house/month by considering the average household in the calculation. After that, the monthly unit cost of that amount of water (e.g., 2 USD/m3) would be multiplied by the average monthly consumption per house, and the product of this process would be compared to the average monthly income. Finally, this cost would be calculated yearly to be compared to the average total annual income of people in that country. Examples of required data for discovering this relation between monthly income and the water bill are presented in Table A5.
After this calculation is performed, the cost level can be known by taking the output of this process to Table 19, which can tell whether the cost level is high for the final user or not. Most of these levels assigned to the average income are based on a global study for the water affordability presented by Smets [153], where any water tariff surpasses 5% of the user income is considered high.

No. 2. Unaccounted-for Water (Water Losses)

Unaccounted-for water (UFW) is the difference between the water amount produced and entering the water supply system and the amount that is billed or consumed [154]. Water leakage or physical losses from pipes and networks is one of the main components of UFW, and it is a big issue not only for the economy but also for the environment and infrastructure. In addition, the global non-revenue water (NRW) rate is estimated to be 39%, which means that around 39% of the water produced by water utilities around the world is lost before it reaches the end-users due to various reasons such as leaks, theft, and metering inaccuracies [149]. However, this indicator is responsible for measuring these losses that come mainly from leaking from an economic view.
Moreover, according to estimates from the World Bank, distribution systems lose over 48.6 billion cubic metres of provided water yearly, costing the global economy more than USD 14.6 billion [155]. Indeed, the impact of this issue can be considered double or triple in countries or regions suffering from water scarcity, such as in ASAR. Meanwhile, the focus on leakage reduction preserves the money and energy invested in those resources in addition to the WR [156,157]. On the other hand, many GCC countries had issues in the municipal distribution network with water leakage that caused a high economic loss [54]. Therefore, counting for this loss in a specific indicator could convince decision-makers to pay more attention to this issue and prioritise it.
To estimate these losses, and since the region or country might have different WR with varying costs for each, the average cost of producing one cubic metre of water is calculated (e.g., 2 USD/m3). Then, the average leakage rate from the water pipes network (e.g., 35%) is multiplied by the total amount of water produced during a specific period (e.g., 2000 million m3 (MCM)/year). Therefore, if the water leakage is 700 MCM, the total economic loss based on the unit cost of 2 USD/m3 is 1400 million USD/year. This vast monetary loss could burden the whole economic system and might be paid by final users who did not receive this water, reflecting an injustice. Therefore, having such an indicator for measuring and evaluating these losses would help shed light on the magnitude of this problem and work on decreasing it. Table 20 below gives different levels of these economic losses with their criteria.

No. 3. Water Sector Share in Total Public Spending

In some countries and regions, this type of information requires transparency and might not be easy to obtain. However, it would be economically significant to know whether the decision-makers who allocated the financial budget gave the water sector their fair share to provide and maintain an acceptable quality of water services. The difficulty of including such an indicator is knowing the range of justified share quantitatively in the framework since it can vary based on the time and place. Thus, using qualitative scores would be more meaningful. The evaluation of this indicator would be from 0 to 5 based on qualitative descriptions or criteria, as shown below in Table 21.

No. 4. Cost Recovery of Water Supply Utilities

It is suggested that any system can be economically sustainable if the revenues cover its continued costs. Regarding SWRM, this should include the capital cost during the establishment stage of any type of water treatment plant (WTP) and water networks in addition to the operation and maintenance (O&M) costs. However, many developing countries tend to take care of the capital cost through their own spending and charge the customers only O&M costs to make water prices reasonable within the society [158]. Moreover, the cost of water treatment would be different based on the used technology (e.g., RO or MSF) and the type of water and its salinity level (e.g., SeW or BW) [159]. Therefore, this indicator would follow a strategy to compare the average water tariff with the average water costs. This indicator aims to show how far the water prices are from being sustainable by covering at least the O&M costs.
Along the same lines, in the GCC UWS, GCC countries seek to recover 100% of O&M costs by 2025 as a first target and 100% of total costs by 2035 as a second goal [54]. However, the focus for this indicator would be only on the first target since it is more realistic and still far from being applicable. Moreover, having such an indicator is significant. This is because some GCC countries heavily subsidise this cost to their citizens, such as Kuwait with a coverage of 92% of production cost, which cannot be sustainable overall in the long term for the economy [160]. Therefore, data for two main elements are required to proceed with this indicator: the average cost (in case there are different WR with variable costs) and the average water tariff in GCC countries. These data are collected and illustrated in Table A6, with the average cost recovery calculated.
It can be seen that Kuwait’s cost recovery rate is the lowest, while three other countries are charging their population a water tariff that is lower than the real cost. The exception is for Bahrain and Oman with 15.1% and 6.72% higher water tariffs than the real cost, respectively. However, the data for average water costs in Table A6 might need to be revised and updated since many possible changes to the cost occurred recently as a result of the research and development of the used technology and energy. A specific evaluation is provided in Table 22 to find the level of cost recovery for any other country or in the case of different or future data for the GCC countries.

No. 5. Cost Recovery of Wastewater Utilities

Similar to the previous indicator, a comparison is required here between the unit cost of TWW and the tariff paid by the end user. If there are some profits, this will encourage the private sector to manage WWTPs if they are not already available, which takes this burden from the government entities. Hence, more WWTPs could be established either by governments of GCC countries or the private sector or both, which would cause the economy to flourish and protect the environment by reducing the discharge of untreated WW rate. Not only this, but WW treatment and reuse are increasingly necessary to support the water supply in the GCC countries, considering the high expenses linked to desalinated water production [161].
On the other hand, this indicator can shed light on the feasibility of current economic practices and help fix any flaws. Therefore, similar data that were needed to give an estimation for the cost recovery in the previous indicator are required here but for the costs and tariffs of WW. Then, the level of cost recovery would follow the same descriptions and scores in Table 22.

No. 6. Pro-Poor and Pro-Efficiency Water Fees

While the cost recovery through the water tariff is vital for the economy, considering special rates or incentives in the pricing system to use less water can be a win–win deal, especially for poor people. Not only this, but considering this socio-economic indicator would follow part of the global recommendation by the United Nations:
“Any payment for water services has to be based on the principle of equity, ensuring that these services, whether privately or publicly provided, are affordable for all, including socially disadvantaged groups. Equity demands that poorer households should not be disproportionately burdened with water expenses as compared to richer households.”
([162], paragraph 27).
This indicator matters because it would help and encourage low-income people to consume lesser amounts of water that meet their basic needs, and its price fits their budget. For instance, the Increasing Block Tariffs (IBTs) system could be applied, which means the water would have a varying price or tariff based on the monthly total consumed amount, where a low cumulative amount would have a lower unit cost than high consumption [163,164]. To explain, the monthly unit cost of low consumption, for example, with a block cap of 20 m3/month, is 0.5 USD/m3, while the monthly unit cost would increase if the customer exceeded the previous cap to 1 USD/m3 up to the next block cap, and so on.
In addition, using less water in low-income areas would directly or indirectly reduce the O&M costs, which decrease the pressure on the WRM system. Therefore, a particular indicator is suggested here to assess the water tariff system in favour of both poor people and efficient use. The scores of this indicator would be from 0 to 5 based on qualitative descriptions, as shown in Table 23.

4.3.4. Infrastructure Indicators

As explained before, while infrastructure is not one of the main pillars of sustainability, it is still essential for completing the puzzle of SWRM. This is because of the key role of infrastructure in measuring the quality of living in urban areas. This degree of life quality would include checking the water services, which depend on the wide spread of infrastructure, provided to citizens of a particular region or country. Not only this, but the assessment of the common problems facing water infrastructure that could hinder or lessen its benefit is required. Hence, it would be significant to have particular indicators to evaluate the performance of infrastructure in supporting SWRM for the domestic sector.
A list of all infrastructure indicators included in the SWRM-AF with their types and supporting references is presented below in Table 24.

No. 1. Access to Safe Drinking Water

Providing access to safe drinking water can be considered one of the most important basic services that any government or municipality should take care of, and any human should have. However, around 26% of the world’s population (i.e., approximately 2 billion people) in 2020 lacked this access [127] for several reasons. The situation could be more difficult for people in ASAR who are already struggling with the harsh weather most of the year. Therefore, it would be vital to keep tracking this indicator in any region to ensure that the coverage of this access is sufficient and to resolve any reduction. Meanwhile, GCC countries already have a high access rate to safe drinking water, so the target here is to achieve a coverage of 100%, while the lower rates and their equivalent evaluations are presented in Table 25. These estimations are based on the updated data for the world coverage of water for each country, where some countries that are located in ASAR have low access ratio (e.g., Ethiopia with 52%) [166].

No. 2. Access to Sanitation

Many health problems and diseases in the past were due to a lack of proper hygiene after the need to use toilets that might not exist [167]. This issue is still there since approximately 46% of the world’s population (i.e., around 3.6 billion people) in 2020 lacked access to safely managed sanitation services [127]. Hence, it is significant to provide this service to the domestic sector and consider it one of the priorities for any government or municipality when planning its infrastructure. Moreover, this indicator is quite common in many IBWSFs and is responsible for providing a clear picture of the ability of the infrastructure of a region or country to handle this matter. Also, this type of indicator can measure how far or close a city or place is to reaching national or global targets, such as the one provided by the SDGs [127]. Table 26, which is based on comparison criteria suggested by the UN [55], is provided below to measure the level of access to sanitation in any country.

No. 3. Rate of Water Physical Leakage

One of the most essential elements of any infrastructure is the water network. This is because it can ensure that the water can be easily delivered to different users and places through buried pipes or mains. However, water leakage could occur if these mains are not well maintained and monitored or if they are in a deteriorated state. This issue with its effects is fundamental to be considered when the talk is about SWRM. This problem impacts not only the infrastructure, but also all the other three pillars, whether directly or indirectly. Moreover, if the global NRW volume were decreased by just 33%, the resulting savings would be enough to provide water to 800 million individuals, assuming each person consumes 150 litres per day [168]. Therefore, it is highly recommended to specify an indicator for monitoring the level of water leakage to reduce it.
On the other hand, all GCC countries suffered from water leakage in their municipal distribution network, so they aimed in the GCC UWS to reduce it to 10% by 2035 [54]. The previous percentage will be assigned as a target for this indicator, while the baseline will be 40%, which probably represents the highest rate among GCC countries as estimated in KSA. More levels of leakage with their scores are illustrated in Table 27.

No. 4. Share of Desalinated Water Produced to Domestic Sector

Since most GCC countries are not rich in their conventional WR, using DW became necessary to match the growing water demand in the domestic sector and ensure the continuity of water supply. Meanwhile, this technology needs either an appropriate existing infrastructure or the development of a new one that could assist in water transportation from the primary source to the final user. Hence, this indicator would indirectly measure any country’s ability and its infrastructure to depend on DW for the domestic sector. This can be done by knowing the percentage of DW used for municipal use in that region or country. Another benefit of having this indicator, especially for ASAR is that using this non-conventional WR (i.e., DW) can reduce the stress on the non-renewable WR (e.g., NRGW).
Based on data from 2010, the DW share in half of the GCC countries is equal to or more than 90% [54]. Therefore, this percentage (i.e., 90%) can be suggested as a target for other countries to evaluate the preparedness of their infrastructure to accommodate this water supply. More assigned levels of using DW in the domestic sector with their scores are shown in Table 28.

No. 5. Share of Collected Wastewater to Domestic Water

The collection of wastewater can occur if the infrastructure includes a specific network for such a purpose. Otherwise, this WW can be discharged into the environment or kept in special underground tanks without any treatment. To avoid this harmful act, it would be necessary for any country or municipality to enhance its infrastructure to receive more WW. This indicator can be measured by comparing the share of collected WW to domestic water. Hence, infrastructure capacity can be scrutinised, and the environment can be saved. Not only this, but if the increase in WW collection would increase the TWW and its use, this would enhance the sustainability of the entire system. In some GCC countries with available data, the average amount of collected WW was below 50% of the total volume of water provided to the domestic sector in 2010 [54]. This share is aimed to be 60% by 2030 in the GCC UWS [54], which can be considered as the average target or range for our indicator. Other levels and their descriptions are provided in Table 29.

No. 6. Age of Water Infrastructure

It is well known that most engineering design has a suggested lifetime or age that must be considered for regular maintenance, extensive rehabilitation, or replacement required before its function deteriorates. Water infrastructure includes reservoirs, storages, distribution systems represented by pipe networks, and WTPs. On the other hand, ignoring the proper action for monitoring and dealing with the issue of old infrastructure age could cause social, economic, and environmental problems. Therefore, it is suggested here to have a specific indicator that can measure the average age or life cycles of pipes, which could be a proxy for the need to rehabilitate or replace water infrastructure. This type of indicator was applied in other frameworks [2,86], which can be a good sign of its importance.
Table 30 is provided below to give an evaluation for each age or lifetime. The lower age in this table was according to Chohan et al. [169], who found that the typical 50-year lifespan of pipeline networks was considered in multiple life cycle assessment (LCA) studies.

5. Conclusions, Limitations, and Future Research

Several IBWSFs had, at least in theory, great emphasis on fostering the sustainability of WRM, but a few seem to fall short in evaluating the water sustainability of some ASAR with different conditions. Consequently, the main focus of this study is the GCC countries, which are not only located in ASAR, but are also some of the most water-stressed areas in the world, without any permanent rivers or lakes. As a result, this paper is the first in the series of two articles to develop a new conceptual indicator-based framework (i.e., SWRM-AF) for assessing the SWRM of the domestic sector of GCC countries. Such a framework can contribute to the discussion on what this kind of assessment should cover and act as a more thorough and reliable water sustainability assessment tool than what is now available.
On the other hand, this study is the main result of following specific guidelines and the extensive literature review described here to identify components and indicators that form the conceptual SWRM-AF. Moreover, this framework consists of four components: the environment, economy, and society (i.e., three pillars of sustainability), in addition to the infrastructure, representing the main headings of the framework’s structure. Each component is underlaid with six suggested indicators collected from the literature, exemplifying the most critical issues related to the WRM of the domestic sector in the GCC countries. Furthermore, general and specific conditions have been introduced and applied to select individually and collectively the right indicators in order to end with a practical framework.
Probably for the first time, key indicators have been mixed into a single framework for assessing water sustainability. For instance, the intervention acceptability in the social indicators reflects how people can interact with introducing new tools that can reduce water consumption. This type of indicator is important for understanding humans’ motivations and barriers to receiving these new changes to either convince them or adjust the changes based on that understanding. In addition, the environmental impact of the desalination treatment plants has been included in two indicators: the discharge rate of brine and the carbon dioxide emissions. Many other IBWSFs did not consider these indicators since they did not have DW as a significant part of their WR. Therefore, the new assessment framework was created to enable a comprehensive analysis of water ecosystems within the context of ASAR.
The main output of this SWRM-AF is a final value that represents the level of sustainability of the WRM of the considered region or country. Therefore, the simplicity of this output can be valuable for decision-makers and stakeholders to let them both obtain a hint about the situation of their WRM. As a result of the two groups being informed, decision-makers can build strategies toward reinforcing indicators performing well and fixing any indicators with flaws hindering the SWRM process. Meanwhile, decision-makers could ensure stakeholders would likely support their recommendations and cooperate to make them successful.
Additionally, a colour-coded table was provided for each indicator, which might aid in giving a clear image of the subject matter of the evaluation. These kinds of tables are useful in enabling decision-makers, users, and representatives of water authorities from any nation in ASAR to easily and reproducibly use the SWRM-AF. Because of its simplicity and reusability, this research can therefore be considered a true contribution to the field of SWRM.
That being said, this research still lacks one of the most important criteria for developing an IBWSF: the participatory approach. This is because this study aimed to introduce the initial version of SWRM-AF for GCC countries based on searching the literature to select appropriate components and indicators. Then, expert stakeholders will be involved in evaluating this selection with their valuable feedback to obtain the final version of SWRM-AF, but this is out of the scope of this paper. In addition, another limitation of this framework is that few indicators were about GW, although it is one of the main WR in the GCC countries. This is because the accurate data were difficult to find during the filtration stage; therefore, some indicators were excluded. Finally, the calculation (or aggregation process) was not explained thoroughly here because of the descriptive nature of this paper. However, the second paper in this series will produce more details since it should end with the final version of SWRM-AF based on the opinions of the expert stakeholders.

Author Contributions

Conceptualisation, B.S.A.; methodology, B.S.A.; investigation, B.S.A.; resources, B.S.A.; data curation, B.S.A.; writing—original draft preparation, B.S.A.; writing—review and editing, B.S.A., D.V.L.H. and S.S.; visualisation, B.S.A.; supervision, D.V.L.H. and S.S.; project administration, D.V.L.H. All authors have read and agreed to the published version of the manuscript.

Funding

D.V.L.H. received financial support from the UK EPSRC under grant EP/J017698/1 (Transforming the Engineering of Cities to Deliver Societal and Planetary Wellbeing, known as Liveable Cities) and EP/P002021 (From Citizen to Co-innovator, from City Council to Facilitator: Integrating Urban Systems to Provide Better Outcomes for People, known as Urban Living Birmingham).

Institutional Review Board Statement

Not applicable.

Informed Consent Statement

Not applicable.

Data Availability Statement

The data presented in this study are available on request from the corresponding author.

Acknowledgments

B.S.A. gratefully acknowledges the financial support of Qassim University in Saudi Arabia given to him during his doctoral studies.

Conflicts of Interest

The authors declare no conflicts of interest.

Abbreviations and Notations

AbbreviationsNotations
ASARArid and Semi-Arid RegionsDSWiquantity of desalinated water in country (i)
BOD5Biochemical Oxygen DemandDTnet inet total water demand from all sectors in country (i)
BWBrackish WaterNRGWiabstraction quantity of the NRGW in country (i)
CO2Carbon Dioxide RUWireusing quantity of TWW in country (i)
CODChemical Oxygen Demand SFWAiavailability of surface freshwater in country (i)
DWDesalination Water
DPsDesalination Plants
EPIEnvironmental Performance Index
FCFaecal Coliform
GCCGulf Cooperation Council
GCC UWSGulf Cooperation Council Unified Water Strategy
GHGGreenhouse Gas
GWGroundwater
IBTsIncreasing Block Tariffs
IBWSFIndicator-Based Water Sustainability Framework
IWRMIntegrated Water Resources Management
KSAKingdom of Saudi Arabia
LCALife Cycle Assessment
MCMMillion Cubic Meters
MEDMulti-Effect Distillation
MSFMulti-Stage Flash
NH3-NAmmoniacal Nitrogen
NO3Nitrates
NRGWNon-Renewable Groundwater
NRWNon-revenue Water
O&MOperation and Maintenance
pHPotential of Hydrogen
RGWRenewable Groundwater
ROReverse Osmosis
RWRenewed Water
RWHRainwater Harvesting
SASOSaudi Arabian Standards Organization
SDGSustainable Development Goal
SeWSeawater
SMARTSpecific, Measurable, Achievable, Realistic/Relevant, and Tangible/Time-Bound
SWSurface Water
SWMSmart Water Meter
SWRMSustainable Water Resources Management
SWRM-AFSustainable Water Resources Management Assessment Framework
TBLTriple Bottom Line
TDSTotal Dissolved Solids
TSSTotal Suspended Solids
TWWTreated Wastewater
UAEUnited Arab Emirates
UFWUnaccounted-for Water
WQIWater Quality Index
WRWater Resources
WRIWorld Resources Institute
WRMWater Resources Management

Appendix A

All real data belonging to GCC countries will be provided here in tables to let the users of the framework know what type of information they should look for during the application or implementation stage. These tables are presented as follows:
Table A1. DW daily production and the share of using each desalination technology in GCC countries.
CountryDesalinated Water Production Data of 2020Desalination TechnologyCountry-Wise Share Based on Technology
(Million m3/day)(%)
Saudi Arabia5.9MSF38.2
RO51.5
MED8.3
Oman1.18MSF19.4
RO75.7
MED4.9
Qatar2.16MSF63.8
RO22.4
MED12.5
UAE7.21MSF61.6
RO22.8
MED15.6
Bahrain0.82MSF26.8
RO41.6
MED29.5
Kuwait1.89MSF57.7
RO29.7
MED12.6
Table A2. Standard quality parameters of WW and TWW in KSA [170].
Parameter
(Unit)
BOD5
(Mg/L)
COD
(Mg/L)
TSS
(Mg/L)
TDS
(ppm)
pH
(Mg/L)
NH3-N
(Mg/L)
NO3
(Mg/L)
FC
(Cells/100 mL)
Water Type
WW≤500≤1000≤600-6–9≤80--
Secondary TWW≤40-≤40≤25006–8.4≤5≤10≤1000
Tertiary TWW≤10-≤10≤25006–8.4≤5≤10≤2.2
Table A3. CO2 emissions per m3 of produced water for different desalination technologies [171].
TechnologyReverse Osmosis
(RO)
Multi-Stage Flash
(MSF)
Multi-Effect Distillation
(MED)
CO2 emissions
(kg CO2/m3)
0.08–4.30.3–34.70.3–26.9
Table A4. Standard quality parameters of drinking water [172].
Parameter
(Unit)
Turbidity
(NTU)
Total Dissolved Solids (TDS)
(Mg/L)
Free Cl2
(Mg/L)
pHTotal Coliforms (TC)
(Counts/100 mL)
Water supply<5<7000.2–0.56.5–8.50
Table A5. Examples of required data to calculate the relation between average user income and the water cost *.
CountryAverage Household
(Year)
Average Yearly
Income d
(USD)
Average Monthly
Income
(USD)
Average Daily Water Consumption
(L/capita/day)
Average Monthly Water Consumption
(m3/House/Month)
Average Water Tariff
(USD/m3)
KSA5.6 (2010) a27,5902299.17278 e46.71.07 g
Oman8.0 (2003) b20,1501679.17140 f33.61.43 h
Qatar4.7 (2012) b70,5005875.00512 f72.21.51 i
UAE4.9 (2022) c48,9504079.17520 f76.41.35 j
Bahrain5.9 (2010) a27,1802265.00320 f56.62.21 k
Kuwait5.8 (2011) a39,5703297.50500 f87.00.58 l
a [173], b [174], c [175], d [176], e [140], f [54], g [177], h [178], i [179,180], j [181], k [182], l [183], * water tariff is different in these countries since some of them charged variable tariff based on specific ranges of water consumption, while some give discounted rate (e.g., UAE) or free of charge (e.g., Qatar) for their citizens, while non-citizens should pay higher amounts.
Table A6. Examples for average water costs, tariffs, cost recovery ratio in GCC countries.
CountryAverage Costs of Water Supply
(USD/m3)
Average Water Tariff
(USD/m3)
Average Cost Recovery
(%)
Saudi Arabia2 a1.07 e53.50%
Oman1.34 b1.43 f106.72%
Qatar2.74 c1.51 g55.11%
UAE2.48 c1.35 h54.44%
Bahrain1.92 c2.21 i115.10%
Kuwait2.42 d0.58 j23.97%
a [184], b [159], c [185], d [186], e [177], f [178], g [179,180], h [181], i [182], j [183].

References

  1. WCED. Our Common Future; World Commission on Environment and Development; Oxford University Press: Oxford, UK, 1987; p. 300. [Google Scholar]
  2. Iribarnegaray, M.A.; Copa, F.R.; Gatto D’Andrea, M.L.; Arredondo, M.F.; Cabral, J.D.; Correa, J.J.; Liberal, V.I.; Seghezzo, L. A Comprehensive Index to Assess the Sustainability of Water and Sanitation Management Systems. J. Water Sanit. Hyg. Dev. 2012, 2, 205–222. [Google Scholar] [CrossRef]
  3. Pope, J.; Annandale, D.; Morrison-Saunders, A. Conceptualising Sustainability Assessment. Environ. Impact Assess. Rev. 2004, 24, 595–616. [Google Scholar] [CrossRef]
  4. Devuyst, D.; Hens, L.; De Lannoy, W. (Eds.) How Green Is the City? Sustainability Assessment and the Management of Urban Environments; Columbia University Press: New York, NY, USA, 2001. [Google Scholar]
  5. United Nations. Transforming Our World: The 2030 Agenda for Sustainable Development; United Nations: New York, NY, USA, 2015. [Google Scholar]
  6. Hunt, D.V.; Lombardi, D.R.; Rogers, C.D.; Jefferson, I. Application of Sustainability Indicators in Decision-Making Processes for Urban Regeneration Projects. Proc. Inst. Civ. Eng. Eng. Sustain. 2008, 161, 77–91. [Google Scholar] [CrossRef]
  7. Ness, B.; Urbel-Piirsalu, E.; Anderberg, S.; Olsson, L. Categorising Tools for Sustainability Assessment. Ecol. Econ. 2007, 60, 498–508. [Google Scholar] [CrossRef]
  8. Kajikawa, Y. Research Core and Framework of Sustainability Science. Sustain. Sci. 2008, 3, 215–239. [Google Scholar] [CrossRef]
  9. Jenkins, B.; Annandale, D.; Morrison-Saunders, A. The Evolution of a Sustainability Assessment Strategy for Western Australia. Environ. Plan. Law J. 2003, 20, 56–65. [Google Scholar]
  10. Sullivan, C. Calculating a Water Poverty Index. World Dev. 2002, 30, 1195–1210. [Google Scholar] [CrossRef]
  11. Chaves, H.M.L.; Alipaz, S. An Integrated Indicator Based on Basin Hydrology, Environment, Life, and Policy: The Watershed Sustainability Index. Water Resour. Manag. 2007, 21, 883–895. [Google Scholar] [CrossRef]
  12. Policy Research Initiative. Canadian Water Sustainability Index (CWSI): Project Report; Policy Research Initiative: Ottawa, ON, Canada, 2007; ISBN 978-0-662-45045-0. [Google Scholar]
  13. Juwana, I.; Perera, B.J.C.; Muttil, N. A Water Sustainability Index for West Java. Part 1: Developing the Conceptual Framework. Water Sci. Technol. 2010, 62, 1629–1640. [Google Scholar] [CrossRef]
  14. Bertule, M.; Bjørnsen, P.K.; Costanzo, S.D.; Escurra, J.; Freeman, S.; Gallagher, L.; Kelsey, R.H.; Vollmer, D. Using Indicators for Improved Water Resources Management: Guide for Basin Managers and Practitioners. 2017. Available online: https://ian.umces.edu/site/assets/files/11189/using-indicators-for-improved-water-resources-management.pdf (accessed on 16 September 2019).
  15. Xu, J.; Xie, G.; Xiao, Y.; Li, N.; Yu, F.; Pei, S.; Jiang, Y. Dynamic Analysis of Ecological Environment Quality Combined with Water Conservation Changes in National Key Ecological Function Areas in China. Sustainability 2018, 10, 1202. [Google Scholar] [CrossRef]
  16. McGarigal, K.; Compton, B.W.; Plunkett, E.B.; DeLuca, W.V.; Grand, J.; Ene, E.; Jackson, S.D. A Landscape Index of Ecological Integrity to Inform Landscape Conservation. Landsc. Ecol. 2018, 33, 1029–1048. [Google Scholar] [CrossRef]
  17. Xu, K.; Bin, L.; Xu, X. Assessment of Water Resources Sustainability in Mainland China in Terms of Water Intensity and Efficiency. Environ. Manag. 2019, 63, 309–321. [Google Scholar] [CrossRef]
  18. Abel, N.; Ecosystems, C.S.; Cork, S.; Gorddard, R.; Langridge, J.; Langston, A.; Plant, R.; Proctor, W.; Ryan, P.; Shelton, D.; et al. Natural Values: Exploring Options for Enhancing Ecosystem Services in the Goulburn Broken Catchment. CSIRO Sustainable Ecosystems: 2003. Available online: https://vtechworks.lib.vt.edu/handle/10919/66797 (accessed on 24 November 2023).
  19. Smajgl, A.; Larson, S.; Hug, B.; De Freitas, D.M. Water Use Benefit Index as a Tool for Community-Based Monitoring of Water Related Trends in the Great Barrier Reef Region. J. Hydrol. 2010, 395, 1–9. [Google Scholar] [CrossRef]
  20. Dodds, W.K.; Perkin, J.S.; Gerken, J.E. Human Impact on Freshwater Ecosystem Services: A Global Perspective. Environ. Sci. Technol. 2013, 47, 9061–9068. [Google Scholar] [CrossRef] [PubMed]
  21. Bos, M.G. Performance Indicators for Irrigation and Drainage. Irrig. Drain. Syst. 1997, 11, 119–137. [Google Scholar] [CrossRef]
  22. Sara, J.; Katz, T. Making Rural Water Supply Sustainable: Report on the Impact of Project Rules; UNDP-World Bank Water and Sanitation Program: Washington, DC, USA, 1997; p. 56. [Google Scholar]
  23. Stampini, M.; Salami, A.; Sullivan, C.A. The Water and Sanitation Index of Development Effectiveness (WIDE) in Sub-Saharan Africa: Overview of Country Performance. Afr. Econ. Brief 2012, 3, 1–8. [Google Scholar]
  24. Xu, F.-L.; Zhao, Z.-Y.; Zhan, W.; Zhao, S.-S.; Dawson, R.W.; Tao, S. An Ecosystem Health Index Methodology (EHIM) for Lake Ecosystem Health Assessment. Ecol. Model. 2005, 188, 327–339. [Google Scholar] [CrossRef]
  25. Lacouture, R.V.; Johnson, J.M.; Buchanan, C.; Marshall, H.G. Phytoplankton Index of Biotic Integrity for Chesapeake Bay and Its Tidal Tributaries. Estuaries Coasts 2006, 29, 598–616. [Google Scholar] [CrossRef]
  26. Brooks, R.; McKenney-Easterling, M.; Brinson, M.; Rheinhardt, R.; Havens, K.; O’Brien, D.; Bishop, J.; Rubbo, J.; Armstrong, B.; Hite, J. A Stream-Wetland-Riparian (SWR) Index for Assessing Condition of Aquatic Ecosystems in Small Watersheds along the Atlantic Slope of the Eastern U.S. Environ. Monit. Assess. 2009, 150, 101–117. [Google Scholar] [CrossRef] [PubMed]
  27. Korbel, K.L.; Hose, G.C. A Tiered Framework for Assessing Groundwater Ecosystem Health. Hydrobiologia 2011, 661, 329–349. [Google Scholar] [CrossRef]
  28. Lundin, M.; Morrison, G.M. A Life Cycle Assessment Based Procedure for Development of Environmental Sustainability Indicators for Urban Water Systems. Urban. Water 2002, 4, 145–152. [Google Scholar] [CrossRef]
  29. van Leeuwen, C.J.; Frijns, J.; van Wezel, A.; van de Ven, F.H.M. City Blueprints: 24 Indicators to Assess the Sustainability of the Urban Water Cycle. Water Resour. Manag. 2012, 26, 2177–2197. [Google Scholar] [CrossRef]
  30. Carden, K.; Armitage, N.P. Assessing Urban Water Sustainability in South Africa—Not Just Performance Measurement. Water SA 2013, 39, 345–350. [Google Scholar] [CrossRef]
  31. Shilling, F. The California Water Sustainability Indicators Framework: Draft Final Report. 2013, p. 309. Available online: https://aquadoc.typepad.com/files/cwp_sif_phase-ii_draft_final_report_dec2013.pdf (accessed on 3 November 2021).
  32. Juwana, I.; Muttil, N.; Perera, B.J.C. Application of West Java Water Sustainability Index to Three Water Catchments in West Java, Indonesia. Ecol. Indic. 2016, 70, 401–408. [Google Scholar] [CrossRef]
  33. Barton, H. Conflicting Perceptions of Neighbourhood. In Sustainable Communities; Routledge: London, UK, 2000; ISBN 978-1-315-87064-9. [Google Scholar]
  34. Giddings, B.; Hopwood, B.; O’Brien, G. Environment, Economy and Society: Fitting Them Together into Sustainable Development. Sustain. Dev. 2002, 10, 187–196. [Google Scholar] [CrossRef]
  35. Alsaeed, B.S.; Hunt, D.V.L.; Sharifi, S. Sustainable Water Resources Management Assessment Frameworks (SWRM-AF) for Arid and Semi-Arid Regions: A Systematic Review. Sustainability 2022, 14, 15293. [Google Scholar] [CrossRef]
  36. Şen, Z.; Al-Harithy, S.; As-Sefry, S.; Almazroui, M. Aridity and Risk Calculations in Saudi Arabian Wadis: Wadi Fatimah Case. Earth Syst. Environ. 2017, 1, 26. [Google Scholar] [CrossRef]
  37. Cirilo, J.A. Public Water Resources Policy for the Semi-Arid Region. Estud. Avançados 2008, 22, 61–82. [Google Scholar] [CrossRef]
  38. Tyler, S.W. Are Arid Regions Always That Appropriate for Waste Disposal? Examples of Complexity from Yucca Mountain, Nevada. Geosciences 2020, 10, 30. [Google Scholar] [CrossRef]
  39. Jolly, I.D.; McEwan, K.L.; Holland, K.L. A Review of Groundwater–Surface Water Interactions in Arid/Semi-Arid Wetlands and the Consequences of Salinity for Wetland Ecology. Ecohydrology 2008, 1, 43–58. [Google Scholar] [CrossRef]
  40. Almazroui, M.; Islam, M.N.; Balkhair, K.S.; Şen, Z.; Masood, A. Rainwater Harvesting Possibility under Climate Change: A Basin-Scale Case Study over Western Province of Saudi Arabia. Atmos. Res. 2017, 189, 11–23. [Google Scholar] [CrossRef]
  41. Gain, A.K.; Giupponi, C.; Wada, Y. Measuring Global Water Security towards Sustainable Development Goals. Environ. Res. Lett. 2016, 11, 124015. [Google Scholar] [CrossRef]
  42. da Silva, J.; Fernandes, V.; Limont, M.; Dziedzic, M.; Andreoli, C.V.; Rauen, W.B. Water Sustainability Assessment from the Perspective of Sustainable Development Capitals: Conceptual Model and Index Based on Literature Review. J. Environ. Manag. 2020, 254, 109750. [Google Scholar] [CrossRef] [PubMed]
  43. Juwana, I.; Perera, B.J.C.; Muttil, N. A Water Sustainability Index for West Java—Part 2: Refining the Conceptual Framework Using Delphi Technique. Water Sci. Technol. 2010, 62, 1641–1652. [Google Scholar] [CrossRef] [PubMed]
  44. Moglia, M.; Neumann, L.E.; Alexander, K.S.; Nguyen, M.N.; Sharma, A.K.; Cook, S.; Trung, N.H.; Tuan, D.D.A. Application of the Water Needs Index: Can Tho City, Mekong Delta, Vietnam. J. Hydrol. 2012, 468–469, 203–212. [Google Scholar] [CrossRef]
  45. Vollmer, D.; Shaad, K.; Souter, N.J.; Farrell, T.; Dudgeon, D.; Sullivan, C.A.; Fauconnier, I.; MacDonald, G.M.; McCartney, M.P.; Power, A.G.; et al. Integrating the Social, Hydrological and Ecological Dimensions of Freshwater Health: The Freshwater Health Index. Sci. Total Environ. 2018, 627, 304–313. [Google Scholar] [CrossRef]
  46. Peel, M.C.; Finlayson, B.L.; McMahon, T.A. Updated World Map of the Köppen-Geiger Climate Classification. Hydrol. Earth Syst. Sci. 2007, 11, 1633–1644. [Google Scholar] [CrossRef]
  47. Erian, W. Agriculture Drought and Land Degradation Risk in Arab Region. In Proceedings of the First Arab Regional Conference for Disaster Risk Reduction, Aqaba, Jordan, 19 March 2013. [Google Scholar]
  48. Glickman, T.S. Glossary of Meteorology, 2nd ed.; American Meteorological Society: Boston, MA, USA, 2000; ISBN 978-1-878220-34-9. [Google Scholar]
  49. Beaumont, P.; Blake, G.; Wagstaff, J.M. The Middle East: A Geographical Study, 2nd ed.; David Fulton: London, UK, 1988; ISBN 978-1-315-62819-6. [Google Scholar]
  50. Encyclopædia Britannica Map of Gulf Cooperation Council. Available online: https://www.britannica.com/topic/Gulf-Cooperation-Council#/media/1/249154/238463 (accessed on 22 June 2023).
  51. Water Resources Committee. Desalination in the GCC. The History, the Present & the Future, 2nd ed.; Secretariat General of the GCC: Riyadh, Saudi Arabia, 2014; ISBN 978-0-19-923169-0. [Google Scholar]
  52. Akkad, A.A. Water Conservation in Arid and Semi-Arid Regions. Desalination 1989, 72, 185–205. [Google Scholar] [CrossRef]
  53. Sahour, H.; Vazifedan, M.; Alshehri, F. Aridity Trends in the Middle East and Adjacent Areas. Theor. Appl. Climatol. 2020, 142, 1039–1054. [Google Scholar] [CrossRef]
  54. Al-Zubari, W.; Al-Turbak, A.; Zahid, W.; Al-Ruwis, K.; Al-Tkhais, A.; Al-Mutaz, I.; Abdelwahab, A.; Murad, A.; Al-Harbi, M.; Al-Sulaymani, Z. An Overview of the GCC Unified Water Strategy (2016–2035). Desalination Water Treat. 2017, 81, 1–18. [Google Scholar] [CrossRef]
  55. UN Habitat; WHO. Progress on Wastewater Treatment—Global Status and Acceleration Needs for SDG Indicator 6.3.1.; United Nations Human Settlements Programme (UN-Habitat) and World Health Organization (WHO): Geneva, Switzerland, 2021; ISBN 978-92-1-132878-3. [Google Scholar]
  56. GCC-STAT. Summary of Water Statistics of GCC Countries in 2020; GCC-STAT Office: Muscat, Oman, 2022. [Google Scholar]
  57. Al Rashed, M.; Sefelnasr, A.; Sherif, M.; Murad, A.; Alshamsi, D.; Aliewi, A.; Ebraheem, A.A. Novel Concept for Water Scarcity Quantification Considering Nonconventional and Virtual Water Resources in Arid Countries: Application in Gulf Cooperation Council Countries. Sci. Total Environ. 2023, 882, 163473. [Google Scholar] [CrossRef]
  58. Al-Sheikh, H.M.H. Agricultural Policy and the Economics of Water Use in the Riyadh Region of Saudi Arabia. Ph.D. Thesis, Stanford University, Stanford, CA, USA, 1995. [Google Scholar]
  59. World Bank Population, Total 2023. Available online: https://api.worldbank.org/v2/en/indicator/SP.POP.TOTL?downloadformat=excel (accessed on 3 June 2023).
  60. Odhiambo, G.O. Water Scarcity in the Arabian Peninsula and Socio-Economic Implications. Appl. Water Sci. 2017, 7, 2479–2492. [Google Scholar] [CrossRef]
  61. Angelakis, A.N.; Valipour, M.; Choo, K.-H.; Ahmed, A.T.; Baba, A.; Kumar, R.; Toor, G.S.; Wang, Z. Desalination: From Ancient to Present and Future. Water 2021, 13, 2222. [Google Scholar] [CrossRef]
  62. Qureshi, A.S. Challenges and Prospects of Using Treated Wastewater to Manage Water Scarcity Crises in the Gulf Cooperation Council (GCC) Countries. Water 2020, 12, 1971. [Google Scholar] [CrossRef]
  63. Höpner, T.; Windelberg, J. Elements of Environmental Impact Studies on Coastal Desalination Plants. Desalination 1997, 108, 11–18. [Google Scholar] [CrossRef]
  64. Sadhwani, J.J.; Veza, J.M.; Santana, C. Case Studies on Environmental Impact of Seawater Desalination. Desalination 2005, 185, 1–8. [Google Scholar] [CrossRef]
  65. Napoli, C.; Rioux, B. Evaluating the Economic Viability of Solar-Powered Desalination: Saudi Arabia as a Case Study. Int. J. Water Resour. Dev. 2016, 32, 412–427. [Google Scholar] [CrossRef]
  66. Moossa, B.; Trivedi, P.; Saleem, H.; Zaidi, S.J. Desalination in the GCC Countries- a Review. J. Clean. Prod. 2022, 357, 131717. [Google Scholar] [CrossRef]
  67. Sebastian, F.P. Purified Wastewater: The Untapped Water Resource. Water Pollut. Control. Fed. 1974, 46, 239–246. [Google Scholar]
  68. Al-Jasser, A.O. Saudi Wastewater Reuse Standards for Agricultural Irrigation: Riyadh Treatment Plants Effluent Compliance. J. King Saud Univ. Eng. Sci. 2011, 23, 1–8. [Google Scholar] [CrossRef]
  69. Zhao, P.; Ma, M.; Hu, Y.; Wu, W.; Xiao, J. Comparison of International Standards for Irrigation with Reclaimed Water. Agric. Water Manag. 2022, 274, 107974. [Google Scholar] [CrossRef]
  70. Hofste, R.W.; Reig, P.; Schleifer, L. 17 Countries, Home to One-Quarter of the World’s Population, Face Extremely High Water Stress. Available online: https://www.wri.org/blog/2019/08/17-countries-home-one-quarter-world-population-face-extremely-high-water-stress (accessed on 10 October 2019).
  71. World Bank World Development Indicators 2023. Available online: https://data.worldbank.org/indicator/ER.H2O.FWTL.K3?locations=OM-KW (accessed on 20 June 2023).
  72. Abdulrazzak, M.J. Review and Assessment of Water Resources in Gulf Cooperation Council Countries. Int. J. Water Resour. Dev. 1994, 10, 23–37. [Google Scholar] [CrossRef]
  73. Sherif, M.; Sefelnasr, A.; Al Rashed, M.; Alshamsi, D.; Zaidi, F.K.; Alghafli, K.; Baig, F.; Al-Turbak, A.; Alfaifi, H.; Loni, O.A.; et al. A Review of Managed Aquifer Recharge Potential in the Middle East and North Africa Region with Examples from the Kingdom of Saudi Arabia and the United Arab Emirates. Water 2023, 15, 742. [Google Scholar] [CrossRef]
  74. Parmigiani, L. Water and Energy in the GCC: Securing Scarce Water in Oil-Rich Countries; IFRI: Institut Français des Relations Internationales: Paris, France, 2015. [Google Scholar]
  75. Boretti, A.; Rosa, L. Reassessing the Projections of the World Water Development Report. Npj Clean Water 2019, 2, 1–6. [Google Scholar] [CrossRef]
  76. Baig, M.B.; Straquadine, G.S. Sustainable Agriculture and Rural Development in the Kingdom of Saudi Arabia: Implications for Agricultural Extension and Education. In Vulnerability of Agriculture, Water and Fisheries to Climate Change: Toward Sustainable Adaptation Strategies; Behnassi, M., Syomiti Muteng’e, M., Ramachandran, G., Shelat, K.N., Eds.; Springer: Dordrecht, The Netherlands, 2014; pp. 101–116. ISBN 978-94-017-8962-2. [Google Scholar]
  77. Alturki, F. Promoting Sustainable Development Through Environmental Law: Prospects for Saudi Arabia. PhD Thesis, Pace University, New York, NY, USA, 2015. [Google Scholar]
  78. Shah, T. Groundwater Governance and the Water-Energy-Food Nexus in Action: A Global Review of Policy and Practice; FAO: Rome, Italy, 2023. [Google Scholar]
  79. Al-Zahrani, K.H. Sustainable Development of Agriculture and Water Resources in the Kingdom of Saudi Arabia. Conf. Int. J. ArtsSci. 2009, 1, 3–37. [Google Scholar]
  80. AL-Subaiee, S.; Yoder, E.; Thomson, J. Extension Agents’ Perceptions of Sustainable Agriculture in the Riyadh Region of Saudi Arabia. JIAEE 2005, 12, 5–14. [Google Scholar] [CrossRef]
  81. USDA. Saudi Arabia Grain and Feed Annual 2016; United States Department of Agriculture: Washington, DC, USA, 2016. [Google Scholar]
  82. Al Bannay, S.; Takizawa, S. Decoupling of Water Production and Electricity Generation from GDP and Population in the Gulf Cooperation Council (GCC) Countries. Sustainability 2022, 14, 5386. [Google Scholar] [CrossRef]
  83. AQUASTAT. FAO’s Global Information System on Water and Agriculture. Available online: https://data.apps.fao.org/aquastat/?lang=en (accessed on 13 November 2023).
  84. Thornton, K.W.; Laurin, C.; Shortle, J.; Fisher, A.; Sobrinho, J.; Stewart, M. A Framework and Guidelines for Moving Toward Sustainable Water Resources Management. Proc. Water Environ. Fed. 2006, 2006, 2762–2777. [Google Scholar] [CrossRef]
  85. Guy, G.B.; Kibert, C.J. Developing Indicators of Sustainability: US Experience. Build. Res. Inf. 1998, 26, 39–45. [Google Scholar] [CrossRef]
  86. Cole, J.; Sharvelle, S.; Fourness, D.; Grigg, N.; Roesner, L.; Haukaas, J. Centralized and Decentralized Strategies for Dual Water Supply: Case Study. J. Water Resour. Plan. Manag. 2018, 144, 05017017. [Google Scholar] [CrossRef]
  87. Bahar, N.S.; Noor, Z.Z.; Aris, A.; Kamaruzaman, N.A.B. An Indicator Framework Approach on Manufacturing Water Assessment towards Sustainable Water Demand Management. J. Environ. Treat. Tech. 2020, 8, 875–883. [Google Scholar]
  88. Crispim, D.L.; Pimentel Da Silva, G.D.; Fernandes, L.L. Rural Water Sustainability Index (RWSI): An Innovative Multicriteria and Participative Approach for Rural Communities. Null 2021, 39, 320–334. [Google Scholar] [CrossRef]
  89. Loucks, D.P. , Gladwell, J.S. (Eds.) Sustainability Criteria for Water Resource Systems; UNESCO International Hydrology Series; Cambridge University Press: Cambridge, UK, 1999. [Google Scholar]
  90. Foxon, T.J.; McIlkenny, G.; Gilmour, D.; Oltean-Dumbrava, C.; Souter, N.; Ashley, R.; Butler, D.; Pearson, P.; Jowitt, P.; Moir, J. Sustainability Criteria for Decision Support in the UK Water Industry. J. Environ. Plan. Manag. 2002, 45, 285–301. [Google Scholar] [CrossRef]
  91. Mays, L.W. (Ed.) Water Resources Sustainability, 1st ed.; McGraw-Hill Education: New York, NY, USA, 2006; ISBN 978-0-07-146230-3. [Google Scholar]
  92. Criollo, R.; Malheiros, T.; Alfaro, J.F. Municipal Environmental Management Indicators: A Bottom-Up Approach Applied to the Colombian Context. Soc. Indic. Res. 2019, 141, 1037–1054. [Google Scholar] [CrossRef]
  93. Rogers, B.C.; Dunn, G.; Hammer, K.; Novalia, W.; de Haan, F.J.; Brown, L.; Brown, R.R.; Lloyd, S.; Urich, C.; Wong, T.H.F.; et al. Water Sensitive Cities Index: A Diagnostic Tool to Assess Water Sensitivity and Guide Management Actions. Water Res. 2020, 186, 116411. [Google Scholar] [CrossRef]
  94. Lawrence, P.; Meigh, J.; Sullivan, C. The Water Poverty Index:An International Comparison; Keele Economics Research Papers; Centre for Economic Research, Keele University: Newcastle, UK, 2002. [Google Scholar]
  95. Juwana, I.; Muttil, N.; Perera, C. West Java Water Sustainability Index—A Case Study on Citarum Catchment. In Proceedings of the 19th International Congress on Modelling and Simulation, Perth, Australia, 12–16 December 2011; pp. 2184–2190. Available online: https://www.researchgate.net/publication/261877023_West_Java_Water_Sustainability_Index_-_A_Case_Study_on_Citarum_Catchment (accessed on 24 November 2023).
  96. Marttunen, M.; Mustajoki, J.; Sojamo, S.; Ahopelto, L.; Keskinen, M. A Framework for Assessing Water Security and the Water–Energy–Food Nexus—The Case of Finland. Sustainability 2019, 11, 2900. [Google Scholar] [CrossRef]
  97. da Silva, J.; Fernandes, V.; Limont, M.; Rauen, W.B. Sustainable Development Assessment from a Capitals Perspective: Analytical Structure and Indicator Selection Criteria. J. Environ. Manag. 2020, 260, 110147. [Google Scholar] [CrossRef]
  98. Lundie, S.; Peters, G.; Ashbolt, N.; Lai, E.; Livingston, D. A Sustainability Framework for the Australian Water Industry. Water J. Aust. Water Assoc. 2006, 33, 83–88. [Google Scholar] [CrossRef]
  99. United Nations (Ed. ) Indicators of Sustainable Development: Guidelines and Methodologies, 3rd ed.; United Nations: New York, NY, USA, 2007; ISBN 978-92-1-104577-2. [Google Scholar]
  100. ICWE. The Dublin Statement on Water and Sustainable Development; International Conference on Water and the Environment: Dublin, Ireland, 1992. [Google Scholar]
  101. GWP-TAC. Background Paper No. 4. Integrated Water Resources Management; Technical Advisory Committee of Global Water Partnership: Stockholm, Sweden, 2000; p. 71. [Google Scholar]
  102. Mostert, E.; Craps, M.; Pahl-Wostl, C. Social Learning: The Key to Integrated Water Resources Management? Water Int. 2008, 33, 293–304. [Google Scholar] [CrossRef]
  103. Basco-Carrera, L.; Warren, A.; van Beek, E.; Jonoski, A.; Giardino, A. Collaborative Modelling or Participatory Modelling? A Framework for Water Resources Management. Environ. Model. Softw. 2017, 91, 95–110. [Google Scholar] [CrossRef]
  104. Badham, J.; Elsawah, S.; Guillaume, J.H.A.; Hamilton, S.H.; Hunt, R.J.; Jakeman, A.J.; Pierce, S.A.; Snow, V.O.; Babbar-Sebens, M.; Fu, B.; et al. Effective Modeling for Integrated Water Resource Management: A Guide to Contextual Practices by Phases and Steps and Future Opportunities. Environ. Model. Softw. 2019, 116, 40–56. [Google Scholar] [CrossRef]
  105. Vogel, R.M.; Lall, U.; Cai, X.; Rajagopalan, B.; Weiskel, P.K.; Hooper, R.P.; Matalas, N.C. Hydrology: The Interdisciplinary Science of Water. Water Resour. Res. 2015, 51, 4409–4430. [Google Scholar] [CrossRef]
  106. Voinov, A.; Jenni, K.; Gray, S.; Kolagani, N.; Glynn, P.D.; Bommel, P.; Prell, C.; Zellner, M.; Paolisso, M.; Jordan, R.; et al. Tools and Methods in Participatory Modeling: Selecting the Right Tool for the Job. Environ. Model. Softw. 2018, 109, 232–255. [Google Scholar] [CrossRef]
  107. Liverman, D.M.; Hanson, M.E.; Brown, B.J.; Merideth, R.W. Global Sustainability: Toward Measurement. Environ. Manag. 1988, 12, 133–143. [Google Scholar] [CrossRef]
  108. Ben-Daoud, M.; Moumen, A.; Sayad, A.; Elbouhadioui, M.; Essahlaoui, A.; Eljaafari, S. Indicators of Integrated Water Resources Management at the Local Level: Meknes as a Case (Morocco). In Proceedings of the E3S Web of Conferences, Kenitra, Morocco, 24–25 September 2021; Volume 234. [Google Scholar]
  109. Juwana, I.; Muttil, N.; Perera, B.J.C. Indicator-Based Water Sustainability Assessment—A Review. Sci. Total Environ. 2012, 438, 357–371. [Google Scholar] [CrossRef]
  110. Alsalmi, H.; Elkadi, H.A.; Leao, S. Urban Growth in Arid Environments: Developing Water Sustainability Indicators for Abu Dhabi (UAE). In Proceedings of the 6th Making Cities Liveable Conference, in Conjunction with the Sustainable Transformation Conference, Melbourne, Victoria, 17–19 June 2013. [Google Scholar]
  111. Pires, A.; Morato, J.; Peixoto, H.; Botero, V.; Zuluaga, L.; Figueroa, A. Sustainability Assessment of Indicators for Integrated Water Resources Management. Sci. Total Environ. 2017, 578, 139–147. [Google Scholar] [CrossRef]
  112. Muñoz, I.; Fernández-Alba, A.R. Reducing the Environmental Impacts of Reverse Osmosis Desalination by Using Brackish Groundwater Resources. Water Res. 2008, 42, 801–811. [Google Scholar] [CrossRef]
  113. Gil-Trujillo, A.; Sadhwani Alonso, J.J. Evaluation of Brine Management Strategies from the Perspective of the Sustainable Development Goals: Application in the Canary Islands. Desalination 2023, 554, 116483. [Google Scholar] [CrossRef]
  114. Afgan, N.H.; Darwish, M.; Carvalho, M.G. Sustainability Assessment of Desalination Plants for Water Production. Desalination 1999, 124, 19–31. [Google Scholar] [CrossRef]
  115. OECD. Performance Indicators for Wastewater Collection and Treatment Services; Working Party on Biodiversity, Water and Ecosystems; Organisation for Economic Co-operation and Development, Environment Directorate and Environment Policy Committee: Paris, France, 2022. [Google Scholar]
  116. Iribarnegaray, M.A.; D’Andrea, M.L.G.; Rodriguez-Alvarez, M.S.; Hernández, M.E.; Brannstrom, C.; Seghezzo, L. From Indicators to Policies: Open Sustainability Assessment in the Water and Sanitation Sector. Sustainability 2015, 7, 14537–14557. [Google Scholar] [CrossRef]
  117. Najar, N.; Persson, K.M. A Sustainability Index within Water and Wastewater Management in Sweden: An Evaluation of Eight Case Studies. Water 2021, 13, 1879. [Google Scholar] [CrossRef]
  118. Nair, M.; Kumar, D. Water Desalination and Challenges: The Middle East Perspective: A Review. Desalination Water Treat. 2013, 51, 2030–2040. [Google Scholar] [CrossRef]
  119. Ahmed, M.; Shayya, W.H.; Hoey, D.; Al-Handaly, J. Brine Disposal from Reverse Osmosis Desalination Plants in Oman and the United Arab Emirates. Desalination 2001, 133, 135–147. [Google Scholar] [CrossRef]
  120. Djuma, H.; Bruggeman, A.; Eliades, M.; Lange, M.A. Non-Conventional Water Resources Research in Semi-Arid Countries of the Middle East. Desalination Water Treat. 2016, 57, 2290–2303. [Google Scholar] [CrossRef]
  121. Wenten, I.G.; Ariono, D.; Purwasasmita, M. Khoirudin Integrated Processes for Desalination and Salt Production: A Mini-Review. In Proceedings of the 5th International Conference on Education, Concept, and Application of Green Technology, Semarang, Indonesia, 11 October 2017; p. 020065. [Google Scholar]
  122. Amy, G.; Ghaffour, N.; Li, Z.; Francis, L.; Linares, R.V.; Missimer, T.; Lattemann, S. Membrane-Based Seawater Desalination: Present and Future Prospects. Desalination 2017, 401, 16–21. [Google Scholar] [CrossRef]
  123. Arnal, J.M.; Sancho, M.; Iborra, I.; Gozálvez, J.M.; Santafé, A.; Lora, J. Concentration of Brines from RO Desalination Plants by Natural Evaporation. Desalination 2005, 182, 435–439. [Google Scholar] [CrossRef]
  124. Xu, P.; Cath, T.Y.; Robertson, A.P.; Reinhard, M.; Leckie, J.O.; Drewes, J.E. Critical Review of Desalination Concentrate Management, Treatment and Beneficial Use. Environ. Eng. Sci. 2013, 30, 502–514. [Google Scholar] [CrossRef]
  125. Harvey, W. Desalination Efficiency: Energy, Water and Other Resources. Melbourne, Australia. 2008. Available online: https://www.semanticscholar.org/paper/Desalination-Efficiency%3A-Energy%2C-Water-and-Other-Harvey/0a108d1556bc3a2ddc20ddf1cb88e35309e4da4f (accessed on 21 February 2023).
  126. Jones, E.; Qadir, M.; van Vliet, M.T.H.; Smakhtin, V.; Kang, S. The State of Desalination and Brine Production: A Global Outlook. Sci. Total Environ. 2019, 657, 1343–1356. [Google Scholar] [CrossRef] [PubMed]
  127. UN-Water. Summary Progress Update 2021: SDG6—Water and Sanitation for All; UN-Water: Geneva, Switzerland, 2021. [Google Scholar]
  128. Liu, J.; Chen, S.; Wang, H.; Chen, X. Calculation of Carbon Footprints for Water Diversion and Desalination Projects. Energy Procedia 2015, 75, 2483–2494. [Google Scholar] [CrossRef]
  129. Saleh, L.; Mezher, T. Techno-Economic Analysis of Sustainability and Externality Costs of Water Desalination Production. Renew. Sustain. Energy Rev. 2021, 150, 111465. [Google Scholar] [CrossRef]
  130. Tokui, Y.; Moriguchi, H.; Nishi, Y. Comprehensive Environmental Assessment of Seawater Desalination Plants: Multistage Flash Distillation and Reverse Osmosis Membrane Types in Saudi Arabia. Desalination 2014, 351, 145–150. [Google Scholar] [CrossRef]
  131. Soliman, M.N.; Guen, F.Z.; Ahmed, S.A.; Saleem, H.; Khalil, M.J.; Zaidi, S.J. Energy Consumption and Environmental Impact Assessment of Desalination Plants and Brine Disposal Strategies. Process Saf. Environ. Prot. 2021, 147, 589–608. [Google Scholar] [CrossRef]
  132. Hamieh, A.; Rowaihy, F.; Al-Juaied, M.; Abo-Khatwa, A.N.; Afifi, A.M.; Hoteit, H. Quantification and Analysis of CO2 Footprint from Industrial Facilities in Saudi Arabia. Energy Convers. Manag. X 2022, 16, 100299. [Google Scholar] [CrossRef]
  133. Al-Karaghouli, A.; Kazmerski, L.L. Energy Consumption and Water Production Cost of Conventional and Renewable-Energy-Powered Desalination Processes. Renew. Sustain. Energy Rev. 2013, 24, 343–356. [Google Scholar] [CrossRef]
  134. Baig, M.B.; Alotibi, Y.; Straquadine, G.S.; Alataway, A. Water Resources in the Kingdom of Saudi Arabia: Challenges and Strategies for Improvement. In Water Policies in MENA Countries; Zekri, S., Ed.; Global Issues in Water Policy; Springer International Publishing: Cham, Switzerland, 2020; pp. 135–160. ISBN 978-3-030-29274-4. [Google Scholar]
  135. Ouda, O.K.M. Water Demand versus Supply in Saudi Arabia: Current and Future Challenges. Int. J. Water Resour. Dev. 2014, 30, 335–344. [Google Scholar] [CrossRef]
  136. Alyamani, M.S. Salinity Problem of Groundwater in the Wadi Tharad Basin, Saudi Arabia. GeoJournal 1999, 48, 291–297. [Google Scholar] [CrossRef]
  137. Kinzelbach, W.; Brunner, P.; von Boetticher, A.; Kgotlhang, L.; Milzow, C. Sustainable Water Management in Arid and Semi-Arid Regions. In Groundwater Modelling in Arid and Semi-Arid Areas; Wheater, H., Mathias, S., Li, X., Eds.; Cambridge University Press: Cambridge, UK, 2010; pp. 119–130. ISBN 978-0-511-76028-0. [Google Scholar]
  138. Hunt, D.V.L.; Shahab, Z. Sustainable Water Use Practices: Understanding and Awareness of Masters Level Students. Sustainability 2021, 13, 10499. [Google Scholar] [CrossRef]
  139. UN. Comprehensive Assessment of the Freshwater Resources of the World; Commission on sustainable development fifth session; United Nations (Economic and Social Council): New York, NY, USA, 1997; p. 52. [Google Scholar]
  140. GASTAT. Per Capita Water Consumption in Saudi Regions During The Period 2009–2018; General Authority for Statistics: Riyadh, Saudi Arabia, 2018; p. 5. [Google Scholar]
  141. Hunt, D.V.L.; Rogers, C.D.F. A Benchmarking System for Domestic Water Use. Sustainability 2014, 6, 2993–3018. [Google Scholar] [CrossRef]
  142. Wolf, M.J.; Emerson, J.W.; Esty, D.C.; de Sherbinin, A.; Wendling, Z.A. 2022 Environmental Performance Index; Yale Center for Environmental Law & Policy: New Haven, CT, USA, 2022; p. 192. [Google Scholar]
  143. Falkenmark, M.; Lundqvist, J.; Widstrand, C. Macro-Scale Water Scarcity Requires Micro-Scale Approaches. Nat. Resour. Forum 1989, 13, 258–267. [Google Scholar] [CrossRef]
  144. Cosgrove, W.J.; Rijsberman, F.R. World Water Vision: Making Water Everybody’s Business; Routledge: London, UK, 2014; ISBN 978-1-315-07176-3. [Google Scholar]
  145. UNCTAD. Aligning Economic Development and Water Policies in Small Island Developing States (SIDS) Policy Analysis; United Nations: New York, NY, USA, 2021; ISBN 978-92-1-001225-6. [Google Scholar]
  146. Falkenmark, M. Meeting Water Requirements of an Expanding World Population. Philos. Trans. R. Soc. London. Ser. B Biol. Sci. 1997, 352, 929–936. [Google Scholar] [CrossRef]
  147. Corral-Verdugo, V.; Bechtel, R.B.; Fraijo-Sing, B. Environmental Beliefs and Water Conservation: An Empirical Study. J. Environ. Psychol. 2003, 23, 247–257. [Google Scholar] [CrossRef]
  148. Fan, L.; Wang, F.; Liu, G.; Yang, X.; Qin, W. Public Perception of Water Consumption and Its Effects on Water Conservation Behavior. Water 2014, 6, 1771–1784. [Google Scholar] [CrossRef]
  149. Liemberger, R.; Farley, M. Developing a Non-Revenue Water Reduction Strategy, Part 1: Investigating and Assessing Water Losses. Water Supply 2005, 5, 41–50. [Google Scholar]
  150. AWWA WLCC Committee Report: Key Performance Indicators for Nonrevenue Water—AWWA’s 2020 Position. J. AWWA 2020, 112, 20–30. [CrossRef]
  151. Andres, L.A.; Thibert, M.; Lombana Cordoba, C.; Danilenko, A.V.; Joseph, G.; Borja-Vega, C. Doing More with Less: Smarter Subsidies for Water Supply and Sanitation; © World Bank: Washington, DC, USA, 2019. [Google Scholar]
  152. Colton, R. A Water Affordability Program for the Detroit Water and Sewerage Department (DWSD); People’s Water Board Coalition: Belmont, MA, USA, 2005; p. 46. [Google Scholar]
  153. Smets, H. Access to Drinking Water at an Affordable Price in Developing Countries. In Technological Perspectives for Rational Use of Water Resources in the Mediterranean Region; Mandi, L., Martín, I., Rabi, A., Rodríguez, R., Trisorio-Liuzzi, G., El Moujabber, M., Eds.; Options Méditerranéennes: Série A. Séminaires Méditerranéens; CIHEAM: Bari, Italy, 2009; Volume 88, pp. 57–68. [Google Scholar]
  154. Motiee, H.; McBean, E.; Motiei, A. Estimating Physical Unaccounted for Water (UFW) in Distribution Networks Using Simulation Models and GIS. Urban Water J. 2007, 4, 43–52. [Google Scholar] [CrossRef]
  155. Rashid, S.; Qaisar, S.; Saeed, H.; Felemban, E. A Method for Distributed Pipeline Burst and Leakage Detection in Wireless Sensor Networks Using Transform Analysis. Int. J. Distrib. Sens. Netw. 2014, 10, 939657. [Google Scholar] [CrossRef]
  156. Ayala–Cabrera, D.; Herrera, M.; Izquierdo, J.; Ocaña–Levario, S.J.; Pérez–García, R. GPR-Based Water Leak Models in Water Distribution Systems. Sensors 2013, 13, 15912–15936. [Google Scholar] [CrossRef]
  157. Laspidou, C.S. ICT and Stakeholder Participation for Improved Urban Water Management in the Cities of the Future. Water Util. J. 2014, 8, 79–85. [Google Scholar]
  158. Barraqué, B. Full Cost Recovery of Water Services and the 3 T’s of OECD. Util. Policy 2020, 62, 100981. [Google Scholar] [CrossRef]
  159. World Bank. A Water Sector Assessment Report on the Countries of the Cooperation Council of the Arab States of the Gulf. 2005. Available online: https://econpapers.repec.org/paper/wbkwboper/8719.htm (accessed on 24 November 2023).
  160. Aljamal, A.; Speece, M.; Bagnied, M. Sustainable Policy for Water Pricing in Kuwait. Sustainability 2020, 12, 3257. [Google Scholar] [CrossRef]
  161. Aleisa, E.; Al-Zubari, W. Wastewater Reuse in the Countries of the Gulf Cooperation Council (GCC): The Lost Opportunity. Environ. Monit. Assess. 2017, 189, 553. [Google Scholar] [CrossRef]
  162. CESCR. General Comment No. 15: The Right to Water (Arts. 11 and 12 of the Covenant); UN Committee on Economic, Social and Cultural Rights (CESCR): Geneva, Switzerland, 2003. [Google Scholar]
  163. Pinto, F.S.; Marques, R.C. Tariff Structures for Water and Sanitation Urban Households: A Primer. Water Policy 2015, 17, 1108–1126. [Google Scholar] [CrossRef]
  164. Boakye-Ansah, A.S.; Schwartz, K.; Zwarteveen, M. Unravelling Pro-Poor Water Services: What Does It Mean and Why Is It so Popular? J. Water Sanit. Hyg. Dev. 2019, 9, 187–197. [Google Scholar] [CrossRef]
  165. Kaur, M.; Hewage, K.; Sadiq, R. Integrated Level of Service Index for Buried Water Infrastructure: Selection and Development of Performance Indicators. Sustain. Cities Soc. 2021, 68, 102799. [Google Scholar] [CrossRef]
  166. World Bank. People Using at Least Basic Drinking Water Services (% of Population). Available online: https://data.worldbank.org (accessed on 29 November 2023).
  167. Bartram, J.; Cairncross, S. Hygiene, Sanitation, and Water: Forgotten Foundations of Health. PLoS Med. 2010, 7, e1000367. [Google Scholar] [CrossRef]
  168. Liemberger, R.; Wyatt, A. Quantifying the Global Non-Revenue Water Problem. Water Supply 2019, 19, 831–837. [Google Scholar] [CrossRef]
  169. Chohan, I.M.; Ahmad, A.; Sallih, N.; Bheel, N.; Ali, M.; Deifalla, A.F. A Review on Life Cycle Assessment of Different Pipeline Materials. Results Eng. 2023, 19, 101325. [Google Scholar] [CrossRef]
  170. MOWE. Rules of Implementations for the Regulations of Treated Sanitary Wastewater and Its Reuse; Ministry of Water and Electricity: Riyadh, Saudi Arabia, 2000; p. 52.
  171. Cornejo, P.K.; Santana, M.V.E.; Hokanson, D.R.; Mihelcic, J.R.; Zhang, Q. Carbon Footprint of Water Reuse and Desalination: A Review of Greenhouse Gas Emissions and Estimation Tools. J. Water Reuse Desalination 2014, 4, 238–252. [Google Scholar] [CrossRef]
  172. Al-Omran, A.; Al-Barakah, F.; Altuquq, A.; Aly, A.; Nadeem, M. Drinking Water Quality Assessment and Water Quality Index of Riyadh, Saudi Arabia. Water Qual. Res. J. 2015, 50, 287–296. [Google Scholar] [CrossRef]
  173. UNDESA. Household Size and Composition Around the World 2017; Department of Economic and Social Affairs, Population Division: New York, NY, USA, 2017; p. 31. [Google Scholar]
  174. UNDESA Database on Household Size and Composition 2022. Available online: https://population.un.org/household/#/countries/ (accessed on 23 November 2023).
  175. Esri United Arab Emirates Average Household Size. Available online: https://www.arcgis.com/home/item.html?id=bb9bf7c53c274d19b369901a3cbde406#! (accessed on 23 November 2023).
  176. World Bank World Development Indicators 2023. Available online: https://databank.worldbank.org/source/world-development-indicators/Type/TABLE/preview/on (accessed on 20 August 2023).
  177. Andres, L.A.; Saltiel, G.; Misra, S.; Joseph, G.; Lombana Cordoba, C.; Thibert, M.; Fenwick, C. Troubled Tariffs: Revisiting Water Pricing for Affordable and Sustainable Water Services; World Bank: Washington, DC, USA, 2021. [Google Scholar]
  178. GWI New Tariff Structure Slashes Oman’s Water Forecast. Available online: https://www.globalwaterintel.com/news/2023/34/new-tariff-structure-slashes-oman-s-water-forecast (accessed on 24 November 2023).
  179. Al Khoury, I.; Ghanimeh, S.; Jawad, D.; Atieh, M. Synergetic Water Demand and Sustainable Supply Strategies in GCC Countries: Data-Driven Recommendations. Water Resour Manag. 2023, 37, 1947–1963. [Google Scholar] [CrossRef]
  180. KAHRAMAA. Qatar General Electricity & Water Corporation—Tariff. Available online: https://www.km.qa/CustomerService/pages/tariff.aspx (accessed on 24 November 2023).
  181. ADDC. Home—Business Rates and Tariffs 2023. Available online: https://www.addc.ae/en-US/business/Pages/RatesAndTariffs2023.aspx (accessed on 23 November 2023).
  182. EWA. Electricity and Water Tariffs. Available online: https://www.ewa.bh/en/Customer/BillsTariffs/electricity-water-tariffs (accessed on 23 November 2023).
  183. Alazmi, H.J.; Mitchell, G.; Trigg, M.A. Kuwait Household Water Demand in 2050: Spatial Microsimulation and Impact Appraisal. Water Environ. J. 2023, 38, 139–152. [Google Scholar] [CrossRef]
  184. Ouda, O.K.M.; Khalid, Y.; Ajbar, A.H.; Rehan, M.; Shahzad, K.; Wazeer, I.; Nizami, A.S. Long-Term Desalinated Water Demand and Investment Requirements: A Case Study of Riyadh. J. Water Reuse Desalination 2018, 8, 432–446. [Google Scholar] [CrossRef]
  185. Saif, O.; Mezher, T.; Arafat, H.A. Water Security in the GCC Countries: Challenges and Opportunities. J. Environ. Stud. Sci. 2014, 4, 329–346. [Google Scholar] [CrossRef]
  186. Tariq, M.A.U.R.; Alotaibi, R.; Weththasinghe, K.K.; Rajabi, Z. A Detailed Perspective of Water Resource Management in a Dry and Water Scarce Country: The Case in Kuwait. Front. Environ. Sci. 2022, 10, 1073834. [Google Scholar] [CrossRef]
Figure 1. Map of GCC countries and their capital cities [50].
Sustainability 16 02634 g001
Figure 2. Total population of GCC countries between 1960 and 2020.
Sustainability 16 02634 g002
Figure 3. Total water consumption and population in GCC countries from 1980 to 2020 [54,72,73].
Sustainability 16 02634 g003
Figure 4. The total share of each water sector in GCC countries from 1995 to 2020 [83].
Sustainability 16 02634 g004
Figure 5. Intersection of pillars of sustainability plus infrastructure for WRM.
Sustainability 16 02634 g005
Figure 6. Visual illustration of an IBWSF.
Sustainability 16 02634 g006
Figure 7. Flowchart for the development of the conceptual framework for ASAR.
Sustainability 16 02634 g007
Figure 8. Conceptual SWRM-AF for ASAR.
Sustainability 16 02634 g008
Table 1. Description and function of the seven main elements of the indicator-based framework.
No.Element Description/Function
1Indicator
  • Indicate the measurement of something;
  • Used to present data (quantitative or qualitative);
  • Can be combined to represent the same component or category and can also be split into sub-indicators.
2Benchmark
  • The threshold or interval needed to measure the performance of an indicator;
  • Can be either maximum and minimum value, or baseline and target.
3Application scale
  • To know to which extent the framework can be reused or reapplied;
  • Whether it is for community, local, regional, national, or global scale;
  • Usually, each scale would require different data for the indicators.
4Normalisation method
  • To obtain equivalent component values, which can be aggregated or compared, for each set of indicators even with different unit values;
  • Most used methods based on data type of indicators are as follows:
    (1)
    Continuous re-scaling (usually better with quantitative data);
    (2)
    Categorical scaling (better with qualitative, but can serve both).
5Weighting scheme
  • A weight is a value that represents the importance of each indicator;
  • Can be equal or non-equal based on different criteria;
  • Usually, it is a fraction, where all weights under the same category should be equal to 1.
6Aggregation technique
  • It reflects how the summation of the product of indicators and their weights should be performed;
  • Can be arithmetic (most common) or geometric base.
7Final index value
  • Significant to make the result of the whole framework easy to understand by a range of different stakeholders;
  • Represents the final and most important output of any framework;
  • Usually, it is a number from 0 to 1 or 100.
Table 2. Desired characteristics of global sustainability indicators.
Desirable CharacteristicDescription
Sensitive to change over timeTo investigate the critical variations and trends of an indicator, its data over different time intervals should be available for collection and analysis
Sensitive to change across space or within groupsTo observe the reality of socio-economic situation by indicators over a geographic region or within a population, the distribution of conditions among different places or groups should be reasonably considered
Predictive or anticipatoryThe ability of the indicator to forecast unsustainable risks is helpful to eliminate their effects and to deal with their signs or warnings as early as possible
Availability of reference or threshold valuesTo evaluate the level of performance of sustainability indicators, it is critical to have threshold or benchmark values working as a reference for these indicators
UnbiasedTo avoid any misrepresentation of results occurring because of the selection of biased measures. While developing fully unbiased indicators within different contexts is difficult, considering universal standards, such as life expectancy, would be better.
Appropriate data transformationTo compare values, raw data alone cannot be helpful sometimes, but converting them to rates or ratios based on appropriate relations would give more insight and meaning to the value
IntegrativeDifferent indicators under one component shall have a common linkage to integrate various measures that can smoothly assess sustainability to form a logic index
Relative ease of collection and useThe collection process of indicators’ data should not require excessive time, effort, and cost, while the interpretation and presentation should be clear and straightforward for decision-makers
Table 3. Environmental indicators of the conceptual SWRM-AF with their types and references.
No.Environmental IndicatorData TypeReferences
1Brine discharge rate of desalination plantsQuantitative[112,113]
2Quality of discharged wastewaterQuantitative[5,96,111,114]
3Carbon dioxide emissions from desalinationQuantitative[5,93,113,114]
4Compliance of wastewater treatment plants with regulationsQualitative[111,115,116,117]
5Share of reusing of treated wastewaterQuantitative[54,92]
6Share of using groundwater for drinkingQuantitative[111,116]
Table 4. Water recovery ratios resulting from combinations of feedwater and technology [126].
TechnologyReverse Osmosis
(RO)
Multi-Stage Flash
(MSF)
Multi-Effect Distillation
(MED)
Feedwater
Seawater (SeW)0.420.220.25
Brackish (BW)0.650.330.34
Table 5. Scores and their descriptions assigned for evaluating the brine discharge rate.
Brine Discharge Rate LevelQualitative DescriptionScore
Very highBrine discharge rate (or quantity) has increased or is equal to the baseline year0
HighBrine discharge rate (or quantity) is ≤5% compared to the baseline year1
MediumBrine discharge rate (or quantity) is ≤15% compared to the baseline year2
Below averageBrine discharge rate (or quantity) is ≤25% compared to the baseline year3
LowBrine discharge rate (or quantity) is ≤35% compared to the baseline year4
Very lowBrine discharge rate (or quantity) is ≤45% or more than the baseline year5
Table 6. Scores and their descriptions assigned for evaluating the quality of discharged wastewater.
Quality of Discharged WastewaterQualitative DescriptionScore
Very lowAverage quality of discharged WW is less than the standard quality of WW0
LowAverage quality of discharged WW is equal to the standard quality of WW1
Below averageAverage quality of discharged WW is lower than the standard quality of secondary TWW2
MediumAverage quality of discharged WW is equal to the standard quality of secondary TWW3
HighAverage quality of discharged WW is lower than the standard quality of tertiary TWW4
Very highAverage quality of discharged WW is equal to the standard quality of tertiary TWW5
Table 7. Scores and their descriptions assigned for evaluating the CO2 emissions from the desalination sector.
CO2 Emissions LevelQualitative DescriptionScore
Very highCO2 emissions have increased or equal to the baseline year0
HighCO2 emissions are ≤20% compared to the baseline year1
MediumCO2 emissions are ≤40% compared to the baseline year2
Below averageCO2 emissions are ≤60% compared to the baseline year3
LowCO2 emissions are ≤80% compared to the baseline year4
Very lowCO2 emissions are ≤100% compared to the baseline year to achieve net zero carbon *5
* While the aim of net zero carbon (CO2e) includes all GHG emissions, CO2 is used here as a proxy.
Table 8. Scores and their descriptions assigned for evaluating the compliance level of WWTPs.
Compliance LevelQualitative DescriptionScore
NoneNo public WWTPs are available at all.0
SmallMost WWTPs produce primary treatment, in old age, and far away from matching the designed capacity.1
Below averageMost WWTPs are producing secondary treatment, in old age, and not matching the designed capacity.2
MediumMost WWTPs produce both secondary and tertiary treatments, not in old age, but not matching the designed capacity.3
GoodMost WWTPs produce both secondary and tertiary treatments, not in old age, and match the designed capacity.4
ExcellentMost WWTPs produce tertiary treatments, not in old age, and match the designed capacity.5
Table 9. Scores and their descriptions assigned for evaluating the share of reusing of TWW.
Reusing LevelQualitative DescriptionScore
NoneTreated wastewater (TWW) is not used at all0
SmallThe percentage of using RW to total TWW is ≤20%1
Below averageThe percentage of using RW to total TWW is ≤40%2
MediumThe percentage of using RW to total TWW is ≤60%3
GoodThe percentage of using RW to total TWW is ≤80%4
ExcellentThe percentage of using RW to total TWW is ≤100%5
Table 10. Scores and their descriptions assigned for evaluating the share of using groundwater (GW) for drinking.
GW Using LevelQualitative DescriptionScore
Very highShare of using groundwater (GW) for drinking is ≤100%0
HighShare of using GW for drinking is ≤80%1
MediumShare of using GW for drinking is ≤60%2
Below averageShare of using GW for drinking is ≤40%3
LowShare of using GW for drinking is ≤20%4
Very lowShare of using GW for drinking is ≤0%5
Table 11. Social indicators of the conceptual SWRM-AF with their types and supporting references.
No.Social IndicatorData TypeReferences
1Per capita water consumptionQuantitative[42,54,88,92,94,111,112,113]
2Drinking water qualityQuantitative[12,41,42,44,86,88,92,95,96,111,116,117]
3Water stressQuantitative[5,12,41,42,94,95,111]
4Water awarenessQualitative[11,12,13,42,88,93,94,108,111]
5Intervention acceptabilityQualitative[86,90,117]
6Existence of participatory framework and guidelinesQualitative[5,42,45,93,95,108,111,116]
Table 12. Scores and their descriptions assigned for evaluating the per capita water consumption.
Consumption LevelQualitative DescriptionL/Capita/DayScore
Very HighConsumption is 60% above the target for the region>4000
HighConsumption is 40% above the target for the region3501
Above AverageConsumption is 20% above the target for the region3002
AverageConsumption is equal to the target for the region2503
LowConsumption is 20% below the target for the region2004
Very LowConsumption is 40% below the target for the region<1505
Table 13. Scores and their descriptions assigned for evaluating drinking water quality.
Water Quality LevelQualitative DescriptionScore
Very LowWater quality is not drinkable0
LowWater quality in many (≤25%) areas * is not drinkable 1
Below AverageWater quality in some (≤50%) areas is not drinkable 2
AverageWater quality in many (≤75%) areas is drinkable 3
GoodWater quality in most (≤90%) areas is drinkable 4
ExcellentWater quality in all (>90%) areas is drinkable 5
* It should be noted that areas include urban (e.g., cities and towns) and rural (e.g., villages).
Table 14. Scores and their descriptions assigned for evaluating water stress [139,146].
Water Stress LevelQualitative DescriptionScore
CriticalWater stress/scarcity indicator (WSI) is >100%1
HighWSI is from 40 to 100% 2
Medium-highWSI is from 20 to 40% 3
ModerateWSI is from 10 to 20%4
LowWSI is <10%5
Table 15. Scores and their descriptions assigned for evaluating water awareness.
Efforts LevelQualitative DescriptionScore
Noneadvocating for water awareness by any means is missing0
Small effortsproviding little information to a limited group of people, such as only on the water bill which could benefit only the person who pays the bill1
Below averageby providing information in only two and neither very popular nor interactive means such as water bills and newspapers2
Mediumproviding information to the public through three different means; one of them should be favoured in that region and interactive such as social media3
Goodproviding information to different public groups, including children in their school curriculum and university students, and organising awareness campaigns through four means; at least one should be popular and interactive4
Excellentproviding information to different public groups, including children in their school curriculum and university students, and organising awareness campaigns and competitions periodically through five means; at least two should be popular and interactive5
Table 16. Scores and their descriptions assigned for evaluating intervention acceptability indicator.
Acceptable LevelQualitative DescriptionScore
Not acceptableSociety does not accept any new interventions.0
Slightly acceptableSome doubts exist, but at least one free, new, easy-to-install intervention, such as water rationalisation tools (WRTs) or smart water meter (SWM), could be welcomed.1
Partially acceptableAt maximum, two interventions are accepted, but one of them should be free (e.g., WRT or SWM), and the other (e.g., greywater or RWH systems) should be within a highly subsidised cost (i.e., the cost paid by stakeholders is 20% to 40% of the actual cost, the remaining being subsidised).2
Moderately acceptableAt maximum, three interventions are accepted, but it is better for one of them to be free (e.g., WRT), and the others (e.g., greywater and RWH systems) could be afforded at 50% of their cost.3
Highly acceptableAny interventions are accepted and could be afforded at 75% of their cost.4
Fully acceptableAny number of interventions are accepted at any cost.5
Table 17. Scores and their descriptions assigned for the indicator evaluating the existence of a participatory framework.
Application LevelQualitative DescriptionScore
NothingNeither participatory framework nor guidelines are available.0
Only guidelinesGuidelines about the participation of stakeholders exist on paper but without activation or actual application.1
Exist without activationParticipatory guidelines and framework about the rules of stakeholders exist on paper but without activation or actual application.2
Exist for limited groups but without applicationParticipatory framework and guidelines about the rules of stakeholders exist with the involvement of a minority of stakeholders’ groups without a real contribution in making decisions.3
Exist for several groups but without applicationParticipatory framework and guidelines about the rules of stakeholders exist with the involvement of the majority of stakeholders’ groups without a real contribution in making decisions.4
Exist with real applicationParticipatory framework and guidelines about the rules of stakeholders exist with the involvement of the majority of stakeholders’ groups with a real contribution in making decisions.5
Table 18. Economic indicators of the conceptual SWRM-AF with their types and supporting references.
No.Economic IndicatorData TypeReferences
1Water supply cost related to users’ incomeQuantitative[86,88,92,93,111,116]
2Unaccounted-for water (water losses)Quantitative[86,111,149,150]
3Water sector share in total public spendingQualitative[92,93,111]
4Cost recovery of water supply utilitiesQuantitative[54,86,111]
5Cost recovery of wastewater utilitiesQuantitative[54,92,111]
6Pro-poor and pro-efficiency water feesQualitative[11,42,93,111]
Table 19. Scores and their descriptions assigned for evaluating the water supply cost related to users’ income.
Cost LevelQualitative DescriptionScore
Very HighAverage water tariff is >8% of the average user income0
HighAverage water tariff is between 5% and 8% of the average user income1
Above AverageAverage water tariff is between 4% and 5% of the average user income2
AverageAverage water tariff is between 3% and 4% of the average user income3
LowAverage water tariff is between 2% and 3% of the average user income4
Very LowAverage water tariff is ≤2% of the average user income5
Table 20. Scores and their descriptions assigned for evaluating the losses of unaccounted-for water.
Level of Unaccounted-for WaterQualitative DescriptionScore
Very HighLosses are equivalent to a physical leakage that is >40%1
HighLosses are equivalent to a physical leakage that is ≤40%2
Above AverageLosses are equivalent to a physical leakage that is ≤30%3
AverageLosses are equivalent to a physical leakage that is ≤20%4
LowLosses are equivalent to a physical leakage that is ≤10%5
Table 21. Scores and their descriptions assigned for evaluating the water sector share in total public spending.
Spending LevelQualitative DescriptionScore
NothingThe budget does not include any specific spending for the water sector0
MinimumA tiny percentage of the budget is given to cover the basic requirements of the water sector (e.g., spending ≤ 20% of the needs of the water sector)1
Below averageA small percentage is given to cover the basic requirements of the water sector (e.g., 20% < spending ≤ 40% of the needs of the water sector)2
MediumA medium percentage is given to cover the basic requirements of the water sector (e.g., 40% < spending ≤ 60% of the needs of the water sector)3
GoodA high percentage is given to cover the basic requirements of the water sector (e.g., 60% < spending ≤ 80% of the needs of the water sector)4
ExcellentA high percentage is given to cover the basic requirements of the water sector (e.g., 80% < spending ≤ 100% of the needs of the water sector)5
Table 22. Scores and their descriptions assigned for evaluating the cost recovery ratio.
Cost Recovery LevelQualitative DescriptionScore
Very Lowcost recovery ratio is ≤5%0
Lowcost recovery ratio is ≤25%1
Below Averagecost recovery ratio is ≤50%2
Averagecost recovery ratio is ≤75%3
Goodcost recovery ratio is ≤100%4
Excellentcost recovery ratio is >100%5
Table 23. Scores and their descriptions assigned to evaluate whether the water tariff system is pro-poor and pro-efficiency.
Consideration LevelQualitative DescriptionScore
NoneThe water tariff system does not include any specific measures for either pro-poor or pro-efficiency water fees.0
MinimumThe water tariff system includes specific and ineffective measures for either pro-poor or pro-efficiency water fees.1
Below averageThe water tariff system includes specific and partially effective measures for either pro-poor or pro-efficiency water fees.2
MediumThe water tariff system includes specific and effective measures for either pro-poor or pro-efficiency water fees.3
GoodThe water tariff system includes specific and partially effective measures for both pro-poor and pro-efficiency water fees.4
ExcellentThe water tariff system includes specific and highly effective measures for both pro-poor and pro-efficiency water fees.5
Table 24. Infrastructure indicators of the conceptual SWRM-AF with their types and supporting references.
No.Infrastructure IndicatorData TypeReferences
1Access to safe drinking waterQuantitative[5,12,41,42,44,88,92,93,94,95,96,111]
2Access to sanitationQuantitative[5,12,41,42,44,92,93,94,95,96,111,116]
3Rate of water physical leakageQuantitative[12,54,95,110,111]
4Share of desalinated water produced to domestic sectorQuantitative[111,129]
5Share of collected wastewater to domestic waterQuantitative[5,54,92,96]
6Age of water infrastructureQuantitative[86,116,165]
Table 25. Scores and their descriptions assigned to evaluate the rate of access to safe drinking water.
Access to Drinking Water LevelQualitative DescriptionScore
Very LowAccess ratio is ≤50%0
LowAccess ratio is ≤60%1
Below AverageAccess ratio is ≤70%2
AverageAccess ratio is ≤80%3
HighAccess ratio is ≤90%4
Very HighAccess ratio is ≤100%5
Table 26. Scores and their descriptions assigned to evaluate the rate of access to sanitation.
Access to Sanitation LevelQualitative DescriptionScore
LowAccess ratio is ≤25%1
Below AverageAccess ratio is from 26 to 50%2
AverageAccess ratio is from 51 to 75%3
HighAccess ratio is from 76 to 90%4
Very HighAccess ratio is >90%5
Table 27. Scores and their descriptions assigned to evaluate the rate of water physical leakage.
Level of LeakageQualitative DescriptionScore
Very Highwater physical leakage is >40%1
Highwater physical leakage is ≤40%2
Above Averagewater physical leakage is ≤30%3
Averagewater physical leakage is ≤20%4
Lowwater physical leakage is ≤10%5
Table 28. Scores and their descriptions assigned to evaluate the share of desalinated water produced to domestic sector.
Share Level of Using Desalinated WaterQualitative DescriptionScore
Very LowThere is no desalinated water produced to domestic sector (i.e., 0%)0
LowShare of desalinated water produced to domestic sector is between 1 and 19%1
Below AverageShare of desalinated water produced to domestic sector is between 20 and 39%2
AverageShare of desalinated water produced to domestic sector is between 40 and 59%3
HighShare of desalinated water produced to domestic sector is between 60 and 89%4
Very HighShare of desalinated water produced to domestic sector is ≥90%5
Table 29. Scores and their descriptions assigned to evaluate the share of collected wastewater to domestic water.
Share Level of Collected WastewaterQualitative DescriptionScore
Very LowShare of collected wastewater to domestic water is ≤20%0
LowShare of collected wastewater to domestic water is ≤35%1
Below AverageShare of collected wastewater to domestic water is ≤50%2
AverageShare of collected wastewater to domestic water is ≤65%3
HighShare of collected wastewater to domestic water is ≤80%4
Very HighShare of collected wastewater to domestic water is ≥81%5
Table 30. Scores and their descriptions assigned to evaluate the age of water infrastructure.
Age Level of Water Infrastructure Qualitative DescriptionScore
Very OldAverage age of water infrastructure is ≥50 years 0
OldAverage age of water infrastructure is <50 years1
Below AverageAverage age of water infrastructure is ≤40 years2
AverageAverage age of water infrastructure is ≤30 years3
Above AverageAverage age of water infrastructure is ≤20 years4
GoodAverage age of water infrastructure is ≤10 years5
Disclaimer/Publisher’s Note: The statements, opinions and data contained in all publications are solely those of the individual author(s) and contributor(s) and not of MDPI and/or the editor(s). MDPI and/or the editor(s) disclaim responsibility for any injury to people or property resulting from any ideas, methods, instructions or products referred to in the content.

