Abstract
Road freight transport, an essential component of the logistics sector, faces challenges: high cost, low efficiency, and environmental impact. The need has become urgent to achieve a synergistic balance between low-carbon and high-efficiency development. This study used a three-stage DEA–Malmquist index model to analyze the road freight efficiency of Wuhan and 16 other cities in China from 2015 to 2020, and we compared Wuhan’s performance with its peers. In addition, grey correlation analysis was used to evaluate the low-carbon development of urban road freight transport in Wuhan. Through the calculation of the degree of synergy between low-carbon development and freight transport efficiency, this study provides insights into the synergistic development of low-carbon and efficient road freight transport in Wuhan. The key findings show that the total factor productivity of road freight transport in Wuhan was generally on a downward trend from 2015 to 2020, and was lower than that of the average of the 17 selected Chinese cities. The carbon emissions of road freight transport in Wuhan inversely related to its scale efficiency. This study also points out that the synergy between low-carbon development and the economic efficiency of road freight transport in Wuhan is not high and needs to be further integrated and optimized.
1. Introduction
In recent years, China’s explosive economic growth has catalyzed the remarkable expansion of its road freight transport industry. As of 2022, the extensive national road network in China had surpassed an impressive length of 5.35 million kilometers, accommodating a substantial freight volume of 52.106 billion tons. Notably, road transport occupies a commanding position, accounting for 75.2% of the overall transportation mix, thus highlighting its indispensable role in the efficient movement of goods. Nevertheless, this surge in transport demand has been accompanied by mounting environmental concerns. Specifically, the significant carbon emissions and resource depletion resulting from road freight activities have emerged as pressing issues, posing tremendous challenges to the industry’s quest for sustainable development. The road freight sector must now grapple with the urgent imperative of balancing its expansion with environmental sustainability.
Against this backdrop, a range of phenomena and challenges have come into focus, sparking widespread discussion on the need for sustainable and environmentally friendly freight transport models. China’s government, with its unwavering commitment outlined in the national development blueprint, stands out as a notable player in this discussion. It aims to lead the freight sector toward a more low-carbon and environmentally conscious future by initiating 100 city-level green freight demonstration projects by 2025.
However, transitioning to green and sustainable road freight transport is a multifaceted and intricate task. Balancing the need to improve the efficiency of road freight transport with the need to reduce carbon emissions remains a huge challenge for the road freight industry. This quest for equilibrium requires a concerted effort from various stakeholders, including policymakers, industry players, and research institutions, to identify innovative solutions and strategies.
The carbon emission problem has emerged as a hotspot in the field of road freight transport. Currently, the majority of studies in this area have concentrated on key aspects such as the measurement and forecasting of overall transportation carbon emissions [1,2], the identification of carbon emission drivers and influencing factors [3,4], the assessment of green development efficiency in road freight transport [5], and the quantification of carbon emission efficiency in transportation systems [6,7]. However, despite this extensive research, there remains a notable lack of studies exploring the intricate relationship between carbon emissions and the development of economic efficiency in road freight transport. There is a pressing need for comprehensive studies that delve deeper into the complicated relationships between carbon emissions, economic efficiency, and other relevant factors to inform better decisions and strategies.
Will the tightening of low-carbon development measures lead to a decline in the efficiency of road freight transport? Conversely, will improvements in road transport efficiency result in stricter carbon emission requirements for road freight transport? To answer these questions, this paper investigates the efficiency of urban road freight transport and its intricate relationships with carbon emissions within a specific urban context. To achieve this, we selected representative cities that serve as the core of China’s green road freight initiative for efficiency comparison. In addition, we hope to provide guidance for policy formulation and efficiency improvement in the road freight industry in Wuhan and similar cities, to provide a valuable scientific basis for the green and sustainable development of road freight in these cities, and to promote the overall sustainable development of the transport industry.
The structure of this paper is as follows: In Section 2, we present a comprehensive literature review that lays the foundation for our study. Next, Section 3 introduces the research methods employed, including the three-stage DEA model, the Malmquist index for dynamic efficiency analysis, and the calculation procedure for determining the synergy degree. Section 4 delves into the data sources, outlines the procedure for constructing the indicator system aimed at measuring the degree of synergy, and provides an empirical study of road freight in Wuhan from 2015 to 2020, concluding with an exploration of the complex synergies between efficient and low-carbon road freight transport. The main results and discussion are presented in Section 5. Finally, Section 6 summarizes the key findings of this study and suggests potential directions for future research in this field.
2. Literature Review
2.1. Urban Road Freight Efficiency
Efficiency is defined as the relationship between inputs and outputs within a system. When applied to transportation, this efficiency can be expressed as the proportionality between the actual effective outputs achieved and the inputs of transportation resources utilized during transportation activities. This metric serves as a barometer for the operational performance and developmental potential of transportation systems [8]. The concept of transport efficiency is highly multifaceted, encompassing various types of efficiency measures employed in previous studies, including technical efficiency [9], scale efficiency [10], and total factor productivity [11]. These measures provide a comprehensive understanding of a system’s performance and allow for more accurate assessments of its overall effectiveness.
Freight transport efficiency stands as a pivotal indicator for assessing the overall effectiveness of urban road freight transport systems. The question of enhancing the efficiency of road freight transport while simultaneously injecting a robust impetus for economic growth has garnered significant attention from diverse sectors within society. Recognizing this challenge, scholars embarked on exploring methods to measure freight transport efficiency in the 1980s [12,13]. Their efforts focused on developing comprehensive frameworks that can accurately assess and optimize the performance of urban road freight systems, thereby contributing to more sustainable and efficient transport networks.
Broadly speaking, there are two categories of methods for assessing the efficiency of urban road freight transport: single-indicator measurements and systematic measurements. Single-indicator measurements focus primarily on metrics such as average distance traveled and vehicle travel time. By contrast, systematic methods encompass a range of techniques, including DEA input–output ratio analysis [14], questionnaire-based scoring [15], stochastic frontier analysis (SFA) [16,17], the slacks-based model (SBM) [18], the Malmquist productivity index method [19], and the index number approach rooted in production theory [20]. From a research perspective, existing studies on freight transport efficiency have primarily centered on the logistics domain, including urban logistics [21,22], urban distribution [23], and port logistics [24,25].
Urban road freight transport serves as the backbone and guarantee for the city’s foreign trade exchanges, with its efficiency having a direct bearing on the cost and overall quality of road freight transport services. While the measurement of freight transport efficiency remains a significant focus, numerous scholars have also delved into studying its influencing factors, aiming to enhance the quality of freight transport services in a targeted manner. By analyzing the direction and magnitude of exogenous variables such as economic development [26,27], environmental regulations [1,28], information technology [29], infrastructure and technology [2], and geography [30] on the efficiency of road freight transport, valuable insights can be gained that inform relevant policy formulations.
2.2. Carbon Emissions from Road Freight Transport
According to statistical data provided by the International Energy Agency (IEA), carbon emissions emanating from the transportation sector account for over 25% of the total carbon emissions globally [31]. In numerous cities, road freight transport holds a prominent position as the primary mode of urban freight movement, often contributing significantly more to greenhouse gas (GHG) emissions than other modes, such as rail [32]. Measuring CO2 emissions from urban transport at the city level is crucial for facilitating the transition toward a low-carbon urban transport system. However, the reduction in carbon emissions poses a significant challenge. The transportation sector has earned a reputation for being among the most recalcitrant to decarbonization efforts, with a prevailing consensus that achieving a low-carbon transport system necessitates a comprehensive approach that incorporates demand management, operational efficiencies, pricing strategies, and technical policy options [33].
Accurate measurement of carbon emissions is essential for the effective development of carbon reduction strategies, and numerous scholars have delved into various carbon emission calculation models. Urban road transport typically utilizes two key data points for emissions estimation: vehicle mileage and fuel consumption. CO2 emissions from transport are precisely calculated by multiplying the emission factors of fuels with the total fuel consumed in a particular geographical region. Schipper et al. (1997) [34] analyzed nearly 20 years of freight transport energy consumption and carbon emissions data from ten countries to quantify the role of transportation activities, transportation modes, and energy intensity in driving energy consumption and carbon emissions. Brand et al. (2012) [35] introduced a newly developed strategic transport–energy–environment model called the UK transport carbon model (UKTCM). Wei and Liu (2020) [36] incorporated local regulatory constraints, such as driving time limitations, into their carbon emission calculations.
A significant amount of literature has examined the potential benefits of implementing strategies such as the adoption of electric trucks [3], the freight-sharing economy [4], and optimized path planning [5] to mitigate greenhouse gas (GHG) emissions within the road freight sector. Alarcón et al. (2023) [1] conducted a comprehensive literature review, highlighting the potential impacts of electric vehicles (EVs) on sustainable road-freight transport operations, especially in urban settings. Dehdari et al. (2023) [37] detailed a methodology for calculating the CO2 emissions of road transport across various companies. Based on a survey of 980 freight transport companies in Zhejiang province, China, Wu et al. (2022) [38] analyzed the degree of willingness to adopt low-carbon behavior among freight transport companies in low- and high-GDP regions and concluded that freight transport companies have different paths to low-carbon development at different stages.
2.3. Relationship between Carbon Emissions and Freight Efficiency
The significant size of urban populations, coupled with the intense demand and high intensity of freight transport, gives rise to substantial overall energy consumption and subsequent carbon emissions from urban road freight transport. Environmental sustainability and low-carbon development have become imperative requirements for modern urban freight transport systems [39].
Clarifying the intricate relationship between urban road freight transport and carbon emissions is crucial for promoting the sustainable development of urban road freight transport. It has emerged as a research priority to investigate the coupling relationship between various resource elements of urban road freight transport and the ecological environment while realizing the reasonable and efficient use of core resource elements. Current research primarily concentrates on specific levels, such as facilities and land [40].
Studies on urban development and carbon emissions have revealed that, upon reaching a certain level of urbanization, technological advancements, clean energy sources, and infrastructure are fully leveraged, leading to the upgrading and restructuring of the industrial structure. Consequently, this results in a reduction in carbon emissions [41]. Comparable relationships exist between economic growth and environmental pollution [38], as well as between economic growth and carbon emissions [42]. Papież et al. (2022) [43] investigated the influence of the European Union’s (EU) energy policy on decoupling economic growth from emissions in EU countries between 1995 and 2017. A decomposition analysis conducted by Andreoni and Galmarini (2012) [44] examined Italian energy consumption and discovered that, during the studied period, the Italian economy did not achieve absolute decoupling in terms of energy consumption and CO2 emissions. While many of these studies have employed or referenced the decoupling theory proposed by Tapio (2005) [45], there has been a lack of research applying it to the nexus between road freight efficiency and carbon emissions.
In conclusion, a significant amount of research has been conducted on the efficiency and carbon emissions of road freight transport. Studies that analyze carbon emission predictions and their influencing factors have, to some extent, stimulated reflections on achieving a sustainable paradigm characterized by both low-carbon practices and robust economic efficiency in this sector. However, several research gaps remain. Firstly, previous studies on road freight transport efficiency often employed nonparametric methods utilizing linear programming to outline production boundaries [46]. These approaches encounter difficulties in precisely capturing the dynamic evolution of road freight efficiency over time, presenting a need for more advanced methodologies in this domain. Secondly, there is a notable lack of research on the integration of carbon emissions with other dimensions, such as energy consumption patterns and economic development levels, which influence carbon emission performance [47]. Finally, the exploration of the synergistic interaction between transport carbon emissions and economic efficiency remains limited. While certain studies perceive carbon efficiency as a mirror of carbon emissions performance, such as the exploration into the association between urban compactness and carbon emission efficiency in China, by Liu et al.(2014) [48], the bulk of existing research has primarily delved into the influence of factors like energy consumption structure and economic growth on carbon emissions. There has been less emphasis on the mutually influential relationship between low-carbon freight efficiency and carbon emissions, leaving a gap in our understanding of this critical nexus.
3. Methodology
3.1. Methodology for Analyzing the Efficiency of Urban Road Freight Transport
3.1.1. The Three-Stage DEA Model
The DEA model, also known as the data envelopment analysis model, is a linear programming tool primarily used to assess the relative efficiency of decision-making units (DMUs) that share similar characteristics and include numerous input and output indicators. The DEA model is widely used in the field of logistics and transport efficiency analysis. It is a valuable tool for assessing the efficiency of the coordination between different modes of transport. By using the DEA model, organizations and policymakers can gain deeper insight into the operational efficiency of their transport networks, enabling them to identify areas for improvement and optimize performance accordingly. Wiśnicki et al. [49] used the data envelopment analysis technique to meticulously assess the relative operational efficiency of nine European container terminals, taking into account their different loading and unloading technologies. Pham et al. (2021) [50] conducted a comprehensive analysis using a two-stage uncertainty DEA combined with fuzzy C-means clustering. This unique approach allowed them to evaluate the operational efficiency of the world’s top 40 container ports over five consecutive years, focusing on two key dimensions: productivity and profitability. Lee et al. (2023) [51] used the DEA model to rigorously evaluate the efficiency of logistics companies. Their aim was not only to assess performance but also to identify potential areas of improvement for those logistics companies that were found to be operating inefficiently.
The three-stage DEA model effectively mitigates the influence of environmental factors and random noise on efficiency measurements, thereby enhancing the precision of the efficiency values in reflecting the internal management capabilities of each DMU. This sophisticated model, regarded as a key tool for analyzing efficiency, assesses the relative performance of the various stages involved. This study drew on the three-stage DEA model proposed by Fried et al. (2012) [52] to evaluate the efficiency of diverse urban road freight transport systems.
- DEA–BCC model
In the first stage, DEA modeling serves as the foundation for evaluating efficiency, utilizing raw input–output data. To accurately measure efficiency values and make relative effectiveness comparisons among decision-making units (DMUs), we chose the scale reward variable input-oriented DEA–BCC approach. This method was crucial in establishing optimal production frontiers for each period, enabling a comprehensive evaluation of DMU efficiency.
- 2.
- Stochastic frontier analysis
The second stage is stochastic frontier analysis (SFA). The primary objective of this stage revolves around disentangling slack variables into three distinct effects: environmental factors, managerial inefficiency, and random errors. The SFA regression facilitates this disentanglement process by regressing the environmental variables and the mixed error term while utilizing the slack variables obtained from the first stage. After maximum likelihood estimation, an adjustment was meticulously introduced to the selected input variables. This adjustment ensured that all decision-making units were calibrated to the same external environment.
- 3.
- DEA–BCC model with adjusted variables
The third stage is the DEA-BCC analysis after adjusting for factors. This stage involves leveraging the refined input–output variables to re-evaluate the efficiency of each decision-making unit. Notably, the efficiency value obtained during this stage is purified of any influence arising from environmental and random factors, resulting in a more authentic and precise portrayal of efficiency.
For a detailed methodology of the three-stage DEA model, interested readers can refer to the paper by Fried et al. (2012) [52].
3.1.2. The Malmquist Index and Factor Decomposition
The Malmquist index serves as a pivotal tool in assessing quantitative changes in consumption inputs across various periods. By seamlessly integrating input–output indicators into the Malmquist index through a data envelopment analysis (DEA) model, it becomes feasible to identify shifts in interperiod productivity efficiency. An M index above one indicates a positive trend in the economic efficiency of road freight transport over time. Conversely, an M index that equals one signifies unchanged efficiency, while a value below one implies a decline in the efficiency of road freight transport. This analysis provides valuable insights into the dynamic nature of the economic performance of road freight transport over time.
The quantification of the alteration in technical efficiency from period to period , considering the technical conditions prevailing in period , is detailed in Equation (1).
To address the assessment dilemma about the freight efficiency in each representative city, we consider a scenario where the periods are denoted as , and there exist decision-making units, labeled as . The i-th input of the r-th decision-making unit in period is represented as . Similarly, the j-th output of the same r-th decision-making unit in period is designated as . Assuming the variable returns to scale, the distance function of in period is noted as , and in period t + 1 as . Correspondingly, the distance function in period t for is represented as , while the distance function for the period t + 1 is denoted as .
Quantifying the alteration in technical efficiency from period to period , under the prevailing technical conditions in period , can be expressed as follows:
Furthermore, consider the distance function for in the subsequent period , denoted as . Similarly, for in period , let it be represented by . Additionally, the distance function for the same in period is denoted as .
The alteration in productivity between periods and can be accurately determined by calculating the geometric mean of the two Malmquist indices in Equations (1) and (2), with the resultant value expressed in Equation (3).
where represents the distance between observable and potentially optimal production between periods and + 1, i.e., technical efficiency index (EC); the formula in parentheses reflects the movement of the technological frontier realized between periods and + 1, i.e., the technical progress index (TC). In addition, under the assumption of variable returns to scale, the technical efficiency index (EC) can be further decomposed into pure technical efficiency change and scale efficiency change.
These two pivotal factors significantly impact the Malmquist index, as they play a central role in its decomposition. The calculation for EC and TC for the r-th decision unit is shown in Equations (4) and (5), respectively.
where represents the input vectors for period , while signifies the output vectors for decision-making unit during the same period.
where represents the input vectors for period , and signifies the output vectors for decision-making unit during the same period.
In Equations (4) and (5), and represent the levels of technical efficiency in period , derived by referencing the data from periods and , respectively. Analogously, and signify the levels of technical efficiency in period , calculated by referencing the data from periods and . To ascertain the technical efficiency level for period , we use Equation (1) to solve for each distance production function.
3.2. Methodology for Analyzing the Low-Carbon and Efficient Synergistic Development of Road Freight Transport
Considering the composite system , a mutual influence and interaction relationship exists between the subsystems, known as the composite mechanism of . We set the composite carbon emission–economic efficiency road freight transport system as , where is the carbon emission subsystem, and is the economic efficiency subsystem.
- Sequential parameters
Within the composite system, each subsystem comprises a set of sequential parameters that define its evolutionary trajectory and guide its behavior. We define to signify the sequential parameters of the carbon emission subsystem and the economic efficiency subsystem, respectively. The carbon emissions associated with road freight transport are intricately linked to multiple factors, including cargo turnover, the gross value of the road freight industry, the number of vehicles utilized for cargo transport, and road mileage, among others. As China’s freight transport sector undergoes continuous evolution, these factors exert significant influence on the system’s structure, behavior, and functionality at various stages of development. Consequently, they are deemed appropriate as sequential parameters for analyzing the system’s performance. Denoting , we capture the specific conditions of the carbon emission subsystem and the economic efficiency subsystem—specific state variables describing the sequential parameters. Throughout the evolution of the system, the state variable indicator serves as a metric to assess the system’s order. If the indicator belongs to a benefit category, higher values indicate a higher level of system order, while lower values suggest a lower level. Conversely, for indicators categorized as costs, higher values indicate a lower level of system order, and lower values indicate a higher level. However, to ensure consistency and comparability, practical data often require further standardization.
To quantitatively assess the influence of ordinal parameter on the orderliness of subsystem , we introduce the concept of an effectiveness function, denoted as , where 0 < EC < 1. A function value of EC close to 1 indicates a higher degree of system orderliness, whereas its proximity to 0 suggests a lower level of orderliness within the system.
The measurement of system orderliness for component within subsystem is determined by using Equation (6). In this equation, and represent the upper and lower critical thresholds for the indicator , respectively, with . The metric quantifies the impact of indicator on the subsystem’s degree of orderliness; higher values of indicate a greater contribution of to subsystem order. In practical economic systems, excessively high or low values of are typically undesirable, instead tending to concentrate around an optimal point. In such cases, it is often necessary to adjust the interval values, [,], to align the level of orderliness with the definition provided in Equation (6).
- 2.
- Subsystem ordering degree model
To achieve a holistic understanding of the impact of state variable on subsystem orderliness, the integration of becomes imperative. When assessing the overall degree of order for both the carbon emission subsystem and the economic efficiency subsystem, a method that incorporates “integration and consolidation” proves effective. In light of this, this study employed a linear weighting approach to synthesize the influence of order coefficients on the subsystem, providing a comprehensive assessment, as determined through Equation (7).
Equations (8) and (9) show the constraints for weight coefficient .
The formulation of the system order function serves to quantify the contribution of the sequential parameter to subsystem ’s degree of orderliness. When the order degree attains a value of 0, it indicates minimal system order, whereas an order degree of 1 represents a peak level of system orderliness.
When determining the weight coefficients , it is crucial to take into account the operational realities of the subsystem and to align them with specific development objectives. This ensures an accurate assessment of the subsystem’s degree of orderliness, which falls within the range of . To achieve this, the linear weighted summation method is used, which allows a practical approach to evaluating the orderliness of the system.
- 3.
- Calculation of overall synergies
The degree of synergy between the carbon emission subsystem and the economic efficiency subsystem serves as an indicator assessing the state of synergy between the two development objectives of low carbon and high efficiency in road freight transport. It also provides insight into the direction and magnitude of the transition from disorder to order within this composite system.
Define the degree of orderliness of each subsystem at the initial moment as . During the development and evolution of a green road freight system, the degree of orderliness of each subsystem at time is denoted as . The calculation of the composite system synergy effect, called the GRFS, is outlined in Equations (10) and (11).
The explanation for GRFS is as follows:
- The result of GRFS falls within the range of 0 to 1. A higher numerical value indicates a higher level of synergy within the composite system, whereas a lower value signifies a reduced degree of synergy.
- The significance of parameter is that when the time shifts from to , the GRFS exhibits positive synergy if and only if .
- Equation (10) offers a comprehensive evaluation of each subsystem within the system. If one subsystem experiences a significant improvement in its degree of orderliness, while another subsystem experiences minimal improvement or even a decline, this indicates that the system is not in an optimal state of synergy or may not have any synergy at all. This nonideal synergistic state is reflected by .
- GRFS provides a dynamic metric evaluation method that captures the synergistic status of the composite system. It does so by analyzing the changes in the ordering degree of sequential parameters across the subsystems. This evaluation reflects the effectiveness of the system’s synergistic development and the evolution of that development over time.
4. Empirical Analysis
4.1. Selection of Indicators and Data Sources
The research data utilized in this study were sourced from various reliable and authoritative institutions. Specifically, they encompassed data publicly disseminated by the National Bureau of Statistics of China and the Ministry of Transport. Among the publications utilized were the “China Statistical Yearbook” (2015–2020), city-specific statistical yearbooks, including those specific tor Wuhan (2015–2020), the “China Third Industry Statistical Yearbook” (2015–2020), and the “China Energy Statistical Yearbook” (2015–2020). To address missing data points, this study employed a prediction method rooted in regression analysis for supplementation. For instance, when fixed asset investment data for Wuhan’s road freight transport sector in 2018 were not available, this study leveraged both linear and nonlinear regression techniques, alongside interpolation methods, to predict the missing data.
4.1.1. Description of Data for Measuring Road Freight Efficiency
Drawing from previous studies, such as those referenced in the literature [14,49], and considering the availability of relevant data, the input indicators for this analysis were selected from the labor and infrastructure dimensions that are pertinent to the transportation sector. For the labor and economic input dimension, a quantitative approach was employed. Specifically, the labor input was represented by the count of professionals engaged in the road freight transport sector, denoted as [53]. The economic input was quantified by measuring the fixed asset investment in road freight transport by vehicles carrying goods, denoted as . To obtain this value, fixed asset investment data from city-specific statistical yearbooks for the road freight transport sector were integrated with the perpetual inventory method to estimate the annual capital stock. When evaluating the infrastructure input, two indicators were selected: the number of vehicles carrying goods in road freight transport denoted as and road mileage denoted as .
The output indicators, road freight transport turnover () and road freight production value (), were carefully selected from both economic and practical standpoints. The road freight transport turnover, in particular, is a direct product of traffic volume and distance. This metric offers a clear indication of the consistency between economic activity and demand for road freight transport, without being influenced by price fluctuations.
Environmental variables play a crucial role in potentially influencing the measured value of integrated freight efficiency. However, within the scope of the sample, these variables remained constant due to several specific factors. Drawing guidance from existing research [14,49,50] and insights gained from the pragmatic development of road freight transport, two environmental variables were selected: urban disposable income per capita () and the proportion of the automobile manufacturing sector in the composition of high-tech industries related to road freight transport (). These variables served as proxies for the regional economic status and the extent to which advanced industries support road freight transport, respectively.
In summary, the evaluation framework for road freight transport efficiency encompassed four input indicators, two output indicators, and two environmental variables, as outlined in Table 1. This comprehensive approach allowed for a detailed analysis of the system’s performance and the identification of key factors that influence its efficiency.

Table 1.
Evaluation indicator system.
Table 2 displays the descriptive statistics of the input and output indicators used to evaluate the efficiency of road freight transport in the sampled cities for the year 2020.
Table 2.
Descriptive statistics of road freight transport indicators by cities in 2020.
The data obtained from the road freight transport sector revealed a notable positive correlation between input and output indicators. Furthermore, significant variations were observed in the input and output indicator data among the different sample cities. Based on these observations, it was confidently concluded that the efficiency measurement derived from this sample data was accurate and reliable. Specifically, the calculated value of road freight efficiency in Wuhan is trustworthy.
Table 3 provides descriptive statistics related to the input and output indicators, offering a comprehensive overview of the road freight transport efficiency in Wuhan from 2015 to 2020.
Table 3.
The statistical description of road freight transport indicators in Wuhan from 2015 to 2020.
4.1.2. Description of Data on Carbon Emission Factors of Road Freight Transport
In this study, grey correlation analysis was carried out on the panel data of carbon emissions from road freight transport in Wuhan. The method consisted of two steps: first, data analysis was used to identify the main factors affecting carbon emissions and standardize the data, then the correlation coefficients between the factors and carbon emissions were calculated, and the top six factors with the highest correlation coefficients were selected as key indicators for calculating the orderliness of the carbon emission subsystem.
The sequential parameter within the road freight transport collaborative system served as a crucial metric for precisely assessing synergy levels. The selection of this parameter necessitated a comprehensive consideration of harmonious growth among various subsystems within the road freight industry, ensuring a balanced and integrated approach to sustainable development. Given that synergy development is an inherently dynamic process, the inclusion of a time dimension is essential for effectively characterizing the degree of synergy in a complex system.
The reference sequence, i.e., the primary research object, was the annual carbon emissions related to road freight transport in Wuhan, denoted as and measured in megatons. The corresponding comparative sequence encompassed various dimensions, including the energy intensity of the urban road freight industry, represented by energy consumption per unit of GDP (, measured in tons of standard coal per billion CNY), gasoline consumption (, measured in tons of standard coal), diesel fuel consumption ( in tons of standard coal), electric power consumption (, measured in tons of standard coal), the proportion of heavy-duty trucks (), the proportion of light-duty trucks (), road freight turnover (, measured in gigaton kilometers), and road freight volume ().
Additional variables included in the study encompass the price of No. 95 gasoline oil (, measured in CNY/liter), the price of No. 92 gasoline oil (, measured in CNY/liter), the price of No. 0 diesel oil (, measured in CNY/liter), the total value of the primary sector (, measured in billion CNY), the total value of the secondary sector (, measured in billion CNY), the total value of the tertiary sector (, measured in billion CNY), and the average annual freight volume of freight vehicles (, measured in tons).
To analyze the carbon emission data related to road freight transport in Wuhan from 2015 to 2020, we collected data from various sources, such as the China Statistical Yearbook, Wuhan Statistical Yearbook, and the Energy Statistics, to ensure the comprehensiveness and accuracy of the data. Table 4 shows the normalized data on carbon emissions from road freight transport in Wuhan.
Table 4.
Carbon emission data in Wuhan after standardized treatment.
The correlation coefficients between the influencing factors and carbon emissions based on grey correlation analysis are shown in Table 5 for six factors, namely, gasoline consumption, diesel fuel consumption, the proportion of heavy-duty trucks, road freight turnover, road freight volume, and the total value of the primary sector.
Table 5.
Correlation coefficient between influencing factors and carbon emissions.
4.2. Construction of Indicator System for Synergy Measurement
Table 6 shows the refined sequential parameters of the system. This table succinctly presents the structure of the synergy measuring system that governs both road freight subsystems, providing a clear and concise representation of their interrelationship.
Table 6.
Indicator system for synergy measurement.
4.3. Analysis of Road Freight Transport Efficiency in Wuhan
4.3.1. Three-Stage Static Efficiency Analysis
- Calculation of efficiency values for the first stage
Using Deap2.1 software, we conducted a calculation of the input–output variables for 17 prominent cities in China, spanning the period from 2015 to 2020. The calculation results are detailed in Table 7.
Table 7.
Freight transport efficiency in stage 1 and stage 3 from 2015 to 2020.
Table 7 reveals several noteworthy observations. Firstly, the comprehensive technical efficiency (Crste) of freight transport in the initial phase of 17 advanced-development cities in China, from 2015 to 2020, was 0.600 on average. Secondly, the average pure technical efficiency (Vrste) was 0.707, while the average scale efficiency (Scale) was 0.822. Taking a holistic perspective, Wuhan’s freight transport efficiency, although below the efficiency frontier, surpassed the average of first-tier cities. The road freight transport market exhibited robustness, with road freight policies contributing to enhanced regional transport efficiency. However, these outcomes were influenced by environmental variables and stochastic elements, potentially biasing the measurement of road freight transport performance and undermining an accurate portrayal of advanced cities like Wuhan. Notably, current freight transport efficiency lagged (Crste < 0.5), with pronounced shortcomings in output and input redundancy. This poses challenges for the overall improvement in road freight transport efficiency in China’s primary cities, emphasizing the need for further stochastic frontier analysis.
- 2.
- Input redundancy and output improvement analysis
Environmental variables have a significant impact on the actual level of efficiency of road freight transport. The initial step in this phase involved incorporating input variables such as the number of practitioners in road freight transport and the count of vehicles transporting goods as slack variables for stochastic frontier analysis (SFA) regression analysis. Additionally, the regression analysis relied on two key environmental indicators: urban per capita disposable income and the proportion of the road freight transport industry within the high-tech industry composition. The estimation process utilized Frontier 4.1 software for maximum likelihood estimation, resulting in the outcomes presented in Table 8.
Table 8.
Results of SFA regression analysis.
The results presented in Table 8 indicate that based on the outcomes of the one-sided likelihood ratio (LR) test, we obtained LR test values of 6.867, 7.028, 5.169, and 6.040 under the relaxed constraints of various input variables. At a 5% significance level, these values exceed the critical value of 3.841 for the one-sided generalized likelihood ratio test. This suggests the rejection of the null hypothesis, signifying a significant impact of relaxed input constraints on the model. Therefore, the application of stochastic frontier analysis (SFA) regression analysis to assess managerial inefficiency is appropriate, and the selection of environmental variables appears well-founded.
Furthermore, within the context of the SFA regression model, our analysis reveals that the regression coefficients for the four input elements, including the number of practitioners in the road freight transport () and the number of vehicles carrying goods (), are positive, measuring 16.538 ***, 18.926 ***, and 33.538 ***, respectively, all at a 5% level of significance. This demonstrates that an increase in environmental variables would elevate the relaxation of input elements, leading to their underutilization. Notably, the influence of the fixed asset investment in road freight transport () is particularly pronounced (33.538), although an excessive increase in this input could escalate redundancy, consequently impairing freight efficiency. This suggests a possible saturation point in investment within the road freight industry, prompting attention to enhancing freight technology and optimizing the allocation of road freight personnel, thereby mitigating resource redundancy and promoting more rational allocation.
The values of , which denote the stochastic error term of technical efficiency, elucidate the disparity between the actual and potential outputs at the same technical efficiency level, a difference attributed to uncontrollable random factors. Hence, the values of γ can be interpreted as nontechnical influences on decision unit efficiency. Notably, the experimental results exhibit γ values exceeding 0.9, verified through a 5% confidence test, implying a significant impact of the stochastic error term on technical efficiency.
- 3.
- Adjusted DEA efficiency values
The results of using the input-oriented BBC model to calculate road freight efficiency are shown in the right column of Table 7. Notably, in Wuhan, the pronounced decline in comprehensive efficiency could be chiefly attributed to the reduction in scale efficiency. Consequently, enhancing the management of input inefficiencies in these aspects could be beneficial in scaling-up freight transport and achieving a more balanced input–output equilibrium.
Pure technical efficiency appraises a region’s road freight management and resource allocation proficiency. When the value reaches 1 (Vrste = 1), it indicates that equivalent levels of road freight practitioners and the number of vehicles carrying goods inputs correspond to increased road mileage and gross product of the road freight industry. For Wuhan, a Vrste of 0.942 indicated that the influence of environmental variables and stochastic factors on the representative value is significant. Hence, elevating the management standard of freight transport inputs is imperative for optimizing the utility of road freight transport inputs.
Scale efficiency measures the gap between actual road freight inputs and the optimal inputs within each region. A scale efficiency value of one indicates that the rate of output growth in road freight transport efficiency surpasses the rate of input growth. In the case of the 17 representative cities in China, the overall scale efficiency of freight transport decreased by 0.285, with Wuhan’s decrease accounting for 0.272. This reveals a significant influence of environmental variables on road freight transport performance. Notably, the comprehensive freight level of these cities fell below the desired state by 0.1, indicating that the freight transport level across representative cities had not yet reached the efficiency frontier surface. This was primarily due to the low scale efficiency.
4.3.2. Malmquist Index Analysis
By applying Formulas (1) to (5), consecutive generations of the production distance function can be obtained for both the current period and the lagged period. The Malmquist index offers a dynamic representation of efficiency trends across different regions. By calculating the efficiency for consecutive periods, the results were as presented in Table 9.
Table 9.
The Malmquist index from 2015 to 2020.
Upon reviewing the results presented in Table 9, it becomes evident that the average Malmquist index value for Wuhan between 2015 and 2020 remained below one. Notably, the Malmquist index for the road freight transport sector during 2019–2020 registered at 0.639. This finding signifies a decline in the efficiency of road freight transport in 2020 compared to 2019. This decrease could be attributed to the direct impact of the 2020 pandemic outbreak, resulting in an average value below one. For the remaining years, the Malmquist index for road freight transport fluctuated around one.
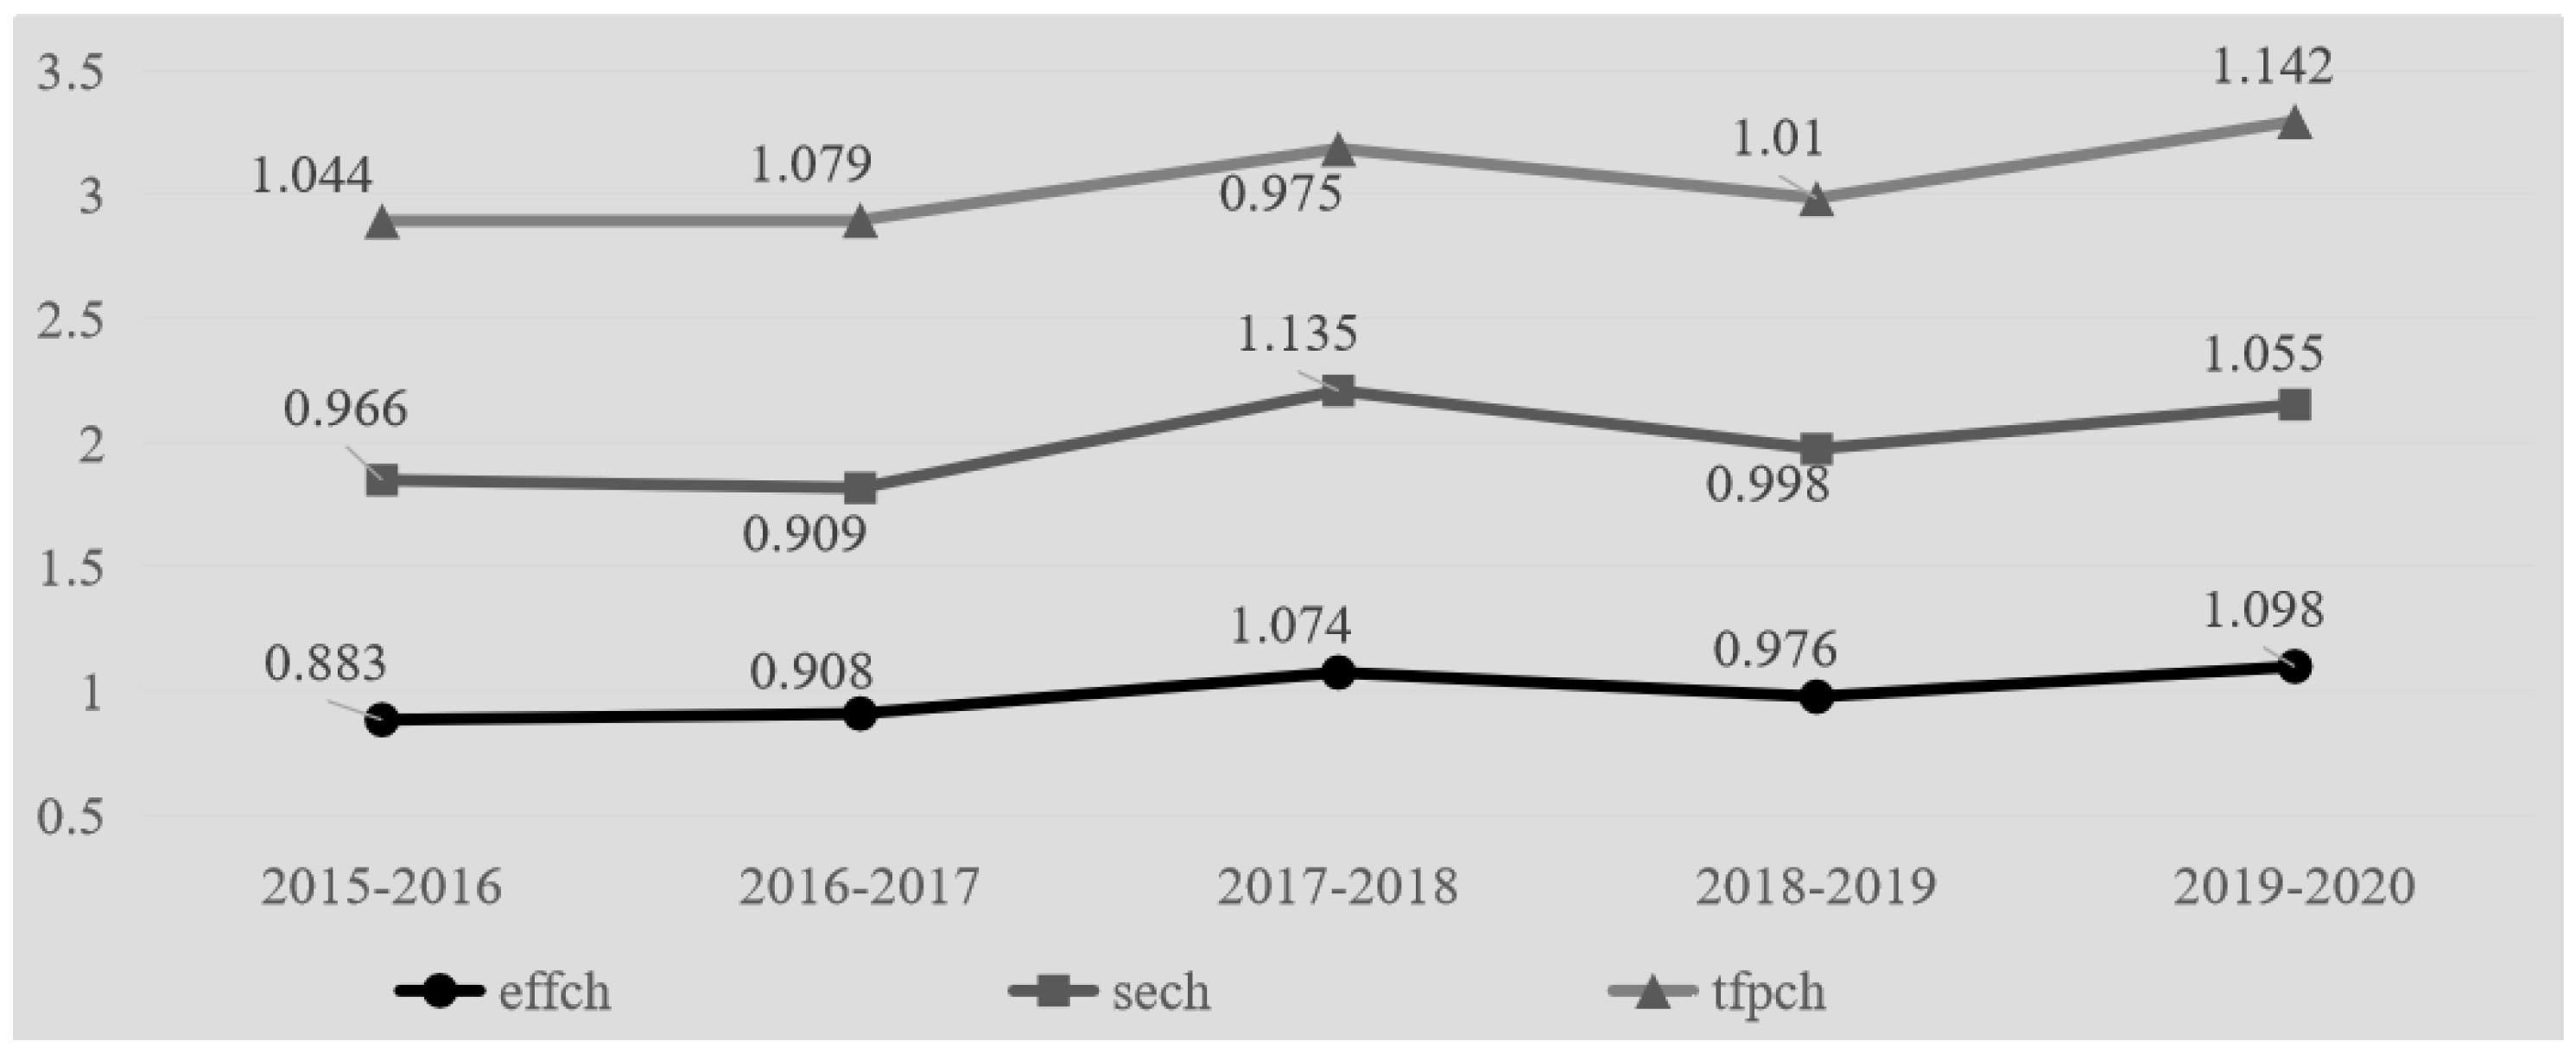
To further analyze these trends, we decomposes the productivity data for the road freight industry from 2015 to 2020. The resulting index decomposition outcomes, along with the regional distribution characteristics of Wuhan and other six cities, are presented in Table 10. Additionally, Figure 1 provides a visual representation of the evolving trend in total factor productivity and the corresponding changes in factor decomposition.
Table 10.
Malmquist index and decomposition of road freight transport.
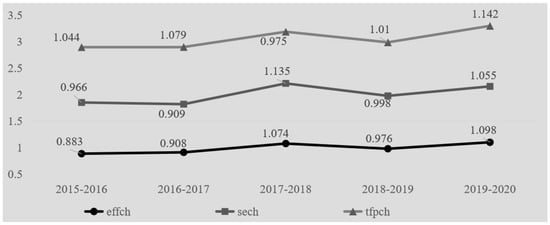
Figure 1.
Trends in total factor productivity and factor decomposition.
Analyzing the data through a city-specific lens, the findings in Table 10 reveal distinct trends among the 17 prominent first-tier cities in China, over the period from 2015 to 2020. Specifically, the total factor productivity growth rate for road freight transport in Guangzhou, Wuhan, Xi’an, and Shenyang—cities that serve as representatives within the region—were below one, indicating a downward trend. This decline in total factor productivity could primarily be attributed to lagging road freight transport technology. Therefore, these four cities urgently require a stronger focus on innovating and adopting advanced road freight transport technologies.
4.4. Analysis of Synergies for Efficient and Low-Carbon Freight Transport
The compiled data related to the sequential parameters of both the carbon emission subsystem and the economic efficiency subsystem in Wuhan’s urban road freight transport are presented in Table 11 and Table 12, respectively.
Table 11.
Sequential parameters of the carbon emission subsystem.
Table 12.
Sequential parameters of the economic efficiency subsystem.
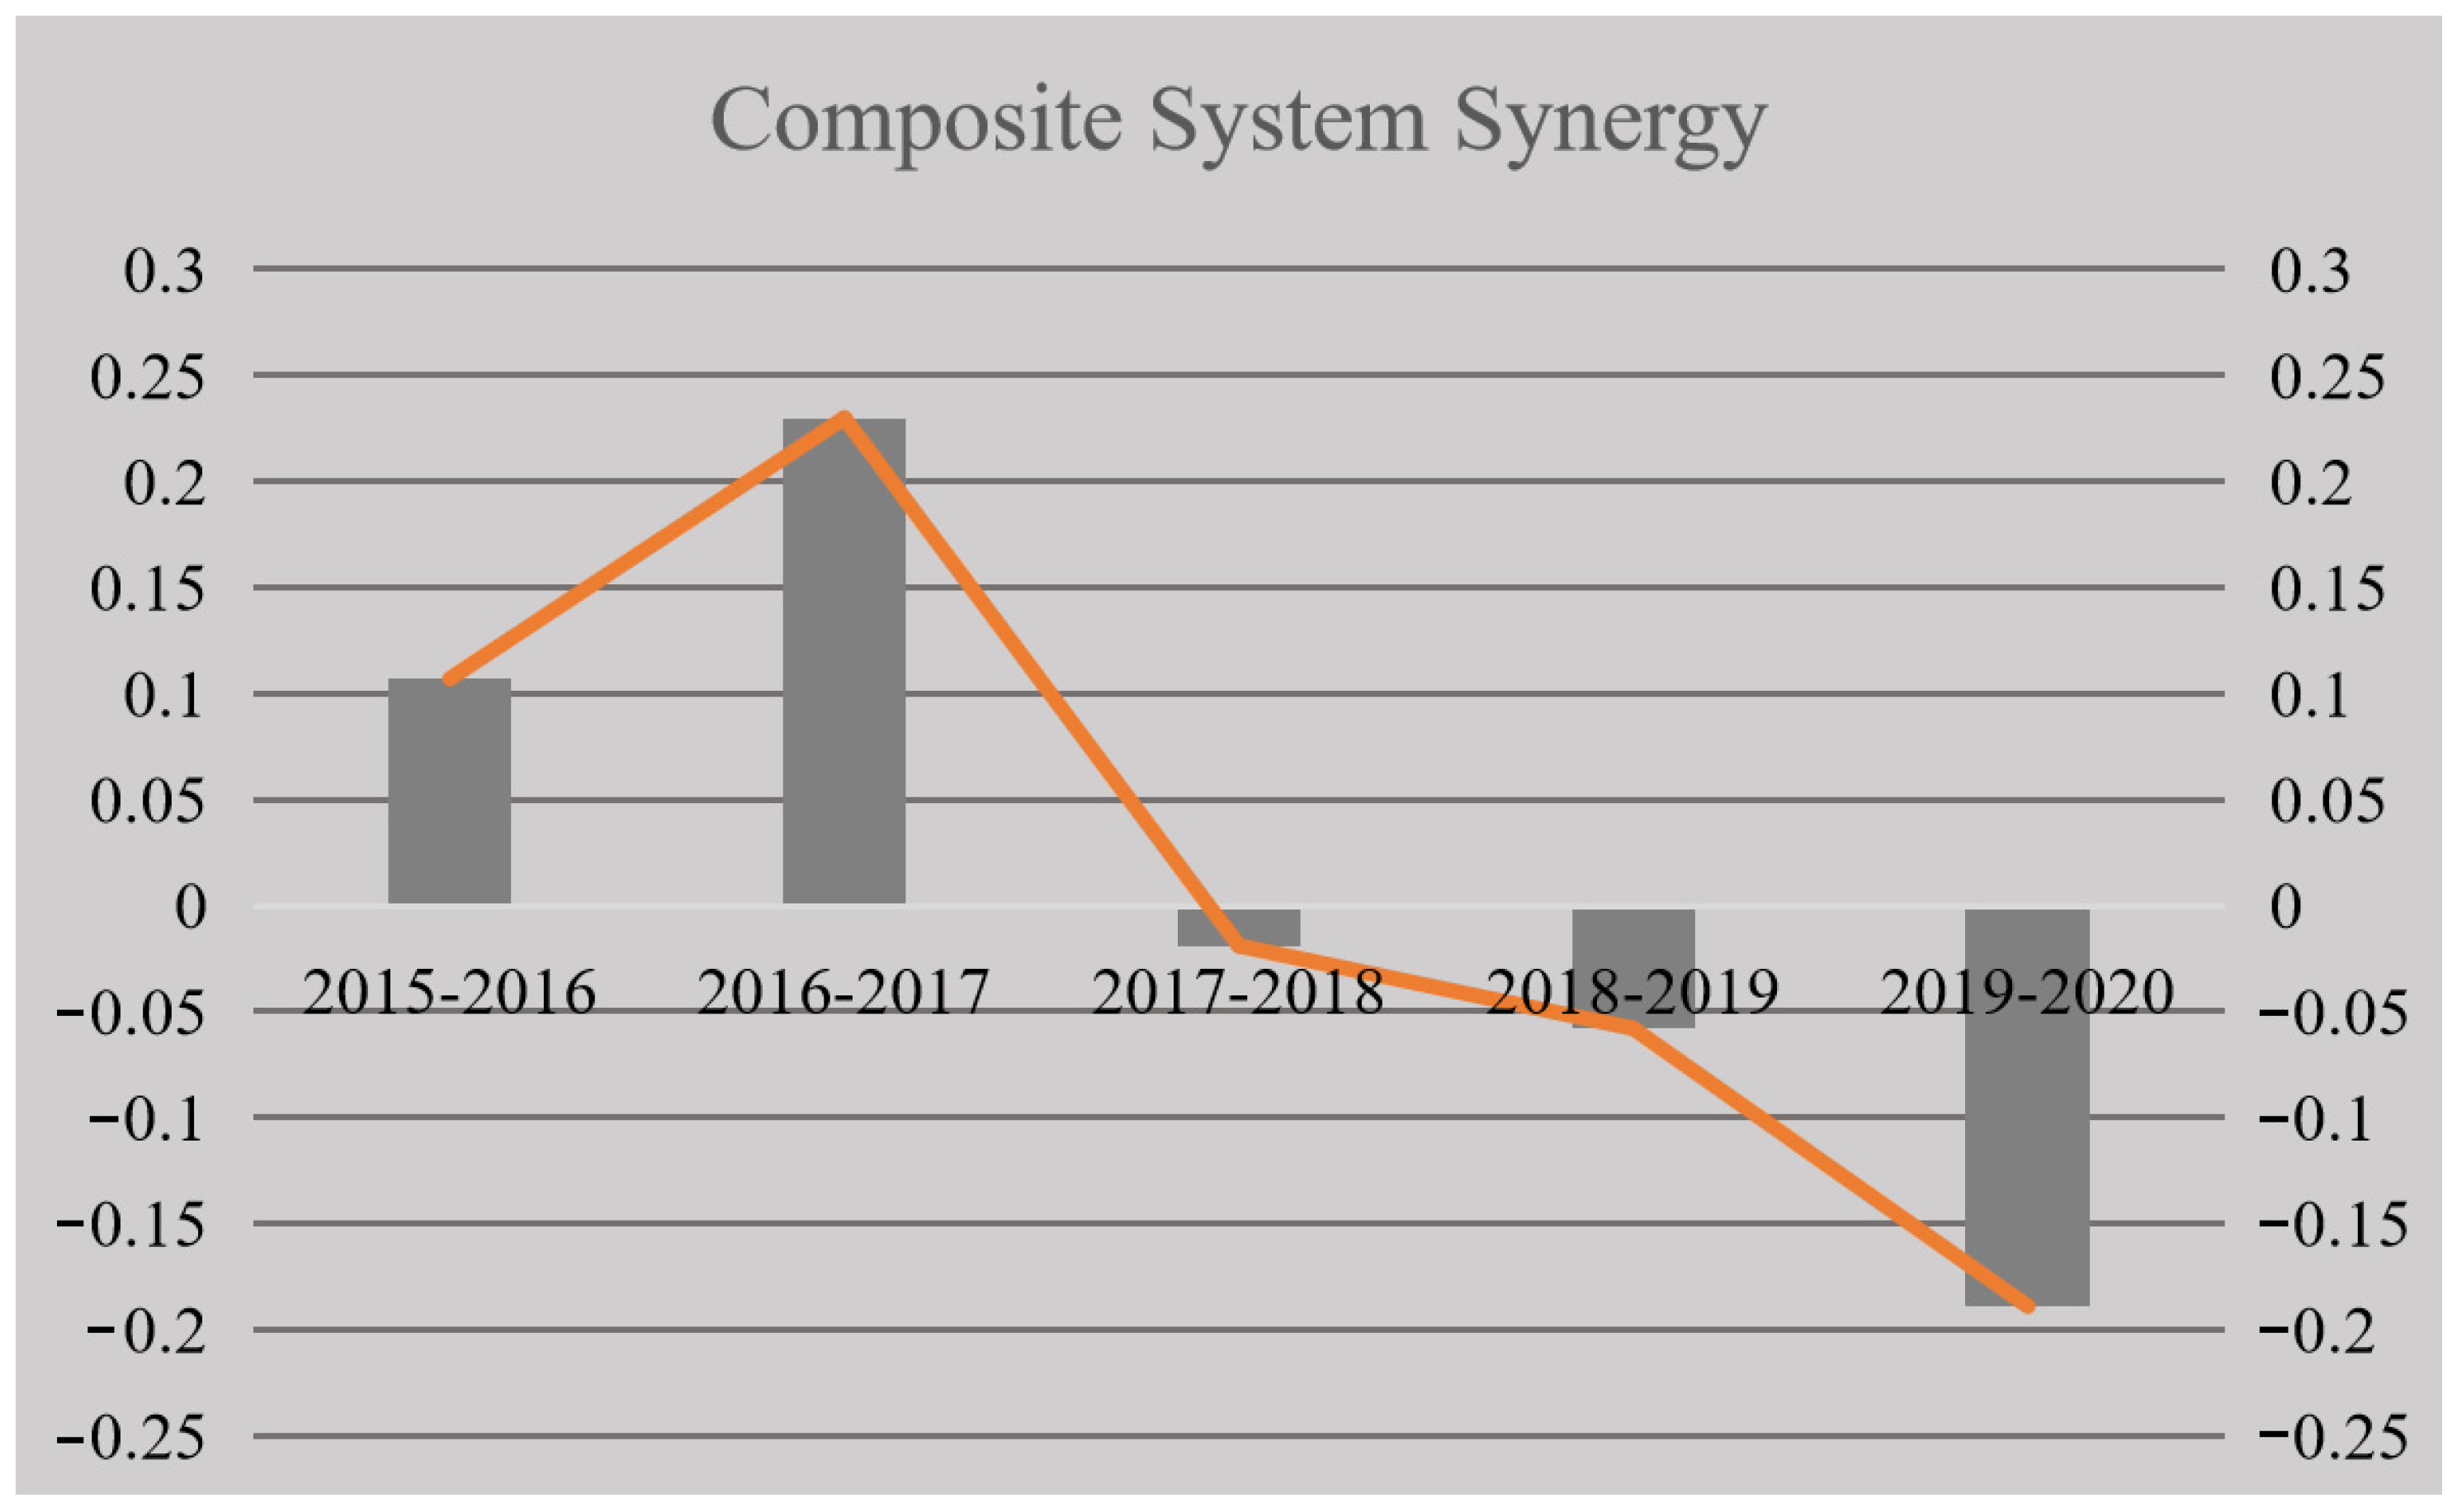
By using the methodology outlined in Section 3.2, the carbon emission and economic efficiency subsystem orderliness, along with their corresponding growth rates, and the degree of synergy of the composite system were derived. The results of this analysis are presented in Table 13 and Figure 2.
Table 13.
The orderliness of the carbon emission subsystem and economic efficiency subsystem and the growth rate in Wuhan in 2015–2020.
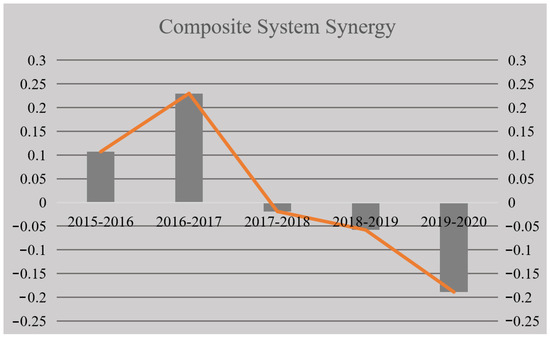
Figure 2.
Composite system synergy trend.
As can be seen in Figure 2, the synergies were positive only in the periods 2016–2017 and 2017–2018, indicating that the system was in a synergistic state at this time, but the maximum value was only 0.23, indicating that the synergies were relatively low. All other intervals had negative synergies, indicating that the system was in a nonsynergistic state.
5. Main Results and Discussion
5.1. Efficiency and Carbon Emissions of Urban Road Freight in Wuhan
From 2015 to 2020, among the 17 selected Chinese cities, 13 cities, including Beijing, showed an overall road freight efficiency growth rate above oen, indicating robust progress in China’s road freight industry. However, Wuhan’s road freight efficiency growth rate showed a declining trend and remained below one. After isolating the impact of environmental variables and random factors, Wuhan’s overall efficiency decreased by 0.13, with a notable decline in scale efficiency of 0.272 playing a pivotal role. Notably, environmental factors had a significant influence on road freight performance. The primary impediment for cities failing to reach the efficiency frontier was in the low scale efficiency. To address this, there is a need to enhance investment management efficiencies in these regions. By appropriately expanding freight operations, a relative equilibrium can potentially be achieved.
Moreover, comprehensive technical efficiency only reaches a value of one when both pure technical efficiency and scale efficiency reach their maximum values of one. To bridge the gap between the actual and optimal scales of production, it is necessary to increase labor specialization, reduce unit transport costs, and optimize economies of scale. Although the pure technical efficiency of road freight transport in Wuhan has improved by about 0.1 in the third-stage DEA measurement, it is still not fully effective. Therefore, it is imperative to strengthen investment management in the road freight industry and increase pure technical efficiency by improving management practices and incorporating advanced technologies. This will enable the efficient production of input elements at optimal scales and maximize the utility of inputs in road freight transport, ultimately improving the overall efficiency of the system.
At the beginning of the 2015–2016 period, the carbon emission subsystem of urban road freight transport in Wuhan exhibited a low level of orderliness, with a value of only 0.107. However, it experienced a significant increase, soaring to 0.230 in the following year and reaching its peak in 2017. Concurrently, the economy grew steadily, particularly in 2016–2017, when productivity growth rates exceeded 50%. Unfortunately, the outbreak of COVID-19 in 2019 led to a decline in both low-carbon road freight development and road freight efficiency, which had a significant negative impact on economic development, further highlighting the interconnectedness of these systems.
5.2. The Synergy Degree of Low-Carbon and Efficient Development of Urban Road Freight Transport in Wuhan
Wuhan’s urban road freight industry showed a cyclical pattern of “no synergy—some synergy—no synergy” in terms of efficient and low-carbon development, which indicates a relatively low degree of synergy between the two. Specifically, there were significant differences in transport economic characteristics between the carbon emissions subsystem and the economic efficiency subsystem. As the integrated freight efficiency gradually improved, a long-tail effect occurred, and this effect influenced the overall alignment of efficiency and carbon emission changes.
It is noteworthy that the performance of Wuhan’s road freight system in terms of low-carbon development lagged behind its level of efficiency development. This reflects a certain degree of disconnect between environmental sustainability productivity and economic growth. Therefore, the need to address carbon emissions and promote the adoption of cleaner energy sources while increasing the productivity of the road freight system has become a pressing issue. If these environmental factors are ignored, it could lead to environmental degradation despite the economic progress characterized by increased road freight turnover and gross industrial output. Currently, the slow progress in controlling carbon emissions has become a major obstacle to the coordinated development of low-carbon and efficient road freight transport. Therefore, Wuhan needs to strengthen environmental protection measures and promote the use of clean energy to achieve sustainable and coordinated development of the road freight transport industry.
Additionally, the magnitude of the contribution of the efficiency-based sequential parameters to the carbon emission subsystem further affected the overall degree of synergy. This is particularly evident in the public sequential metric of “road freight turnover”. Wuhan must foster environmentally friendly resource utilization within a favorable economic context, emphasizing the enhancement in efficiency-based sequential parameters and minimizing the consumption of cost-based parameters like gasoline. While the adoption of cleaner trucks has a significant, albeit limited, impact, it must be aligned with the low-carbon transition of China’s road freight sector and advancements in clean truck technology to achieve carbon peaking in the industry [5].
6. Conclusions
With the increasing environmental requirements of society, the road freight transport industry faces the challenge of balancing its scale of expansion with environmental sustainability. The low-carbon and high-efficiency synergistic development of road freight transport can help to meet the challenge of global climate change on the one hand and enhance the competitiveness of the road freight transport industry on the other hand, which is of great significance. In-depth research on the synergistic development of low-carbon and high-efficiency road freight transport can provide a scientific basis for the government to formulate relevant policies and promote the development of the industry in the direction of being more environmentally friendly and efficient. At the same time, the research results can also provide decision support for road freight companies to make the right strategic choices.
By using the three-stage DEA model and the Malmquist index, this study offers a comprehensive evaluation and analysis of the total factor productivity of the urban road freight industry, exploring it from both static and dynamic perspectives. A synergy measurement index system was established to verify the symbiotic relationship between low-carbon freight transport and efficient freight transport development and to clarify the influence of industrial structure and energy consumption on the degree of synergy. In the research process, a three-stage DEA model was used to both ensure the calculation of static economic efficiency and effectively reduce the influence of environmental variables and random noise on the efficiency measurement. In terms of synergy assessment, the proposed method first determines the contribution of the state variables of each subsystem to orderliness and then assesses the degree of synergy within the system during its development and evolution. This method is more concise and intuitively understandable than the traditional method of directly calculating the synergy of composite systems.
This study reveals the lack of synergy between high-efficiency and low-carbon development in Wuhan’s road freight sector and provides insights for policy making on road freight development in Wuhan and other similar regions. To achieve synergy between high-efficiency and low-carbon development, it is necessary to strengthen environmental protection measures and set strict emission standards, develop clean energy technologies to reduce dependence on gasoline, optimize transport routes, improve vehicle utilization, promote energy-saving driving techniques, reduce fuel consumption of freight vehicles, and promote the green transformation of urban road freight industry.
Although this study provides a valuable reference for policy formulation in the road freight industry in Wuhan, it has some limitations. On the one hand, due to data availability, we mainly used evaluation indicators from previous studies, which limited the depth and breadth of the analysis. On the other hand, in the analysis of carbon emission factors, we mainly focused on the directly related factors and may have neglected other influencing factors, resulting in less comprehensive analyses. In the future, we will endeavor to overcome these limitations and explore the efficient and low-carbon development of the road freight industry more comprehensively.
In terms of future research directions, the following aspects in particular can be considered for further exploration:
- A full analysis could be conducted of a wider range of variables and a further exploration of other factors that may influence low-carbon development and freight transport efficiency, including but not limited to technological progress, policy orientation, market structure, level of transport infrastructure, mode of transport organization, etc., to gain a comprehensive understanding of the dynamics of and trends in urban road freight transport.
- Sensitivity analyses could be performed to verify the robustness of this study’s results. By comparing the results of the analyses in different scenarios, the most influential factors for the synergistic development of urban road freight transport in terms of high efficiency and low carbon can be identified to provide more precise suggestions for policy formulation.
- The scope of this study can be expanded to include more cities and regions, and comparative analyses can be conducted to obtain more generalizable conclusions.
- Innovative data collection methods can be explored to obtain more direct and accurate data on road freight transport, which will contribute to a deeper understanding of the real situation of the road freight transport industry and improve the credibility and applicability of this study.
In-depth research in these areas can further deepen the understanding of the road freight transport industry and its impact on economic efficiency, carbon emissions, and urban development, and provide stronger support for future policy formulation and practice.
Author Contributions
Conceptualization, Y.Z. and J.L.; methodology, J.L. and B.L.; software, J.L. and C.D.; validation, Y.Z., Y.C. and Z.Z.; formal analysis, J.L. and B.L.; investigation, C.W.; resources, Y.Z. and Y.C.; data curation, B.L.; writing—original draft preparation, J.L. and Y.Z.; writing—review and editing, Y.Z.; visualization, C.D. and Z.Z.; supervision, Y.Z. and Y.C.; project administration, Y.Z. All authors have read and agreed to the published version of the manuscript.
Funding
This research received no external funding.
Institutional Review Board Statement
Not applicable.
Informed Consent Statement
Not applicable.
Data Availability Statement
The data used in this study are publicly available, and the data sources are described in the paper.
Conflicts of Interest
The authors declare no conflicts of interest.
References
- Alarcón, F.E.; Cawley, A.M.; Sauma, E. Electric mobility toward sustainable cities and road-freight logistics: A systematic review and future research directions. J. Clean. Prod. 2023, 430, 138959. [Google Scholar] [CrossRef]
- Soti, V.; Pratap, S.; Dwivedi, A. A structural equation modeling framework for studying sustainable freight transportation indicators in emerging economies. Decis. Anal. J. 2023, 9, 100337. [Google Scholar] [CrossRef]
- Jahangir Samet, M.; Liimatainen, H.; van Vliet, O.P.R. GHG emission reduction potential of road freight transport by using battery electric trucks in Finland and Switzerland. Appl. Energy 2023, 347, 121361. [Google Scholar] [CrossRef]
- Strulak-Wójcikiewicz, R.; Wagner, N. Exploring opportunities of using the sharing economy in sustainable urban freight transport. Sustain. Cities Soc. 2021, 68, 102778. [Google Scholar] [CrossRef]
- Zhang, X.; Hao, X.; Liu, Y.; Wu, R.; Shan, X.; Li, S. Contribution of potential clean trucks in carbon peak pathway of road freight based on scenario analysis: A case study of China. J. Clean. Prod. 2022, 379, 134669. [Google Scholar] [CrossRef]
- Wang, M.; Wu, L.; Guo, X. Application of the grey model in influencing factors analysis and trend prediction of carbon emission in Shanxi Province. Environ. Monit. Assess. 2022, 194, 542. [Google Scholar] [CrossRef]
- Zang, J.; Zeng, W.; Wang, J. Regional low-carbon economy efficiency in China: An analysis based on the Super-SBM model with CO2 emissions. J. Clean. Prod. 2017, 10, 202–211. [Google Scholar] [CrossRef]
- Costa, L.; Cruz, C.O.; Sarmento, J.M.; Sousa, V.F. Empirical Analysis of the Effects of Ownership Model (Public vs. Private) on the Efficiency of Urban Rail Firms. Sustainability 2021, 13, 13346. [Google Scholar] [CrossRef]
- Kerstens, K. Technical efficiency measurement and explanation of French urban transit companies. Transp. Res. Part A Policy Pract. 1996, 30, 431–452. [Google Scholar] [CrossRef]
- Banker, R.D.; Charnes, A.; Cooper, W.W. Some Models for Estimating Technical and Scale Inefficiencies in Data Envelopment Analysis. Manag. Sci. 1984, 30, 1078–1092. [Google Scholar]
- Obeng, K.; Assar, N.; Benjamin, J. Total factor productivity in transit systems: 1983-1988. Transp. Res. Part A Policy Pract. 1992, 26, 447–455. [Google Scholar] [CrossRef]
- Dajani, J.S.; Gilbert, G. Measuring the performance of transit systems. Transp. Plan. Technol. 1978, 4, 97–103. [Google Scholar] [CrossRef]
- Fielding, G.J.; Glauthier, R.E.; Lave, C.A. Performance indicators for transit management. Transportation 1978, 7, 365–379. [Google Scholar] [CrossRef]
- Yu, M.M.; Lin, E.T.J. Efficiency and effectiveness in railway performance using a multi-activity network DEA model. Omega 2008, 36, 1005–1017. [Google Scholar] [CrossRef]
- de Oliveira, L.K.; França, J.G.D.C.; Nascimento, C.D.O.L.; de Oliveira, I.K.; Meira, L.H.; Rabay, L. Evaluating problems and measures for a sustainable urban freight transport in Brazilian historical cities. Sustain. Cities Soc. 2021, 69, 102806. [Google Scholar] [CrossRef]
- Battese, G.E.; Coelli, T.J. A model for technical inefficiency effects in a stochastic frontier production function for panel data. Empir. Econ. 1995, 20, 325–332. [Google Scholar] [CrossRef]
- Stevens, P. Accounting for Background Variables in Stochastic Frontier Analysis; National Institute of Economic and Social Research (NIESR) Discussion Papers; NIESR: London, UK, 2004. [Google Scholar]
- Tone, K. A slacks-based measure of efficiency in data envelopment analysis. Eur. J. Oper. Res. 2001, 130, 498–509. [Google Scholar] [CrossRef]
- Caves, D.W.; Christensen, L.R.; Diewert, W. The Economic Theory of Index Numbers and the Measurement of Input, Output, and Productivity. Econometrica 1982, 50, 1393–1414. [Google Scholar] [CrossRef]
- Løvold Rødseth, K. Productivity growth in urban freight transport: An index number approach. Transp. Policy 2017, 56, 86–95. [Google Scholar] [CrossRef]
- Patier, D.; Browne, M. A methodology for the evaluation of urban logistics innovations. Procedia—Soc. Behav. Sci. 2010, 2, 6229–6241. [Google Scholar] [CrossRef]
- Iwan, S.; Małecki, K. Utilization of cellular automata for analysis of the efficiency of urban freight transport measures based on loading/unloading bays example. Transp. Res. Procedia 2017, 25, 1021–1035. [Google Scholar] [CrossRef]
- Kant, P.; Gupta, S. An Agent-Based Approach to Evaluate Freight Consolidation Center Strategy for Last Mile Deliveries in Jaipur City, India. In Smart and Sustainable Supply Chain and Logistics—Challenges, Methods and Best Practices; Springer: Berlin/Heidelberg, Germany, 2023; pp. 13–27. [Google Scholar]
- Yin, C.; Ke, Y.; Chen, J.; Liu, M. Interrelations between sea hub ports and inland hinterlands: Perspectives of multimodal freight transport organization and low carbon emissions. Ocean Coast. Manag. 2021, 214, 105919. [Google Scholar] [CrossRef]
- Cullinane, K.; Song, D.; Wang, T. The Application of Mathematical Programming Approaches to Estimating Container Port Production Efficiency. J. Product. Anal. 2005, 24, 73–92. [Google Scholar] [CrossRef]
- Mckinnon, A.C. Decoupling of Road Freight Transport and Economic Growth Trends in the UK: An Exploratory Analysis. Transp. Rev. 2007, 27, 37–64. [Google Scholar] [CrossRef]
- Kveiborg, O.; Fosgerau, M. Decomposing the decoupling of Danish road freight traffic growth and economic growth. Transp. Policy 2007, 14, 39–48. [Google Scholar] [CrossRef]
- Bínová, H.; Hykš, O.; Hykšová, M.; Neubergová, K.; Kekula, F.; Sadil, J. Perspective of Clean Mobility in Road Freight Transport. Transp. Res. Procedia 2021, 53, 289–304. [Google Scholar] [CrossRef]
- Ni, L.; Wang, X.C.; Zhang, D. Impacts of information technology and urbanization on less-than-truckload freight flows in China: An analysis considering spatial effects. Transp. Res. Part A. Policy Pract. 2016, 92, 12–25. [Google Scholar] [CrossRef]
- Wiegmans, B.; Champagne-Gelinas, A.; Duchesne, S.; Slack, B.; Witte, P. Rail and road freight transport network efficiency of Canada, member states of the EU, and the USA. Res. Transp. Bus. Manag. 2018, 28, 54–65. [Google Scholar] [CrossRef]
- IEA. Energy Technology Perspectives 2008. In Euroheat & Power 2008; IEA: Paris, France, 2008; Volume 5. [Google Scholar]
- Avotra, A.A.R.N.; Nawaz, A. Asymmetric impact of transportation on carbon emissions influencing SDGs of climate change. Chemosphere 2023, 324, 138301. [Google Scholar] [CrossRef] [PubMed]
- Hickman, R.; Banister, D. Looking over the horizon: Transport and reduced CO2 emissions in the UK by 2030. Transp. Policy 2007, 14, 377–387. [Google Scholar] [CrossRef]
- Schipper, L.; Scholl, L.; Price, L. Energy use and carbon emissions from freight in 10 industrialized countries: An analysis of trends from 1973 to 1992. Transp. Res. Part D Transp. Environ. 1997, 2, 57–76. [Google Scholar] [CrossRef]
- Brand, C.; Tran, M.; Anable, J. The UK transport carbon model: An integrated life cycle approach to explore low carbon futures. Energy Policy 2012, 41, 107–124. [Google Scholar] [CrossRef]
- Wei, R.; Liu, C. Research on carbon emission reduction in road freight transportation sector based on regulation-compliant route optimization model and case study. Sustain. Comput. Inform. Syst. 2020, 28, 100408. [Google Scholar] [CrossRef]
- Dehdari, P.; Wlcek, H.; Furmans, K. An updated literature review of CO2e calculation in road freight transportation. Multimodal Transp. 2023, 2, 100068. [Google Scholar] [CrossRef]
- Wu, C.; Xiao, L.; Hu, Z.; Zhou, Y. Modeling the low-carbon behaviors’ development paths of freight enterprises based on a survey in Zhejiang, China. Sustain. Cities Soc. 2022, 82, 103894. [Google Scholar] [CrossRef]
- Muñoz-Villamizar, A.; Santos, J.; Montoya-Torres, J.R.; Velázquez-Martínez, J.C. Measuring environmental performance of urban freight transport systems: A case study. Sustain. Cities Soc. 2020, 52, 101844. [Google Scholar] [CrossRef]
- Zuo, D.; Liang, Q.; Zhan, S.; Huang, W.; Yang, S.; Wang, M. Using energy consumption constraints to control the freight transportation structure in China (2021–2030). Energy 2023, 262, 125512. [Google Scholar] [CrossRef]
- Li, J.; Shi, J.; Duan, K.; Li, H.; Zhang, Y.; Xu, Q. Efficiency of China’s urban development under carbon emission constraints: A city-level analysis. Phys. Chem. Earth Parts A/B/C 2022, 127, 103182. [Google Scholar] [CrossRef]
- Zhao, Y.; Su, Q.; Li, B.; Zhang, Y.; Wang, X.; Zhao, H.; Guo, S. Have those countries declaring “zero carbon” or “carbon neutral” climate goals achieved carbon emissions-economic growth decoupling? J. Clean. Prod. 2022, 363, 132450. [Google Scholar] [CrossRef]
- Papież, M.; Śmiech, S.; Frodyma, K. Does the European Union energy policy support progress in decoupling economic growth from emissions? Energy Policy 2022, 170, 113247. [Google Scholar] [CrossRef]
- Andreoni, V.; Galmarini, S. Decoupling economic growth from carbon dioxide emissions: A decomposition analysis of Italian energy consumption. Energy 2012, 44, 682–691. [Google Scholar] [CrossRef]
- Tapio, P. Towards a theory of decoupling: Degrees of decoupling in the EU and the case of road traffic in Finland between 1970 and 2001. Transp. Policy 2005, 12, 137–151. [Google Scholar] [CrossRef]
- Wang, Z.; He, W. CO2 emissions efficiency and marginal abatement costs of the regional transportation sectors in China. Transp. Res. Part D Transp. Environ. 2017, 50, 83–97. [Google Scholar] [CrossRef]
- Rusiawan, W.; Tjiptoherijanto, P.; Suganda, E.; Darmajanti, L. Assessment of Green Total Factor Productivity Impact on Sustainable Indonesia Productivity Growth. Procedia Environ. Sci. 2015, 28, 493–501. [Google Scholar] [CrossRef]
- Liu, Y.; Song, Y.; Song, X. An empirical study on the relationship between urban compactness and CO2 efficiency in China. Habitat Int. 2014, 41, 92–98. [Google Scholar] [CrossRef]
- Wiśnicki, B.; Chybowski, L.; Czarnecki, M. Analysis of the efficiency of port container terminals with the use of the data envelopment analysis method of relative productivity evaluation. Manag. Syst. Prod. Eng. 2017, 25, 9–15. [Google Scholar] [CrossRef]
- Pham, T.Q.M.; Park, G.K.; Choi, K. The efficiency analysis of world top container ports using two-stage uncertainty DEA model and FCM. Marit. Bus. Rev. 2021, 6, 2–21. [Google Scholar] [CrossRef]
- Lee, P.F.; Lam, W.S.; Lam, W.H. Performance Evaluation of the Efficiency of Logistics Companies with Data Envelopment Analysis Model. Mathematics 2023, 3, 718. [Google Scholar] [CrossRef]
- Fried, H.O.; Lovell, C.A.K.; Schmidt, S.S.; Yaisawarng, S. Accounting for Environmental Effects and Statistical Noise in Data Envelopment Analysis. J. Product. Anal. 2002, 17, 157–174. [Google Scholar] [CrossRef]
- Ding, H.; Liu, Y.; Zhang, Y.; Wang, S.; Guo, Y.; Zhou, S.; Liu, C. Data-driven evaluation and optimization of the sustainable development of the logistics industry: Case study of the Yangtze River Delta in China. Environ. Sci. Pollut. Res. 2022, 29, 68815–68829. [Google Scholar] [CrossRef] [PubMed]
Disclaimer/Publisher’s Note: The statements, opinions and data contained in all publications are solely those of the individual author(s) and contributor(s) and not of MDPI and/or the editor(s). MDPI and/or the editor(s) disclaim responsibility for any injury to people or property resulting from any ideas, methods, instructions or products referred to in the content. |
© 2024 by the authors. Licensee MDPI, Basel, Switzerland. This article is an open access article distributed under the terms and conditions of the Creative Commons Attribution (CC BY) license (https://creativecommons.org/licenses/by/4.0/).