Article

Impact and Mechanism of Digital Inclusive Finance on the Urban–Rural Income Gap of China from a Spatial Econometric Perspective

1
Business School, Nanjing University, Nanjing 210093, China
2
School of Finance, Nanjing University of Finance and Economics, Nanjing 210023, China
3
China Construction Bank Suzhou Branch Industrial Park Subbranch, Suzhou 215000, China
*
Author to whom correspondence should be addressed.
Sustainability 2024, 16(7), 2641; https://doi.org/10.3390/su16072641
Submission received: 26 January 2024 / Revised: 12 March 2024 / Accepted: 13 March 2024 / Published: 23 March 2024
(This article belongs to the Section Economic and Business Aspects of Sustainability)

Abstract

:
With the rapid development of digital inclusive finance, whether it can lower the income inequality between urban and rural areas has been the focus of policy makers and researchers. Based on China’s 2011–2018 provincial panel data, this paper employs spatial econometric models and mediating-effect models to examine the impact of digital inclusive finance on the urban–rural income gap and its mechanism. The main findings are as follows: First, globally, the urban–rural income gap and digital inclusive finance each exhibit significant positive spatial correlation; locally, the income gap primarily exhibits spatial dependence in Central and Western China. Meanwhile, digital inclusive finance transitions from varied agglomeration patterns to exclusively H-H patterns in Eastern China. Second, digital inclusive finance notably reduces the urban–rural income gap, primarily attributed to its expanded breadth of coverage and digitization. Third, mechanism analysis indicates that digital inclusive finance can narrow the urban–rural income gap by increasing labor employment, resulting in higher farmer incomes, rather than through individual entrepreneurship and human capital investment. The findings of this study are crucial for improving digital inclusive financial development and adjusting urban–rural income distribution.

1. Introduction

Narrowing the income gap between urban and rural areas is a global challenge with profound implications for individuals’ livelihoods and overall societal development. Since the turn of the century, China has implemented a series of policy reforms aimed at improving income distribution. The Opinions of the Central Committee of the Communist Party of China and the State Council on Establishing and Improving the Urban–Rural Integration Development Institutional Mechanism and Policy System in 2019 emphasized the importance of rationalizing the allocation of public resources to facilitate equal exchange and unrestricted flow between urban and rural areas, thereby bridging the gaps in living standards and development between urban and rural areas. The policy initiatives have yielded notable achievements over the years. For instance, according to the National Bureau of Statistics of China, in 2020, the per capita disposable income of rural residents of China rose to CNY 17,131, nearly the national average or 39% of urban residents’ income. Moreover, the urban–rural income ratio decreased from 3.33 in 2009 to 2.56. Although the urban–rural income gap in China has shown signs of narrowing since 2009, as evidenced by a declining Gini coefficient, it still surpasses the internationally recognized warning line of 0.4, and the trend has seen fluctuations since 2005. Most notably, although the absolute income levels of China’s urban and rural residents have increased significantly, the structural issue of income distribution imbalance still remains.
In recent years, due to the rise of the mobile internet and the widespread use of smartphones, alongside the adoption of new digital technologies like artificial intelligence, big data, and cloud computing in China’s financial sector, digital inclusive finance has emerged and grown rapidly. According to the Chinese Academy of Social Sciences’s Blue Book of Digital Economy: Analysis and Forecast of China’s Digital Economic Situation, in 2020, China’s digital economy contributed over CNY 19 trillion, accounting for about 18.8% of the total GDP. It is expected that by 2025, during the “14th Five-Year Plan” period, the average annual growth rate of China’s digital economy will reach 11.3%. The emergence of digital inclusive finance has challenged or even overturned the traditional financial service system, especially in rural areas where coverage was limited. As digital technology advances beyond geographical constraints and the digital economy expands, it exhibits distinct geographic distribution characteristics now.
Therefore, further research is needed to explore the spatial correlation between digital inclusive finance and urban–rural income gap. Understanding its impact mechanism is vital if digital inclusive finance influences the gap. These inquiries carry theoretical significance for advancing inclusive finance and digital inclusive finance in developing nations. Additionally, they are of practical significance in improving the rural financial service and narrowing the urban–rural income gap. The rest of the paper is structured as follows: Part two is a literature review. Part three presents the research hypothesis. Part four introduces empirical methods and descriptive statistics. Part five presents empirical results and discussion, and the last part offers corresponding policy suggestions.

2. Literature Review

Early financial development theories, such as financial structure theory, financial deepening theory, and financial repression theory, primarily focused on how financial development promotes economic growth (McKinnon, 1973; King and Levine, 1993) [1,2]. These theories also explored the impact of financial development on income distribution, which is a crucial aspect of its effect on economic growth. Subsequently, Greenwood and Jovanovic (1990) [3] expanded on Kuznets’ research to investigate the factors influencing financial development and its relationship with income inequality. National-level studies, such as those by Clarke et al. (2006) [4], have shown that financial development not only benefits the wealthy but also stimulates economic growth while reducing the income gap across society in the long run. Jeanneney and Kpodar (2011) [5] analyzed panel data from several developing countries from 1966 to 2000 and found that financial development has facilitated widespread access to financial services among residents, particularly benefiting the poor through enhanced convenience in transactions, savings, and loans. Similar conclusions have been drawn from provincial-level research. However, Seven and Coskun (2016) [6] have argued that despite advancements in the size and liquidity of financial systems, the poor have not benefited due to inadequate access to financial services. Factors contributing to this include limited access to credit markets, institutional barriers, concentrated political or economic power within higher-income groups, government policies, and insufficient collateral use. Additionally, some studies have suggested that financial development may widen the urban–rural income gap or have a non-linear impact. For instance, Park and Shin (2017) [7] found that while financial development initially reduces inequality, further progress can exacerbate it.
Inclusive finance, aimed at providing financial services to the poor, has attracted considerable scholarly attention due to its potential for poverty reduction. Fowowe (2020) [8] found that the poor prefer savings to credit due to the flexibility and resilience they provide as a buffer against economic shocks. Saving also enables investment without interest payments, allowing farmers to innovate more freely. Furthermore, financial inclusion, especially through agricultural risk insurance, can help individuals escape poverty traps and increase resilience in adverse conditions. Park and Shin (2017) [7] concluded that financial development plays a role in reducing inequality by enabling the poor to invest in education and human capital investments. Furthermore, Peng et al. (2022) [9] suggested that the expansion of inclusive finance may have spatial effects on poverty reduction, showing spatial heterogeneity in non-adjacent areas and spatial dependence in adjacent regions.
Further, scholars have emphasized the role of inclusive finance in narrowing the urban–rural income gap. For instance, Chakravarty and Pal (2013) [10] used Indian data to confirm that the development of inclusive finance had significantly reduced the income gap. Similarly, Ran et al. (2020) [11] demonstrated the same conclusion using China’s provincial data through spatial regression models. They further showed that financial deepening in neighboring regions has a positive spillover effect on reducing local income disparity. One contributing factor is that financial deepening allocates limited financial resources to sectors with higher economic returns, thus enhancing overall society productivity and creating more employment opportunities.
With the development of the digital economy, significant attention has been given to the impact of digital inclusive finance on the urban–rural income gap. Schmied and Marr (2017) [12] suggested that inclusive finance significantly aids in poverty alleviation while digital finance overcomes geographical constraints, enhancing financial accessibility in impoverished areas. At the micro level, digital finance fosters enterprise innovation (Beck et al., 2018) [13], households’ consumption (Li et al., 2020) [14], and rural income growth (Lian et al., 2023) [15]. However, scholars note that digital inclusive finance does not exhibit a purely linear relationship with rural poverty alleviation. Regional heterogeneity plays a role. Liu et al. (2023) [16] found that digital financial inclusion had a more pronounced effect on reducing the urban–rural income gap in Western China compared to the East. Group heterogeneity is also a factor; for instance, digital financial inclusion is positively associated with household income, with a greater impact in rural areas than in urban areas (Zhang et al., 2020) [17].
From the above analysis, scholars have extensively explored the relationship between traditional financial development, inclusive finance, digital inclusive finance, and urban–rural income distribution, laying a solid foundation for future research. Building on these advancements, this paper aims to achieve the following objectives: First, it investigates the impact of digital inclusive finance and its sub-dimensions on the urban–rural income gap from a spatial perspective. Previous studies mainly used time series or panel regression models, potentially overlooking the interplay of economic attributes across different regions. Exploration of the spatial effect of digital financial inclusion on the urban–rural income gap has already begun (Li et al., 2023) [18]. If spatial characteristics of variables are ignored, conclusions from regression models may be biased. Second, it delves further into mechanisms through which digital inclusive finance affects the urban–rural income gap. Despite previous research highlighting the positive role of digital inclusive finance in narrowing the urban–rural income gap, empirical explanations remain insufficient.

3. Theoretical Analysis and Research Hypothesis

3.1. Spatial Effect of Digital Inclusive Finance on Urban–Rural Income Gap

Krugman (1991) [19] integrated spatial theory into mainstream economics, pioneering the field of spatial economics. Spatial economics explores the relationship between regional economics and financial development and spatial agglomeration. According to this theory, increased capital externalities, labor migration, and technological progress resulting from regional integration can trigger larger-scale spatial agglomerations.
Compared to traditional inclusive finance, digital inclusive finance transcends geographic limitations, offering innovative and informational effects. Through online payment platforms, financial services are streamlined, reducing time costs associated with traditional models and alleviating market frictions (Ji et al., 2021) [20]. Moreover, the widespread reach of the internet enables digital inclusive finance to have a zero-marginal cost effect, significantly lowering the cost of financial services and extending access to rural and economically underdeveloped areas. As a result, a greater number of high-quality financial services become available to meet the diverse financial needs of households across various regions.
The evolution of digital inclusive finance is shaped by spatial economic factors and geography. Correlations between neighboring regions in terms of economic development and geographic attributes drive the spread of digital inclusive finance, thereby reducing the urban–rural income gap and generating spillover effects. Therefore, Hypothesis 1 is proposed in this paper.
H1. 
Digital inclusive finance in China correlates spatially with the urban–rural income gap, displaying spatial spillover effects.

3.2. Effect of Sub-Dimensions of Digital Inclusive Finance on Narrowing Urban–Rural Income Gap

Scholars generally view digital inclusive finance as a dynamic and multifaceted concept. Beck et al. (2007) [21], for instance, developed an inclusive traditional financial development indicator system focusing on the availability, usage, and service quality of formal credit and savings services in the banking sector. Sarma et al. (2008) [22] built upon this perspective by evaluating inclusive finance development across 45 countries, considering factors like the availability, utilization, and geographic penetration of banking services. Zhang et al. (2022) [23] developed an evaluation index system for China’s financial inclusion, encompassing dimensions such as the availability, utilization, depth, and the sustainability of financial services. However, the traditional indicators often overlook the integration of financial inclusion with digital technology.
In response, the Digital Finance Research Center of Peking University devised a digital inclusive finance index based on Ant Group’s big data, comprising three primary indicators: breadth of coverage, depth of usage, and digitization. Breadth of coverage gauges the popularity of digital inclusive finance, measured using metrics like internet account numbers, card linkage rates, and bank card affiliations. Usage depth reflects residents’ actual engagement with digital financial services, indicating the quality of service provision and its accessibility to rural households. Digitization assesses the mobile, cost-effective, creditworthy, and user-friendly aspects of digital finance, considering factors such as mobility payment volumes, loan interest rates for small businesses and individuals, and credit payment frequencies. Building upon these dimensions, we propose Hypothesis 2:
H2. 
The breadth of coverage, depth of usage, and digitization of digital inclusive finance contribute to reducing the urban–rural income gap by enhancing financial availability.

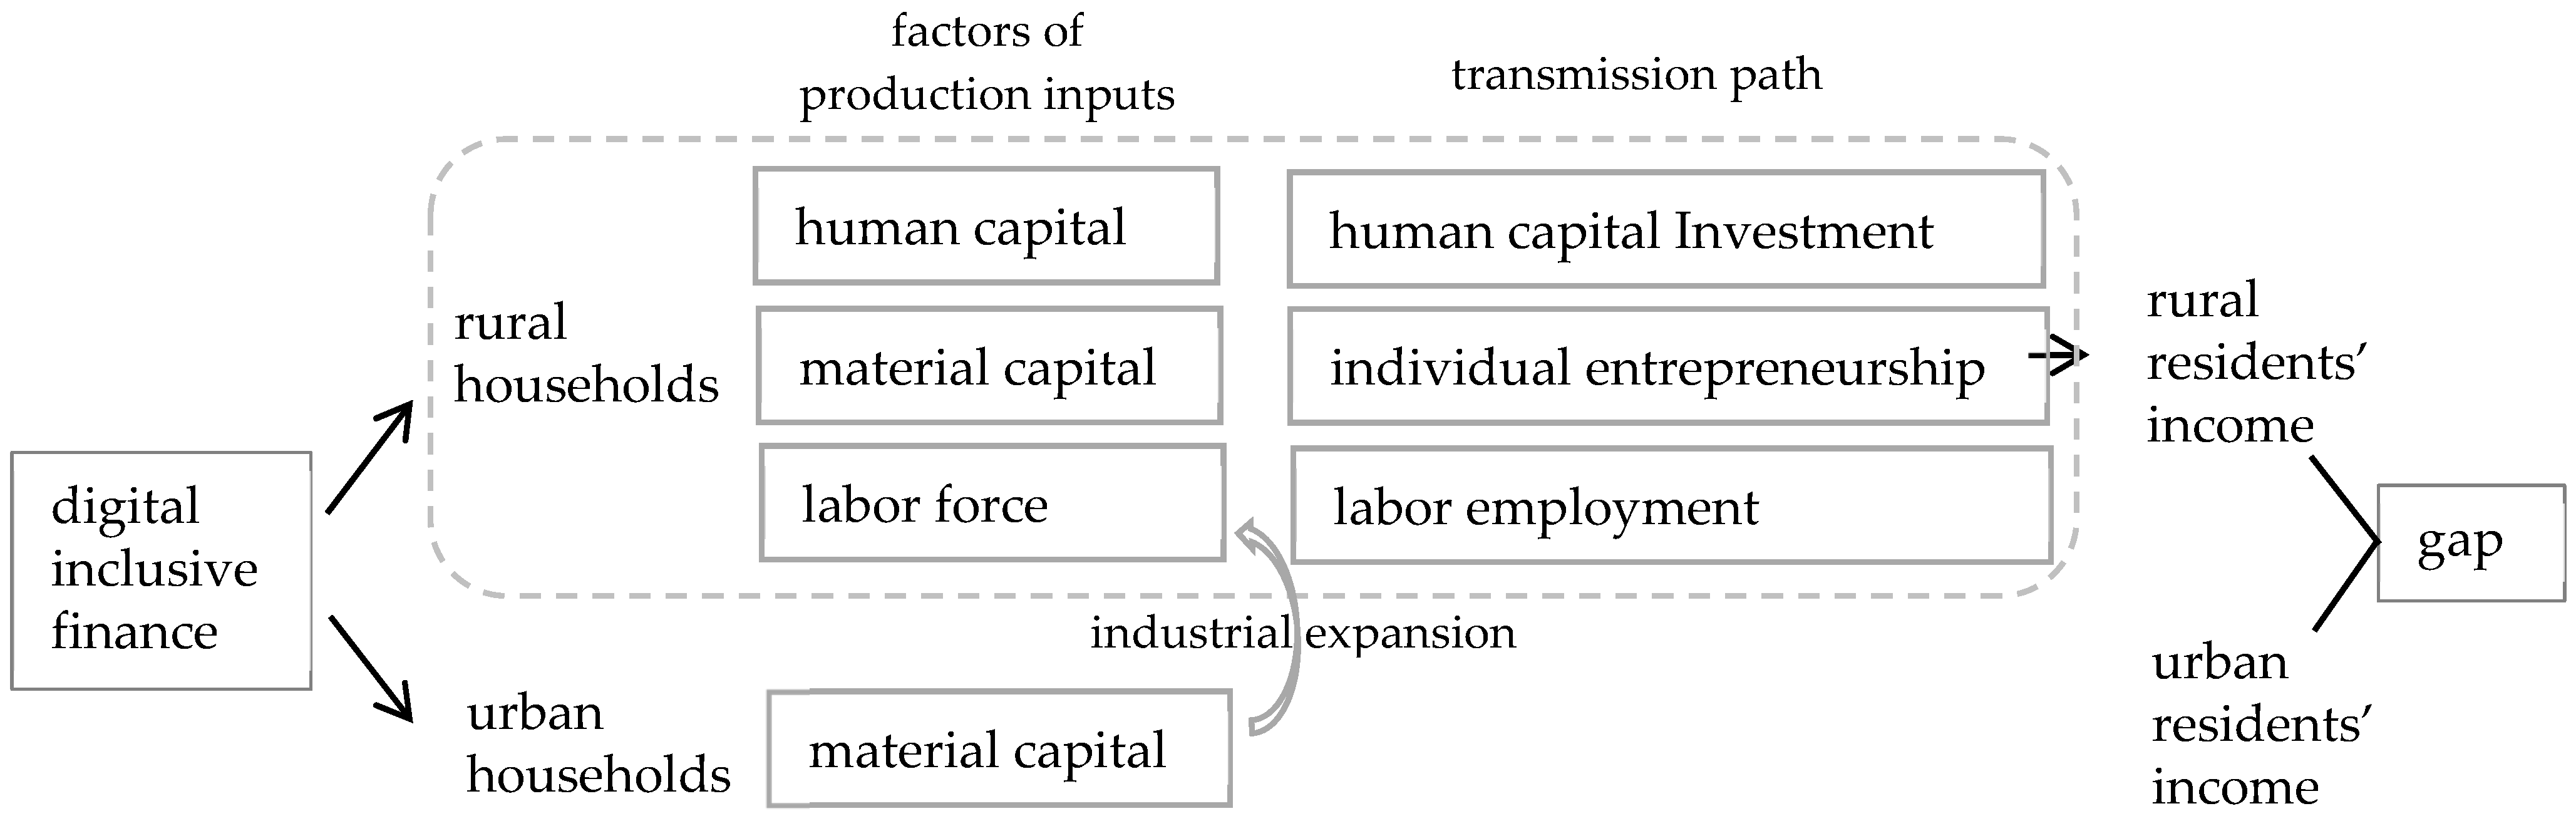
3.3. Transmission Mechanism of Digital Inclusive Finance Affecting the Urban–Rural Income Gap

From the existing literature, it is evident that inclusive finance significantly aids in poverty reduction, offering a potential pathway to narrow the urban–rural income gap. To achieve this, boosting the income of low-income rural households is paramount. Two scenarios emerge: firstly, with a direct impact on low-income farmers; secondly, with the indirect enhancement of farmers’ income levels through high-income rural groups. Consequently, our paper aims to further explore how digital inclusive finance impacts micro-level factors of production input, including human capital, material capital, and labor force (refer to Figure 1).
Firstly, improved access to financial resources like credit funds and insurance reduces the likelihood of dropout among low-income groups due to poverty or illness, thereby enhancing both their own and future generations’ investment in human capital. This, in turn, fosters individual income growth. Additionally, studies such as that conducted by Allen et al. (2016) [24] suggest a positive correlation between higher education and financial inclusion, implying that illiterate individuals may not proportionately reap benefits from financial inclusion.
Secondly, the development of digital inclusive finance facilitates financial support for entrepreneurial farmers by streamlining access to credit, thereby enhancing the feasibility of their ventures and augmenting farmers’ operating incomes. Regarding heterogeneity, findings from Zhang et al. (2020) [17] indicate that digital inclusive finance has the most significant impact on rural residents with low social and material capital, aiding them in starting their own businesses.
Thirdly, digital inclusive finance alleviates financing constraints for urban enterprises, thereby promoting industrial upgrading and stimulating labor demand. This contributes to an indirect rise in wage incomes for low-income groups like farmers. Liu et al. (2021) [25] highlighted the mediating role of industrial upgrading and indirect finance in digital financial inclusion, particularly significant in urban areas. According to Lewis’ theory, the implementation of a system wage increases economic surplus available for job creation, leading to improved job opportunities for labor transfer. Li (2019) [26] calculated that 46.13 million surplus agricultural workers became migrant workers from 2011 to 2018, with their annual wage income rising from CNY 20,000 to nearly CNY 45,000. Therefore, we propose Hypothesis 3.
H3. 
Digital inclusive finance narrows the urban–rural income gap by enhancing rural households’ human capital investment, fostering individual entrepreneurship, and promoting labor employment.

4. Empirical Methods and Data Description

4.1. Spatial Econometric Model Selection

By default, conventional measurement models assume that samples are geographically independent. However, in reality, digital inclusive finance and urban–rural income gap exhibit spatial interdependence across different geographical areas, suggesting the presence of spatial dependence. Conventional econometric models may yield biased estimates under such circumstances. Therefore, this paper employs spatial econometric models in empirical analysis. The models not only assess presence of a significant linear relationship between digital inclusive finance and the urban–rural income gap but also exam spatial effects, representing an enhancement over traditional linear regression models.

4.1.1. Global Spatial Autocorrelation Based on Moran’s Index

First, Moran’s I (Index) is used to separately examine the annual spatial distribution characteristics of digital inclusive finance and the urban–rural income gap. This index can examine the global spatial autocorrelation, and is calculated as follows:
I = i = 1 n j i n W i j ( Y i Y ¯ ) ( Y j Y ¯ ) S 2 i = 1 n j i n W i j
Here, S 2 = 1 n i = 1 n ( Y i Y ¯ ) is the sample variance and Wij is the (i, j) element of the spatial weight matrix to measure whether region i is adjacent to the region j. Yi and Yj represent the development level of digital inclusive finance or the urban–rural income gap in regions i and j, respectively. The significance test of Moran’s I generally uses the Z statistic that is characterized by the standard normal distribution.
Second, to avoid the influence of a priori determined weighting scheme on the result, the paper adopts a binary spatial weight matrix Wij, namely a geographic adjacency spatial weight matrix. If two provinces are adjacent, a weight of 1 is assigned, and if two provinces are not adjacent, a weight of 0 is assigned. During empirical analysis, it is necessary to row-standardize the spatial weight matrix, ensuring that the row sums of the spatial weight matrix equal 1. The method for setting Wij is as follows:
W i j = 1 ,   a r e a   i   a n d   a r e a   j   a r e   a d j a c e n t 0 ,   a r e a   i   a n d   a r e a   j   a r e   n o t   a d j a c e n t
Moran’s I is usually between −1 and 1. When the Moran’s I value is greater than 0, it indicates positive spatial correlation within the target area. Conversely, when the Moran’s I value is less than 0, it indicates negative spatial correlation within the target area. A Moran’s I value of 0 signifies spatial independence within the target area, indicating no spatial correlation.

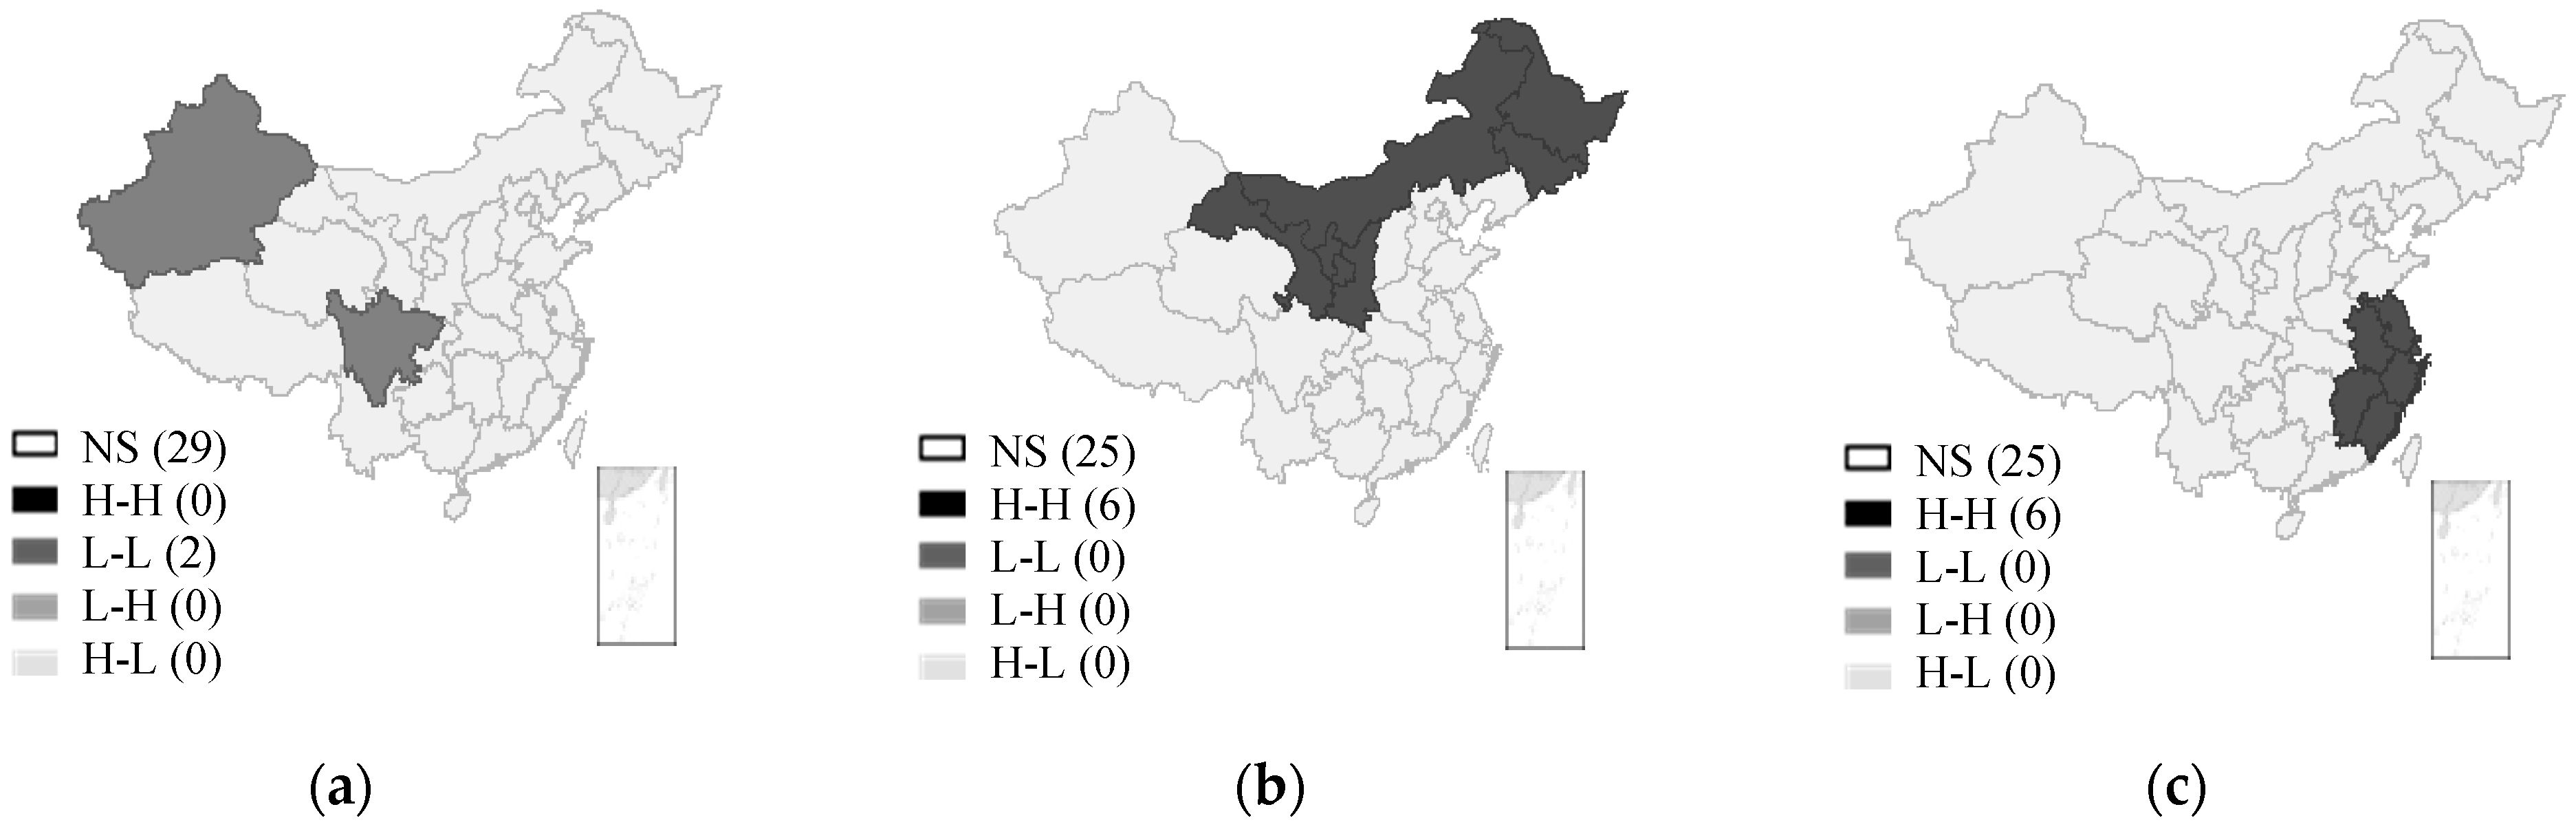
4.1.2. Local Spatial Autocorrelation Based on LISA Indicators

The global Moran’s I can describe global spatial autocorrelation but fails to display local spatial autocorrelation characteristics. In contrast to global spatial autocorrelation analysis, Local Indicators of Spatial Association (LISA) value places greater emphasis on spatial associations at the local level, such as a provincial level as in this paper. For instance, the local Moran’s Index is defined as follows:
I i = Y i Y ¯ S 2 j = 1 n W i j ( Y j Y ¯ )
Then, the LISA agglomeration maps are generated by visually presenting the results of local spatial autocorrelation analysis in geographic space. This method identifies local agglomeration patterns and significant spatial associations, providing detailed insight into geographic heterogeneity.

4.1.3. Spatial Lag Model and Spatial Error Model

Common spatial economic models include spatial lag model (SLM) and spatial error model (SEM), which incorporate spatial effects through spatial lag coefficient and spatial error term, respectively. The SLM model posits that the economic influence of the dependent variable on neighboring regions happens through spatial interactions whereas the SEM model suggests that the primary spatial effect is reflected in the error term of the dependent variable. The two models are defined as follows:
Y i t = β 0 + ρ W Y i t + β 1 X i t + μ i t
μ i t = λ W μ i t + ε i t ,   ε ~ N ( 0 , σ 2 I n )
Here, Yit represents the response variable, which denotes urban–rural income gap in area i in year t; Xit is an explanatory variable; μit is the residual item; εit is a random interference item; W is the spatial weight matrix of order n × n; ρ is the spatial lag coefficient; and λ is the spatial error coefficient. Here, if the spatial coefficient is significantly positive in the dynamic spatial panel model under different weight matrices, it indicates a positive spatial effect under the corresponding weight factors; otherwise, it suggests a negative spatial effect under the corresponding weight factors. When ρ ≠ 0 and λ = 0, the SLM model is specified. When ρ = 0 and λ ≠ 0, the SEM model is specified.
The criteria for selecting between the SLM model or SEM model mainly rely on the log-likelihood value and the goodness of R2. The model with a better fit is then chosen. Additionally, Hausman test is employed to determine whether to use a random-effect model or fixed-effect model.

4.2. Mediating-Effect Model: Transmission Mechanism Test

To test the transmission mechanism of the impact of digital inclusive finance on urban–rural income gap, this paper mainly uses human capital investment, individual entrepreneurship, and labor employment as the mediating variables. The specific model established is as follows:
Y i t = α 0 + α 1 D I F i t + α 2 X i t + μ i t + ε i t
Z i t = δ 0 + δ 1 D I F i t + δ 2 X i t + μ i t + ε i t
Y i t = β 0 + β 1 Z i t + β 2 D I F i t + β 3 X i t + μ i t + ε i t
Here, Zit represents the mediating variables, and following the specification of Wen et al. (2004) [27], α1 reflects the total effect of digital inclusive finance on the urban–rural income gap and β2 reflects the direct effect of digital inclusive finance on the urban–rural income gap. If α1, β1, and β2 are all significant, and β2 is smaller than α1, this suggests that there is a partial mediation effect whereas if α1 and β1 are both significant but β2 is not significant, then there is a complete mediation effect, and if either δ1 or β1 are not significant, then there is no mediation effect.

4.3. Descriptive Statistics of Data

This paper utilizes panel data from China’s 31 provinces (autonomous regions and municipalities directly under the central government) from 2011 to 2018. We chose 2011 as the starting year, coinciding with the initial disclosure of the data source for digital inclusive finance, the “Peking University Digital Inclusive Finance Index”. We chose 2018 as the end year due to the abnormal economic impact caused by the COVID-19 pandemic starting in 2019, which led to changes in the correlations between many economic variables. The data on the development of digital inclusive finance have been sourced from Peking University Digital Inclusive Finance Index while data related to indicators such as urban–rural income gap, industrial structure, urbanization, government intervention, degree of opening, education, and human capital investment have been sourced from the China Statistical Yearbook (2012–2019). Data on traditional financial development come from the provincial Financial Operations Report (2012–2019), and data related to indicators such as labor employment and self-employed status come from the China Statistical Yearbook (2012–2019) and the China Household Survey Yearbook (2012–2019), supplemented by provincial Statistical Yearbook (2012–2019).
Urban–rural income gap: The Theil index is utilized to measure the income gap between urban and rural residents in China. Due to the clear dual economic structure in China’s economic development, the rural population accounts for a relatively large proportion of the total population. The Theil index is capable of incorporating both the absolute income of urban and rural residents as well as changes in the demographic structure, thus providing a comprehensive reflection of both urban and rural populations. Compared to the Gini coefficient, the sensitivity of income changes at both ends of the income gap is higher, and the Theil index offers the distinct advantage of being completely additive and decomposable. Larger Theil index values indicate a larger urban–rural income gap in the region. The formula for calculating the Theil index is expressed as follows:
T h e i l = j = 1 2 ( I i j , t I i , t ) l n ( I i j , t I i , t ) ( P i j , t P i , t )
Here, j = 1 represents town or urban area, j = 2 represents rural area, t represents year, and i represents area. Iij,t represents the disposable income of urban or rural residents in area i in year t, Ii,t represents the disposable income of all residents in area i in year t, Pij,t represents the total population of urban or rural residents in area i in year t, and Pi,t represents the total population in area i in year t.
Digital inclusive finance (DIFI): This paper selects the provincial digital inclusive finance index and its sub-dimensions, namely the breadth of digital inclusive finance (DIFB), depth of digital finance (DIFD), and digitization of digital inclusive finance (DIFDD), to represent the development of digital inclusive finance.
Industrial Structure (IS): Industrial structure is closely related to the labor migration in various regions, which in turn causes the flow of resources and affects the income gap between urban and rural residents. This paper uses the ratio of the added value of the tertiary industry to the regional GDP to measure the industrial structure.
Urbanization (URB): The dualistic economic structure hinders labor mobility while the unequal development levels between urban and rural areas result in a significant concentration of resources in cities. This paper selects the proportion of urban population to total population in a region as a measure of urbanization level.
Government Intervention (GI): As an important tool for social wealth redistribution in the economy, government intervention significantly influences both the initial distribution and redistribution of residents’ income. Government fiscal expenditure can promote the optimal allocation of resources between regions, but inefficient fiscal spending may lead to resource waste, thereby impacting the urban–rural income gap. This paper measures the degree of government intervention using the ratio of government fiscal expenditure to regional GDP.
Degree of Opening (OPE): On one hand, increased openness leads to accelerated factor mobility, resulting in diffusion, competition, industry linkages, and talent migration effects, leading to equalization of factor prices. On the other hand, foreign investment inflows may raise the wage levels of skilled workers. The combined effects of these two processes will impact the income gap between urban and rural residents. This paper measures the degree of opening to the outside world using the ratio of total imports and exports to regional GDP.
Education (EDU): Education is the crucial form of human capital investment for residents, and education level is closely related to residents’ income. Generally, higher levels of education are associated with higher income. This paper measures the education level using the average years of schooling per capita. Considering the education system in China, it is calculated as follows: (population with college education and above × 16 + population with high school and vocational education × 12 + population with junior high school × 9 + population with primary education × 6)/total population aged 6 and above.
Traditional financial development level (FDD and FDB): To conduct a comparative analysis with the sub-dimensions of breadth of coverage and the depth of usage of digital inclusive finance, this paper adopts the ratio of loan balance to the regional GDP to measure the relative level of traditional financial development depth and uses the number of bank branches per ten thousand persons to measure the relative level of traditional financial development breadth.
Human Capital Investment (HCI): More specifically, digital inclusive finance increases the income of vulnerable groups such as impoverished farmers, thereby enhancing the fund liquidity and enabling a broader access to educational opportunities. The number of individuals with higher education is an important manifestation of human capital investment. This paper uses the number of persons with higher education to represent this.
Entrepreneurship (ENT): The development of digital inclusive finance lowers the threshold of financial services, facilitating residents’ access to the financial resources needed for entrepreneurship and promoting residents’ entrepreneurship in terms of stability and sustained demand. This paper represents the level of entrepreneurship using the number of self-employed individuals.
Labor Employment (LE): The reduction in enterprise financing costs brought about by the development of digital inclusive finance promotes the expansion of production, facilitating the creation of more employment opportunities and further absorption of labor-force employment. This paper employs the total employment figures in both private enterprises and non-private urban units to represent it.
The statistical characteristics of each variable are shown in Table 1.

5. Empirical Results and Discussion

5.1. Spatial Autoregression Analysis

Before employing the spatial economic model, we conducted a spatial autocorrelation test. A standardized Z-statistic value was utilized for a significance test to analyze the spatial correlations among urban residents’ per capita disposable income, rural residents’ per capita disposable income, the urban–rural income gap, and the development of digital inclusive finance and its sub-dimension indicators in each of the 31 provinces of China from 2011 to 2018. The test results are shown in Table 2.
Overall, the results in Table 2 indicate that there are spatial correlations among these variables. Firstly, there is a spatial correlation in the provincial-level measurements of urban and rural residents’ incomes, indicating a non-random distribution. Comparing the coefficients, it is evident that the spatial correlation value of the per capita disposable income of urban residents shows a clear decreasing trend while that of rural residents remains generally stable. Conversely, the spatial correlation of the urban–rural income gap displays a trend of fluctuating increase. Secondly, spatial correlations are observed among digital inclusive finance and its sub-dimensions, the coverage breadth of digital inclusive finance, and the usage depth of digital inclusive finance. However, the spatial correlation value of the digitization of digital inclusive finance is not significant for most years. This may be attributed to the lack of significant spatial agglomeration in the improvement of infrastructure and the promotion of digital technology. Additionally, the borrowing cost of digital financial products was still at a high level during this period. For instance, the daily interest rate of Ant Credit Pay consumer loans ranged from 0.035% to 0.045%, significantly higher than the annual lending interest rate set by commercial banks, which is typically based on the one-year Loan Prime Rate (LPR) of 3.85% plus additional points, thus restraining credit demand to some extent.

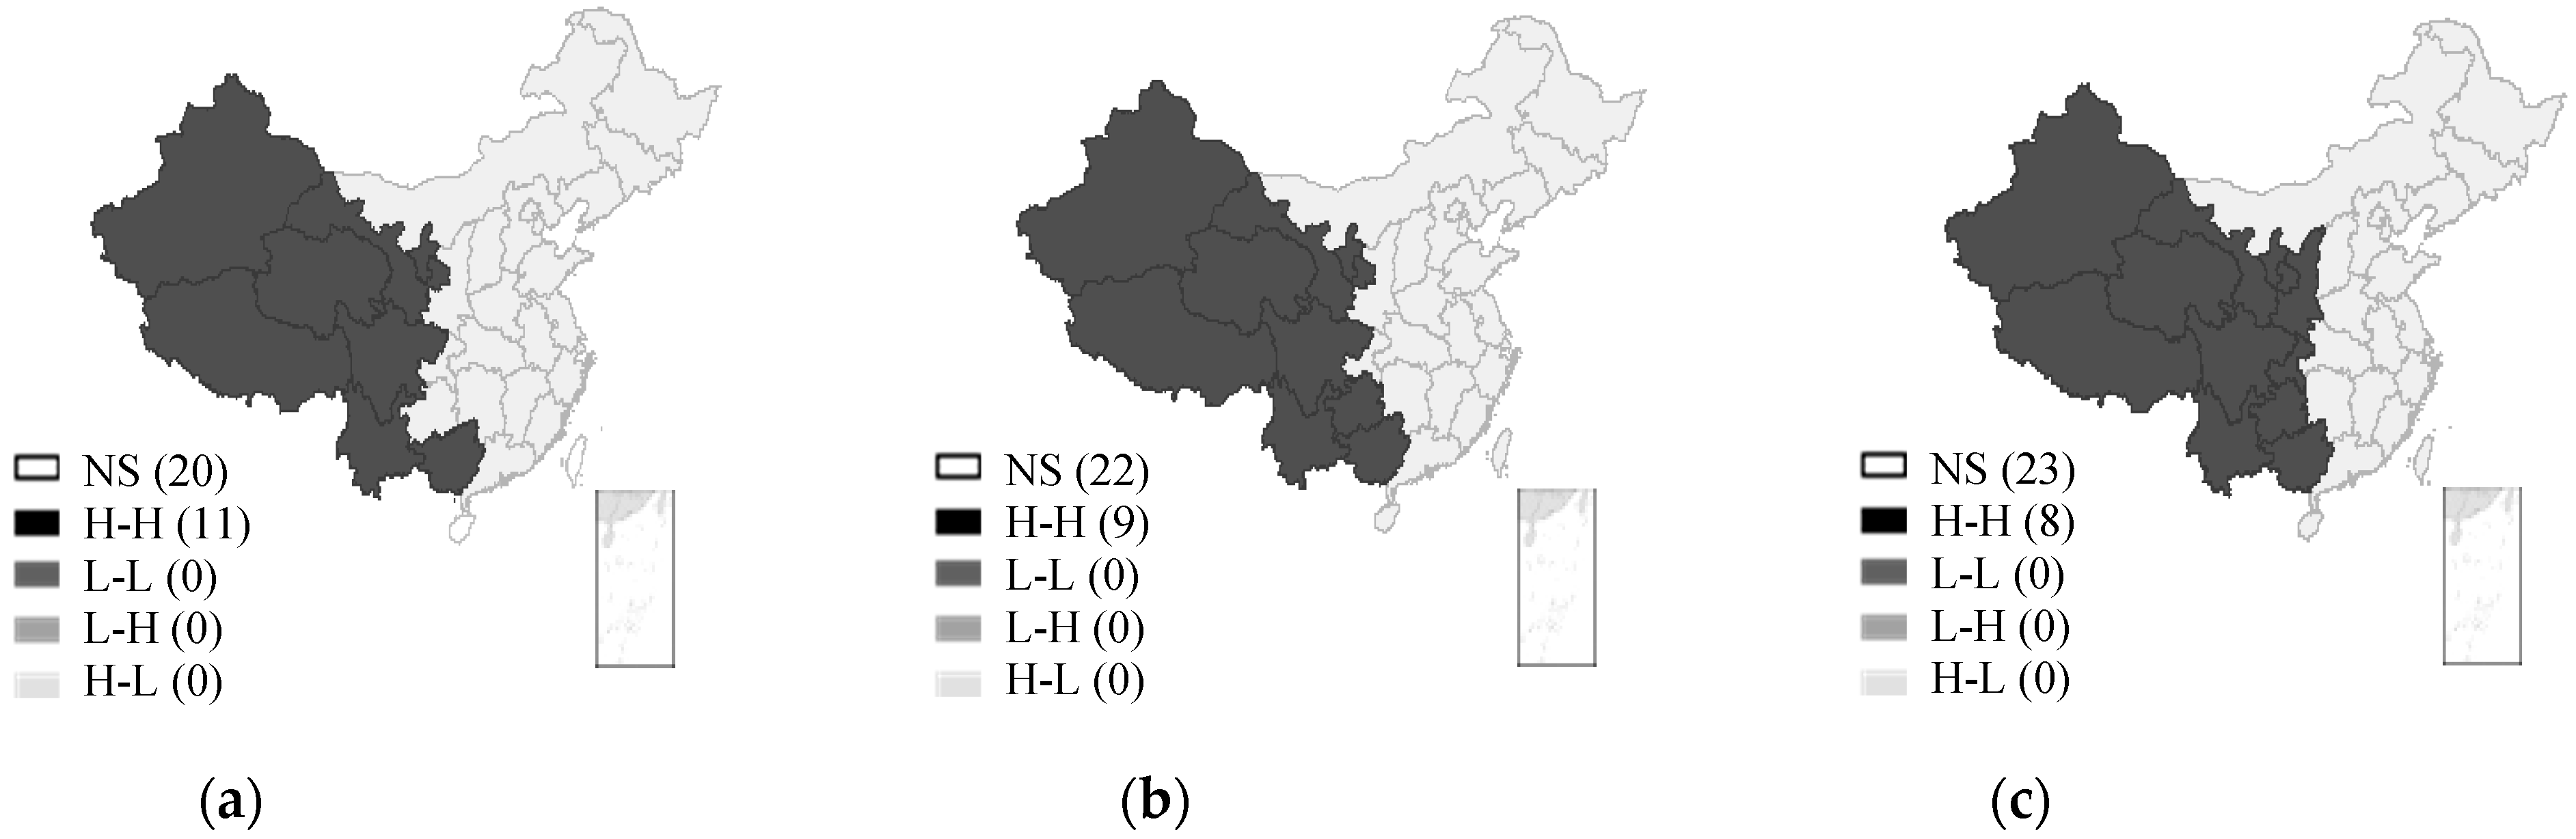
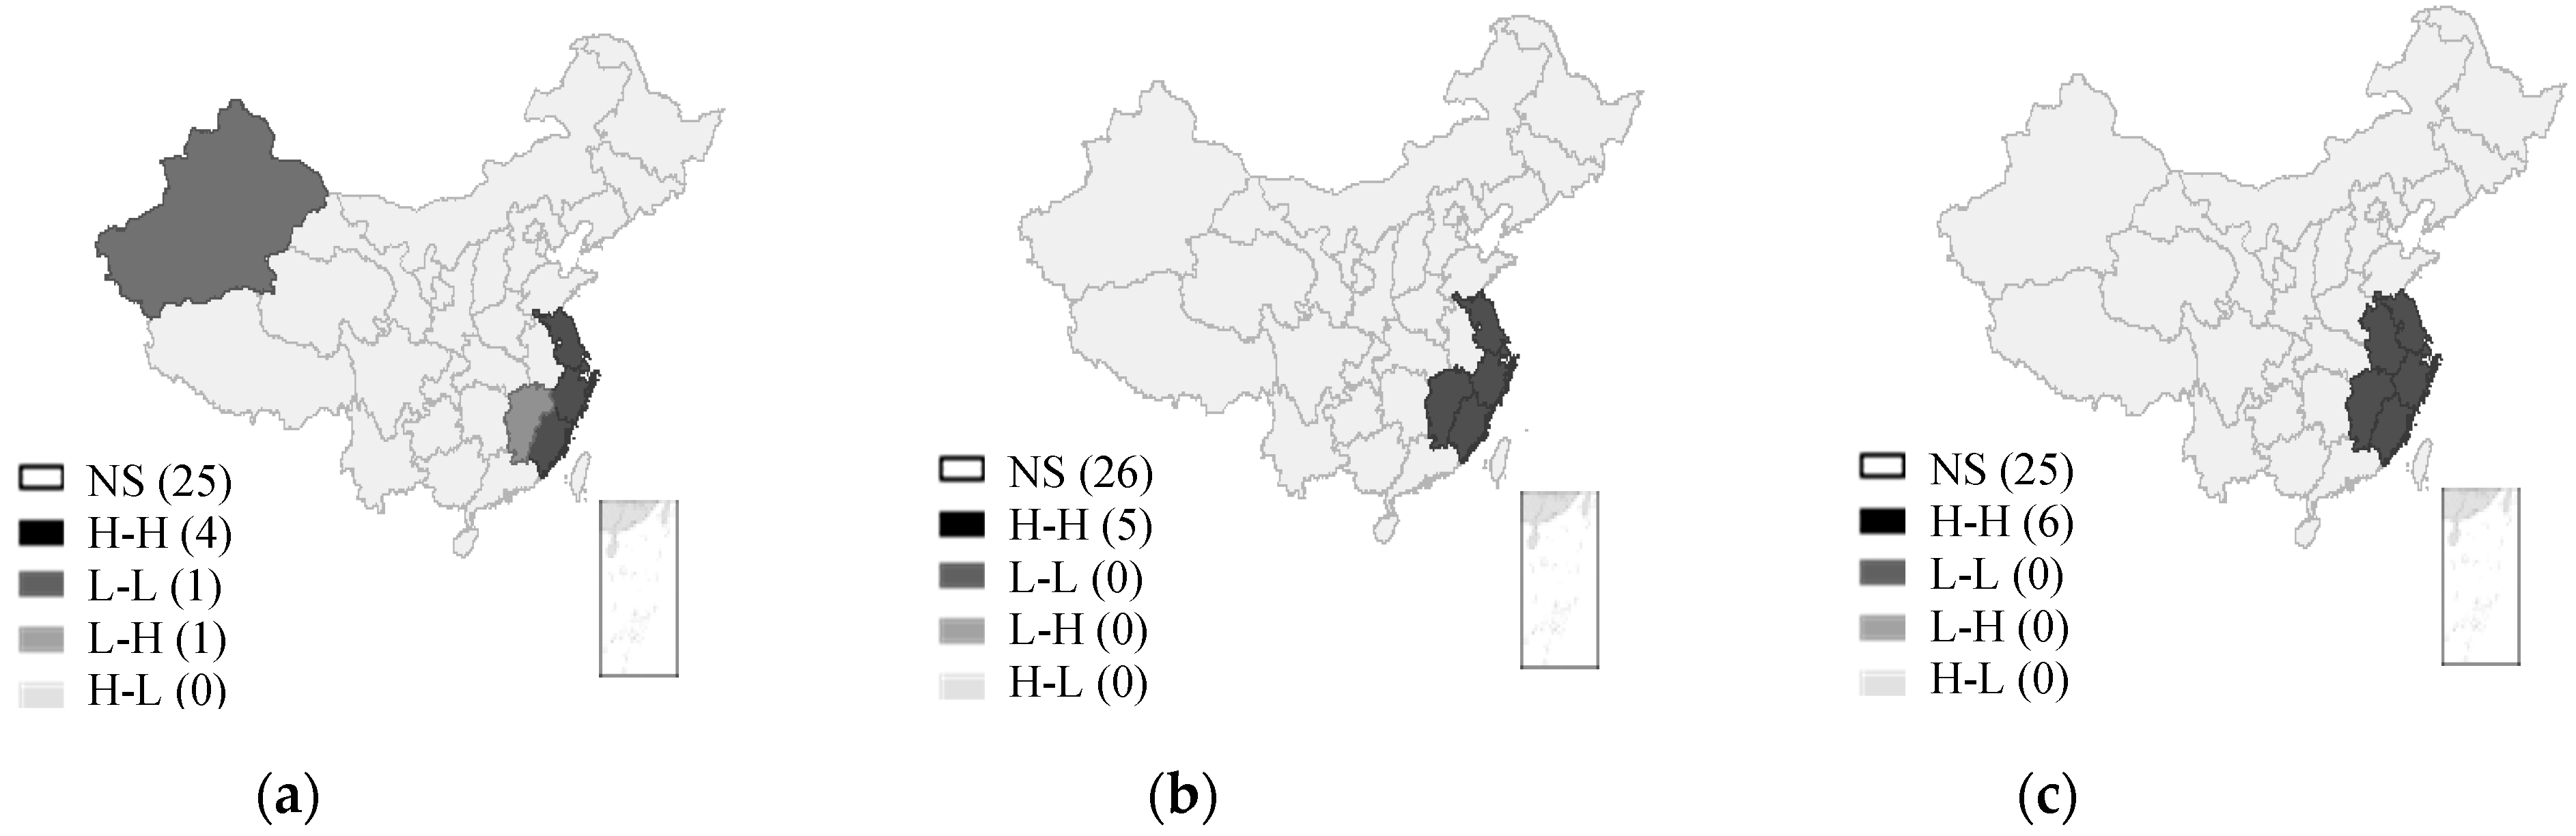
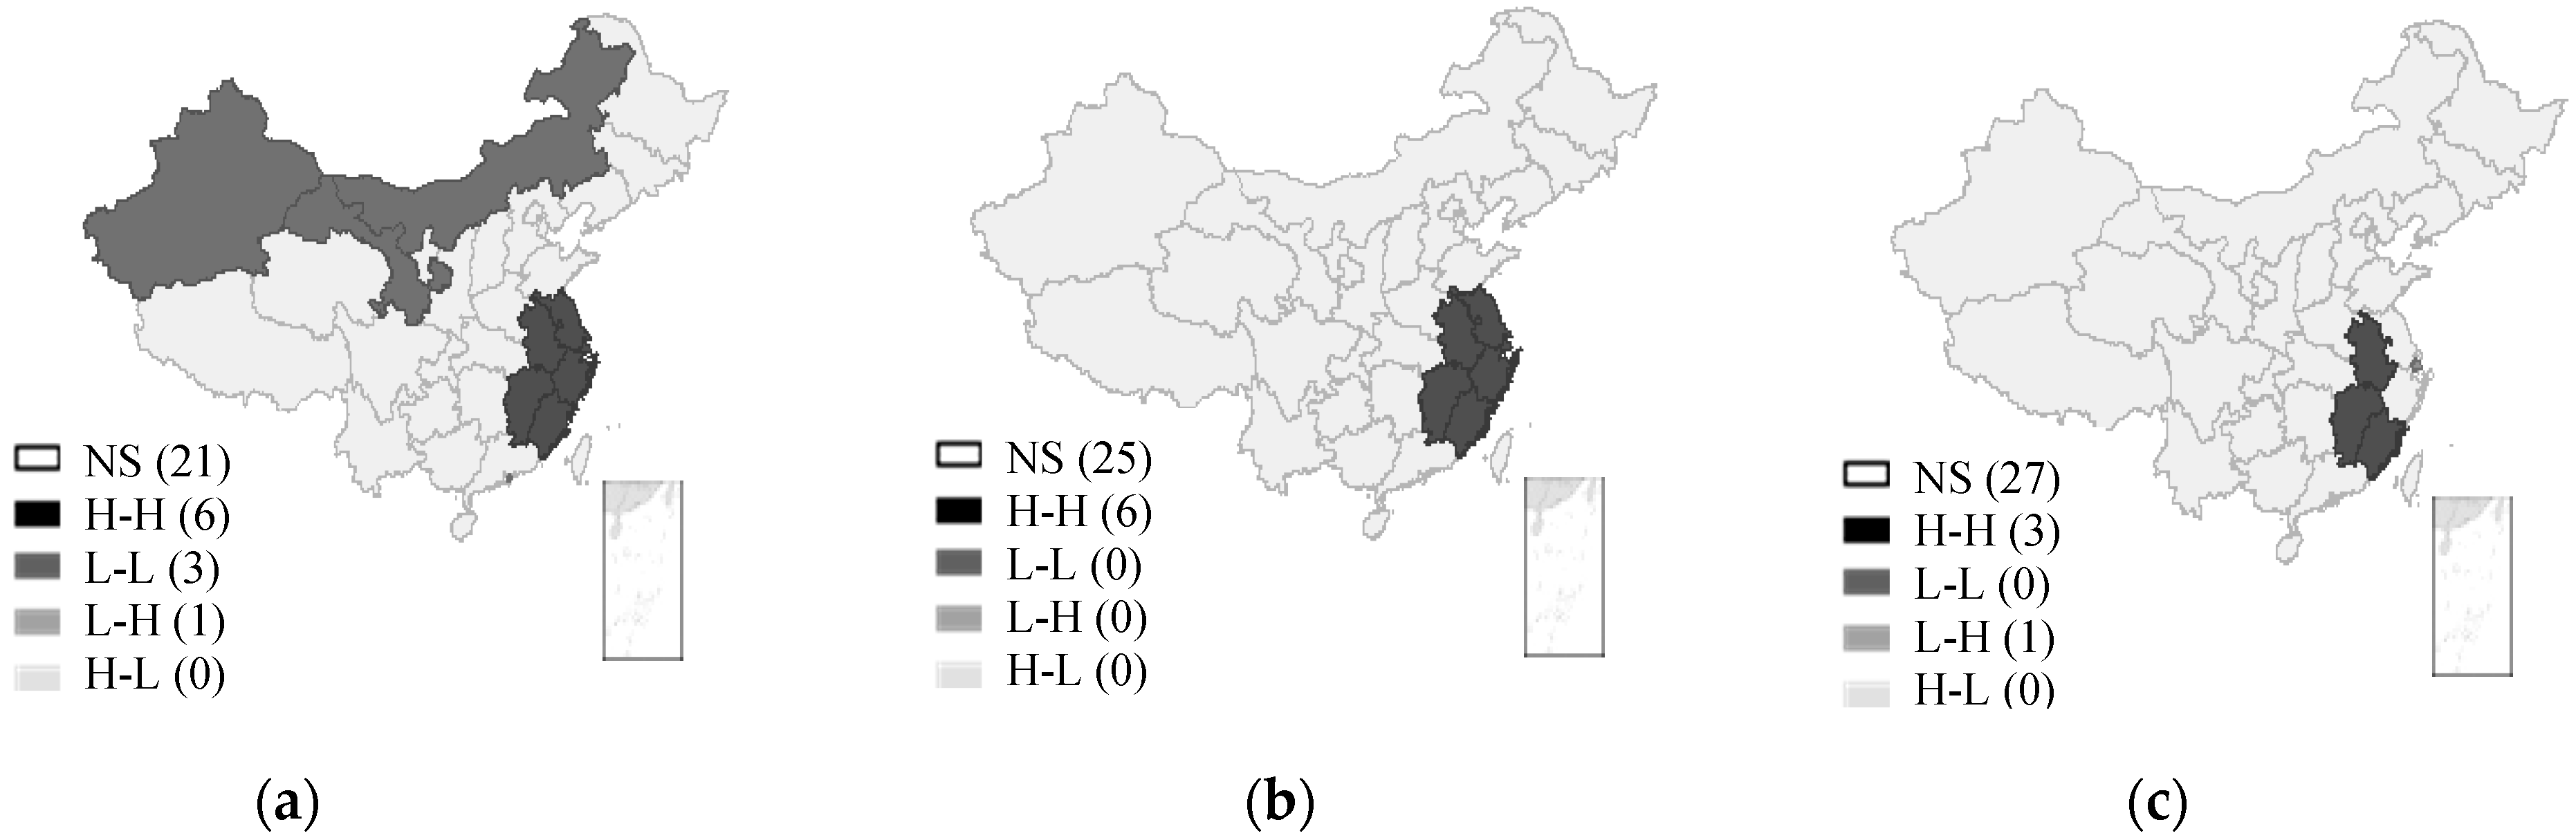
5.2. Spatial Distribution Characteristics of Income Gap and Digital Inclusive Finance

To gain a more intuitive understanding of geographic heterogeneity, LISA agglomeration maps are utilized to illustrate local spatial autocorrelation patterns in geographic space. Given the revolutionary consumer credit product “Ant Credit Pay” launched in 2015, which played a significant role in boosting digital payment rates, this paper reports the results of local spatial autocorrelation tests in 2011, 2015, and 2018. These tests enable us to better observe the changing trends in agglomeration patterns. Refer to Figure 2, Figure 3, Figure 4, Figure 5 and Figure 6 for details. In the figures, NS indicates “no significant”. H-H indicates that the high values are surrounded by other provinces that also have high values; L-H indicates that the low-value provinces are surrounded by other provinces with high values; L-L indicates that the low-value provinces are surrounded by other provinces that are also low-value; H-L indicates that the high-value provinces are surrounded by other provinces with low values.
On one hand, the local spatial autocorrelation value of the urban–rural income gap in most provinces is not significant, but several provinces exhibit a significant H-H pattern, being primarily located in Central and Western China. This H-H pattern gradually weakened over the sample period, with the proportion of samples decreasing from 35% in 2011 to 26% in 2018. This distinct division between the eastern and western regions aligns closely with the Hu Huanyong Line, a diagonal line tilted at 45 degrees from Heihe City in Heilongjiang Province to Tengchong County in Yunnan Province, which serves as a population-density contrast line. This suggests a correlation between population agglomeration and industrial agglomeration.
On the other hand, similar to the urban–rural income gap, the local spatial autocorrelation value of digital inclusive finance development in most provinces is not significant, and significant provincial samples evolved from H-H, L-L, and L-H patterns in 2011 to only an H-H pattern in 2018. Notably, the H-H samples are predominantly located in Eastern China, benefiting from its geographical advantage and abundant financial resources. For example, in the eastern province of Zhejiang, in addition to Ant Financial Services, there has been a surge of technology companies such as Alipay Bank and 51 Credit Card. Furthermore, from the perspective of different dimensions of digital inclusive finance development, the agglomeration patterns of coverage breadth and usage depth of digital inclusive finance are consistent with the overall digital inclusive finance development. However, the digitization level transitioned from an L-L pattern in Western China in 2011 to an H-H pattern in Northern China in 2015, and, further, to an H-H pattern in Eastern China in 2018. This may be attributed to Northern China’s policy incentives for promoting internet payments around 2015, such as Heilongjiang Province’s “Broadband Heilongjiang” strategy, which focuses on advancing broadband network optimization and technological upgrades.

5.3. Regression Results of the Impact of Digital Inclusive Finance on the Urban–Rural Income Gap

Based on the results of the Hausman test (refer to Table 3), this paper employs the fixed-effect spatial panel model. Overall, the estimated coefficients and signs of the OLS, SLM, and SEM models are largely consistent, indicating robustness in the regression results. The spatial lag coefficient ρ in the SLM model is significantly positive at the 1% level, indicating substantial impacts of geographic location and spatial factors on the variable within the adjacency relationship, and the spatial error coefficient λ in the SEM model is positive, indicating a clear spatial dependence of digital inclusive finance on the urban–rural income gap. This aligns with Hypothesis 1. Upon comparing the estimation outcomes, the SLM model demonstrates greater goodness of fit and a better log-likelihood statistic. Consequently, this paper primarily presents the regression results based on the SLM model.
Firstly, digital inclusive finance significantly impacts the urban–rural income gap. China’s enduring urban–rural dual economic structure and continuous outflow of rural financial resources have perpetuated financial exclusion in rural areas. Through digital technology, digital inclusive finance reduces operational costs for financial institutions and improves the accessibility of financial services. This empowers underdeveloped regions and low-income groups, facilitating easier access to financial services, thereby increasing income and narrowing the urban–rural income gap. Combined with the empirical results of sub-dimensions (refer to Table 3), the expansion of coverage and digitization of digital inclusive finance are expected to substantially reduce the income gap, aligning with the comprehensive index of digital inclusive finance. However, the depth of digital inclusive finance’s impact is limited, which is not entirely consistent with Hypothesis 2, possibly because, firstly, rural residents exhibit low levels of engagement with internet financial services. According to the Statistical Report on Internet Development in China, by the end of 2020, China had 989 million internet users, with rural users accounting for only 31.3%. Additionally, according to the China Inclusive Finance Index Analysis Report (2020), the proportion of adults in rural areas purchasing investment and wealth management products stood at only 33.03%, indicating a concentration of digital inclusive finance usage in urban areas and inadequate penetration into rural regions. Secondly, a significant digital divide persists, with most rural residents lacking basic financial knowledge.
Secondly, in our reports, the control variables remained consistently significant. Urbanization level and degree of opening exhibited negative correlations with the income gap, demonstrating significance at the 1% level. Hence, the increase in urbanization and openness may contribute to enhancing labor mobility and other factors, thereby aiding in reducing the urban–rural income gap. The industrial structure showed a positive correlation with the urban–rural gap, significant at the 1% level, indicating that the development of the tertiary industry hinders income distribution improvement and widens China’s income gap. China’s tertiary industry is primarily concentrated in urban areas, with rural tertiary industries being relatively small in scale. Consequently, urban residents benefit from the majority of dividends generated by tertiary industry development, thus increasing the urban income without a corresponding rise in the rural income. Education level exhibited a positive effect on the income gap, significant at the 10% level, suggesting that an increase in residents’ number of years of education widens the urban–rural income gap, possibly due to a concentration of highly educated individuals in urban areas. The impact of traditional financial development depth on the income gap showed a significant positive correlation at the 1% level, indicating that an increase in traditional financial development depth has led to a widening of the urban–rural income gap, primarily due to financial exclusion. Most credit funds flow to high-quality clients with good credit while small and micro-enterprises and low-income farmers receive less financial support due to factors such as lack of collateral. These findings further validate the complementary role of digital inclusive finance in traditional financial functions. Additionally, government intervention and breadth of traditional financial development did not exhibit statistically significant effects on the income gap.

5.4. Analysis of Transmission Mechanism

Building upon the ordinary panel model, this paper introduces three mediating variables—human capital investment, individual entrepreneurship, and labor employment—to examine the mechanism through which digital inclusive finance development affects the income gap. These variables are logarithmically transformed to eliminate dimensional effects. The estimation results are shown in Table 4.
The results indicate that labor employment is the primary mechanism through which digital inclusive finance reduces the urban–rural income gap, rather than individual entrepreneurship and human capital investment, which is partly inconsistent with Hypothesis 3.
Firstly, labor employment plays a partial mediating role, accounting for 23.15% of the total effect. This suggests that the development of digital inclusive finance contributes to improving the operating conditions of enterprises, thereby expanding the production scale and increasing rural labor employment opportunities. According to the National Bureau of Statistics of China, over the sample period, the total number of migrant workers in China increased from 252.78 million in 2011 to 288.36 million in 2018, with an average annual growth rate of approximately 2%.
Secondly, the non-significance of the mechanism test for human capital investment may be attributed to the concentration of high-quality education resources in urban areas in China, leading to a significant urban–rural education gap and a larger “digital divide”. As a result, it remains difficult for low-income farmers to enhance their economic opportunities through education.
Thirdly, the non-significance of the mechanism test for individual entrepreneurship may be due to the fact that the impact of digital inclusive finance on entrepreneurship exhibits a single threshold effect, which occurs only after crossing the corresponding threshold (Aghion et al., 2007) [28]. And the low success rate of entrepreneurship is also a contributing factor. According to a sampling conducted by Zhao and Li (2017) [29], the success rate of rural Chinese youth in entrepreneurship, defined as the proportion of entrepreneurial activities that can be effectively sustained and whose income increases annually for over 3 years, is only 19.57%.

5.5. Robustness Test

Table 3 displays the results of the robustness test. In this paper, a substitution variable method has been employed for robustness testing, wherein the ratio between urban and rural residents’ incomes has been used as the response variable to measure the urban–rural income gap. Estimations were conducted using both a two-way fixed-effect model and spatial econometric models. The estimation results indicate the robustness of the conclusions.

6. Conclusions and Policy Recommendations

Based on a sample of 31 Chinese provinces from 2011 to 2018, this paper has utilized spatial econometric models and mediating-effect models to examine the impact of digital inclusive finance on the urban–rural income gap and its mechanisms. The main findings are the following: (1) Globally, the urban–rural income gap and digital inclusive finance each exhibit significant positive spatial correlation; Locally, the urban-rural income gap predominantly demonstrates spatial dependence in Central and Western China. Meanwhile, digital inclusive finance exhibits varied patterns over the sample period, transitioning from the coexistence of H-H, L-L, and L-H patterns initially to only an H-H pattern in economically developed Eastern China later on. (2) Digital inclusive finance notably reduces the urban–rural income gap, primarily attributed to its expanded coverage and digitization. However, the depth of digital inclusive finance does not significantly impact the income gap, likely due to the limited usage of internet finance and digital divide between rural residents. (3) Mechanism tests indicate that digital inclusive finance fosters industrial expansion, offering increased employment opportunities for farmers, which leads to higher farmer incomes and a reduced urban–rural income gap. Conversely, human capital investment and individual entrepreneurship show no significant effects.
Based on the above conclusions, this paper proposes the following policy recommendations: First, actively promote digital technology to expand the development of digital inclusive finance. Enhance the coverage and quality of digital financial infrastructure, particularly by accelerating the construction and upgrading of broadband communication networks in underdeveloped regions to improve the accessibility of inclusive digital financial services. Encourage deep collaboration between financial institutions and fintech companies, such as by establishing a Financial Technology Innovation Fund, to drive innovation in rural digital financial products and services, thereby enhancing the engagement of digital inclusive finance.
Second, strengthen regional financial coordination to promote resource sharing. Given the local agglomeration effect of digital inclusive finance and urban–rural income gap, the government can establish a cross-regional financial cooperation platform to facilitate the sharing and cooperation of resources, markets, and technologies. Specifically, emphasis should be placed on leveraging the spillover effect from the more developed eastern regions to the underdeveloped central and western regions while ensuring the prudent allocation and utilization of financial resources under risk monitoring.
Third, promote industrial revitalization and harness the trickle-down effect of digital inclusive finance. Enhance digital literacy training among rural residents, utilizing platforms such as rural e-commerce to narrow the digital divide and enhance the employability of farmers. Simultaneously, increase support for rural industries, expand rural industrial chains, and create more job opportunities, aiming to further reduce the urban–rural income gap.

Author Contributions

Methodology, Y.M.; Software, J.M.; Validation, Y.M.; Formal analysis, J.M.; Resources, H.W.; Data curation, J.M.; Writing—original draft, Y.M.; Writing—review & editing, H.W.; Supervision, Y.M. and H.W.; Project administration, Y.M.; Funding acquisition, Y.M. All authors have read and agreed to the published version of the manuscript.

Funding

This article has been supported by the Jiangsu University Philosophy and Social Fund (2019SJA0266), the China Postdoctoral Fund (2019M661802), the National Natural Science Foundation of China (72003086), the Ministry of Education Humanities and Social Sciences Fund Youth Project (18YJC790002), and the Youth Project of Jiangsu Provincial Social Science Fund (18EYC008).

Institutional Review Board Statement

Not applicable.

Informed Consent Statement

Not applicable.

Data Availability Statement

All data can be obtained by email from the corresponding author.

Conflicts of Interest

Author Jing Mu is currently employed by the Suzhou Branch of China Construction Bank. The remaining authors declare that the research was conducted in the absence of any commercial or financial relationships that could be construed as a potential conflict of interest.

References

  1. McKinnon, R.I. The Value-Added Tax and the Liberalization of Foreign Trade in Developing Economies: A Comment. J. Econ. Lit. 1973, 11, 520–524. [Google Scholar]
  2. King, R.G.; Levine, R. Finance, Entrepreneurship and Growth. J. Monet. Econ. 1993, 32, 513–542. [Google Scholar] [CrossRef]
  3. Greenwood, J.; Jovanovic, B. Financial Development, Growth and the Distribution of Income. J. Political Econ. 1990, 98, 1076–1107. [Google Scholar] [CrossRef]
  4. Clarke, G.; Xu, L.; Zou, H.F. Finance and Income Inequality: What Do the Data Tell Us? South. Econ. J. 2006, 72, 578–596. [Google Scholar]
  5. Jeanneney, S.G.; Kpodar, K. Financial Development and Poverty Reduction: Can There be a Benefit without a Cost? J. Dev. Stud. 2011, 10, 143–163. [Google Scholar] [CrossRef]
  6. Seven, U.; Coskun, Y. Does Financial Development Reduce Income Inequality and Poverty? Evidence from Emerging Countries. Emerg. Mark. Rev. 2016, 26, 34–63. [Google Scholar] [CrossRef]
  7. Park, D.; Shin, K. Economic Growth, Financial Development, and Income Inequality. Emerg. Mark. Financ. Trade 2017, 53, 2794–2825. [Google Scholar] [CrossRef]
  8. Fowowe, B. The Effects of Financial Inclusion on Agricultural Productivity in Nigeria. J. Econ. Dev. 2020, 22, 61–79. [Google Scholar] [CrossRef]
  9. Peng, H.; Wang, J.; Wen, L.; Ding, P.; Zhu, Y.J. Is the Development of Inclusive Finance Truly Able to Alleviate Poverty?—An Empirical Study Based on Spatial Effect and Threshold Effect. Emerg. Mark. Financ. Trade 2022, 58, 2505–2521. [Google Scholar] [CrossRef]
  10. Chakravarty, S.R.; Pal, R. Inclusive Finance in India: An Axiomatic Approach. J. Policy Model. 2013, 35, 813–837. [Google Scholar] [CrossRef]
  11. Ran, M.S.; Chen, L.; Li, W. Financial Deepening, Spatial Spillover, and Urban–Rural Income Disparity: Evidence from China. Sustainability 2020, 12, 1450. [Google Scholar] [CrossRef]
  12. Schmied, J.; Marr, A. Financial Inclusion and Poverty: The Case of Peru. Reg. Sect. Econ. Stud. 2017, 16, 1–26. [Google Scholar]
  13. Beck, T.; Pamuk, H.; Ramrattan, R.; Burak, R.U. Payment Instruments, Finance and Development. J. Dev. Econ. 2018, 133, 162–186. [Google Scholar] [CrossRef]
  14. Li, J.; Wu, Y.; Xiao, J. The Impact of Digital Finance on Household Consumption: Evidence from China. Econ. Model. 2020, 86, 317–326. [Google Scholar] [CrossRef]
  15. Lian, X.; Mu, Y.; Zhang, W. Digital Inclusive Financial Services and Rural Income: Evidence from China’s Major Grain-producing Regions. Financ. Res. Lett. 2023, 53, 103622. [Google Scholar] [CrossRef]
  16. Liu, J.; Puah, C.H.; Arip, M.A.; Jong, M.C. Impacts of Digital Financial Inclusion on Urban-Rural Income Disparity: A Comparative Research of the Eastern and Western Regions in China. Economies 2023, 11, 282. [Google Scholar] [CrossRef]
  17. Zhang, X.; Zhang, J.; Wan, G.; Luo, Z. Fintech, Growth and Inequality: Evidence from China’s Household Survey Data. Singap. Econ. Rev. 2020, 65, 75–93. [Google Scholar] [CrossRef]
  18. Li, M.; Feng, S.; Xie, X. Spatial Effect of Digital Financial Inclusion on the Urban-rural Income Gap in China-Analysis Based on Path Dependence. Econ. Res. 2023, 32, 2106279. [Google Scholar] [CrossRef]
  19. Krugman, P. Geography and Trade; MIT Press: Cambridge, UK, 1991. [Google Scholar]
  20. Ji, X.M.; Wang, K.; Xu, H.; Li, M.C. Has Digital Financial Inclusion Narrowed the Urban-Rural Income Gap: The Role of Entrepreneurship in China. Sustainability 2021, 13, 8292. [Google Scholar] [CrossRef]
  21. Beck, T.; Demirguc-Kunt, A.; Levine, R. Finance, Inequality and the Poor. J. Econ. Growth 2007, 12, 27–49. [Google Scholar] [CrossRef]
  22. Sarma, M. Index of Financial Inclusion; Working Paper No. 215; Indian Council for Research on International Economic Relations: New Delhi, India, 2008. [Google Scholar]
  23. Zhang, H.; Yuan, F.; Cui, Y.; Li, G. Research on the Construction and Measurement of Inclusive Finance Evaluation Index System. Procedia Comput. Sci. 2022, 199, 1152–1159. [Google Scholar] [CrossRef]
  24. Allen, F.; Demirguc-Kunt, A.; Klapper, L.; Peria, M.S.M. The Foundations of Financial Inclusion: Understanding Ownership and Use of Formal Accounts. J. Financ. Intermediat. 2016, 27, 1–30. [Google Scholar] [CrossRef]
  25. Liu, G.; Huang, Y.; Huang, Z. Determinants and Mechanisms of Digital Financial Inclusion Development: Based on Urban-Rural Differences. Agronomy 2021, 11, 1833. [Google Scholar] [CrossRef]
  26. Li, Z. Peasant Migration: Historical Changes in the Past 70 Years and Prospects for the Next 30 years. China Rural Suvey 2019, 5, 2–16. (In Chinese) [Google Scholar]
  27. Wen, Z.; Zhang, L.; Hou, J.; Liu, H. Testing and Application of the Mediating Effects. Acta Psychol. Sin. 2004, 36, 614–620. (In Chinese) [Google Scholar]
  28. Aghion, P.; Fally, T.; Scarpetta, S. Credit Constraints as a Barrier to the Entry and Post-entry Growth of Firms. Econ. Policy 2007, 22, 732–779. [Google Scholar] [CrossRef]
  29. Zhao, D.; Li, H. Research on Cultivation of Rural Youth Entrepreneurship under the Background of New Urbanization. J. Agric. 2017, 7, 127–136. (In Chinese) [Google Scholar]
Figure 1. Schematic of theoretical mechanism.
Sustainability 16 02641 g001
Figure 2. LISA agglomeration maps of urban–rural income gap in 2011 (a), 2015 (b), and 2018 (c). Note: The numbers in parentheses correspond to the sample sizes under the 5% significance level test.
Sustainability 16 02641 g002
Figure 3. LISA agglomeration maps of digital inclusive finance in 2011 (a), 2015 (b), and 2018 (c). Note: The numbers in parentheses correspond to the sample sizes under the 5% significance level test.
Sustainability 16 02641 g003
Figure 4. LISA agglomeration maps of the breadth of coverage of digital inclusive finance in 2011 (a), 2015 (b), and 2018 (c). Note: The numbers in parentheses correspond to the sample sizes under the 5% significance level test.
Sustainability 16 02641 g004
Figure 5. LISA agglomeration maps of the usage depth of digital inclusive finance in 2011 (a), 2015 (b), and 2018 (c). Note: The numbers in parentheses correspond to the sample sizes under the 5% significance level test.
Sustainability 16 02641 g005
Figure 6. LISA agglomeration maps of the digitization of digital inclusive finance in 2011 (a), 2015 (b), and 2018 (c). Note: The numbers in parentheses correspond to the sample sizes under the 5% significance level test.
Sustainability 16 02641 g006
Table 1. Variable definitions and descriptive statistics.
VariableMarkVariable DefinitionsMeanSdMinMax
Response variableurban–rural income gapTheil Index0.0980.0440.0200.227
Core explanatory variablesDIFIindex of digital inclusive finance/1001.8720.8510.1623.777
DIFBindex of coverage breadth of digital inclusive finance/1001.6660.8510.0203.539
DIFDindex of depth usage of digital inclusive finance/1001.8250.8500.0684.004
DIFDDindex of digitization of digital inclusive finance/1002.6401.1600.0764.537
Other control variableISvalue added of the tertiary sector/regional GDP0.4580.0950.2970.810
URBurban population/total population of the region0.5610.1330.2270.896
GIgovernment expenditure/regional GDP0.2810.2130.1101.379
OPE(import amount + export amount)/regional GDP0.2520.2750.0121.419
EDUaverage years of education per capita in the region9.0421.1274.22212.503
FDDloan balance of financial institutions/regional GDP1.3490.4660.6503.083
FDBnumber of bank branches/total population of region1.6610.2891.1042.331
mediating variablesHCIthe number of persons with higher education (10,000 persons)503.29307.196.691443.20
ENTthe number of self-employed persons (10,000 persons)368.15293.1025.401470.10
LEthe sum of employment figures in private enterprises and non-private urban units (10,000 persons)1052.74903.3043.905019.20
Table 2. The global Moran’s I test results of key variables.
YearUrban Residents’ per Capita Disposable IncomeRural Residents’ per Capita Disposable IncomeUrban–Rural Income GapDIFDIFBDIFDDIFDD
20110.450 ***0.536 ***0.524 ***0.478 ***0.416 ***0.624 ***0.003
20120.448 ***0.539 ***0.518 ***0.477 ***0.390 ***0.620 ***0.278 ***
20130.360 ***0.559 ***0.530 ***0.450 ***0.384 ***0.577 ***0.107
20140.358 ***0.561 ***0.499 ***0.446 ***0.355 ***0.549 ***0.014
20150.348 ***0.556 ***0.559 ***0.409 ***0.349 ***0.586 ***0.407 ***
20160.349 ***0.554 ***0.557 ***0.430 ***0.358 ***0.593 ***0.116
20170.343 ***0.555 ***0.558 ***0.492 ***0.398 ***0.575 ***0.138
20180.344 ***0.553 ***0.547 ***0.538 ***0.420 ***0.588 ***0.594 ***
Note: *** denotes significance at the 1% level.
Table 3. Spatial estimation results of the impact of digital inclusive finance on the urban–rural income gap.
VariablesUrban–Rural Income GapRobustness Test
Ratio of Urban and Rural Residents’ Income
(1)
OLS
(2)
SLM
(3)
SEM
(4)
SLM
(5)
SLM
(6)
SLM
(7)
OLS
(8)
SLM
(9)
SEM
DIF−0.0117 ***
(0.0022)
−0.0039 **
(0.0016)
−0.0104 ***
(0.0021)
---−0.1697 ***
(0.0228)
−0.0744 ***
(0.0221)
−0.1357 ***
(0.0290)
DIFB---−0.0045 ***
(0.0017)
-----
DIFD----−0.0007
(0.0012)
----
DIFDD-----−0.0022 ***
(0.0007)
---
IS0.0702 ***
(0.0211)
0.0526 ***
(0.0159)
0.0245
(0.0175)
0.0552 ***
(0.0162)
0.0386 **
(0.0152)
0.0450 ***
(0.0147)
1.0568 ***
(0.2790)
0.6748 ***
(0.2334)
0.4066 *
(0.2556)
URB−0.3440 ***
(0.0484)
−0.2401 ***
(0.0307)
−0.2610 ***
(0.0335)
−0.2336 ***
(0.0314)
−0.2645 ***
(0.0299)
−0.2549 ***
(0.0291)
−2.5759 ***
(0.5119)
−1.7671 ***
(0.4450)
−1.7741 ***
(0.4867)
GI0.0299
(0.0377)
−0.0138
(0.0179)
0.0065
(0.0187)
−0.0149
(0.0178)
−0.0176
(0.0181)
−0.0119
(0.0182)
0.0209
(0.2927)
0.0023
(0.2611)
0.1628
(0.2691)
OPE−0.0388 ***
(0.0116)
−0.0255 ***
(0.0081)
−0.0288 ***
(0.0096)
−0.0259 ***
(0.0082)
−0.0170 **
(0.0076)
−0.0235 ***
(0.0076)
−0.3087 **
(0.1396)
−0.2590 **
(0.1187)
−0.3492 **
(0.1386)
EDU0.0040
(0.0032)
0.0040 *
(0.0023)
0.0018
(0.0023)
0.0037 *
(0.0022)
0.0039 *
(0.0023)
0.0034
(0.0022)
0.0736 *
(0.0396)
0.0485
(0.0329)
0.0184
(0.0333)
FDD0.0103 ***
(0.0035)
0.0101 ***
(0.0026)
0.0078 ***
(0.0027)
0.0104 ***
(0.0026)
0.0091 ***
(0.0026)
0.0091 ***
(0.0025)
0.1058 **
(0.458)
0.0656 *
(0.0379)
0.0335 *
(0.0399)
FDB−0.0051
(0.0069)
−0.0045
(0.0050)
0.0009
(0.0052)
−0.0044
(0.0050)
−0.0063
(0.0050)
−0.0040
(0.0050)
0.0665
(0.0876)
0.0699
(0.0727)
0.1469
(0.0752)
Constant0.2410 ***
(0.0399)
0.1235 ***
(0.0240)
0.2299 ***
(0.0246)
0.1213 ***
(0.0241)
0.1353 ***
(0.0248)
0.1395 ***
(0.0235)
3.1070 ***
(0.3779)
1.3874 ***
(0.3790)
3.3245 ***
(0.3567)
ρ/λ-0.5996 ***
(0.0548)
0.6642 ***
(0.0610)
0.5986 ***
(0.0544)
0.6591 ***
(0.0472)
0.5912 ***
(0.0544)
-0.5677 ***
(0.0610)
0.6134 ***
(0.0675)
R20.76080.77250.74710.76990.75520.79060.62350.64380.6127
LogL-824.5222817.4697824.7878821.4684825.7428-162.0098157.1848
Hausman test statistic23.22 **19.19 **35.68 **18.13 **28.48 **16.20 **34.75 **23.41 **25.86 **
Fixed effectyesyesyesyesyesyesyesyesyes
Sample size248248248248248248248248248
Note: ***, **, and * denote significance at the 1%, 5%, and 10% levels, respectively. Standard deviations are reported in parentheses.
Table 4. Results of the mechanism tests.
VariablesStep1Human Capital InvestmentIndividual EntrepreneurshipLabor Employment
Step2Step3Step2Step3Step2Step3
(10)(11)(12)(13)(14)(15)(16)
Urban–Rural Income GapHuman Capital InvestmentUrban–Rural Income GapIndividual EntrepreneurshipUrban–Rural Income GapLabor EmploymentUrban–Rural Income Gap
DIF−0.0117 ***
(0.0022)
−0.0005
(0.0214)
−0.0113 ***
(0.0021)
0.0488
(0.0305)
−0.0111 ***
(0.0048)
0.1456 ***
(0.0262)
−0.0087 ***
(0.0022)
HCI--0.0046
(0.0069)
----
ENT----−0.0044
(0.0048)
--
LE------−0.0180 ***
(0.0055)
Control variableControlControlControlControlControlControlControl
R20.76080.84940.76130.81840.76180.69840.7726
Note: *** denotes significance at the 1% levels. Standard deviations are reported in parentheses.
Disclaimer/Publisher’s Note: The statements, opinions and data contained in all publications are solely those of the individual author(s) and contributor(s) and not of MDPI and/or the editor(s). MDPI and/or the editor(s) disclaim responsibility for any injury to people or property resulting from any ideas, methods, instructions or products referred to in the content.

