Article

The Relationship between Climate, Agriculture and Land Cover in Matopiba, Brazil (1985–2020)

by
Mayara Lucyanne Santos de Araújo
1,*,
Iana Alexandra Alves Rufino
1,
Fabrício Brito Silva
2,
Higor Costa de Brito
1 and
Jessflan Rafael Nascimento Santos
2
1
Center for Technology and Natural Resources, Federal University of the Campina Grande, Campina Grande 58429900, PB, Brazil
2
Geotechnologies Laboratory, Ceuma University, São Luís 65075120, MA, Brazil
*
Author to whom correspondence should be addressed.
Sustainability 2024, 16(7), 2670; https://doi.org/10.3390/su16072670
Submission received: 21 February 2024 / Revised: 5 March 2024 / Accepted: 11 March 2024 / Published: 25 March 2024
(This article belongs to the Special Issue Climate Change Mitigation and Adaptation in Sustainable Agriculture)

Abstract

:
Climate change has been at the forefront of discussions in the scientific, economic, political, and public spheres. This study aims to analyze the impacts of climate change in the Matopiba region, assessing its relationship with land cover and land use, soybean crop production and yield, and ocean–atmosphere anomalies from 1985 to 2020. The analysis was conducted in four parts: (1) trends in annual and intra-annual climate changes, (2) the spatiotemporal dynamics of land cover and use, (3) the spatiotemporal dynamics of soybean production and yield, and (4) the relationship between climate change, agricultural practices, land cover and use, and ocean–atmosphere anomalies. Statistical analyses, including Mann–Kendall trend tests and Pearson correlation, were applied to understand these relationships comprehensively. The results indicate significant land cover and use changes over 35 years in Matopiba, with municipalities showing increasing soybean production and yield trends. There is a rising trend in annual and intra-annual maximum temperatures, alongside a decreasing trend in annual precipitation in the region. Intra-annual climate trends provide more specific insights for agricultural calendar planning. No correlation was found between the climate change trends and soybean production and yield in the evaluated data attributed to genetic and technological improvements in the region. The North Atlantic Ocean shows a positive correlation with soybean agricultural variables. Evidence suggests soybean production and yield growth under climate change scenarios. This study highlights soybeans’ adaptation and climate resilience in the Matopiba region, providing valuable insights for regional agricultural development and contributing to further research in environmental, water-related, social, and economic areas of global interest.

1. Introduction

Climate change has been at the center of diverse scientific, economic, political, and public discussions [1,2,3,4]. The current changes in the climate already profoundly affect human and natural processes [5]. Changes in the climate have become a significant challenge to humanity because they have substantial local, regional, and global consequences [6,7]. In the face of climatic changes, environmental, social, political, and economic impacts are already being observed, such as changes in the hydrological cycle, frequent floods, droughts, a higher incidence of plagues and diseases, and a greater challenge regarding the production of grains and food for global agriculture [5]. Therefore, the global challenge consists of understanding where, when, and how climate changes affect world populations to analyze, measure, and test the processes of climate adaptation and resilience [8,9]. Spatiotemporal dynamics have been studied in different regions to rate changes in the weather and their relation to human and natural processes of land cover and land use [7,10].
Land cover and land use have changed significantly in recent years. In the first two decades of the 21st century, drastic alterations to the cover and use of land worldwide occurred [11], leading to changes in the landscape at a variety of temporal and spatial scales [12,13,14]. For example, more than 314 million hectares of forest were lost worldwide between 2001 and 2015, with a generous portion of this attributed to deforestation caused by agricultural commodities [15]. Monitoring land cover and use through the years and its relation to climate change provides valuable information [7].
The relationship between land cover and land use and climate change helps scientists to predict and mitigate the impacts of climate change on various human activities, such as agriculture, allowing farmers to adapt to climatic conditions and obtain better production yields. This is especially with the improvement of technological packages that can efficiently minimize the risks of climate change and have a positive global impact on the intensification of land use rather than on its expansion [11]. In agriculture, policymakers have a considerable and growing international interest in evaluating cultivation adaptation and climatic resilience [16]. For decision making in regional agricultural planning and development, knowledge of the spatiotemporal patterns of crops and their performance over time is essential, as is the assessment of climate change [17,18].
The aforementioned agricultural planning and development is essential in large agricultural countries. Brazil is the fifth largest country in the world and has established agricultural potency. The country is one of the global leaders in the production and exportation of grains [19] and is one of the ten biggest global economies in terms of Gross Domestic Product (GDP) [20]. The country is the global leader in soybean production, followed by the United States and Argentina [21]. Soybean cultivation is one of the main commodities in the world [22]. Oilseed is rich in proteins and oils, and humans and animals consume it [23,24,25,26]. Brazil exported circa 76.16 million tons of soybean during the 2017/2018 harvest [27]. The production of soybeans in the 2022/2023 harvest was estimated at 322.8 million tons, with an increase of 18.4%, corresponding to 50.1 million tons more soybeans harvested in this harvest than the last harvest [28]. This has resulted in a larger planted area and a better average productivity.
Matopiba, an acronym for the states Maranhão (MA), Tocantins (TO), Pisauí (PI), and Bahia (BA), is Brazil’s newest agricultural frontier [17,29,30]. This region has suffered significant environmental, economic, and social changes due to the growth of this frontier, especially with soybean cultivation. The main factors leading to the agricultural advances in Matopiba’s region are a low land price, continuous improvements in public policies, the soil quality, weather, and a topography favorable to mechanic agriculture, aside from being a favorable location for the logistics of grains exportations [17,31]. Matopiba is located near the Port of Itaqui in São Luís, capital of the state of Maranhão. Compared to the other Brazilian ports, this port presents the best cost/profit for national and international markets [32].
In the face of the high economic, social, and environmental relevance of Matopiba’s region, it is of great interest to analyze territorial and climatic data to better comprehend the dynamics of evolution, transition, and agricultural intensification [17,33,34]. It is also important to evaluate climate changes in Matopiba with studies that allow the mechanisms of intervention in the productive systems of cultivation to be traced, especially in soybean cultivation, in combination with sustainable development. The impact of climate changes on agriculture is not the same among the regions due to variations in nature, the magnitude of the regional climate, and variability in farmers’ resilience [6,7].
This results in a greater urgency to understand the relationship between meteorological events and agricultural production and yield in Matopiba. Many studies show the effects of global warming on precipitation and temperature patterns worldwide. Asewar et al. [35] evaluated the potential of climate-resilient technologies to increase soybean yields in India. Santos et al. [7] analyzed trends in extreme air temperatures and precipitation and their impact on corn and soybean yields in Nebraska, USA. MacCarthy et al. [36] assessed soybean yields under climate change in a semi-arid region of West Africa and found that the effect of climate change on yields varied widely between farms and between years. Variability between farms (due to diversity in management practices and soil type) was more important than between years (due to differences in climatic parameters); this calls for more attention to be paid to the extension of good management practices to farmers in order to reduce the variability of climate impacts on agricultural yields [36].
Therefore, the present article’s main objective is to analyze the climate changes in Matopiba, focusing on annual and intra-annual climate trends for precipitation and temperature based on long-term observations and multiple seasons. This is in addition to evaluating the relationship between climate trends, changes in land cover and land use, agricultural production and soybean yields in Matopiba, and ocean–atmosphere anomalies. This analysis is essential to Matopiba, where agriculture is one of the most critical sectors. Identifying the relation between the behavior of soybean production in the face of climate change trends could significantly impact the region’s response to adaptation and climate resilience. The results could support local, regional, and global agricultural planning and assist research and analysis in environmental, hydro, social, and economic areas of Matopiba.

2. Materials and Methods
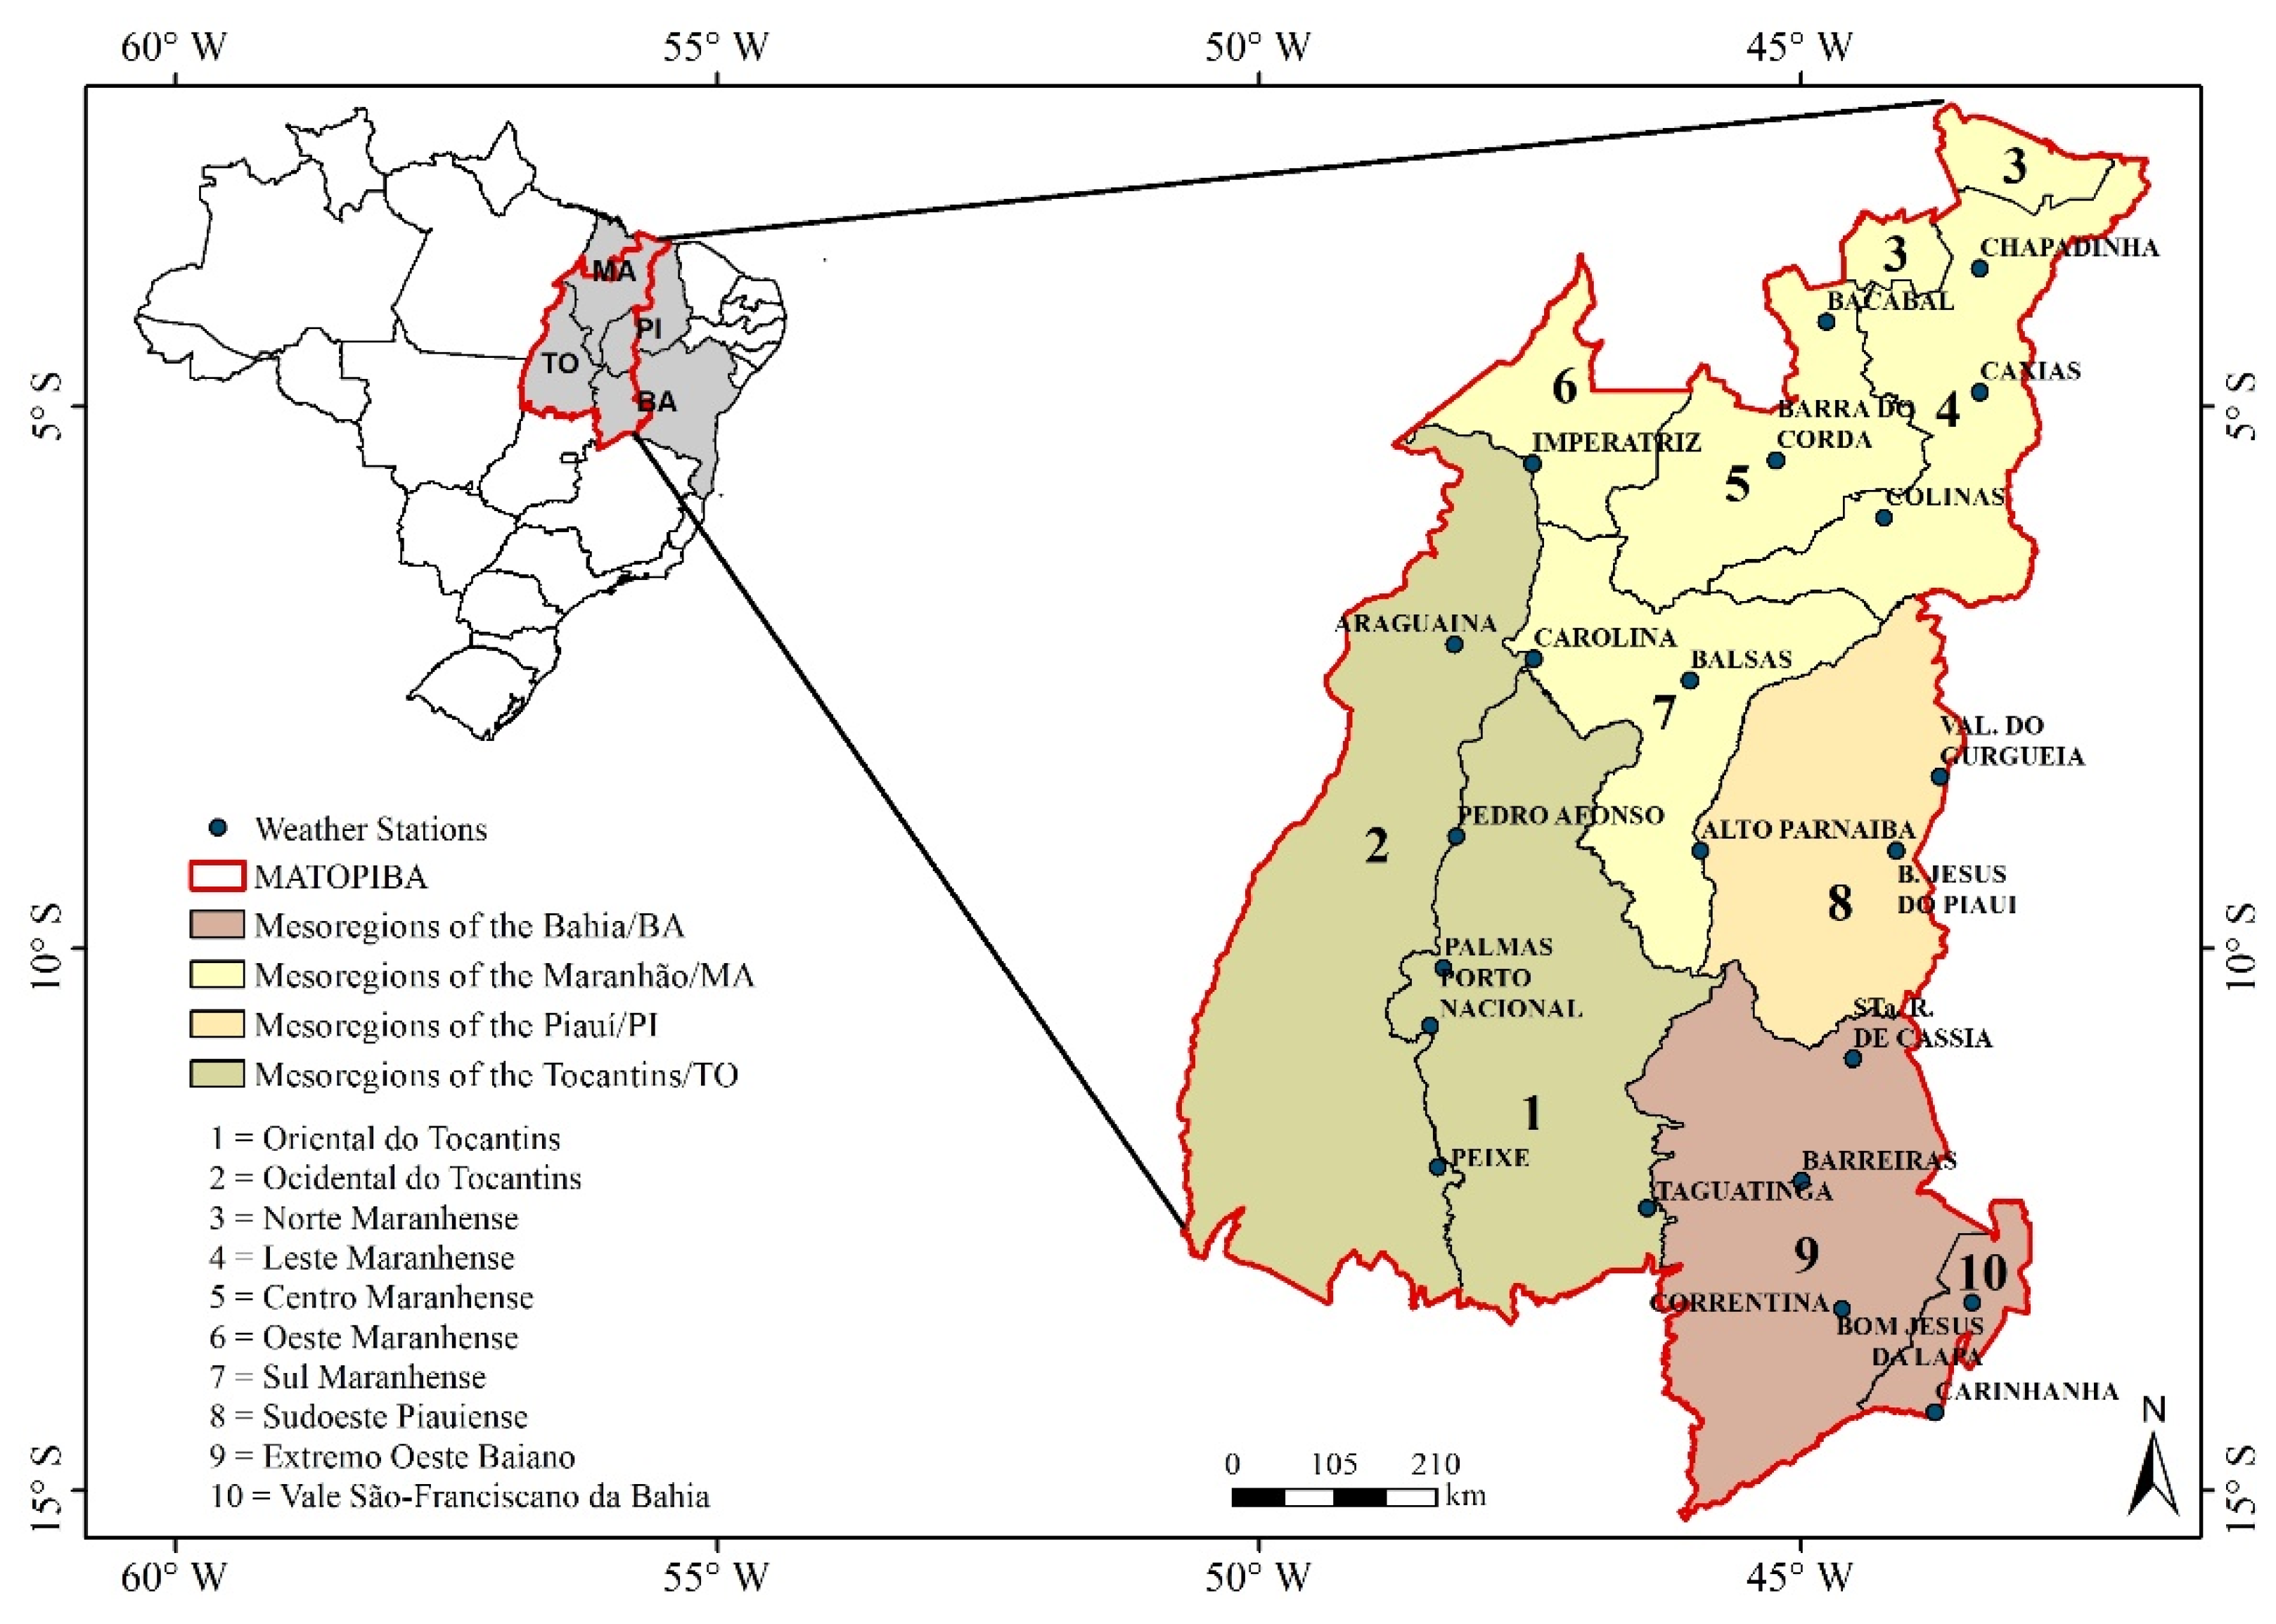
2.1. Study Field

The study field selected was the region of Matopiba, which extends through the North and Northeast of Brazil. The region studied is located in an area between 2°30′–15°15′ S, 42°00′–50°00′ W, constituted by parts of the state of Maranhão, Tocantins, Piauí and Bahia (Figure 1). The Matopiba comprehends an area of approximately 73 million hectares, with 337 Brazilian cities and 10 mesoregions (5 in the state of Maranhão, 2 in Tocantins, 1 in Piauí and 2 in Bahia) [17]. A mesoregion corresponds to a subdivision of a Brazilian state and can cover a variable number of cities with elevated levels of economic and social similarities. Matopiba is Brazil’s most recent agricultural frontier [17,31]. In the last ten years, the production of grains in Matopiba has increased by 93%, an advance of 18 million tons (2013/2014 harvest) to 35 million tons (2022/2022 harvest) [37].
Matopiba is a region of transition between biomes, covered mainly by the Cerrado biome (91%), with smaller Amazon areas (7.3%) and Caatinga (1.7%) [38]. The natural vegetal coverage is composed mainly of savannah formations (64%), areas of ecological tension (15%), and seasonal deciduous forest (11%). It has three river basins: the Basin of the Tocantins River (43%), the Basin of the Atlantic (40%), and the Basin of the São Francisco River (17%). Oxisol is the dominant soil type, covering 27.8 million hectares (38%) [39]. This soil type is deep, well developed, highly weathered, and has low fertility, good permeability, and high porosity [40].

2.2. Methodological Approach

The climate data considered in this study were daily data regarding precipitation and the maximum and minimum temperature from the period of 1985–2020, obtained by 22 conventional meteorological stations of the National Institute of Meteorology (INMET), with 9 of those stations being in the state of Maranhão, 6 in Tocantins, 2 in Piauí and 5 in Bahia [41]. According to the World Meteorological Organization (WMO), climatological normals are usually the average of three decades of meteorological parameters [42]. The INMET, an agency of the Ministry of Agriculture, Cattle and Supplying (MAPA), represents Brazil in the WMO and provides Brazilian meteorological information to help the country’s agricultural production, emphasizing practical and reliable results [41]. The data from INMET, like other data sources, have insufficiencies. Some meteorological stations present flaws in their data series; however, they were not considered and did not interfere with the final result. The climate data were analyzed using descriptive statistics involving central trend measures and data variability.
The land cover data and land use considered in this study were obtained from the platform MapBiomas. MapBiomas is a multi-institutional initiative whose primary objective is contributing to an understanding of the transformation of Brazilian territory. The project was launched in July 2015, and since then, it has made available a historical series of maps and analyses that help understand the evolution of the Brazilian landscape through time, with the construction of annual maps of land cover and use each year, from 1985 to the current time [43]. The current study utilized images from collection 6 of MapBiomas, which was published in August 2021 and has a 30 m resolution. Access to these data was realized via the Google Earth Engine (GGE) platform.
The temporal series selected were 1895, 1990, 1995, 2000, 2005, 2010, 2015 and 2020. The reclassification of the images was initially realized according to what is described in Table 1 and analyzed spatially–temporally. Subsequently, the images were reclassified into natural formation and anthropic action, according to Table 2. In the images of the second reclassification, we realized buffers of 60 km in each geographical point of the 22 meteorological stations in Matopiba, seeking to quantify and analyze the process of human occupation and alteration in the vegetal coverage around the meteorological stations in Matopiba.
The agricultural data considered in this study were municipal data regarding the production (t) and yield (kg ha−1) of soybean cultivation from 1885 to 2020 for the 337 cities that comprise Matopiba. The agricultural data were obtained by the Municipal Agricultural Production (PAM) of the Brazilian Institute of Geography and Statistics (IBGE) through the platform IBGE Automatic Recovery System (SIDRA) [44]. The purpose of these data is to provide the whole country with statistical information on the agricultural base on annual and municipal scales. The IBGE data, like many data sources, have insufficiencies. Some cities present flaws in their data series; however, they were not considered and did not interfere with the final result. These data were characterized spatially and temporally and analyzed using descriptive statistics involving central trend measures.
The ocean–atmosphere anomalies in the present study were studied through the Multivariate El Niño Index (MEI), Pacific Decadal Oscillation (PDO), and Atlantic Multi-decadal Oscillation (AMO). The acquisition data from Pacific and Atlantic Ocean anomalies were obtained at the National Oceanic and Atmospheric Administration (NOAA) in the portal Physical Sciences Laboratory [45], made available free of charge on the website https://psl.noaa.gov/ (accessed on 6 July 2021). The dynamic between the ocean and atmosphere influences the world’s climate. Temperatures hotter or colder than usual in oceans can affect climate patterns worldwide, affecting the high and low-pressure systems, wind, and precipitation.
Statistical analyses of trends based on the Mann–Kendall test [46] were conducted. This test corresponds to a sequential and non-parametric analysis, as the World Meteorological Organization (WMO) suggested, for observing trends in a time series of environmental data [47,48]. It is usually used to verify whether a series of data has a statistically defined tendency for temporal change and is given by Equation (1), as follows:
S = k = 1 n i 1 j = k + 1 n s g n ( x j x k )
where S is the Mann–Kendall test, and xj and xk are the time series values at times j and k for n observations, respectively. In this approach, the differences between each sequential value sgn (…) are calculated to represent an increase (+1), decrease (−1), or no change (0) (Equation (2)).
s g n ( x ) = + 1 ,   x > 0 0 ,   x = 0 1 ,   x < 0
Negative S values indicate a downward temporal trend, whereas positive values indicate an upward temporal trend. Assessing the probability associated with the S values and the sample size (n) is essential. After this analysis, it is possible to assess whether the trend is statistically significant. The accepted statistical parameter for the number of samples greater than 10 is the value of the variance of S (Equation (3)), as follows:
V S = n n 1 2 n 1 j = 1 p t j t j 1 2 t j + 5 18  
where p is the number of groups tied and tj is the number of equal values in a certain group j of the time series. Because S is distributed with zero mean and variance, as given by Equation (1), it can be seen whether the positive or negative trend is significantly different from zero. If S is significantly different from zero, then H0 is rejected for a certain significance level, indicating a trend (hypothesis H1 is accepted). The statistical parameter for the number of small samples with a normal distribution is the value of the Z statistic (Equation (4)).
Z = S 1 V S   s e   S > 0     0   s e   S = 0   S + 1 V S   s e   S < 0  
Due to its robustness and wide application in climate studies, the Mann–Kendall test was applied to the climate and agricultural data from 1985 to 2020 [48]. The climate trends were annually and intra-annually analyzed. The monthly climate trends are relevant to the agricultural calendar of cultivation. The agricultural trends were obtained via data on the production and soybean cultivation yield of the cities with the 22 meteorological stations in Matopiba. The Mann–Kendall test was processed using the XLSTAT 2021 software [49]. XLSTAT provides a quality data analysis before the processing of Mann–Kendall trends. This data quality analysis is crucial to guaranteeing that the data used in the trend analysis are reliable and adequate for the desired purpose.
The correlations between the climate, agricultural, land cover, and land use analysis results of Matopiba’s meteorological stations and the ocean–atmosphere anomalies were obtained using Pearson’s correlation (r) [7,50,51]. The climate analysis was conducted for precipitation trends and maximum and minimum temperatures. The results of the land cover and land use utilized in the analysis were the natural formation areas (1985 and 2020), anthropic action (1985 and 2020), and land cover and use changes over the 35 years. The average and agricultural trends were utilized in the analysis for the production and yield variables of soybean cultivation.
The two-tailed test was applied to verify the significance of p ≤ 0.05. The Pearson correlation formula, also known as the Pearson correlation coefficient (r), is commonly used to measure the degree and direction of the linear relation between two variables, and it is given by (Equation (5)):
r = n ( x y ) ( x ) ( y ) [ n x 2 ( x ) ² ] [ n y 2 ( y ) ² ]
where n is the number of observation pairs, x y is the addition of the products of each observation pair,   x is the addition of the observations from the first variable, y is the addition of the observations from the second variable, x ² is the addition of the squares of the observations from the first variable, and y ² is the addition of the squares of the observations from the second variable.

3. Results

3.1. Climate Analysis

Matopiba’s region presented higher precipitation volumes in the state of Tocantins (Figure 2a). The average annual precipitation ranged from 769.07 mm (Bom Jesus da Lapa/BA) to 1807.75 mm (Araguaína/TO). The high standard deviation values for the total average annual precipitation demonstrate the great variability in the region among dry and rainy periods. The annual average maximum temperature in the study area ranged from 31.58 °C (Correntina/BA) to 34.15 °C (Caxias/MA). The highest maximum temperature value was 44.70 °C, in Bom Jesus do Piauí/PI. The annual average minimum temperature ranged from 18.07 °C (Correntina/BA) to 23.31 °C (Bacabal/MA).
The application of the Mann–Kendall test in the annual temporal series of the 22 meteorological stations analyzed indicated a significant trend (p ≤ 0.05), with a decrease in precipitation in the course of the next years in 20 locations in Matopiba (Table 3). The higher and lowest decline trends were, respectively, in Colinas, in the south of Maranhão (p < 0.0001 and S −0.069 mm/year), and in Carinhanha, Valley São-Franciscano da Bahia (p 0.027 and S −0.012 mm/year). The intra-annual trends of this variable were significant to a level of 5%, with a decreasing trend in monthly precipitation, especially in December, with a decline in precipitation in 16 meteorological stations. In Colinas, south of Maranhão, the declining trend observed in nine months of the year for precipitation was statistically significant. Palmas, east of Tocantins, was the only station that presented a significant trend of increase, exclusively in January, with 5% in intra-annual precipitation (p 0.009 and S 0.063 mm/year).
The maximum annual temperature showed a significant increasing trend (p ≤ 0.05) in all meteorological stations in Matopiba’s region. In Caxias, east of Maranhão, the maximum annual temperature tended to rise more significantly (p < 0.0001 and S 0.254 °C/year) (Table 4). In this location, the maximum temperature was 42.2 °C in 2016, 8.05 °C higher than the average. Balsas, south of Maranhão, had the second highest annual increase in the maximum temperature (p < 0.0001 and S 0.225 °C/year). As for the intra-annual data, the maximum temperature tended to significantly increase (p ≤ 0.05) in all months of the year. Only seven analyzed cases were not shown to be relevant. The month of September exhibited the highest Mann–Kendall index value due to a trend of temperature increase in Caxias, east of Maranhão (p < 0.0001 and S 0.488 °C/year).
The minimum annual temperature presented a significant increasing trend (p ≤ 0.05) in 19 meteorological stations in the region of Matopiba (Table 5). Barra do Corda, in the center of Maranhão, showed the highest increasing trend in the minimum annual temperature (p < 0.0001 and S 0.347 °C/year). The locations of Correntina (p < 0.0001 and S −0.023 °C/year) and Sta. Rita de Cássia (p < 0.0001 and S −0.060°C/year), both to the extreme west of Bahia, exhibited significant decreasing trends (p ≤ 0.05) in this variable through the years.
The result of the trends in the intra-annual series of the minimum temperature was relevant (p ≤ 0.05), mostly due to the increase in this variable. October presented the highest level in the Mann–Kendall index due to the tendency of the minimum temperature to increase in Barra do Corda, Center of Maranhão (p < 0.0001 and S 0.494 °C/year). In September, the lowest value in the Mann–Kendall index was observed in Bom Jesus do Piauí, southwest of Piauí, due to a decreasing trend in the minimum temperature (p < 0.0001 and S −0.225 °C/year).

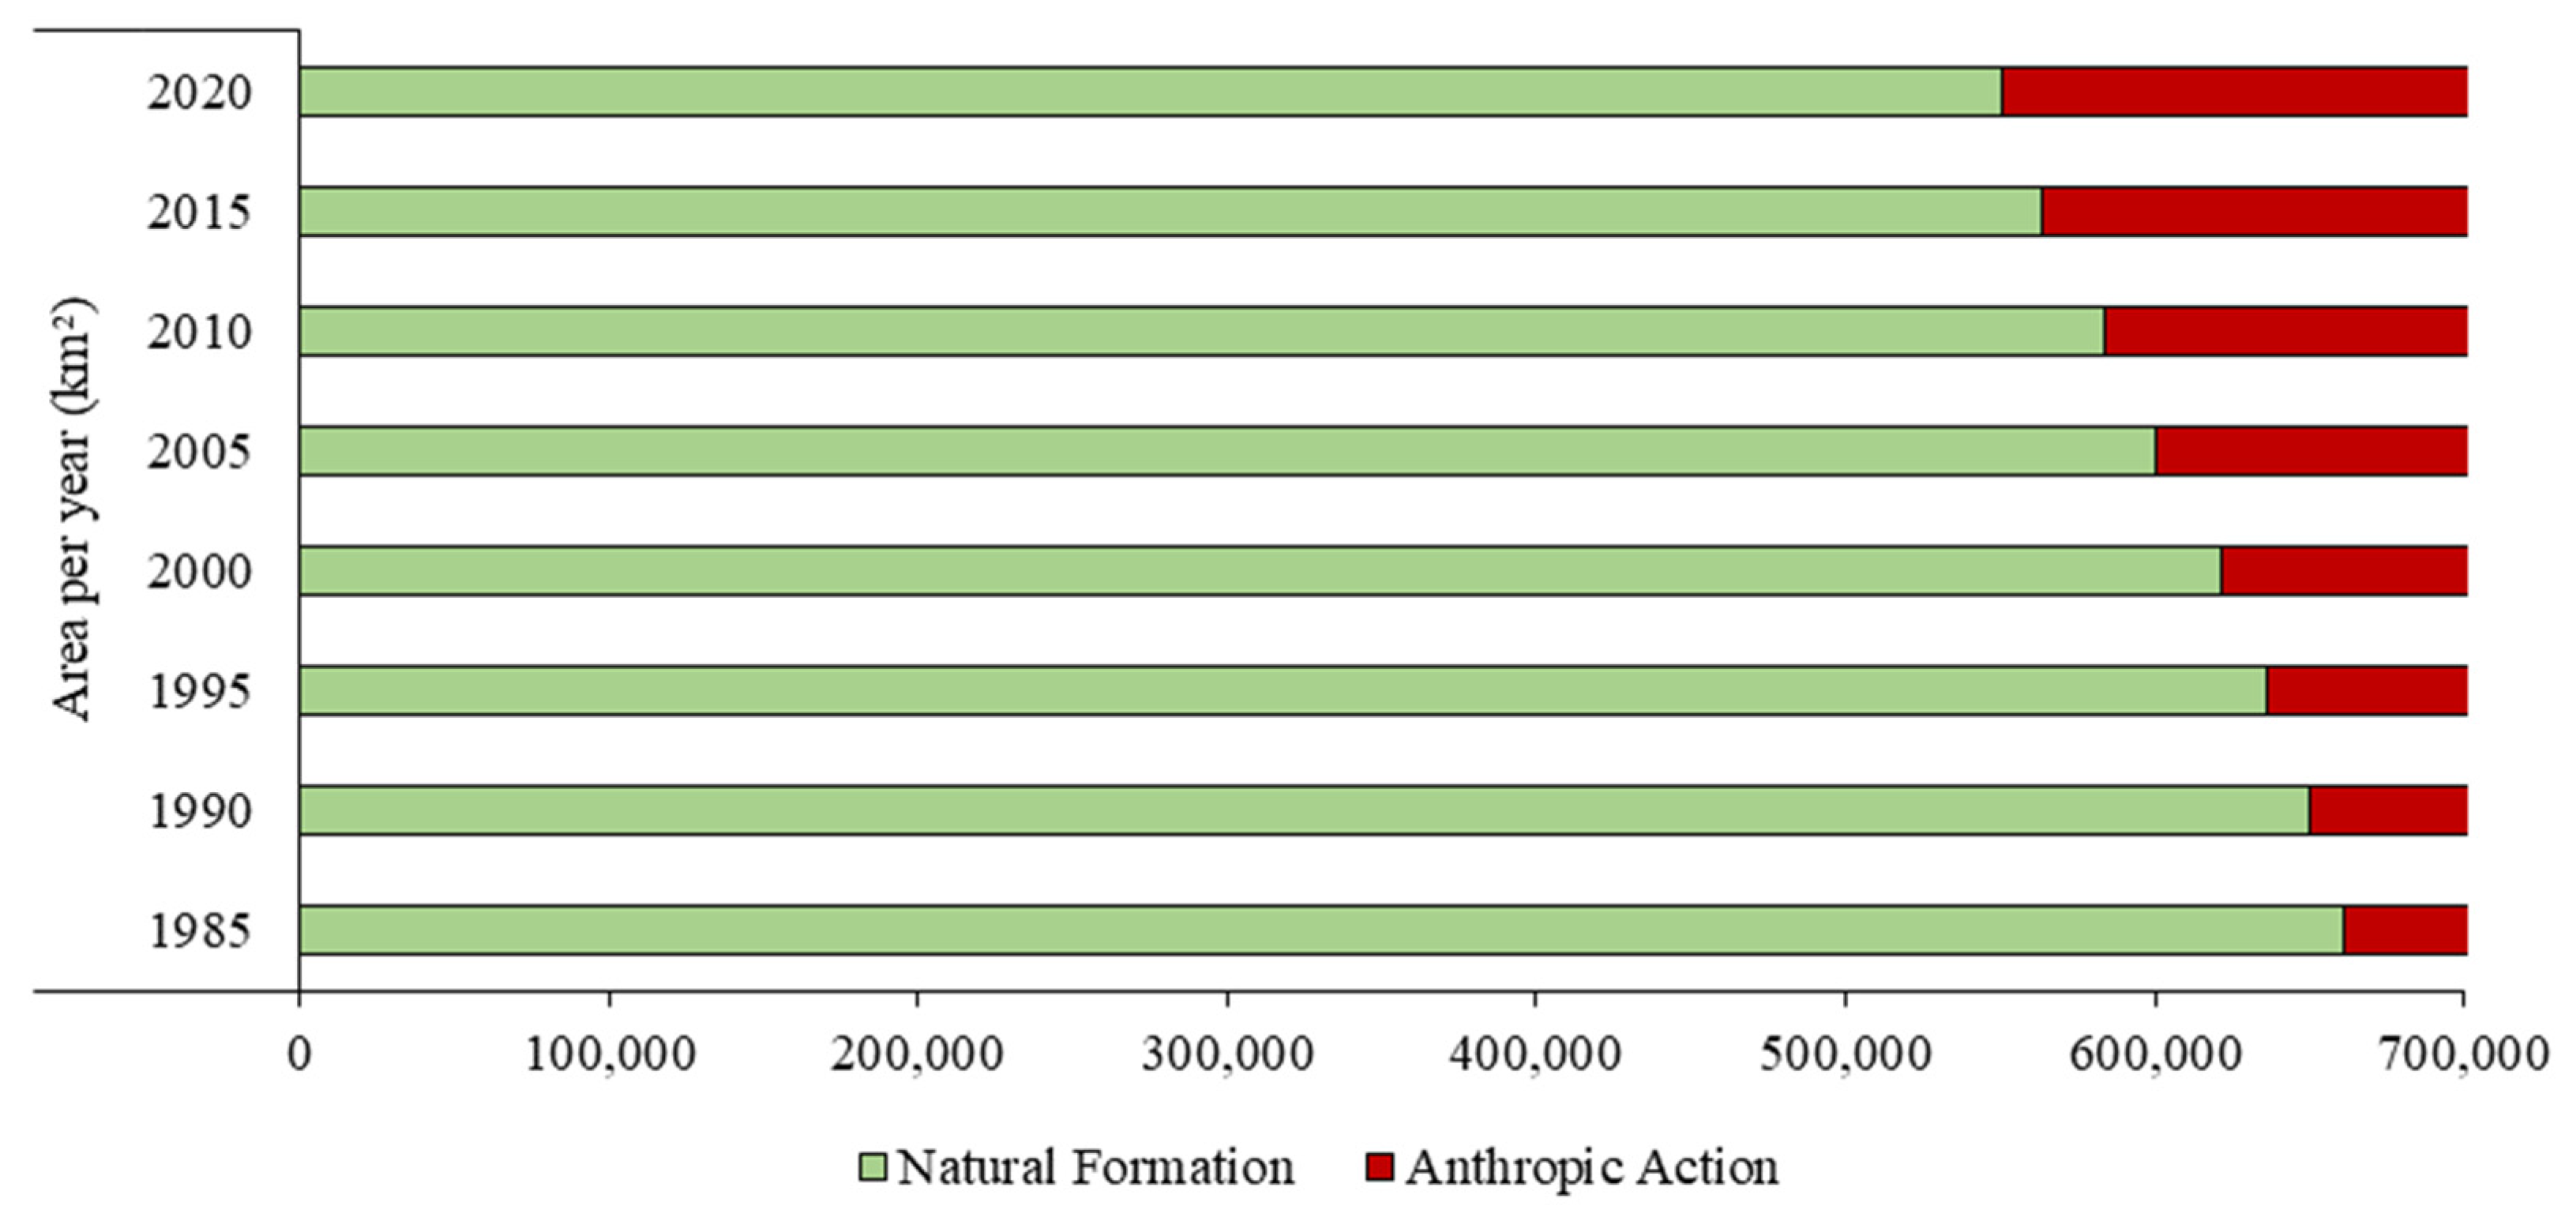
3.2. Land Cover and Land Use Analysis

The region of Matopiba has suffered intense transformations in its land cover and land use over 35 years (Figure 3), emphasizing the reduction in forest and savannah areas due to the increase in agriculture and cattle raising, particularly soybean cultivation. In 1985, the areas with vegetation (forest, savannah, and other forest formations) in Matopiba totaled approximately 534,000 km2; in 2020, this figure was around 443,000 km2. Agricultural activities in Matopiba (except soybean planting, which was evaluated separately) occupied an area of 84,000 km2 in 1985. In 2000, it grew by 34,000 km2, totaling 118,000 km2. In 2020, they occupied a total of 152,000 km2. This increase occurred mainly in western Tocantins, central Maranhão, and western Maranhão.
The soybean, the main cultivation of Matopiba in 1985, occupied a territory of 42 km2. In 2000, the soybean area in the region amounted to around 5000 km2. With increased growth in the region, in 2020, soybean production covered an area of 41 thousand km2 in Matopiba. The largest cultivation production in 2020 was in the extreme west of Bahia, in the south of Maranhão, and in the southwest of Piauí. In 1985, the area natural formation in Matopiba was around 661 thousand km2, and in 2020, it totaled approximately 550 thousand km2. In other words, this is an increase of nearly 111 thousand km2 of anthropic actions in the areas of natural formations over 35 years in Matopiba’s region (Figure 4).
To analyze the alterations in the vegetal coverage due to the elevation of anthropic action over 35 years in the vicinities of the meteorological stations in Matopiba’s region, buffers of 60 km were established within each geographical point of the 22 stations, quantified by the images of MapBiomas and reclassification according to Table 2 (Figure 5). In 1985 and 2020, the station’s vicinity in Bacabal, the center of Maranhão, presented the largest area of anthropic action of all the areas analyzed. The buffer with the least area of anthropic action in 1985 was in the vicinity of Chapadinha’s station, west of Maranhão. In 2020, the station’s vicinity in Caxias showed the smallest area of anthropic action. Over the 35 years analyzed, the buffer that suffered the largest alteration in land cover and land use was around Taguatinga, to the east of the Tocantins station.

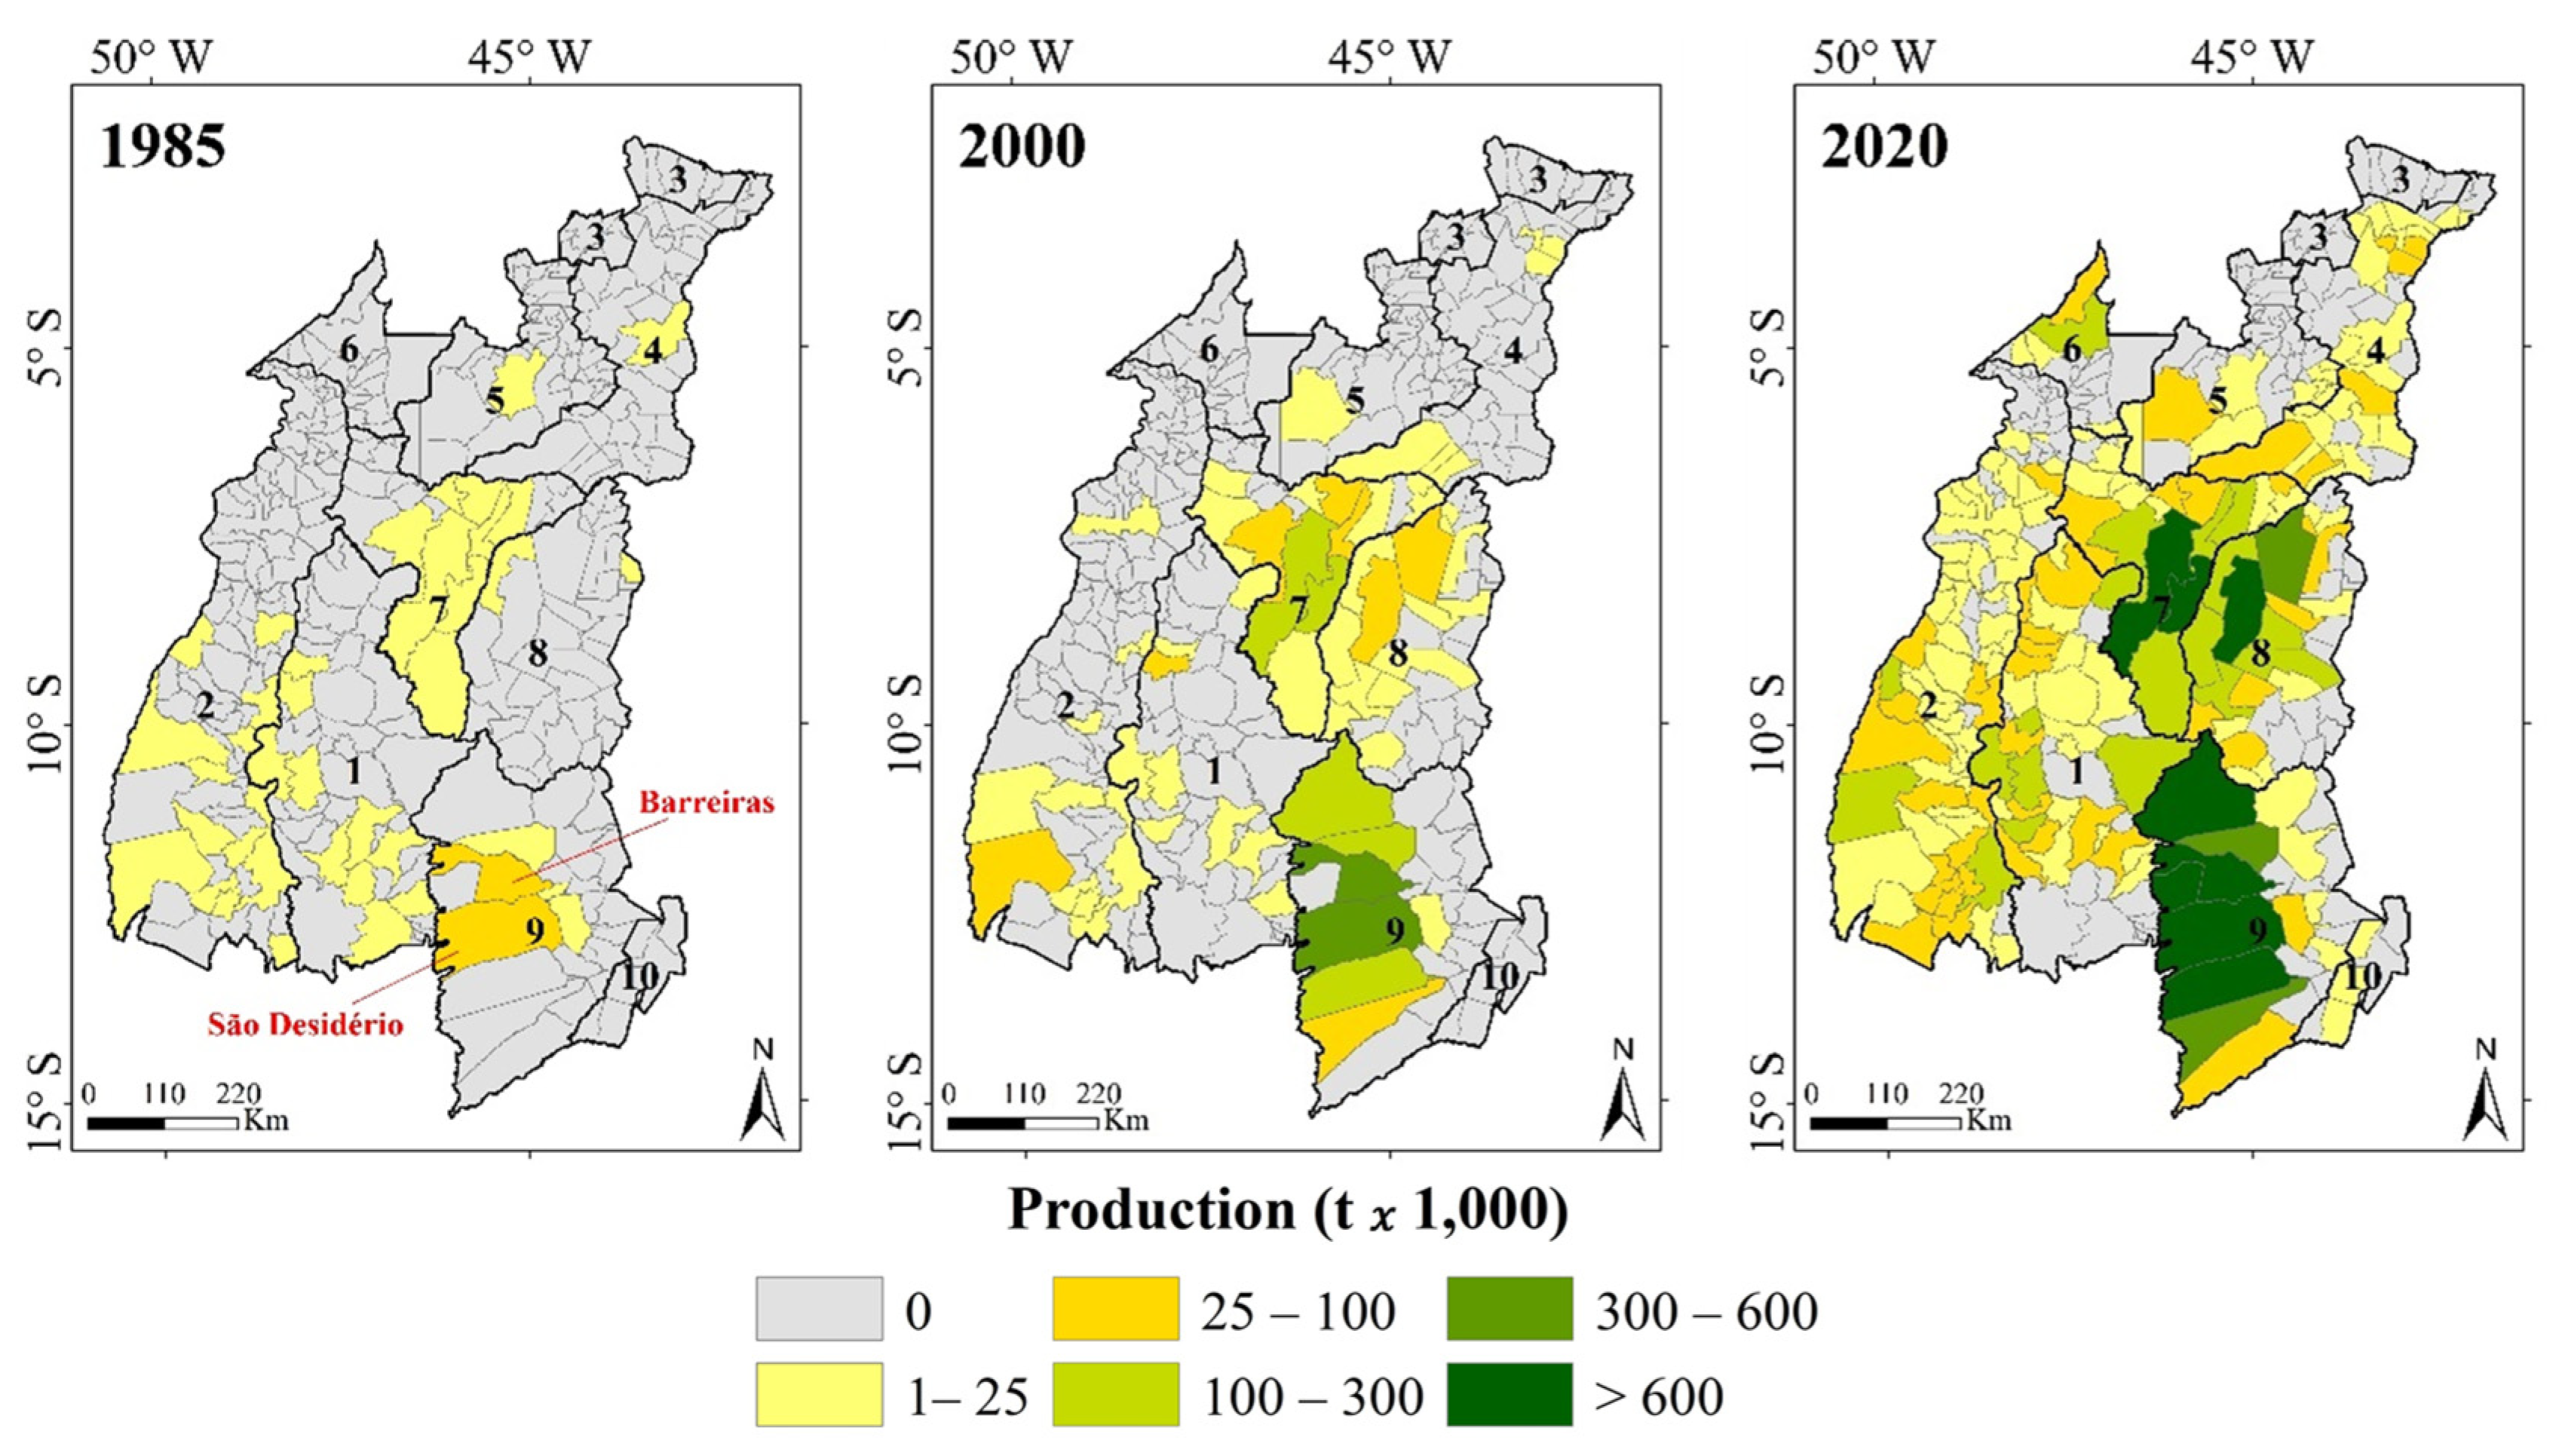
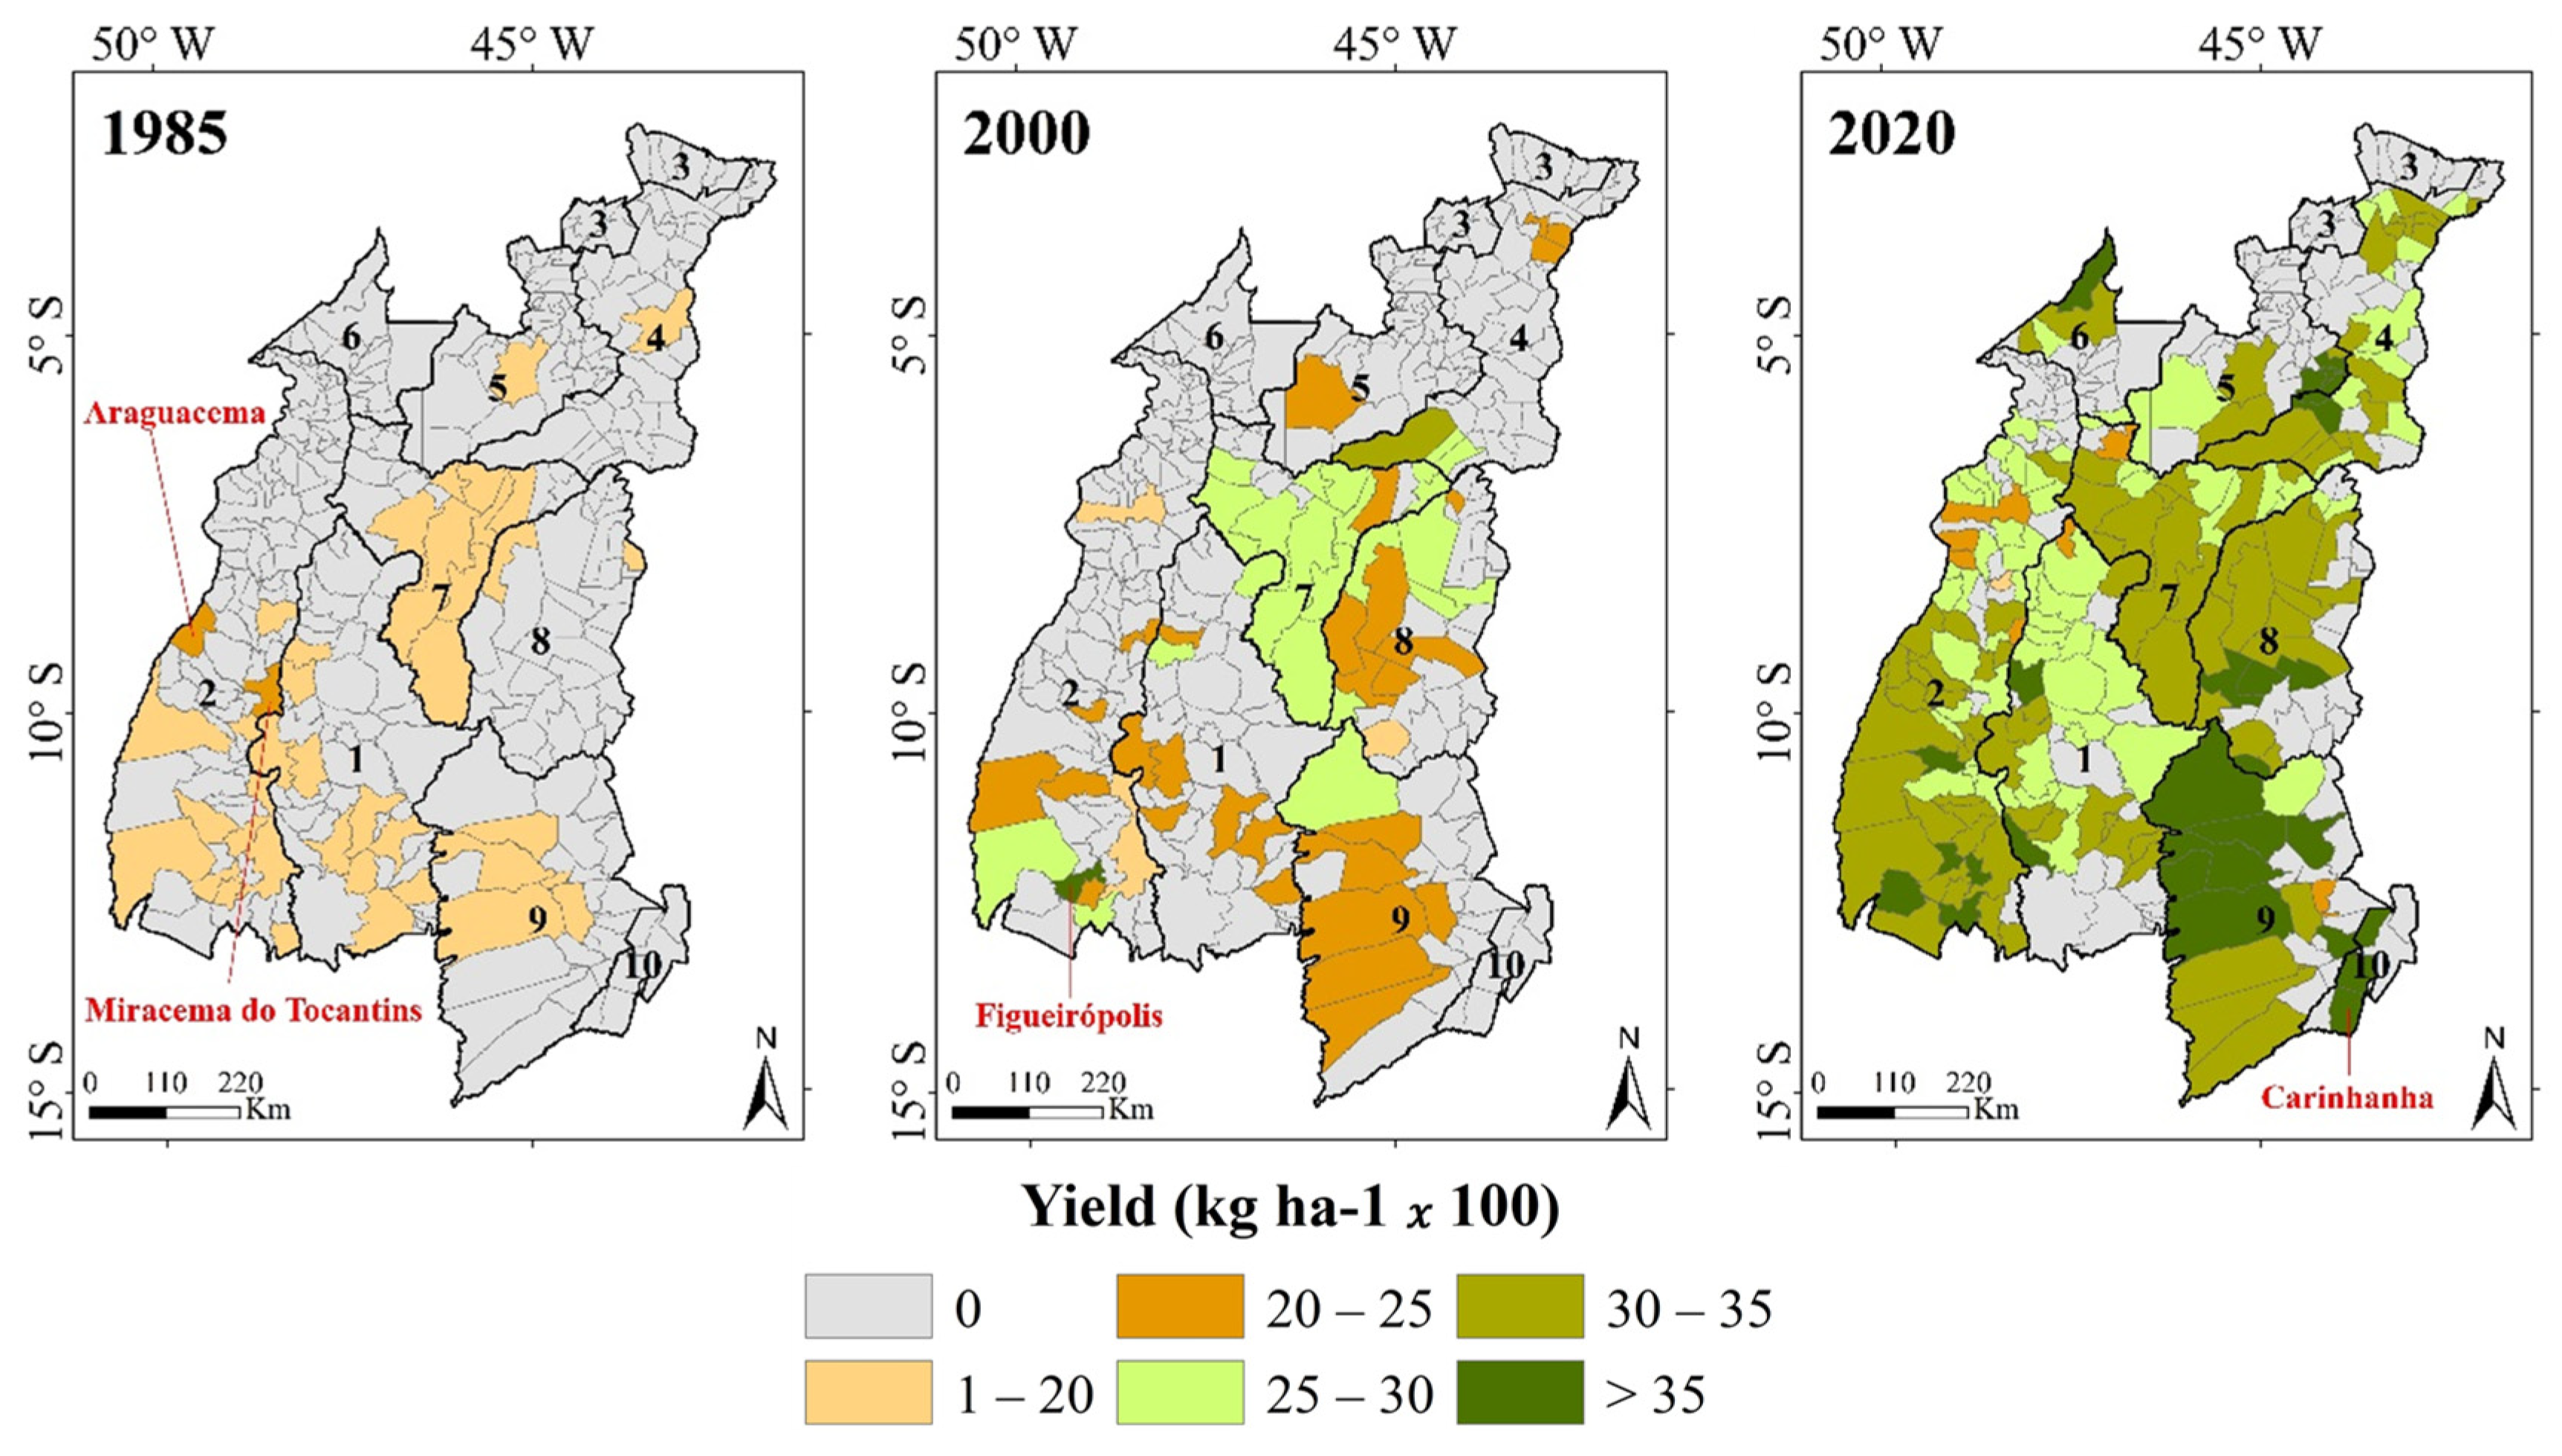
3.3. Agricultural Analysis

The agricultural data of soybean production and yield demonstrate an expansion of this cultivation in Matopiba during the temporal series analyzed (1985 to 2020) (Figure 6 and Figure 7, respectively). Soybean production added up to 143,792 tons in 1985. In 2000, the production of soybeans was 2,208,221 tons. In 2020, the production of soybeans was 14,331,294 tons. In 1985, the greatest production of soybeans was in the cities of Barreiras and São Desidério, respectively, in the extreme west of Bahia. Later on, an expansion in soybean production in the south and north directions was noted; this was between the extreme west of Bahia, the south of Maranhão, and the southwest of Piauí, the current prominent mesoregions in soybean production in Matopiba. In 2016, a fall of approximately 3.8 million tons occurred in the agricultural production of soybeans compared to the year 2015, which was also observed with less intensity in the years 1987, 1990, 1996, 2006, 2009, 2013, and 2019 when compared to previous years.
At the beginning of the temporal series, in 1985, the soybean yield in Matopiba was 56,861 kg ha−1. In summary, the cities Araguacema (2099 kg ha−1) and Miracema do Tocantins (2040 kg ha−1) are located in the west of Tocantins. In 2020, at the end of the temporal series analyzed, the total yield of soybeans was 581,760 kg ha−1. In particular, the city Figueirópolis (4000 kg ha−1) is in the west of Tocantins. The mesoregions in the extreme west of Bahia and Valley São-Franciscano da Bahia had an elevated yield in comparison to other mesoregions of Matopiba, with a maximum value in the city of Carinhanha (4133 kg ha−1).
The application of the Mann–Kendall test to the temporal series from the agricultural data of production and yield of soybean cultivation during the period from 1985 to 2020 indicated a significant increasing trend (p ≤ 0.05) in two variables through the following years, resulting in 15 of the 22 cities considered (Table 6). The cities of Bom Jesus da Lapa, Sta. Rita de Cássia, Barra do Cora, and Taguatinga did not present Mann–Kendall trends with significance (p ≤ 0.05). According to IBGE’s data, the cities of Bacabal, Imperatriz, and Vale do Nogueira were not considered in the analysis because they did not produce soybeans [44]. In particular, the city of Porto Nacional, located in the mesoregion in the east of Tocantins, has the greatest trend of elevation in the efficiency of agricultural production per unit of cultivated area.

3.4. Relationship between Climate, Agricultural, Land Cover and Land Use Changes and Ocean–Atmosphere Anomalies

Table 7 presents the Pearson coefficient (r) obtained through the correlation between the climate change trends and agricultural results and land cover and use in the buffers around the meteorological stations in Matopiba. The values in bold represent a significance p ≤ 0.05 in probability. The analyses were carried out in 15 localities with a trend of increasing agricultural production (cities, meteorological stations, and their respective buffers); in other words, the analyses were carried out in localities that presented a significant trend in the production and yield of soybean cultivation (Table 6).
The maximum temperature trends presented a significant positive correlation (p ≤ 0.05) with the natural formation and a negative correlation with anthropic action in 1985 and 2020 in the buffers of the meteorological stations in Matopiba. The observed correlation does not necessarily imply a causal relation. It is important to highlight that the correlated areas were the 60 km buffers near the INMET’s conventional meteorological stations. To guarantee the trustworthiness of the climate measurements, the INMET defines a series of rigorous standards for the installment and monitoring of the stations, including the absence of anthropic interferences in the surroundings, a crucial factor that can compromise the quality and precision of the collected data. By minimizing anthropic influences, obtaining more precise data about the natural climate conditions is possible, facilitating the comprehension and prediction of the climate.
The correlations between the climate change trends and the averages and agricultural trends observed in soybean production and yield did not show a significance p ≤ 0.05 for the probability. The trends observed in the climate alterations identified do not have a strong linear relation with agricultural production and yield in those locations. The absence of a significant correlation can be explained by intermediate factors, such as genetic and technological improvements in the region of Matopiba, which, through the years, minimized the effects of climate alterations in the region’s agriculture.
Table 8 illustrates the Pearson correlation (r) obtained between the total annual production and yield of soybeans in the cities of Matopiba and the Multivariate El Niño Index (MEI), Pacific Decadal Oscillation (PDO) and Atlantic Multi-decadal Oscillation (AMO). The analysis indicated a positive and significant correlation (p ≤ 0.05) between the AMO and the soybean agricultural data. That is to say, when the AMO is in a positive phase, with the temperatures from the North Atlantic higher than average, soybean production and yield rise due to the larger availability of water for cultivation and milder temperatures. There was no correlation p ≤ 0.05 between the agricultural variables of soybeans and the indexes of PDO and MEI, which the adaptation and climate resilience of farmers involved in soybean cultivation in the region can explain; this is also explained by the great territorial extension of Matopiba, which allows distinct results to be obtained in years with El Niño. For example, the areas to the north of Matopiba tend to have a more accentuated reduction in precipitation, while areas to the south tend to have a smaller reduction in precipitation.

4. Discussion

Studies about climate change are crucial to decision- making in local, regional, and global agricultural planning and development. Knowledge of the patterns and trends of climate variables, such as precipitation and temperature, is essential to analyze the yield of cultivations through time. Many studies have demonstrated that the climate on Earth has changed at many scales [5]. Through a set of data analyzed by a dense network of observations, the results clearly show that our planet is warming [5,52]. The changes in temperature and precipitation represent just a few primary indicators of climate change, but they significantly affect society [7]. Therefore, the analyses carried out in this study highlight climate change and its relationship with soybean production and yield, and the spatiotemporal dynamics of human activities, such as land cover change, provide important information for the development of agriculture in Matopiba, especially for environmentally sustainable development.
Temperature elevation has many effects on agriculture; it causes an increase in the evapotranspiration rate, meaning that the cultivation needs higher water consumption, and also a reduction in the cycle of cultivation, making the plants more sensitive to water shortages [53]. Sandy-textured soils, with low hydro-disponibility, are more prone to the impacts of temperature elevations, which leads to intense worry about the regions in northeast Brazil. For the development of soybeans in Brazil, the ideal temperature is 30 °C, with excellent conditions between 20 °C and 30 °C [54]. Their development is low or null in temperatures low or equal to 10 °C; low temperatures can provoke delays in different cultivation phases [55].
Temperatures higher than 40 °C cause losses in flowering and reduce plants’ aptitude for pod retention, which can provoke earlier blooming, disturbances in fructification, and the ripening of soybean grains, leading to reductions in production. Water shortage during the blooming and grain filling periods causes physiological alterations in the plant, like stomatal closure, leaf entangling, and early leaves, flowers, and pod drop, leading to a reduction in grain yield [54]. The Brazilian Agricultural Research Corporation (EMBRAPA), created to create technological models for agriculture and livestock farming in the country, has launched around 50 soybean varieties for the Cerrado in its different soil and climate regions over the last 30 years, with characteristics such as precocity, a high production potential, hardiness, resistance to cyst and gall nematodes, or resistance to diseases and insects [56]. The yield of a crop is directly related to the interaction between the management of its production, the plant’s genotype, and agroclimatic factors.
EMBRAPA has launched a soybean cultivar that meets the needs of western Bahia and the other areas of Matopiba. The cultivar tolerates climate variations and potentially reaches high productivity even in regions with frequent summers. The short periods of drought during rainy seasons damage soybean development, leading to losses for farmers [57]. Analyzing climate trends helps researchers study genetic and technological improvements in agricultural cultivation. It is also possible to observe the adaptation and resilience of farmers in the Matopiba region in terms of production and soybean yield, where there is a trend toward agricultural growth in a climate change scenario.
Matopiba is considered one of the last agricultural frontiers of Brazil. The production of grains in the region represents 13% of the total production in Brazil [10], with soybean being the main agricultural cultivation in Matopiba [19]. According to Araújo et al. [17], the Matopiba region showed a significant growth in soybean production during the space–time dynamics analyzed (1990–2015). The authors observed that the production and yield of soybeans follow spatial patterns that reflect the local and regional aptitude for cultivation. The most productive zones were located in the extreme west of Bahia, the south of Maranhão, and the southwest of Piauí [17]. This agrees with the results observed in the current study, which verified agricultural growth trends in the cities of Barreiras, Correntina, Balsas, Alto Parnaíba, and Carolina e Bom Jesus do Piauí, located in the mesoregions mentioned by the authors Araújo et al. [17].
The present study concluded that, in 2020, the mesoregions in the extreme west of Bahia and Valley São-Franciscano da Bahia were outstanding in the yield of soybean cultivation. This was also observed in a study conducted by the EMBRAPA, which noted that between the harvest of 2011/2012 and 2017/2018, there was an increase of 99% in soybean production in Bahia caused by the expansion of the area (43.7%) and the record yield obtained in the harvest from 2017/2018 (3.960 kg ha−1), a result assigned especially to the favorable climate conditions, the geography of the extreme west of Bahia and the adaptation of technology to edaphoclimatic conditions [58]. In a climate change scenario, improving technological packages offers many benefits, such as minimizing the risk of climate change and intensifying land usage more efficiently and sustainably [11]. According to Hirakuri et al. [59], technologies more adapted to the local reality of Matopiba are necessary due to the edaphoclimatic characteristics of the region. Studies about climate changes in areas of intense agricultural activities help adapt cultures, food production, and the preservation of environmental areas [60].
Chou et al. [61] simulated some scenes of climate change throughout northeastern Brazil. In one of those scenes, a reduction in precipitation was noticed, a result that agrees with the present study. Silva et al. [47] analyzed the climate trends of precipitation and temperature in the state of Maranhão through the Mann–Kendall test. The results showed an evaluation of the temperature in all meteorological stations in the state. Reis et al. [34] also observed evidence of an increase in the temperature of Matopiba’s region. Salvador and Brito [62] analyzed the temperature variabilities in the Matopiba region through climate extremes indexes. They observed a significant warming process during the last three decades, with a higher frequency of hotter days in most of the analyzed stations. Such results corroborate with the ones found in this research, in which all the stations in Matopiba presented significant trends of elevation in the maximum temperature.
The decision to use the Mann–Kendall test and Pearson’s correlation coefficient (r) was based on the need for an initial analysis of trends and the correlation between variables, being a preliminary stage for future studies that may employ more sophisticated models [63,64,65,66]. It was also based on their applicability and research into other variables, such as air humidity and soil moisture reserves. Soil water availability is more influential for plant growth than precipitation and temperature, and there is ecophysiological evidence of the use of intermediate conditions for maximizing crop yields [18].
Studies of annual and intra-annual climate trends in the region of Matopiba are scarce, though relevant. Analyzing the intra-annual dynamics of climate change is very important for agricultural farmers in decision making, especially when undertaking the monthly agricultural calendar of cultivations [67]. In Matopiba, it is common for agricultural production to be realized through the intercalation of other cultivation to secure higher gains for the farmer, especially due to the seasonality of cultivations. According to Pino [68], the climatic changes during the agricultural seasons influence the supply of cultivars and the price of different levels of marketing, causing a deficiency in the demand required by the market, importation costs, and an overload of transportation infrastructure. Therefore, knowledge of intra-annual trend data is important so that cultivars can reach optimal levels regarding the genetic potential of production and agricultural yield.
The interaction between the ocean and atmosphere is fundamental to Earth’s climate. Comprehending the impact of these interactions is crucial for facing the challenges of climate change and guaranteeing the processes of minimization. Studies show that the El Niño Southern Oscillation phenomenon and variability in the temperature on the surface of the Tropical Atlantic Sea have a fundamental role in the alternation between dry and rainy years, as well as in the spatial coverage of drought in the Brazilian Northeast [69,70,71,72]. According to Reis et al. [34], the precipitation in Matopiba is modulated by the occurrence of atmospheric systems at different scales allied to a set of ecosystem and physiographic factors (transition between Amazon and semiarid). The present study identified that the positive phases of the Atlantic Multi-decadal Oscillation (AMO) favor production growth and soybean yield, especially because of the elevation in precipitation in the region. Marengo and Souza [73] observed that the most recent droughts in 2005, 2010, and 2016 were associated with the North Tropical Atlantic Ocean, and only the 2016 drought occurred in a year under the influence of El Niño.
Changes in land cover and use, which also include agricultural practices, are a major environmental issue and are considered a relevant component in the process of global climate change. The interactions between landscape transformation and the various consequences of land cover and land use dynamics threaten ecosystem services’ sustainability at local, regional, national, and global scales. These include, for example, changes in climate, the loss of soil fertility, environmental pollution, the urban heat island effect, habitat loss, desertification, etc. Also, agricultural practices and climate change have altered land cover and land use worldwide [11]. In other words, monitoring and relating land cover and use over the years, agricultural advancement, and climate change provide valuable information [7]. Spatiotemporal dynamics have been studied in different regions to assess changes in the climate and their relationship to human and natural processes of land cover and use [7,10]. This helps scientists predict and mitigate the impacts of climate change on various human activities, such as agriculture.
Advanced agricultural practices, such as efficient irrigation and adequate land management, help minimize the negative impact of climate change and keep production and yield elevated even in adverse conditions. Besides this, the continuous research and development of cultivation varieties resistant to hydric stress and climate variations will contribute to the region’s adaptation and the resilience of agriculture. Therefore, constructing a set of data about variables related to climate and agricultural production at a more precise scale of spatial aggregation is essential to directly evaluate the impact of climate changes on agriculture and the adaptation and climate resilience of agricultural cultivations. The results of this study contribute significantly to the comprehension of climate change processes and their possible effects on the production and agricultural yield of soybean cultivation in the Matopiba region. This analysis, based on evidence, provides a basis for developing efficient policies related to climate change. It helps minimize the adverse impacts of climate changes on environmental, agricultural, and socioeconomic processes.

5. Conclusions

Climate change could be seen in the Matopiba region by applying the Mann–Kendall trend test to the precipitation, maximum temperature, and minimum temperature variables. It was possible to conclude that there was an increase in temperature in the Matopiba region and a decrease in rainfall. Land cover and use in the region has undergone intense changes, mainly due to the reduction in forest and savannah areas over 35 years (1985–2020). In particular, there has been an increase in agricultural activity, mainly due to the cultivation of soybeans.
The climatic trends of rainfall and temperature in the Matopiba region were not related to the production and yield of the soybean crop. This result can be explained by the region’s constant genetic and technological improvements, which make farmers more adaptable and resilient to climate change. The results obtained are essential for agricultural producers, especially for constructing the agricultural calendar of crops, as well as for researchers interested in the genetic improvement of cultivars for the optimization of agricultural production potential.
Consequently, we encourage future studies to monitor the evolution of climate trends continuously. New weather stations should have their trends analyzed, and some trends can be reversed with mitigation measures. It is also recommended that crop varieties adapted to Matopiba’s conditions continue to be developed and that a comprehensive data set on climate variables, such as air humidity and soil moisture reserves, is built for a more complete assessment of crop growth conditions. This is also for the analysis of other agricultural commodities, such as corn.
Regional and local environmental and agricultural planning requires knowledge of spatiotemporal climate changes to maintain high crop production and yields over time. Therefore, the analyses carried out in this study show the climate adaptation and resilience of soybean production and yield in the Matopiba region and provide important information for the development of agriculture in the region. This is in addition to contributing to new research and analysis in the environmental, water, social, and economic domains in a region of global interest.

Author Contributions

Conceptualization, M.L.S.d.A., I.A.A.R. and F.B.S.; Methodology, M.L.S.d.A., I.A.A.R., F.B.S., H.C.d.B. and J.R.N.S.; Validation, M.L.S.d.A.; Formal analysis, M.L.S.d.A., I.A.A.R., F.B.S., H.C.d.B. and J.R.N.S.; Investigation, M.L.S.d.A., I.A.A.R., F.B.S., H.C.d.B. and J.R.N.S.; Resources, I.A.A.R. and F.B.S.; Data curation, M.L.S.d.A. and H.C.d.B.; Writing—original draft, M.L.S.d.A. and H.C.d.B.; Writing—review & editing, M.L.S.d.A., I.A.A.R., F.B.S. and H.C.d.B.; Visualization, M.L.S.d.A., I.A.A.R. and F.B.S.; Supervision, I.A.A.R. and F.B.S. All authors have read and agreed to the published version of the manuscript.

Funding

The first author was supported by Brazilian Coordination for the Improvement of Higher Education Personnel (CAPES)—Finance Code 001 during part this study; the second and fourth authors were funded by National Council of Scientific and Technological Development—Brazil (CNPq) [grant numbers 313147/2020-5,140038/2022-1].

Institutional Review Board Statement

Not applicable.

Informed Consent Statement

Not applicable.

Data Availability Statement

Data are contained within the article.

Acknowledgments

The authors are grateful to Universidade Ceuma for providing the infrastructure necessary for conducting the research, through the use of their Geotechnology Laboratory.

Conflicts of Interest

The authors declare no conflicts of interest.

References

  1. Abrahams, D. Conflict in abundance and peacebuilding in scarcity: Challenges and opportunities in addressing climate change and conflict. World Dev. 2020, 132, 104998. [Google Scholar] [CrossRef]
  2. IPCC—Intergovernmental Panel on Climate Change. Summary for Policymakers; IPCC: Genebra, Switzerland, 2020; pp. 1–41. [Google Scholar]
  3. Muluneh, A. Impact of climate change on soil water balance, maize production, and potential adaptation measures in the Rift Valley drylands of Ethiopia. J. Arid Environ. 2020, 179, 104195. [Google Scholar] [CrossRef]
  4. IPCC—Intergovernmental Panel on Climate Change. Summary for Policymakers. In Climate Change 2022: Impacts, Adaptation and Vulnerability. Contribution of Working Group II to the Sixth Assessment Report of the Intergovernmental Panel on Climate Change; IPCC: Cambridge, UK; New York, NY, USA, 2022; pp. 3–33. [Google Scholar]
  5. IPCC—Intergovernmental Panel on Climate Change. Summary for Policymakers. In Climate Change 2021: The Physical Science Basis. Contribution of Working Group I to the Sixth Assessment Report of the Intergovernmental Panel on Climate Change; IPCC: Cambridge, UK; New York, NY, USA, 2021; pp. 3–32. [Google Scholar]
  6. Dai, S.; Shulski, M.D.; Hubbard, K.G.; Takle, E.S. A spatiotemporal analysis of Midwest US temperature and precipitation trends during the growing season from 1980 to 2013. Int. J. Climatol. 2016, 36, 517–552. [Google Scholar] [CrossRef]
  7. Santos, C.A.C.; Neale, C.M.U.; Mekonnen, M.M.; Gonçalves, I.Z.; Oliveira, G.; Ruiz-Alvarez, O.; Safa, B.; Rowe, C.M. Trends of extreme air temperature and precipitation and their impact on corn and soybean yields in Nebraska, USA. Theor. Appl. Climatol. 2022, 147, 1379–1399. [Google Scholar] [CrossRef]
  8. Rana, I.A. Disaster and climate change resilience: A bibliometric analysis. Int. J. Disaster Risk Reduct. 2020, 50, 101839. [Google Scholar] [CrossRef]
  9. Feldmeyer, D.; Nowak, W.; Jamshed, A.; Birkmann, J. An open resilience index: Crowdsourced indicators empirically developed from natural hazard and climatic event data. Sci. Total Environ 2021, 774, 145734. [Google Scholar] [CrossRef]
  10. Silva, W.K.M.; Medeiros, S.E.L.; da Silva, L.P.; Coelho, L.M., Jr.; Abrahão, R. Sugarcane production and climate trends in Paraíba state (Brazil). Environ. Monit. Assess. 2020, 192, 392. [Google Scholar] [CrossRef] [PubMed]
  11. Dou, Y.; Silva, R.F.B.; Batistella, M.; Torres, S.; Moran, E.; Liu, J. Mapping crop producer perceptions: The role of global drivers on local agricultural land use in Brazil. Land Use Policy 2023, 133, 106862. [Google Scholar] [CrossRef]
  12. Murray, A.B.; Lazarus, E.; Ashton, A.; Baas, A.; Coco, G.; Coulthard, T.; Fonstad, M.; Haff, P.; McNamara, D.; Paola, C.; et al. Geomorphology, complexity and emerging science of the earth’s surface. Geomorphology 2009, 103, 496–505. [Google Scholar] [CrossRef]
  13. Harden, C.P.; Chin, A.; English, M.R.; Fu, R.; Galvin, K.A.; Gerlak, A.K.; McDowell, P.F.; McNamara, D.E.; Peterson, J.M.; Poff, N.L.; et al. Understanding human-landscape interactions in the “Anthropocene”. Environ. Manag. 2014, 53, 4–13. [Google Scholar] [CrossRef] [PubMed]
  14. Lupinacci, C.M.; Conceição, F.T.; Paschoal, L.G. Geomorphic responses due to the second-largest global producer of ceramic tiles in the State of São Paulo, Brazil. Catena 2022, 218, 106550. [Google Scholar] [CrossRef]
  15. Curtis, P.G.; Slay, C.M.; Harris, N.L.; Tyukavina, A.; Hansen, M.C. Classifying drivers of global forest loss. Science 2018, 361, 1108–1111. [Google Scholar] [CrossRef] [PubMed]
  16. Ward, F.A. Enhancing climate resilience of irrigated agriculture: A review. J. Environ. Manag. 2022, 302, 114032. [Google Scholar] [CrossRef] [PubMed]
  17. Araújo, M.L.S.A.; Sano, E.E.; Bolfe, E.L.; Santos, J.R.N.; Santos, J.S.; Silva, F.B. Spatiotemporal dynamics of soybean crop in the Matopiba region, Brazil (1990–2015). Land Use Policy 2019, 80, 57–67. [Google Scholar] [CrossRef]
  18. Luan, X.; Bommarco, R.; Vico, G. Coordinated evaporative demand and precipitation maximize rainfed maize and soybean crop yields in the USA. Ecohydrology 2023, 16, e2500. [Google Scholar] [CrossRef]
  19. MAPA—Ministério da Agricultura, Pecuária e Abastecimento. Projeções do Agronegócio. Brasil 2015/16 a 2025/26. Projeções de Longo Prazo, 7th ed.; MAPA: Brasília, Brazil, 2016; pp. 1–138. [Google Scholar]
  20. FMI—Fundo Monetário Internacional. International Financial Statistics; FMI: Washington, DC, USA, 2019; Available online: http://www.imf.org/external/datamapper/datasets/IFS (accessed on 20 March 2020).
  21. EMBRAPA—Empresa Brasileira de Pesquisa Agropecuária. Pesquisa, Desenvolvimento e Inovação. Brasil Lidera e é Referência no Desenvolvimento de Tecnologias Sustentáveis para Produção de soja. Embrapa Soja. Available online: https://www.embrapa.br/busca-de-noticias (accessed on 7 February 2024).
  22. Taherzadeh, O.; Caro, D. Drivers of water and land use embodied in international soybean trade. J. Clean. Prod. 2019, 223, 83–93. [Google Scholar] [CrossRef]
  23. Doorenbos, J.; Kassam, A.H. Efeitos da Água no Rendimento das Culturas; FAO: Roma, Italy, 1994; pp. 1–212. [Google Scholar]
  24. Rigo, A.A.; Dahmer, A.M.; Steffens, C.; Steffens, J.; Carrão-Panizzi, M.C. Characterization of soybean cultivars genetically improved for human consumption. Int. J. Food Eng. 2015, 1, 1–7. [Google Scholar] [CrossRef]
  25. De Mattos, E.C.; Márcia Bittar, A.T.U.I.; da Silva, A.M.; Roberto, A.; Ferreira, M.D.N.; dos Santos Soares, J.; Moraes, M.A. Estudo da identidade histológica de subprodutos de soja (Glycine max L.). Rev. Inst. Adolfo Lutz 2015, 74, 104–110. [Google Scholar] [CrossRef]
  26. FAO—Food and Agriculture Organization of the United Nations. CropWat. Available online: http://www.fao.org/land-water/databases-and-software/cropwat/en/ (accessed on 18 February 2021).
  27. CONAB—Companhia Nacional de Abastecimento. Histórico Mensal Soja. Análise Mensal. Soja. Outubro de 2018. Available online: https://www.conab.gov.br/info-agro/analises-do-mercado-agropecuario-e-extrativista/analises-do-mercado/historico-mensal-de-soja (accessed on 7 April 2022).
  28. CONAB—Companhia Nacional de Abastecimento. Com Novo Recorde, Produção de Grãos na Safra 2022/23 Chega a 3228 Milhões de Toneladas. Available online: https://www.conab.gov.br/ultimas-noticias/5157-com-novo-recorde-producao-de-graos-na-safra-2022-23-chega-a-322-8-milhoes-de-toneladas (accessed on 10 February 2023).
  29. Miranda, E.E.; Magalhães, L.A.; Carvalho, C.A. Proposta de Delimitação Territorial do Matopiba; Embrapa, Nota técnica GITE: Campinas, Brazil, 2014; pp. 1–18. [Google Scholar]
  30. Santos Filho, J.I.S.; Talamini, D.J.D.; Scheuermann, G.N.; Bertol, T.M. Potencial do Matopiba na produção de aves e suínos. Rev. Polít. Agríc. 2016, 25, 90–102. [Google Scholar]
  31. Anderson, M.C.; Zolin, C.A.; Sentelhas, P.C.; Hain, C.R.; Semmens, K.; Yilmaz, M.T.; Gao, F.; Otkin, J.A.; Tetrault, R. The evaporative stress index as an indicator of agricultural drought in Brazil: An assessment based on crop yield imapcts. Remote Sens. Environ. 2016, 174, 82–99. [Google Scholar] [CrossRef]
  32. EMBRAPA–Empresa Brasileira de Pesquisa Agropecuária. Macrozoneamento Ecológico-Econômico do Estado do Maranhão; Embrapa Monitoramento por Satélite: Campinas, Brazil, 2013; pp. 1–448. [Google Scholar]
  33. Bolfe, E.; Victória, D.; Contini, E.; Bayma-Silva, G.; Spinelli-Araújo, L.; Gomes, D. MATOPIBA em crescimento agrícola: Aspectos territoriais e socioeconômicos. Rev. Polít. Agríc. 2016, 25, 38–62. [Google Scholar]
  34. Reis, L.C.; Silva, C.M.S.; Bezerra, B.G.; Mutti, P.R.; Spyrides, M.H.C.; Silva, P.E. Analysis of climate extreme indices in the MATOPIBA region, Brazil. Pure Appl. Geophys. 2020, 177, 4457–4478. [Google Scholar] [CrossRef]
  35. Asewar, B.; Jagtap, M.; Shinde, G.; Mehetre, S.; Pendke, M. Climate-Resilient Technologies for Enhancing Productivity of Soybean in India. In Soybean-Recent Advances in Research and Applications; IntechOpen: London, UK, 2022; pp. 1–284. [Google Scholar]
  36. MacCarthy, D.S.; Traore, P.S.; Freduah, B.S.; Adiku, S.G.K.; Dodor, D.E.; Kumahor, S.K. Productivity of soybean under projected climate change in a semi-arid region of West Africa: Sensitivity of current production system. Agronomy 2022, 12, 2614. [Google Scholar] [CrossRef]
  37. MAPA—Ministério da Agricultura, Pecuária e Abastecimento. Projeções do Agronegócio. Brasil 2022/23 a 2032/33. Projeções de Longo Prazo; MAPA: Brasília, Brazil, 2023; pp. 1–108. [Google Scholar]
  38. IBGE–Instituto Brasileiro de Geografia e Estatística. Mapas. Rio de Janeiro: IBGE. Available online: http://mapas.ibge.gov.br/tematicos (accessed on 28 March 2022).
  39. Magalhães, L.A.; Miranda, E.E. MATOPIBA: Quadro Natural; Embrapa, Nota Técnica GITE: Campinas, Brazil, 2014; pp. 1–41. [Google Scholar]
  40. Araújo, M.L.S.A. Dinâmica Espaço-Temporal da Cultura de Soja na Região do Matopiba, Brasil (1990–2015). Master’s Thesis, University of Brasilia, Brasília, Brazil, 2018. [Google Scholar]
  41. INMET—Instituto Nacional de Meteorologia. Boletim Agrometeorológico Mensal. Available online: https://portal.inmet.gov.br (accessed on 4 March 2020).
  42. Arguez, A.; Vose, R.S. The definition of the standard WMO climate normal: The key to deriving alternative climate normal. Bull. Am. Meteorol. Soc. 2011, 92, 699–704. [Google Scholar] [CrossRef]
  43. MapBiomas. Projeto MapBiomas—Coleção 6.0 da Série Anual de Mapas de Cobertura e Uso de Solo do Brasil. Available online: https://mapbiomas.org/download (accessed on 6 July 2021).
  44. IBGE—Instituto Brasileiro de Geografia e Estatística. Sistema IBGE de Recuperação Automática. Banco de Tabelas Estatísticas; IBGE: Rio de Janeiro, Brazil, 2021. Available online: https://sidra.ibge.gov.br/ (accessed on 28 October 2021).
  45. NOAA—National Oceanic and Atmospheric Administration. Physical Sciences Laboratory. Available online: https://psl.noaa.gov/ (accessed on 6 July 2021).
  46. Mann, H.B. Non-parametric test against trend. Econometria 1945, 13, 245–259. [Google Scholar] [CrossRef]
  47. Silva, F.B.; Santos, J.R.N.; Feitosa, F.E.C.S.; Silva, I.D.C.; Araújo, M.L.S.; Guterres, C.E.; Santos, J.S.; Ribeiro, C.V.; Bezerra, D.S.; Neres, R.L. Evidências de mudanças climáticas na região de transição Amazônia-Cerrado no estado do Maranhão. Rev. Bras. Meteorol. 2016, 31, 330–336. [Google Scholar] [CrossRef]
  48. Bačević, N.R.; Pavlović, M.; Rasljanin, I. Trend assessing using Mann-Kendall’s test for Priština meteorological station temperature and precipitation data, Kosovo and Metohija, Serbia. Nat. Sci. 2018, 8, 39–43. [Google Scholar] [CrossRef]
  49. XLSTAT. Software XLSTAT. Available online: https://www.xlstat.com/en/ (accessed on 6 July 2021).
  50. Pearson, K. Notes on the history of correlation. Biometrika 1920, 13, 25–45. [Google Scholar] [CrossRef]
  51. Liu, Y.; Shana, F.; Yue, H.; Wanga, X.; Fan, Y. Global analysis of the correlation and propagation among meteorological, agricultural, surface water, and groundwater droughts. J. Environ. Manag. 2023, 333, 117460. [Google Scholar] [CrossRef]
  52. Bathke, D.J.; Oglesby, R.J.; Rowe, C.M.; Whilhite, D.A. Understanding and Assessing Climate Change: Implications for Nebraska; Lincoln: Detroit, MI, USA, 2014; pp. 1–73. [Google Scholar]
  53. Zhu, X.; Troy, T.J. Agriculturally relevant climate extremes and their trends in the world’s major growing regions. Earth’s Future 2018, 6, 656–672. [Google Scholar] [CrossRef]
  54. EMBRAPA–Empresa Brasileira de Pesquisa Agropecuária. Tecnologias de Produção de Soja—Região Central do Brasil 2014; Embrapa Soja: Londrina, Brazil, 2013; pp. 1–265. [Google Scholar]
  55. Marcos Filho, J. Germinação de Sementes. In Semana de Atualização em Produção de Sementes; Fundação Cargill: Campinas, Brazil, 1986; pp. 11–39. [Google Scholar]
  56. Fagan, E.B.; Rodrigues, J.D.; Ono, E.O.; Teixeira, W.F.; Neto, D.D. Soja: Fisiologia da Produção; Editora Andrei: São Paulo, Brazil, 2020; pp. 1–247. [Google Scholar]
  57. EMBRAPA–Empresa Brasileira de Pesquisa Agropecuária. Soja Tolerante a Veranicos é Lançada na Bahia; Embrapa Cerrados: Brasília, Brazil, 2019; Available online: https://www.embrapa.br/busca-de-noticias/-/noticia/43736399/soja-tolerante-a-veranicos-e-lancada-na-bahia (accessed on 1 April 2022).
  58. EMBRAPA—Empresa Brasileira de Pesquisa Agropecuária. A Evolução da Produção de Soja na Macrorregião Sojícola 4. Embrapa Soja. Available online: https://ainfo.cnptia.embrapa.br/digital/bitstream/item/201375/1/p-25.pdf (accessed on 1 February 2023).
  59. Hirakuri, M.H. Avaliação Econômica da Produção de Soja nos Estados do Paraná e Rio Grande do Sul na Safra 2016/17; Embrapa Soja: Londrina, Brazil, 2017; pp. 1–4. [Google Scholar]
  60. Sentelhas, P.C.; Battisti, R.; Câmara, G.M.S.; Farias, J.R.B.; Hampf, A.; Nendel, C. The soybean yield gap in Brazil–magnitude, causes and possible solutions for a sustainable production. J. Agric. Sci. 2015, 153, 1394–1411. [Google Scholar] [CrossRef]
  61. Chou, S.C.; Lyra, A.; Mourão, C.; Dereczynski, C.; Pilotto, I.; Gomes, J.; Bustamante, J.; Tavares, P.; Silva, A.; Rodrigues, D.; et al. Assessment of climate change over South America under RCP 4.5 and 8.5 downscaling scenarios. Am. J. Clim. Change 2014, 3, 512–525. [Google Scholar] [CrossRef]
  62. Salvador, M.A.; Brito, J.I.B. Trend of annual temperature and frequency of extreme events in the MATOPIBA region of Brazil. Theor. Appl. Climatol. 2018, 133, 253–261. [Google Scholar] [CrossRef]
  63. Gong, L.; Liu, D.; Jiang, L.; Li, X.; Lv, J. Distribution characteristics of climate potential productivity of soybean in frigid region and its response to climate change. Environ. Sci. Pollut. Res. 2022, 29, 7452–7464. [Google Scholar] [CrossRef]
  64. Dai, Y.S.; Huynh, N.Q.A.; Zheng, Q.H.; Zhou, W.X. Correlation structure analysis of the global agricultural futures market. Res. Int. Bus. Financ. 2022, 61, 101677. [Google Scholar] [CrossRef]
  65. Nikolakopoulos, S.; Cator, E.; Janssen, M.P. Extending the Mann–Kendall test to allow for measurement uncertainty. Statistics 2023, 57, 577–596. [Google Scholar] [CrossRef]
  66. Wu, J.; Gu, Y.; Sun, K.; Wang, N.; Shen, H.; Wang, Y.; Ma, X. Correlation of climate change and human activities with agricultural drought and its impact on the net primary production of winter wheat. J. Hydrol. 2023, 620, 129504. [Google Scholar] [CrossRef]
  67. CONAB—Companhia Nacional de Abastecimento. Boletim da Safra de Grãos. Available online: https://www.conab.gov.br/info-agro/safras/graos/boletim-da-safra-de-graos (accessed on 7 February 2024).
  68. Pino, A.F. Sazonalidade na agricultura. Rev. Econ. Agríc. 2014, 61, 63–93. [Google Scholar]
  69. Kayano, M.T.; Andreoli, R.V. Relations of South American summer rainfall interannual variations with the Pacific Decadal Oscillation. Int. J. Climatol. 2007, 27, 531–540. [Google Scholar] [CrossRef]
  70. Marengo, J.; Torres, R.R.; Alves, L.M. Drought in Northeast Brazil—Past, present, and future. Theor. Appl. Climatol. 2017, 129, 1189–1200. [Google Scholar] [CrossRef]
  71. Timmermann, A.; An, S.I.; Kug, J.S.; Jin, F.F.; Cai, W.; Capotondi, A.; Cobb, K.M.; Lengaigne, M.; McPhaden, M.J.; Stuecker, M.F.; et al. El Niño—Southern Oscillation complexity. Nature 2018, 559, 535–545. [Google Scholar] [CrossRef] [PubMed]
  72. Utida, G.; Cruz, F.W.; Etourneau, J.; Bouloubassi, I.; Schefuß, E.; Vuille, M.; Novello, V.F.; Prado, L.F.; Sifeddine, A.; Klein, V.; et al. Tropical South Atlantic influence on northeastern Brazil precipitation and ITCZ displacement during the past 2300 years. Sci. Rep. 2019, 9, 1698. [Google Scholar] [CrossRef] [PubMed]
  73. Marengo, J.; Souza, M. Mudanças Climáticas: Impactos e Cenários para a Amazônia; Alana: São Paulo, Brazil, 2018; pp. 1–33. Available online: https://www.researchgate.net/publication/329466396_Mudancas_Climaticas_impactos_e_cenarios_para_a_Amazonia (accessed on 7 February 2024).
Figure 1. The location of Matopiba in Brazil is subdivided into ten mesoregions, encompaassing the distribution of the 22 meteorological stations of the National Institute of Meteorology (INMET).
Sustainability 16 02670 g001
Figure 2. Precipitation and temperature from 1985 to 2020 at the 22 weather stations located in the Matopiba region. (a) Precipitation (total annual average and standard deviation) (b) Maximum and minimum temperature (annual average and standard deviation).
Sustainability 16 02670 g002
Figure 3. Spatiotemporal dynamics of land cover and land use in the region of Matopiba, based on the data from MapBiomas, related to the years 1985, 2000, and 2020.
Sustainability 16 02670 g003
Figure 4. Changes in land cover and land use in Matopiba, with an emphasis on reducing natural formations against the elevation of anthropic action, based on the data from MapBiomas for between 1985 and 2020.
Sustainability 16 02670 g004
Figure 5. Spatiotemporal dynamics of natural formation and anthropic action in 60 km buffers of Matopiba’s meteorological stations from the years 1985 and 2020, based on the data from MapBiomas. For the identification of mesoregions and meteorological stations, see Figure 1.
Sustainability 16 02670 g005
Figure 6. Spatiotemporal dynamics of soybean production in Matopiba, based on data from IBGE’S Municipal Agricultural Production (PAM) from 1985, 2000, and 2020. For the identification of mesoregions and meteorological stations, see Figure 1.
Sustainability 16 02670 g006
Figure 7. Spatiotemporal dynamics of soybean yield in Matopiba, based on the production data from IBGE’S Municipal Agricultural Production (PAM) from 1985, 2000, and 2020. For the identification of mesoregions and meteorological stations, see Figure 1.
Sustainability 16 02670 g007
Table 1. Reclassification of MapBiomas’ images (collection 6) for a spatial–temporal analysis of the land cover and land use in Matopiba.
ForestSoybean
Forest FormationTemporary Cultivation—Soybean
SavannahAgriculture and Cattle Raising
Savannah FormationPasture Area
Other Forest FormationTemporary Cultivations—Others
MangrovePerennial Crops
Wooded Sandbank (beta)Silviculture
Non-Forestal Natural FormationAgriculture and Pasture Area Mosaic
Flooded Field e Swamp AreaNon-Vegetated Area
Rural FormationBeach, Dune, and Sandbank
ApicumUrbanized Area
Rocky OutcropMining
Other Non-Forestal FormationOther Non-Vegetated Areas
Body of Water
River, Lake, and Ocean
Fish Farming
Table 2. Reclassification of MapBiomas’ images (collection 6) into two classes: natural formation and anthropic actions.
Natural FormationAnthropic Action
Forest FormationPasture Area
Savannah FormationTemporary Cultivations
MangrovePerennial Crops
Wooded Sandbank (beta)Silviculture
Flooded Field and Swamp AreaAgriculture and Pasture Area Mosaic
Rural FormationUrbanized Area
ApicumMining
Rocky OutcropFish Farming
Other Non-Forestal Formations
Beach, Dune, and Sandbank
Other Non-Vegetated Areas
River, Lake, and Ocean
Table 3. Annual and intra-annual precipitation trends were analyzed by the Mann–Kendall test for Matopiba’s meteorological stations.
UFWeather StationsJanFebMarAprMayJunJulAugSepOctNovDecAnnual
BABarreiras−0.056−0.020−0.0010.009−0.029−0.051−0.041−0.062−0.063−0.122−0.043−0.109−0.052
Bom Jesus da Lapa−0.084−0.0020.0080.006−0.003−0.005−0.080−0.052−0.068−0.050−0.017−0.147−0.038
Carinhanha−0.034−0.0090.0410.0210.011−0.013−0.067−0.049−0.045−0.023−0.009−0.110−0.015
Correntina−0.074−0.0080.0090.0340.0130.006−0.070−0.029−0.078−0.058−0.015−0.147−0.022
Santa Rita de Cássia−0.036−0.018−0.018−0.033−0.057−0.007−0.029−0.019−0.081−0.0490.012−0.100−0.034
MAAlto Parnaíba−0.020−0.0060.037−0.027−0.0070.003−0.0300.005−0.056−0.057−0.009−0.099−0.024
Bacabal−0.0110.034−0.046−0.019−0.023−0.033−0.065−0.0130.008−0.080−0.035−0.017−0.032
Balsas0.0370.029−0.050−0.033−0.002−0.0180.025−0.023−0.036−0.033−0.037−0.103−0.030
Barra do Corda−0.007−0.012−0.039−0.0420.033−0.006−0.011−0.0210.010−0.021−0.033−0.029−0.018
Carolina−0.0150.001−0.010−0.0060.0000.0000.007−0.011−0.036−0.054−0.019−0.063−0.022
Caxias−0.029−0.007−0.074−0.048−0.048−0.079−0.045−0.056−0.016−0.027−0.052−0.062−0.052
Chapadinha−0.0050.014−0.036−0.022−0.0220.008−0.014−0.091−0.092−0.0390.031−0.005−0.022
Colinas−0.046−0.034−0.089−0.107−0.048−0.0650.001−0.042−0.060−0.055−0.080−0.111−0.069
Imperatriz0.0020.002−0.026−0.0130.002−0.033−0.016−0.027−0.042−0.011−0.041−0.008−0.012
PIBom Jesus do Piauí0.0090.0170.025−0.0670.030−0.0200.004−0.044−0.051−0.029−0.063−0.034−0.022
Vale do Gurguéia−0.031−0.018−0.032−0.007−0.047−0.112−0.058−0.013−0.097−0.079−0.022−0.077−0.044
TOAraguaína−0.0350.0400.007−0.0300.004−0.0190.002−0.029−0.050−0.059−0.015−0.050−0.020
Palmas0.0630.0260.0250.036−0.0140.019−0.035−0.014−0.008−0.0250.012−0.0150.006
Pedro Afonso−0.004−0.015−0.0210.0260.0300.010−0.021−0.023−0.045−0.073−0.014−0.073−0.020
Peixe−0.038−0.048−0.039−0.019−0.001−0.008−0.045−0.099−0.041−0.035−0.020−0.079−0.029
Porto Nacional−0.009−0.022−0.008−0.0270.0280.010−0.048−0.059−0.070−0.078−0.034−0.069−0.028
Taguatinga−0.042−0.0600.035−0.001−0.0270.031−0.059−0.054−0.052−0.0550.027−0.116−0.022
The bold values represent significance p ≤ 0.05.
Table 4. Trends in the maximum annual and intra-annual temperature were analyzed by the Mann–Kendall test for Matopiba’s meteorological stations.
UFWeather StationsJanFebMarAprMayJunJulAugSepOctNovDecAnnual
BABarreiras0.1450.0490.1190.0480.1140.0810.0610.0550.1050.1830.1030.1950.101
Bom Jesus da Lapa0.2050.1110.1460.0700.0780.1440.1380.1200.1790.2070.1000.2150.128
Carinhanha0.1730.0470.0720.0350.0700.1560.1300.1180.1440.1620.0880.1630.087
Correntina0.1760.1290.1690.0900.1120.1640.1550.1320.2030.2120.1010.2110.131
Santa Rita de Cássia0.2380.1340.1400.1350.1830.2010.1690.1530.1610.2180.1210.1980.154
MAAlto Parnaíba0.0960.0530.1200.1520.2100.2580.2680.2480.2780.2570.1140.2110.138
Bacabal0.1950.1590.2280.2340.2530.3290.2980.3410.3470.3760.2870.1660.202
Balsas0.1650.1590.2580.2670.2970.4120.4510.4140.4370.3010.1990.2820.225
Barra do Corda0.1840.2050.2700.3190.3030.3480.4150.4050.4220.3720.2780.1970.198
Carolina0.1460.1370.2150.1690.2060.2890.3500.3910.3540.2560.1850.2460.170
Caxias0.2750.1800.2900.3450.3510.4260.4110.4820.4880.4450.3040.2610.254
Chapadinha0.1990.1580.2940.2900.2590.2680.2990.3480.3790.3870.2470.1220.162
Colinas0.1790.1920.2440.2340.2460.3430.3700.3740.4030.3240.2060.2200.186
Imperatriz0.1620.1300.2540.2170.1950.2850.3840.4560.4560.3480.2390.2000.201
PIBom Jesus do Piauí0.2390.2040.2190.2420.1890.1410.037 0.015 −0.012 0.019 0.0670.1710.119
Vale do Gurguéia0.1580.1180.1320.1350.2230.2350.1520.1540.1480.1890.1040.1660.122
TOAraguaína0.0280.0290.0640.0550.1200.1330.1300.1830.2250.2020.1150.1410.092
Palmas0.0870.0750.1210.1220.3140.4830.4440.4150.3300.1700.1070.1350.163
Pedro Afonso0.1820.1690.2410.2070.2000.2490.3140.3370.3640.2920.2210.2730.177
Peixe0.1060.0940.1350.1500.2020.2040.1390.1320.2370.2040.1150.1850.129
Porto Nacional0.1030.0860.0960.1090.1780.2970.2690.2750.2890.1920.1300.1820.126
Taguatinga0.0800.0630.0790.0890.1330.1060.1160.1170.1940.2470.1060.1860.114
The bold values represent significance p ≤ 0.05.
Table 5. Minimum annual and intra-annual temperature trends were analyzed by the Mann–Kendall test for Matopiba’s meteorological stations.
UFWeather StationsJanFebMarAprMayJunJulAugSepOctNovDecAnnual
BABarreiras0.2270.1940.2630.2000.1210.1340.0670.0920.0440.1390.2340.1730.095
Bom Jesus da Lapa0.3470.3320.3380.2900.1980.1850.2050.2610.2480.2860.3130.3190.196
Carinhanha0.3070.2560.3360.2450.1770.2280.2120.1950.1900.1450.2900.2810.157
Correntina−0.023−0.0330.086−0.035 −0.063−0.083−0.098−0.086−0.105−0.096−0.005 −0.100−0.023
Santa Rita de Cássia−0.126−0.142−0.150−0.156−0.073−0.038−0.038−0.006−0.030−0.041−0.046−0.191−0.060
MAAlto Parnaíba0.1330.1620.1680.1270.1060.026−0.0170.0020.0140.0630.1740.0820.062
Bacabal0.2130.2030.2190.1900.2540.2410.2120.1420.1840.1950.1440.1610.190
Balsas0.0260.0190.0260.0170.072−0.0340.0290.0790.1240.1720.1530.1340.049
Barra do Corda0.3860.4000.4400.4610.4640.3380.3330.3590.4760.4940.4720.4190.347
Carolina0.1080.0840.1890.1820.2340.1730.1380.0910.1930.2340.1570.1280.131
Caxias0.1430.1900.2110.2060.3140.2780.2510.1780.3120.4090.3780.3100.243
Chapadinha0.2220.2560.3160.3330.3530.3740.3410.2900.3430.3720.3250.3190.288
Colinas0.0620.1190.0990.0820.1650.0730.0840.0900.1570.2070.1780.1270.090
Imperatriz−0.093−0.0220.028−0.0410.0840.0720.1600.0590.035−0.044−0.080−0.118−0.008
PIBom Jesus do Piauí−0.1260.0460.001−0.0510.0400.1580.1560.034−0.225−0.0380.0630.1180.020
Vale do Gurguéia0.4200.3540.3430.2760.2690.2230.2830.3120.3220.4330.4150.3760.288
TOAraguaína0.1160.1250.1810.1690.2000.2030.1730.1350.1350.1380.1740.1120.101
Palmas 0.042 0.0960.1470.1600.2290.3210.3690.3690.3850.2890.1960.1330.195
Pedro Afonso0.1770.2020.2520.2600.2320.1150.0330.0400.0740.2380.3090.2460.137
Peixe0.1560.1530.1550.1450.0240.042−0.079−0.061−0.0150.1580.2000.1440.064
Porto Nacional0.1960.2020.2370.3140.2530.2600.2330.1950.2370.2770.2810.2310.183
Taguatinga0.2910.2300.2400.2390.2470.2110.1600.1560.1620.2530.1660.2770.187
The bold values represent significance p ≤ 0.05.
Table 6. Trends in the production and yield of soybean cultivation were analyzed by the Mann–Kendall test for the cities with meteorological stations in the Matopiba region.
UFMunicipalityProductionYieldUFMunicipalityProductionYield
BABarreiras0.6350.699MAAlto Parnaíba0.8790.637
Bom Jesus da Lapa−0.182−0.182Bacabal - -
Carinhanha0.4460.456Balsas0.8890.640
Correntina0.8410.610Barra do Corda−0.115−0.093
Santa Rita de Cássia0.2080.214Carolina0.8280.686
TOAraguaína0.4490.370Caxias0.5720.464
Palmas0.7630.700Chapadinha0.8080.675
Pedro Afonso0.3910.532Colinas0.6980.633
Peixe0.6810.641Imperatriz--
Porto Nacional0.7070.719PIBom Jesus do Piauí0.8280.631
Taguatinga0.1750.244Vale do Gurguéia--
The bold values represent significance p ≤ 0.05.
Table 7. The Pearson correlation coefficient (r) between the climate change trends and agricultural results and land cover and use.
Precipitation
Mann–Kendall
Temperature
Maximum
Mann–Kendall
Temperature
Minimum
Mann–Kendall
Average production−0.214−0.101−0.506
Production Mann–Kendall0.0670.203−0.283
Average yield0.1030.043−0.389
Yield Mann–Kendall0.0020.062−0.044
Land use and land cover change0.168−0.066−0.010
Natural formation (1985)−0.3590.6260.005
Anthropic action (1985)0.359−0.649−0.039
Natural formation (2020)−0.3640.5340.009
Anthropic action (2020)0.365−0.557−0.036
The bold values represent significance p ≤ 0.05.
Table 8. The Pearson correlation coefficient (r) between the agricultural production data and soybean yield with the ocean–atmosphere anomalies.
Average ProductionAverage Yield
Pacific Decadal Oscillation (PDO)−0.108−0.186
Multivariate Enso Index (MEI)−0.167−0.242
Atlantic multidecadal Oscillation (AMO))0.5530.621
The bold values represent significance p ≤ 0.05.
Disclaimer/Publisher’s Note: The statements, opinions and data contained in all publications are solely those of the individual author(s) and contributor(s) and not of MDPI and/or the editor(s). MDPI and/or the editor(s) disclaim responsibility for any injury to people or property resulting from any ideas, methods, instructions or products referred to in the content.

