Article

Evaluating Carbon Emissions during Slurry Shield Tunneling for Sustainable Management Utilizing a Hybrid Life-Cycle Assessment Approach

School of Water Conservancy Science and Engineering, Zhengzhou University, Zhengzhou 450001, China
*
Author to whom correspondence should be addressed.
Sustainability 2024, 16(7), 2702; https://doi.org/10.3390/su16072702
Submission received: 26 February 2024 / Revised: 21 March 2024 / Accepted: 21 March 2024 / Published: 25 March 2024
(This article belongs to the Section Sustainable Transportation)

Abstract

:
The construction sector is one of the principal contributors to carbon dioxide emissions (CDEs) and has a vital role to play in responding to the issue of long-term environmental sustainability. This research proposes a process-based hybrid life-cycle assessment (LCA) method depending on a process-based LCA and an input–output LCA. The process-based hybrid LCA model provides a supplementary method to quickly estimate carbon emissions that are not considered in the system boundary due to the limitation of inventory data. The proposed hybrid method was applied to a carbon emissions assessment in a slurry shield tunnel. The results suggest that 93.88% of emissions are from materials. Of the materials contribution, 55.9% comes from steel and 34.55% arises from concrete. It has also been found that emissions during the tunneling stage are negatively correlated with the efficiency of tunnel construction. Recommendations for carbon emissions reductions in tunnel construction are provided for promoting sustainable transportation and management.

1. Introduction

The world will now encounter the biggest wave of climate hazards over the next two decades with a global warming temperature of 1.5 °C (2.7 °F), thereby posing a grave and mounting threat to both nature and human wellbeing [1]. Human-induced climate change is causing unequivocal and widespread impacts, some of which are long-lasting and, in some cases, irreversible. Increasingly, droughts, floods and heatwaves will be triggered by increased weather extremes in the wake of climate change. The human influence on climate change is reflected in both the growing scientific literature and in people's perception worldwide. Accelerated actions will, thus, be required to respond to the increasing risks brought by climate change. Making rapid and deep cuts in greenhouse gas (GHG) emissions is central to reducing risks and vulnerability from climate change. GHG emissions are usually seen as the prime villains in the debate on global warming [2]. A global challenge calls for global efforts. Realizing this pressing issue, many countries have been mapping out strategies or measures in an effort to address climate risks and to meet their carbon reduction targets. For instance, the United States (US), by not only funding projects that focus on reducing carbon emissions but also by investing in technologies that help unleash their potential for increasing the remanufacturing or recycling of industrial materials, is heading to a net-zero greenhouse gas economy according to the US Department of Energy (DOE) [3]. China has unveiled working guidelines that aim for the goal of peaking carbon emissions by 2030 and achieving carbon neutrality by 2060, at the same time as honoring its climate commitment. As the guidelines show, China’s CO2 emissions per unit of GDP are projected to be lower by 18% compared with the 2020 level by 2025 [4]. Equally, according to European Climate Law, it is anticipated that the European Union (EU) will increase its GHG emissions reduction target for 2030 to at least 50% compared with 1990 levels and has presented its objective of achieving net-zero GHG emissions by 2050 [5].
The infrastructure construction sector, characterized by a gargantuan consumption of energy and materials, is regarded as a significant source of GHG emissions, as well as one of the major contributors to global carbon emissions [6,7]. Together with the building sector, the infrastructure construction sector accounts for 38% of global carbon emissions [1], demonstrating the key role of these sectors in cutting emissions. Notably, growing populations and rapid urbanization, particularly in Asia and Africa, will further facilitate the surging demands for infrastructure construction. Many construction sites are highly resource- and energy-consuming. This highlights the urgency of addressing construction-related emissions, which are being released into the atmosphere, as we continue to extract and manufacture materials and products for construction projects.
Tunnel construction, commonly referred to as the highest energy- and material-dense sector in transportation infrastructure, intensively consumes prodigious amounts of energy and materials [8]. China’s road tunnels are developing rapidly. Over the past 100 years, China has built 15,025 road tunnels with a total length of more than 14,000 km. From 2013 to 2016, the total length of Chinese road tunnels increased by 4434 km. According to [9], over the last decade, governments and researchers have shown more concern over the GHG emissions associated with tunnel construction. With the number of Chinese tunnels growing, studies on GHG emissions from tunnel construction are, therefore, urgently needed.
Process-based life-cycle assessments (P-LCAs), one of the LCA methods, have been widely used to evaluate the GHG emissions from tunnel construction. For example, Li et al. [10] used the P-LCA method to calculate the GHG emissions during the construction of new highway tunnels in China and ascribed most of the endogenous GHG emissions to the equipment powered by fossil fuel combustion motors for tunnel construction. These fossil fuels include gas, diesel, oil, coal and asphalt. The GHG emissions generated by diesel consumption are at a high level, with a proportion of over 90% in comparison with other fuel types in tunnel building. Subsequently, Miliutenko et al. [8], in Sweden, using the P-LCA method, analyzed the carbon emissions from a road tunnel. From the perspective of life cycles, this study took into consideration the emissions during not only the construction phase but also the operational life. Similarly, Huang et al. [11], applying the LCA method to quantify the emissions of rock tunnels in Norway, concluded that GHG emissions should be taken into account from the early planning phase to the end-of-life phases. During the same year, Huang et al. [12], in Shanghai, described the GHG emissions in a tunnel, pointing out the differences between the emissions of different machines and the importance of driving speed for fuel consumption during the construction period.
Rodríguez and Pérez [13], based on the LCA method, developed a simplified calculation model for analyzing the GHG emissions of tunnels under construction and applied it to estimate the GHG emissions associated with tunnels excavated in medium–low-strength rock masses by using roadheaders or hydraulic breaker hammers. To detect the impacts of varying parameters on emissions, they employed the model in several cases and carried out an analysis of seven different tunnels in Asturias (northwest Spain). From the results that about 80% of GHG emissions were related to the concrete used in the tunnel, they attributed the largest contribution to GHG emissions to the production of concrete used in both supporting and lining the tunnel under construction. However, it was thanks to the applied simplification that the scope of the study was, to a certain extent, limited. For instance, when it came to the GHG emissions related to excavation, rock waste removal or auxiliary services, simply the emissions related to the work of machinery fueled by energy, both electricity and fuel, were calculated, whereas they dismissed materials from their consideration. And when estimating the GHG emissions associated with the support installation and lining, their work was exclusively concerned with emissions related to the manufacturing and transport of the materials, purely including concrete and steel, while those emissions related to the energy use of construction machines were neglected.
Finally, it has to be pointed out that P-LCA has become a globally accepted method for evaluating carbon emissions. Yet there are few studies that focus on carbon emissions during the slurry shield tunnelling. Most research on GHG emissions during the tunnel construction focuses on road tunnels or highway tunnels. The number of works on GHG emissions from the slurry shield tunnelling that we can find in the specialized literature is rather low. Moreover, the system boundary of using P-LCA is quite subjective. In other words, different researchers who use P-LCA will select different system boundaries when studying the same tunnel project. Therefore, it can be seen that most researchers who adopted the P-LCA method tended to disregard inputs that may not be substantial in order to make the method more applicable to their case study, thereby making it less possible to gain and acquire a more rounded assessment.
To encapsulate, there exist three main problems in studies on GHG emissions at the tunnel construction stage. First, the system boundary selection when using the P-LCA method is subject to the quality of inventory analysis of the case project. Often, due to the loss of data, inputs that play a relatively minor role in tunnel construction have been overlooked frequently, and those GHG outputs remain unclear. Second is to introduce a new method of solving the problem that studies focusing on the emissions from tunnel construction have always been restricted by limitations due to the use of one single method. Although various methods of calculating the GHG emissions caused in the construction phase of the life cycle have been proposed, these methods cannot be developed for the accurate measurement of emissions from tunnel construction. The third is to provide an estimation method when the carbon emissions factors do not include indirect emissions. For example, some previous studies have failed to consider indirect inputs like upstream fuel.
For this reason, we have detected a gap in terms of studies or results related to emissions during tunnel construction by a hybrid method and thereby generated an idea of a combinatorial strategy for addressing the emissions that have been ignored. This study is intended to define a hybrid LCA method to calculate GHG emissions, suggesting different LCA methods, including process-based LCA and I-O LCA, to determine the amount of energy and materials used in different phases of the tunnel under construction. The hybrid LCA method described herein can be seen as a combination of process and the I-O LCA method. The article first explored and analyzed the strengths and limitations of these two methods, which aims to produce a comprehensive analysis that includes economy-wide effects in addition to on-site construction activities. After comparative analysis of two methods, a hybrid LCA model will be developed and introduced to estimate the GHG emissions during the tunnel construction. This hybrid model has been utilized for calculating the GHG emissions of a tunnel in China. Section 4.2 and Section 4.3 describe the main findings of this research and present possibilities for capturing and reducing GHG emissions.
Herein lie the main features of the proposed hybrid method:
  • Flexible: It can be used as two different methods to estimate the GHG emissions during different phases of a tunnel. Instead of one single method, we opt for one method or the other or both, depending on site conditions, data category, local market, etc. It will be possible to adjust the carbon emissions factors according to the country or region specifics.
  • Effective and time-saving: The task of calculating the GHG emissions, especially by P-LCA, is data-intensive and time-consuming. With the I-O LCA method based on the monetary value and conversion factor to CO2, we can make a rapid calculation of GHG emissions. The P-LCA method is not efficient enough to achieve the calculation target under severe missing data circumstances. This hybrid approach may be effective by completing missing data in the life-cycle inventory.
  • Easy to implement: No special skills are required for its practice. The simplicities of the proposed hybrid method are based on the following: (a) the budget quota and energy consumption of tunnel construction; (b) the use of the conversion factor method to convert the amount of energy and materials consumed into GHG emissions; (c) focus not on the whole life cycle but on the construction phase of a tunnel; (d) only account for the CO2 emissions and not for other gas emissions.
  • Provide a holistic view of GHG emissions: This hybrid approach could provide a rounded analysis of the emissions associated with materials production, materials materialization, materials transportation and off-road machinery. It can not only address those emissions arising from auxiliary materials (grease, bentonite, PVC pipe and rubber material) but also provide a method to estimate the emissions during the upstream fuel when carbon emissions factors do not consider indirect emissions.

2. Research Background

2.1. Carbon Emissions during the Tunnel Construction Process

The sources of carbon emissions associated with the tunnel construction roughly include the following: building materials production and transportation, material materialization, off-road machinery, upstream indirect fuel, personnel and environmental implication. Given that personnel factors vary considerably across the whole phase of a tunnel under construction, the emissions related to human activities including both people’s living and working are not taken into consideration. The environmental impacts such as emissions that pertain to the surrounding traffic congestion triggered by the construction project are usually neglected due to being a tiny share of the total. In this study, the carbon emissions factors include indirect emissions; therefore, we summarize four major sources of emissions during the whole process of tunnel construction, as shown in Figure 1.
  • Materials production: The main materials considered are cement, steel bars, sand and gravel aggregates, etc., and auxiliary materials, including PVC pipe, adhesive, steel molds and wooden molds.
  • Materials materialization: This mainly includes the production, maintenance and installation of prefabricated components and the work of casting.
  • Materials transportation: It involves raw materials and prefabricated components transportation around the construction site.
  • Off-road machinery: It mainly refers to construction machinery needed to perform tasks during the course of tunneling, including shield tunneling, slurry treatment and recycle, casting, lining and auxiliary services including ventilation and light during construction.

2.2. Life-Cycle Assessment Background

LCA is commonly referred to as a methodology to holistically estimate and manage the effects on the environment exerted by a product or process from the perspective of its entire life cycle, which could help facilitate emissions reduction measures. It consists of goal and scope definitions, life-cycle inventory (LCI) analysis, life-cycle impact assessment (LCIA) and interpretation. LCA relies on robust raw data and tools, expertise to interpret the results and transparency in data sources and methodology to ensure the outputs support decision making that minimizes negative environmental impacts. The two primary LCA methods are process-based LCA (P-LCA) and input–output LCA (I-O-LCA) [14,15]. The former can be deemed as a bottom-up model, whereas the latter is viewed as a top-down model. Parenthetically, many approaches that rely on either top-down or bottom-up thinking have been widely used for forecasting and estimating domestic energy consumption and carbon emissions [16]. There are pros and cons of each approach, and a summary of strengths and weaknesses is displayed in Table 1 [17,18,19,20].

2.3. P-LCA Model for GHG Emissions during Tunnel Construction

2.3.1. GHG Emissions Released from Materials Used

The P-LCA method, based on both materials consumption and corresponding carbon emission factor, is applied to calculate the total GHG emissions EM,P according to Equation (1), in which EM,P represents the main material carbon emissions calculated by the P-LCA method, i refers to the type of material, efi is the carbon emission factor of material i and mi denotes the material consumption.
E M , P = i e f i × m i

2.3.2. GHG Emissions Produced during Materials Transportation

To move the materials from place to place, transport vehicles need gasoline, diesel and electricity energy as driving forces. Thus, emissions will emerge from the fuels consumed by the trucks or mixing vehicles that are utilized to transport prefabricated components from the prefabricated site to the tunnel construction site. The GHG emissions caused by the energy consumption can be calculated as shown in Equation (2):
E T , P = i e f i × v i × n i
where ET,P is the carbon emissions during materials transportation, i is the type of vehicle, efi is the conversion emission factor of fuel for vehicle i, vi is the consumption amount of fuel for vehicle i per hour and ni is the working hours for vehicle i.

2.3.3. GHG Emissions Emitted by Off-Road Machinery during the Excavation

To ensure that the equipment is running and performing its task, the emissions will come from energy consumed by the equipment. The diesel fuel used, completed with the electricity consumed, comprises two sources of emissions. The carbon emissions caused by off-road machinery can be estimated according to Equation (3):
E O , P = i e f i × v i × n i
where EO,P represents the carbon emissions caused by off-road machinery, i refers to the type of machinery, efi is the conversion emission factor of fuel for equipment i, vi denotes the consumption amount of fuel for equipment i per hour and ni is the working hours for equipment i.

2.4. I-O-LCA Model for GHG Emissions during Tunnel Construction

2.4.1. GHG Emissions Released from Materials Used

The I-O-LCA method is based on the monetary value of building materials, and it is viable that these materials are incorporated into the I-O construction sectors. In this way, the carbon emissions E M , I O produced from auxiliary materials can be, in effect, worked out according to the input–output-based LCA Equation (4), where i refers to the type of material, vi represents the material value and efi denotes the carbon emission factor of the building material sector.
E M , I O = i e f i × v i

2.4.2. GHG Emissions Produced during Materials Transportation

As shown in Formula (5), the emissions (Etrans,IO) can be calculated by multiplying the cost of material transportation (vi) by the conversion factor of the transportation sector (efi).
E t r a n s , I O = i e f i × v i

2.4.3. GHG Emissions Emitted by Off-Road Machinery during the Excavation

The emissions can be achieved by the I-O-LCA method that multiplies the construction cost budget of the project by the carbon emission factor of the corresponding construction sector, as shown in Equation (6):
E O , I O = i e f i × v i
where vi denotes the construction cost budget of the project, efi represents the conversion factor of the corresponding construction sector and EO,IO is the emissions calculated by the I-O-LCA method.

3. Hybrid Model Development

To help identify the hot spots of GHG emissions during the tunnel construction and gain a detailed analysis of the specific process, the process-based hybrid method (P-based H-LCA) is more suitable than the input–output-based hybrid method (IO-based H-LCA). In other words, P-LCA is a primary method, while I-O-LCA is a complementary method when it comes to GHG emissions during tunnel construction. The hybrid process-based method replaces the missing data from the process analysis with known input–output data, while the unknown data in the input-output analysis will be displaced by the known data in the process analysis by using the input–output-based hybrid method. This hybrid-based approach aims to minimize the impacts of missing data in the product or in the analysis process.
The aim of this work is to develop a hybrid model that could help researchers consider as many sources of carbon emissions as possible. Emissions during the construction of a tunnel can be credited to these four sources, namely materials production, material materialization, materials transportation and off-road machinery. The hybrid model structure is shown in Figure 2. Particularly, the GHG emissions from upstream indirect fuel should be estimated when the carbon emissions factors do not consider indirect emissions.

3.1. Method Slection Discussion

3.1.1. Materials Production

The emissions will be generated from energy consumed for the production of materials. Materials used for tunnel construction are categorized into two types: main materials and other auxiliary materials. The main materials involved are cement, steel, aggregate and concrete made with compound materials. The auxiliary materials considered include PVC pipe, grease, guard bar and adhesive. The conversion factors of main materials, compared to that of auxiliary materials, are accessible to researchers, which makes it more suitable to calculate the emissions released from the main materials by using the P-LCA method. Conversely, there is scarcely any record for the conversion factor of auxiliary materials. Many studies have failed to take these materials into account as a result of diminutive consumption, thereby limiting the accuracy of carbon emissions calculations in large part. Emissions related to auxiliary materials will be due to their minimal inputs neglected. However, thanks to the available monetary value on these auxiliary materials, it is viable that these materials are incorporated into the I-O construction sectors. In this way, the carbon emissions produced from auxiliary materials can be, in effect, worked out according to the I-O-LCA method. Moreover, when carbon emissions factors of materials do not consider the indirect emissions, these indirect emissions arising from upstream fuel could be estimated by I-O-LCA, completing the system border of emissions from materials production.

3.1.2. Material Materialization

During the phase of material materialization, emissions will mainly come from the equipment that uses electrical energy to perform the tasks of production, maintenance and installation of prefabricated components and the work of casting. Due to the lack of information on the value or cost, using the I-O-LCA approach is less available. GHG emissions can be calculated with Equation (3).

3.1.3. Materials Transportation

When the inventory data of materials transportation are complete, it is suggested that GHG emissions during materials transportation should be calculated with P-LCA. However, when the variety of sources of building materials, the transportation mode and transportation distance of building materials from the production site to the prefabrication site are vastly different, it is statistically troublesome. Calculating carbon emissions under this circumstance will be time-consuming. In order to quickly estimate the carbon emissions produced during materials transportation, using the I-O-LCA approach may lead to progress.

3.1.4. Off-Road Machinery

When there are few types of mechanical inputs, the carbon emissions caused by off-road machinery can be estimated according to Equation (3). However, when there are various types of mechanical inputs, it is rather tricky to figure out the energy consumption of all types of machinery. To simplify this issue, the emissions can be achieved by the I-O-LCA method that multiplies the construction cost budget of the project by the carbon emission factor of the corresponding construction sector.

4. Case Study

4.1. Inventory Data

The described hybrid model has been used to estimate the GHG emissions produced during the construction process of a tunnel project with the super-large-diameter slurry shield method in Shenzhen, China. The system boundary of the tunnel construction is shown in Figure 3. Based on the quality of inventory data from the case project, we only use the I-O-LCA to roughly estimate the GHG emissions from auxiliary materials and use the P-LCA method to calculate the remaining GHG emissions during tunnel construction. The tunnel project is composed of 1001 rings. Limited by the amount of inventory data, 41 rings of the tunnel project are calculated.
Table A2, Table A3, Table A4 and Table A5 summarize the energy consumption and types of materials, transportation vehicles and construction machinery utilized in different construction processes. The material and fuel consumption for tunnel construction were directly obtained from the “Highway Engineering Budget Quota” and tender [21]. The energy consumption per ring was calculated with the hourly fuel or electricity consumption, given by the Chinese National Unified Machinery Shift Cost [22]. The GHG emission factor is a key parameter for converting the energy consumption into CO2 equivalent. And the data on material emissions factors were obtained from the IPCC Guidelines and Chinese domestic literature, as shown in Table A1 [23,24,25,26,27,28].

4.2. Results and Analysis

As shown in Table 2 and Figure 4, materials, materialization, materials transportation and tunnelling, respectively, account for 93.88%, 2.22%, 1.45% and 2.45% of the whole GHG emissions, demonstrating a leading role in fulfilling the goal of emissions reduction. Specific processes during the four stages are listed in Figure 5. Those emissions from auxiliary materials contribute 5.15% of all materials’ carbon emissions. By stark contrast, the materialization, transportation and tunneling stage are responsible for less than 2.5% of the GHG emissions, respectively.
Figure 6 shows the GHG emissions of each ring during the tunnel construction and indicates that materials with a much higher share of the total emissions can be viewed as the main culprit in GHG emissions from tunnel construction. Due to the limitations of calculation methods and boundary conditions, emissions generated by materials and materialization during each ring of the tunnel construction are invariant. But it can be found that emissions from materials transportation and tunneling change to some degree as the ring number grows. Notably, the emissions attributed to tunneling vary considerably in rings, with a maximum difference of more than three-times, as the process of tunneling is subject to strata conditions, distance and efficiency at the construction stage, so the GHG emissions can be affected by these factors. A summary of changes in GHG emissions associated with these two processes throughout the whole construction period is given in Figure 7 and Figure 8. Statistically, it could be concluded that segment transfer and shield tunneling contribute significantly, according to Figure 7 and Figure 8.
Taking ideas from the figures above a step further, we made an analysis of GHG emissions during four processes in tunnel construction that supports our goal to meet carbon reduction targets.
Figure 9 shows the source compositions of GHG emissions from materials used in each ring of a tunnel. Reinforced concrete components such as tunnel segments and internal structures, including mold, flue sheet and pavement, are major materials for construction, accounting for 90.46% of the total GHG emissions of materials used in one-ring tunnel construction. With steel and concrete responsible for 55.9% and 34.55% of the total GHG emissions from materials for each ring, decarbonizing these two materials is one of the most effective ways to restrain GHG emissions. Globally, cement and steel are two of the most important sources of material-related emissions in construction. Although a one-ring tunnel requires 24 m3 grouting slurry, grouting contributes a diminished share to the material-related emissions because grouting slurry is mainly composed of materials characterized by a small emission factor, including sand, bentonite, lime and others. Encouragingly, for these and other auxiliary materials, including grease, bentonite, PVC pipe and rubber material that have been overlooked frequently due to the minor inputs, GHG emissions from these materials are calculated in this study by using the I-O-LCA approach that bases results on the monetary value of these materials. Auxiliary materials account for 5.15% of the total GHG emissions from materials.
Figure 9 also reveals that the segment standing out from many other materials has a crucial role to play in emissions reductions. On the premise of stability and durability of the tunnel, reducing the segment thickness and reinforcement ratio can help meet the carbon reduction targets. Table 3 provides a comparison of carbon emissions from three types of pipe segments. Type I refers to the original segment size and average reinforcement ratio; Type II assumes that the thickness of the segment is 500 mm while the reinforcement ratio remains unchanged; Type III is our third assumption that the reinforcement ratio is reduced by 10% without altering the thickness of the segment. The results suggest that reducing the cross-sectional size of the pipe segment appears to be an effective way to mitigate the effects of GHG emissions from materials. However, this kind of carbon reduction measure runs counter to the law of structural mechanics and threatens the stability and durability of the tunnel, making this reduction measure difficult to justify in reality. Therefore, on the premise of structural stability and durability, appropriately adjusting the reinforcement ratio of segments could help to achieve materials GHG emissions reductions.
In Figure 10, GHG emissions arising from the stage of material materialization are presented. The prefabricated segment is responsible for 75.34% of the total emissions during the material materialization stage. To identify carbon reduction opportunities, a detailed analysis of sources of emissions from the prefabricated segment is needed. As Table 4 shows, the consumption of electricity gives rise to 699 kgCO2 in each ring. This factor used a diesel boiler to produce steam for segment maintenance, and each ring of the prefabricated segment generates 473 kgCO2 due to the input of diesel. It can be seen that a small input of diesel yields a high output of emissions. By switching to low-carbon or renewable energy sources instead of diesel, we can achieve the goal of emissions reductions during the material materialization stage.
The results of GHG emissions by materials transportation are illustrated in Figure 11. It suggests that segment transfer accounts for 94.93% of the total materials transportation emissions, thereby having a vital role to play in emissions reductions. But the truth is that the whole stage of material transportation contributes to the minority of total emissions, according to Table 2. In spite of that, we endeavor to seek emissions reductions. It has to be pointed out that the segment prefabrication site and tunnel construction site are due to the limitations of the whole project location being separate, leading to a lengthened distance between the two sites. For this reason, emissions from segment transfer are subject to the site conditions. These emissions will be greatly reduced if two sites are close enough. So, avoid separating two sites, if possible.
Despite the fact that the process of tunneling is responsible for 2.45% of total emissions during the whole tunnel construction according to Table 2, it is necessary to analyze the results so as to find measures to address carbon emissions during tunnel construction. Figure 12 shows the compositions of GHG emissions at the tunneling stage, indicating that shield tunneling is a process that deserves special attention. Often, guaranteeing the smooth operation of the entire system requires auxiliary equipment that must be kept in a working state. In other words, there is always a certain amount of emissions whether the tunnel is advancing or not. Once the advancing tunnel ceases for certain reasons, the equipment will continue to work, causing superfluous emissions. Therefore, emissions during the tunneling process have a bearing on the efficiency of tunnel construction to a great extent. To probe for a better understanding of the correlation between emissions and efficiency of tunnel construction, we use the I-O-LCA approach to calculate the emissions under different conditions that are differentiated by the efficiency of tunnel construction. As Figure 13 indicates, the total carbon emissions will be about 4500 kgCO2 when the shield stops working for 24 h. With the increase in the number of daily propulsion rings, the average carbon emissions from shield construction show an exponential downward trend. The figure shows that the average carbon emissions of the daily propulsion of three rings are equivalent to 40% of the average carbon emissions of the daily propulsion of one ring. When the daily rings grow to 10 rings, the average total carbon emission of the cycle decreases to 1020 kgCO2. Therefore, from this perspective, improving the efficiency of shield tunneling contributes significantly to reducing total carbon emissions. Efforts should be made to avoid pauses in shield tunneling machines. It is suggested that at least three rings per day should be maintained, and the higher the efficiency of tunneling becomes, the smaller the amount of average carbon emissions of the shield tunneling could be.

4.3. Discussion

Chen et al. [29] adopted the P-LCA method to evaluate GHG emissions during the construction of a metro shield tunnel in Guangzhou, China. The results show that the GHG emissions of the materials and materialization phase, materials transportation phase, and shield tunnelling and segment installation phase, respectively, account for 72.7%, 1.9% and 25.4% of the total GHG emissions from the entire construction process. Because GHG emissions for segment installation are not considered in this study, the proportions are quite different from the results. Li et al. [30] used the LCA method to quantitatively analyze the GHG emissions during the construction process of a tunnel project with the super-large-diameter slurry shield method in Shanghai, China. The research results reveal that GHG emissions of materials, materialization, materials transportation and tunnelling, respectively, account for 92.9%, 2.38%, 1.28% and 3.43%. The unit GHG emissions of the four sections mentioned above are 56.55 tCO2, 1.45 tCO2, 0.76 tCO2 and 1.54 tCO2, respectively. It can be found that the carbon emissions of the tunnel project in this study are close to that of a case project in Shanghai. Su et al. [31] used the LCA method to evaluate the resource and energy consumption intensities of metro construction stages. According to the results, the GHG emissions of the materials production phase, materials transportation phase and shield tunnelling phase, respectively, account for 75.3%, 1.7% and 23% of the total GHG emissions from the entire construction.
It has to be pointed out that this study lacks uncertainty analysis and sensitivity analysis for the data sources. And the carbon emissions factor selection needs improvements. This study aims to provide a supplementary method to quickly estimate those emissions that are not considered in the system boundary. This hybrid approach may serve as an effective method for estimating GHG emissions, especially when there are no micro data but aggregated data. It could be used as two different methods to estimate the GHG emissions during different phases of a tunnel. Instead of one single method, we opt for one method or the other or both, depending on site conditions, data category, local market, etc. However, the more researchers that use the I-O-LCA method, the less accurate the results become. It is suggested that researchers use P-LCA to consider as many sources of carbon emissions as possible. And the rest of the GHG emissions could be estimated with the I-O-LCA method. In this study, auxiliary materials are estimated with I-O-LCA, and the rest of the GHG emissions are calculated with P-LCA, so the I-O-LCA method may have slight error bars around the results. The selection of these two methods mainly depends on the quality of inventory data.

5. Conclusions

The novelty of this study lies in the alternative method, especially when the system boundary is not complete or when the carbon emissions factors do not consider indirect emissions. This research proposed a process-based hybrid LCA model that combines the P-LCA and I-O-LCA methods for evaluating the GHG emissions from tunnel construction. A case study located in the south of China was conducted to test this hybrid model, and another case project has been selected to validate the proposed hybrid method. This study, using this hybrid method, ascertained the GHG emissions arising from auxiliary materials.
The hybrid method could be effective by completing data under severe missing data circumstances with mixed methods. But approaches based on this hybrid model will differ to some extent, depending on the level of upstream materials and energy in the local market as well as the geological conditions. Owing to the data deficiency of upstream materials and energy, the emissions associated with upstream fuel are not considered. And this study mainly focuses on carbon emissions during the construction stage, which is a minor part of the life cycle. The impacts of emissions from upstream fuel should be considered in future studies. In this study, the main findings are listed as follows:
(1)
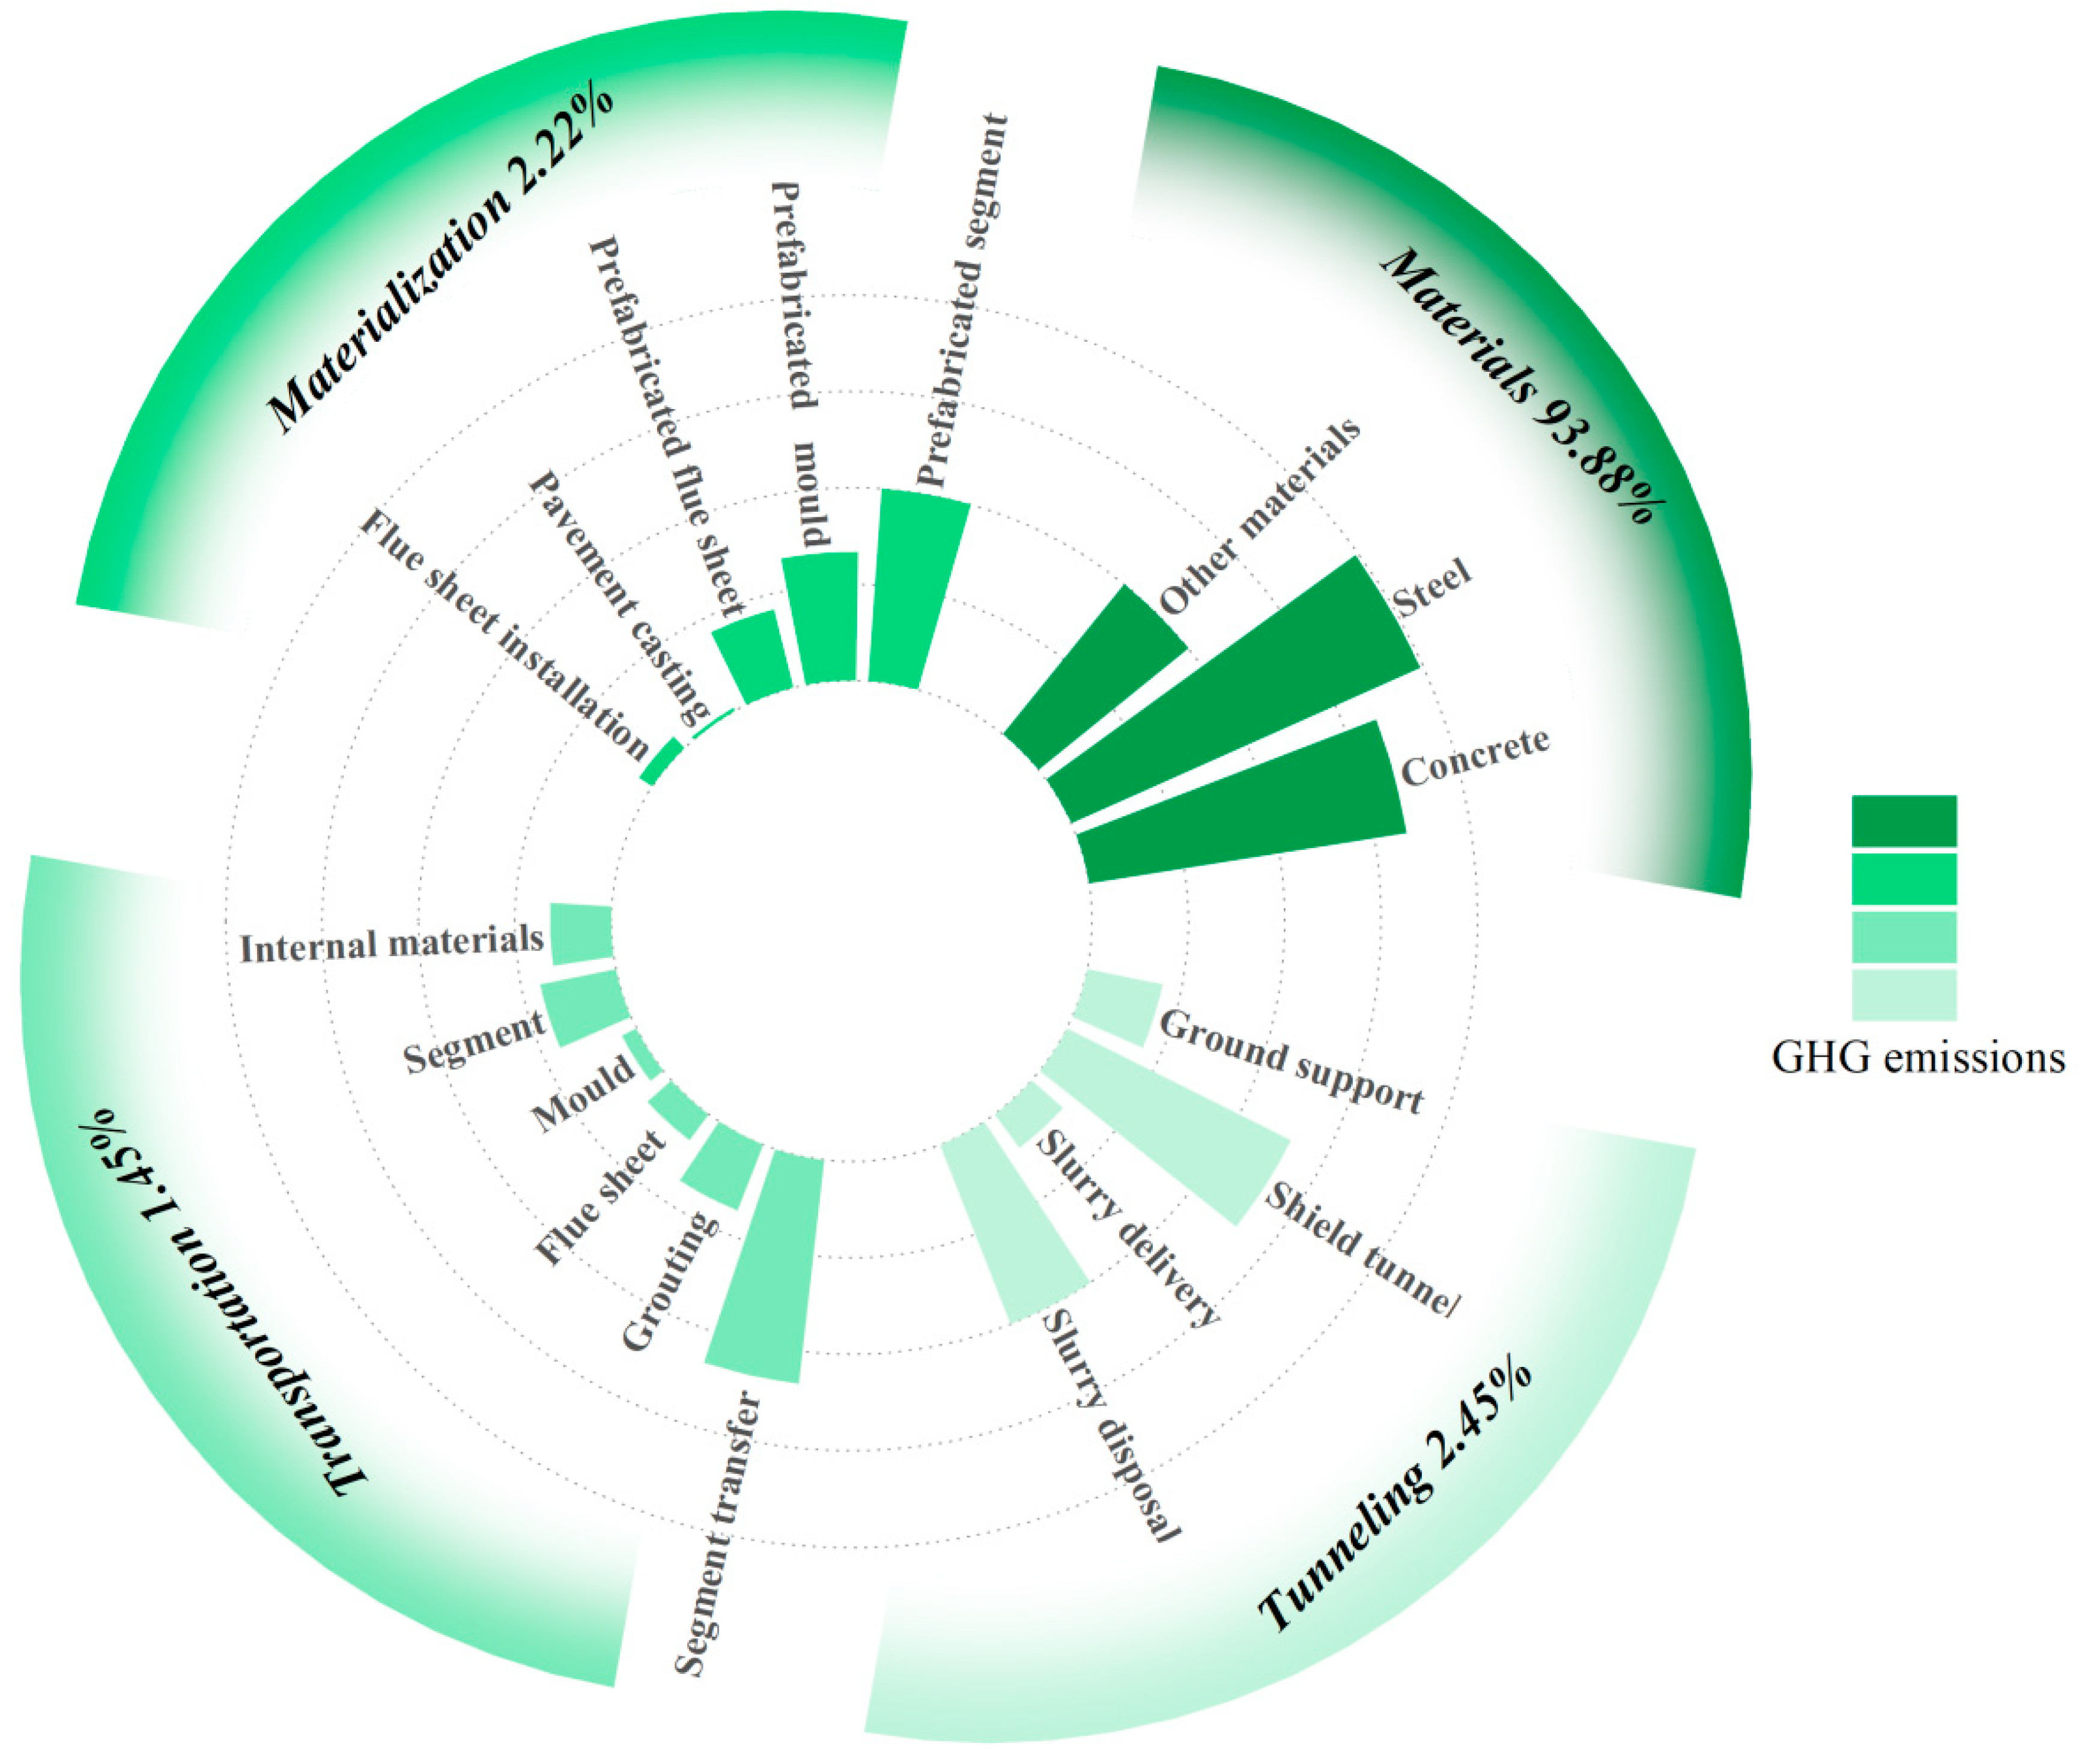
The GHG emissions of the tunnels with 41 rings are 2895.07 × 103 t CO2 eq, with the GHG emissions of each ring ranging from 69.68 × 10³ t CO2 eq to 71.93 × 10³ t CO2 eq.
(2)
Materials accounting for 93.88% of total emissions have a leading role in carbon reductions. Among these materials, segments contributed most of the GHG emissions associated with the materials. Altering the reinforcement ratio of segments can help meet the materials GHG emission reduction targets on the premise of structural stability and durability.
(3)
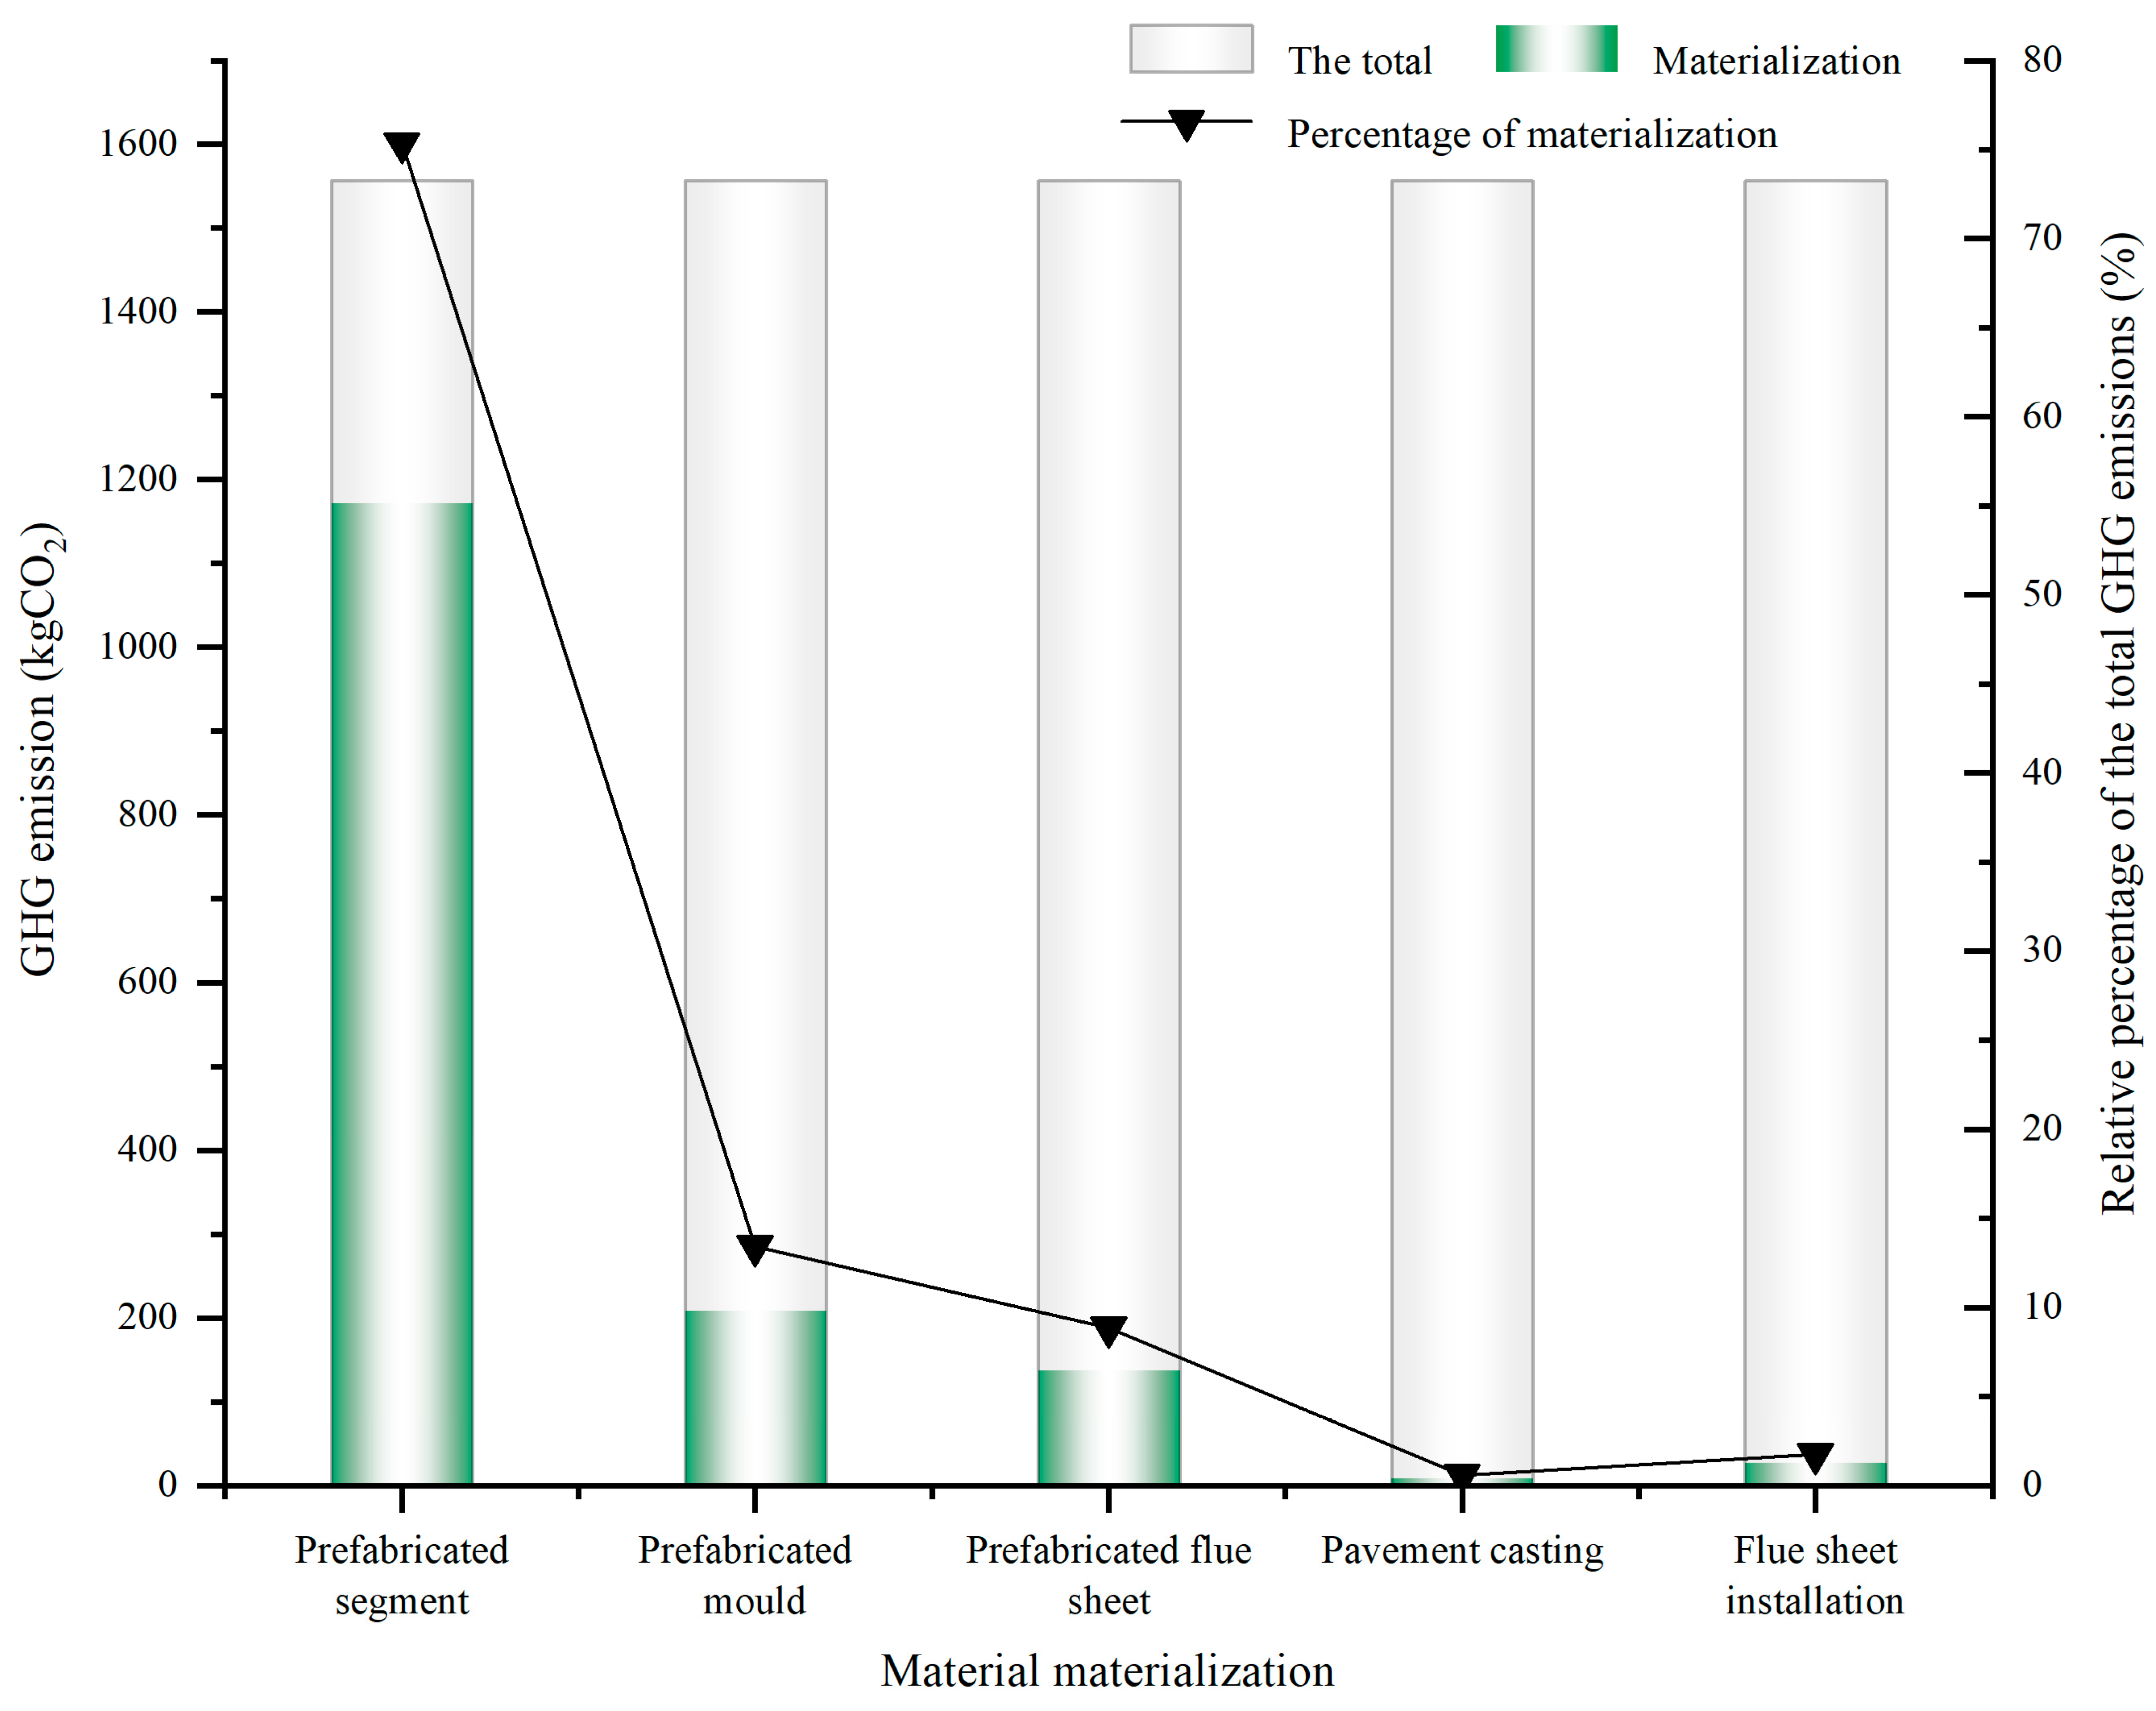
During the material materialization stage, by switching to renewable energy sources instead of diesel when producing steam for segment maintenance, the goal of emission reductions during the stage can be achieved.
(4)
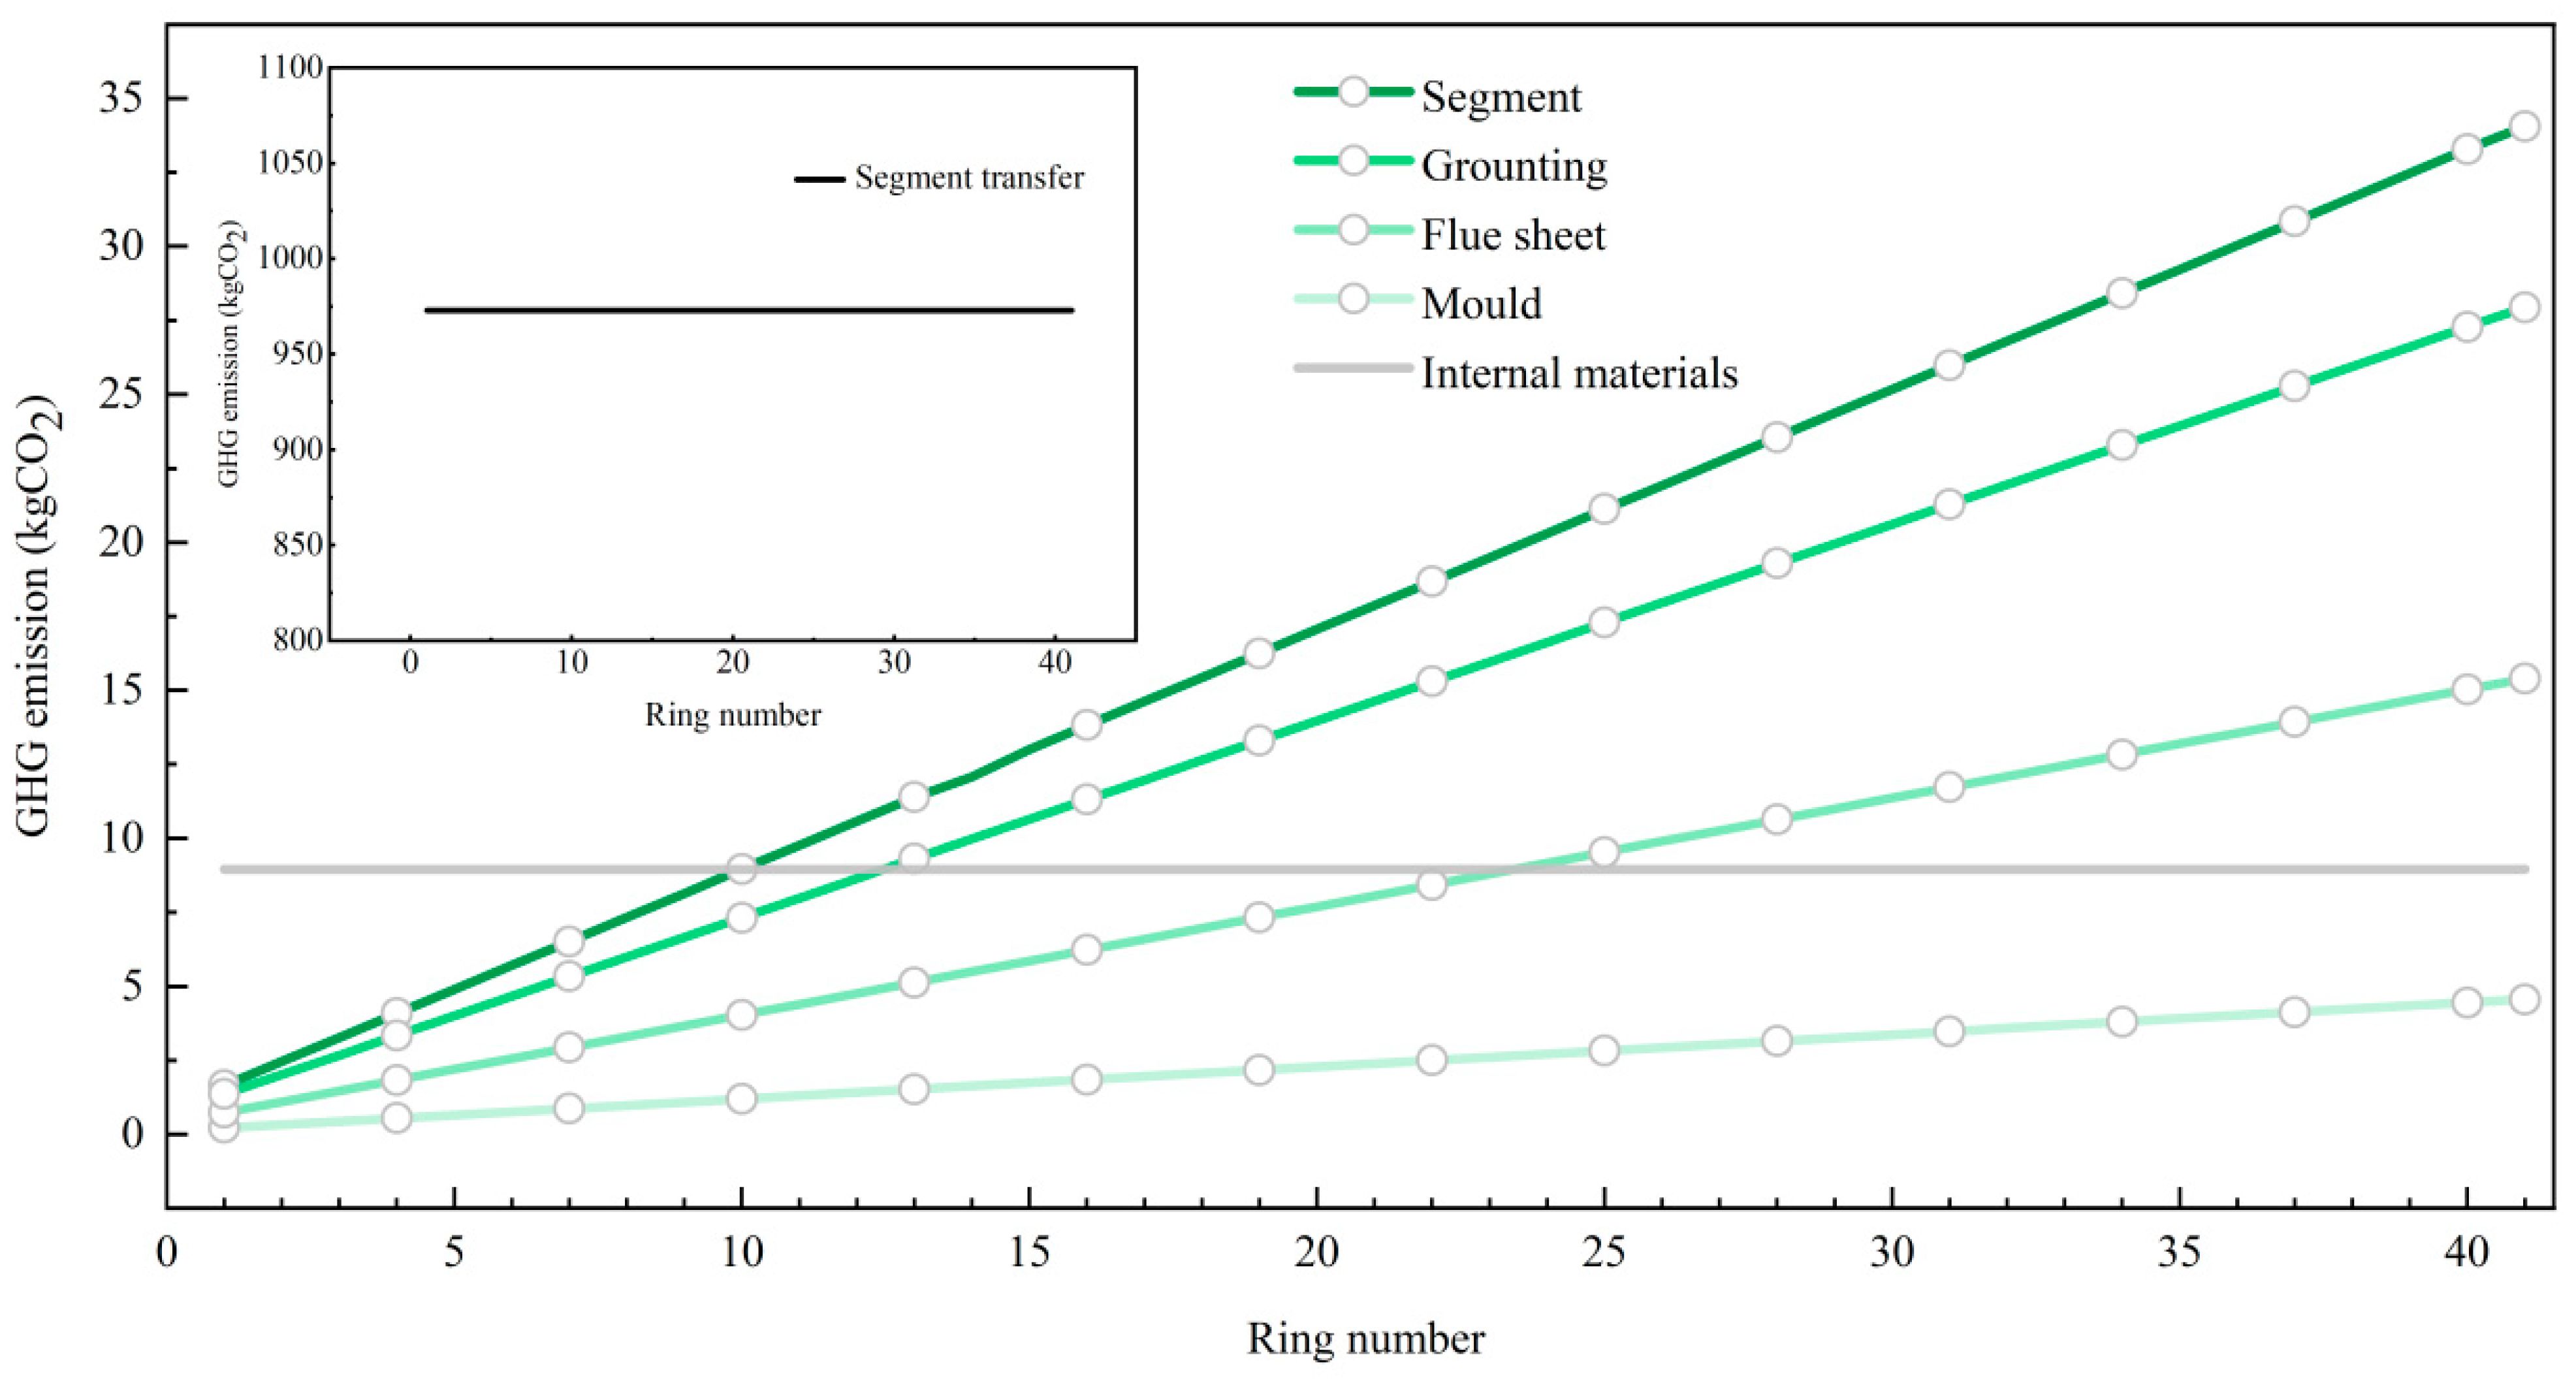
GHG emissions from materials transportation are subject to the site’s location. Avoiding separating the materials prefabrication site and tunnel construction site may lead to great progress in reducing GHG emissions from transportation.
(5)
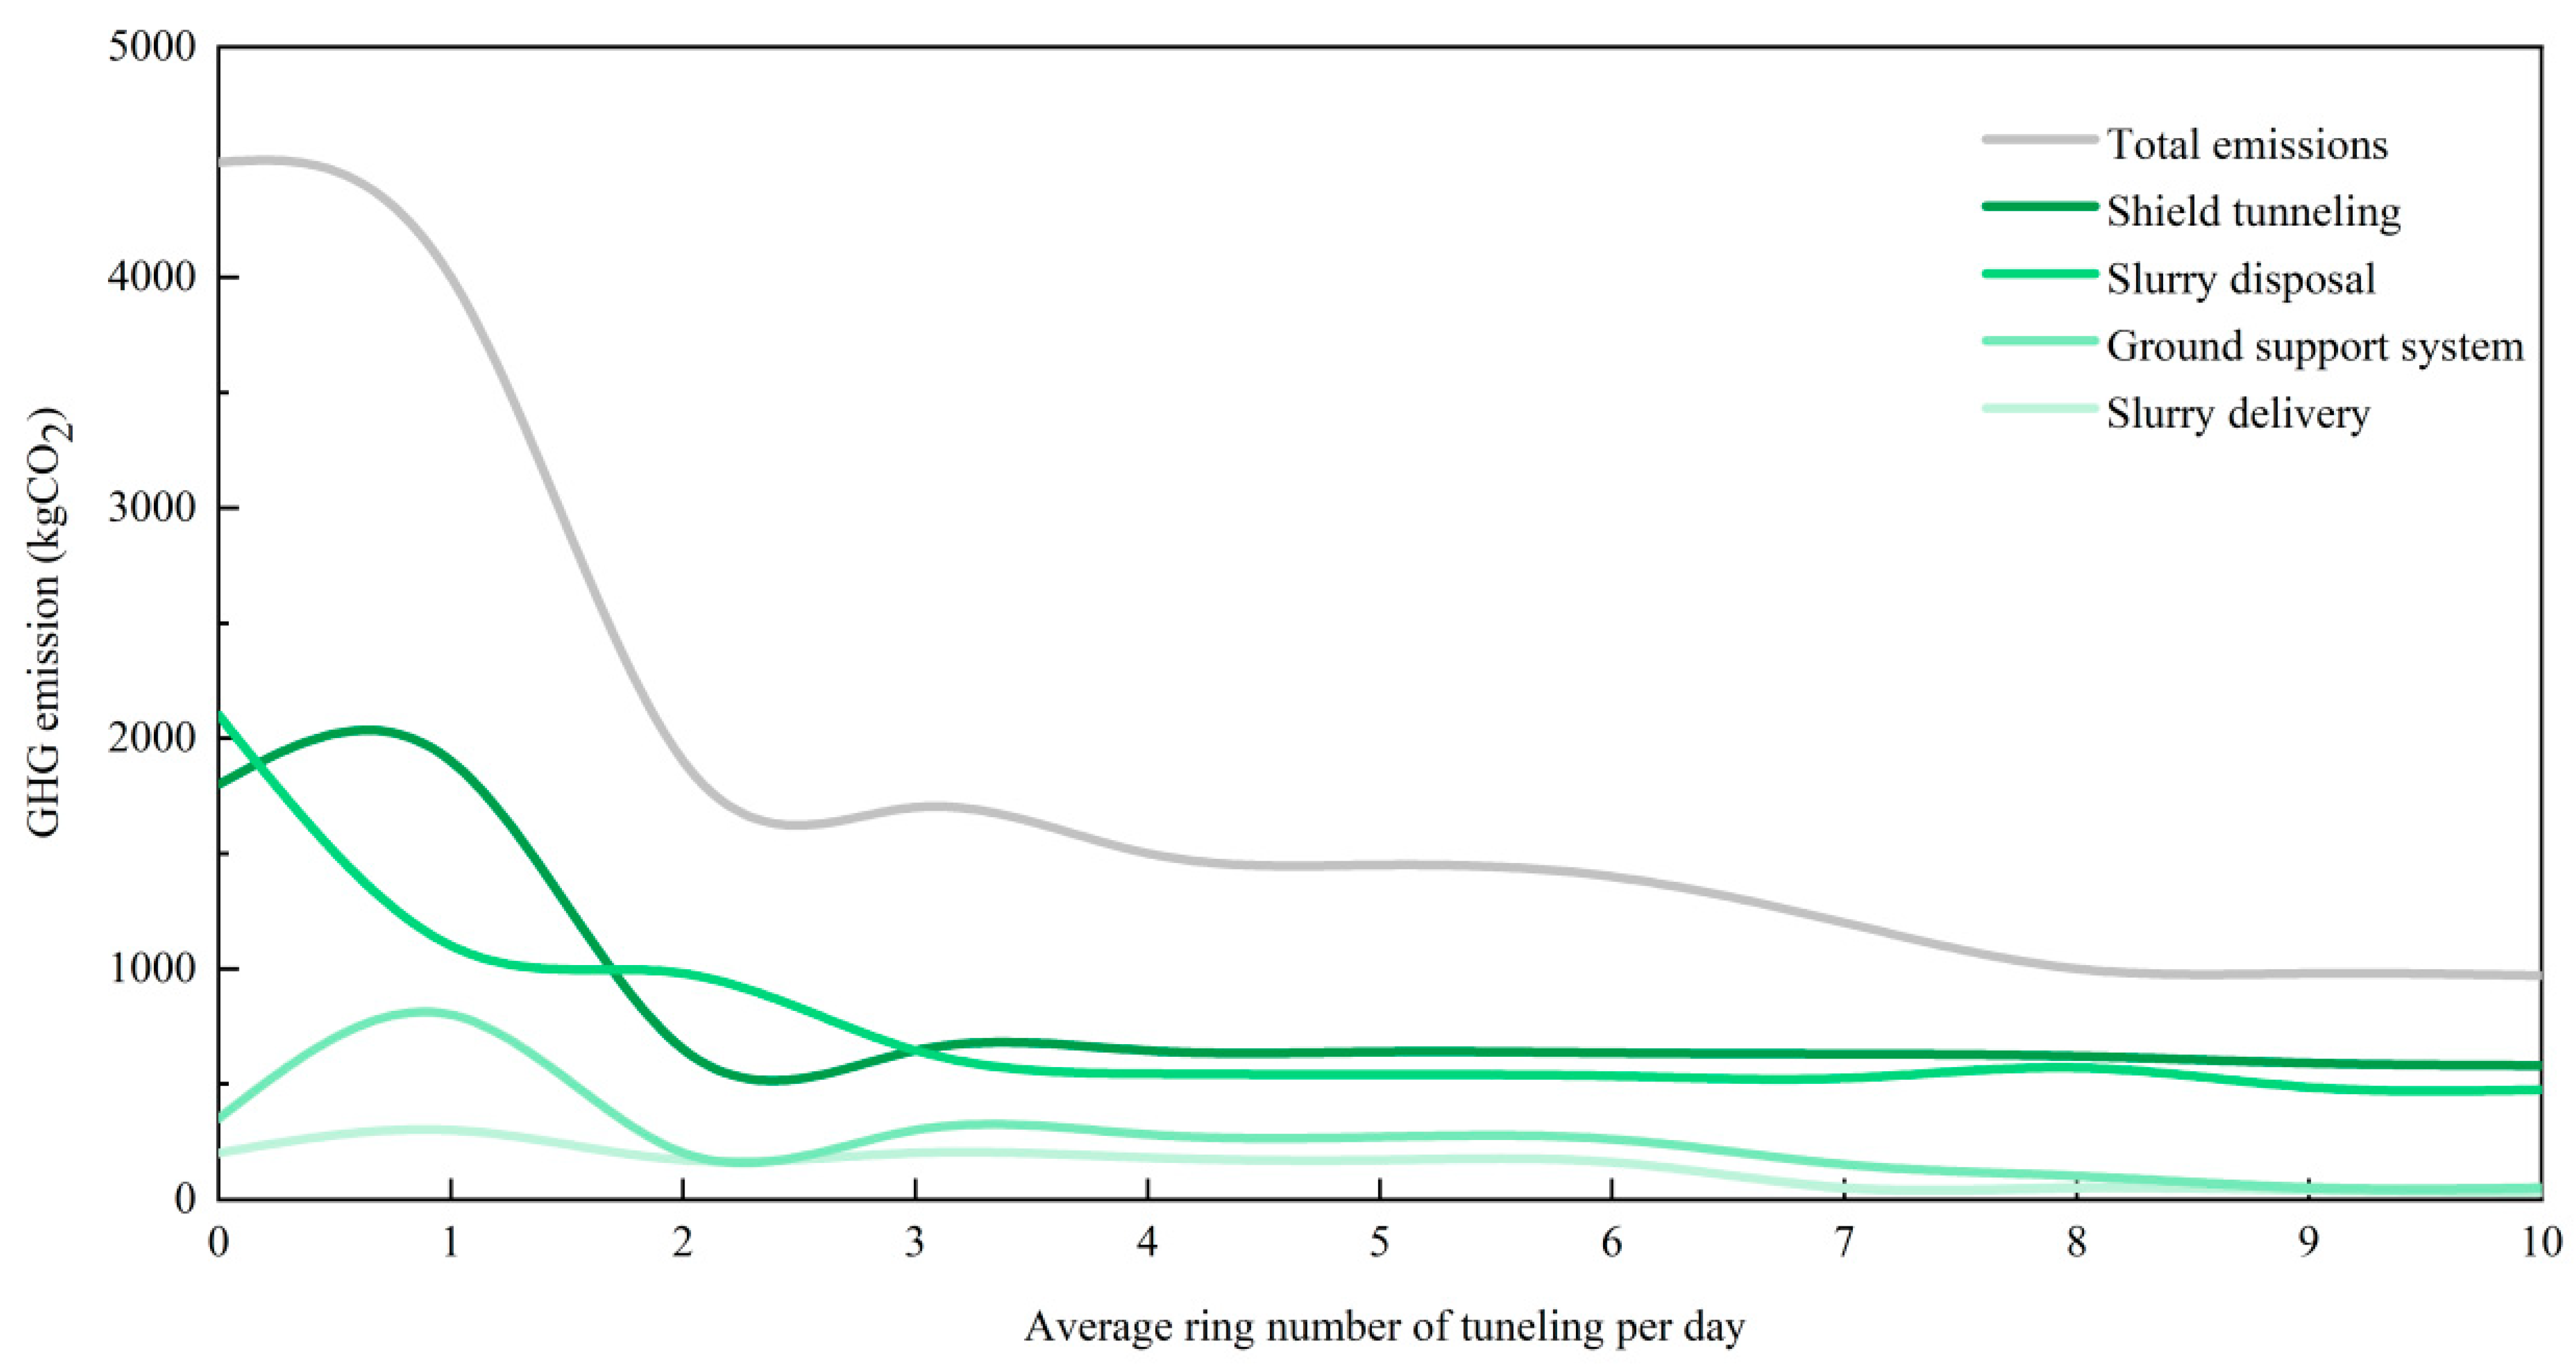
GHG emissions during the tunneling stage have a significant bearing on the efficiency of tunnel construction, and they are negatively correlated. The results suggest that at least three rings per day should be maintained so as to reduce energy waste.

Author Contributions

Conceptualization, X.S.; methodology, X.S.; software, X.S.; validation, X.S., H.L. and Y.W.; formal analysis, X.S.; investigation, X.S.; resources, X.S.; data curation, X.S.; writing—original draft preparation, X.S.; writing—review and editing, X.S.; visualization, W.L.; supervision, L.K.; project administration, L.K.; funding acquisition, L.K. All authors have read and agreed to the published version of the manuscript.

Funding

The authors would like to acknowledge that this research was funded by the National Natural Science Foundation of China, grant number: 51708512.

Institutional Review Board Statement

Not applicable.

Informed Consent Statement

Not applicable.

Data Availability Statement

Data are contained within the article.

Conflicts of Interest

The authors declare no conflict of interest.

Appendix A

Table A1. Emission factors of materials and fuels.
Material/FuelUnitEmission Factors
C40 concrete [23]kg/m3288.9
C60 concrete [23,26]kg/m3222.3
Bolt [23,26]kg/kg2.526
Grouting [23,26]kg/kg71.4
Steel [26]kg/kg2.364
Grease [27,28]kg/104CNY3710
Bentonite [27,28]kg/104CNY5420
PVC pipe [27,28]kg/104CNY6232.2
Rubber [27,28]kg/104CNY2210
Diesel [12]kg/L2.655
Gasoline [12]kg/t2.938
Electricity [12,24]kg/KWh0.923
Table A2. Materials consumption worksheet for tunnel construction per ring.
MaterialsSpecificationUnitQuantityCost (CNY)
Segment
Concretem358.641,020
Steelkg10,50748,122
Mould
Concretem39.375809
Steelkg17488005
Flue sheet
Concretem320.1212,475
Steelkg256511,747
Pavement
Concretem34.72915
Steelkg8553916
BoltBoltkg4.72915
GroutingGroutingm38553916
GreaseGreasekg20023.50
BentoniteBentonitet3.8300
PVC pipePVC pipem4260
Rubber materialRubber materialring11840
Table A3. Average inputs of energy during the material materialization per ring.
ProcessSpecificationFuelEnergy Consumption per Ring
Prefabricated segment
Steaming boilerDiesel178 L
Steel processing plantElectricity55.5 kWh
Electric air compressorElectricity275.31 kWh
Vacuum chuckElectricity246.05 kWh
Concrete mixing plantElectricity180 kWh
Prefabricated mould
Concrete mixing plantElectricity72 kWh
Steel processing plantElectricity154.6 kWh
Prefabricated flue sheet
Concrete mixing plantElectricity47.52 kWh
Steel processing plantElectricity102.04 kWh
Flue sheet installation
Installation plantElectricity29.7 kWh
Table A4. Average inputs of energy during the materials transportation per ring.
ProcessSpecificationFuelEnergy Consumption per Ring
Transportation vehicle
Steyr truckGasoline331.20 L
Delivery truckGasoline6.08 L
Double-ended lorryGasoline0.81 L
LorryGasoline5.79 L
Concrete mixing carrierDiesel5.51 L
Table A5. Average inputs into slurry tunneling per ring.
ProcessSpecificationFuelEnergy Consumption per Ring
Slurry disposal
Disposing plantElectricity1496.25 kWh
Roller screenElectricity19.95 kWh
SprayElectricity204.82 kWh
Water pumpElectricity129.01 kWh
Fluid pumpElectricity30 kWh
Shearing pumpElectricity55 kWh
Slurry delivery
Sludge feed pumpElectricity47.65 kWh
Sludge dischargeElectricity47.65 kWh
Relay pumpElectricity47.65 kWh
Shied tunneling
Cutter head drivingElectricity617.49 kWh
CoolingElectricity25.38 kWh
Hydraulic assistanceElectricity135.34 kWh
GroutingElectricity16.92 kWh
Electric air compressorElectricity33.83 kWh
VentilationElectricity5.92 kWh
Ground support system
LightingElectricity16.27 kWh
VentilationElectricity41.84 kWh
Electricity for workingElectricity41.80 kWh
Water discharge pumpElectricity25.57 kWh
Machine repair roomElectricity30.22 kWh
CraneElectricity74.38 kWh
Table A6. GHG emissions from materials of the tunnel (kgCO2).
No.SegmentMouldFlue SheetPavementBoltGroutingGreaseBentonitePVC PipeRubber MaterialTotal Emissions
137,8656839337911,87611491761174361864840766,287
237,8656839337911,87611491761174361864840766,287
337,8656839337911,87611491761174361864840766,287
437,8656839337911,87611491761174361864840766,287
537,8656839337911,87611491761174361864840766,287
637,8656839337911,87611491761174361864840766,287
737,8656839337911,87611491761174361864840766,287
837,8656839337911,87611491761174361864840766,287
937,8656839337911,87611491761174361864840766,287
1037,8656839337911,87611491761174361864840766,287
1137,8656839337911,87611491761174361864840766,287
1237,8656839337911,87611491761174361864840766,287
1337,8656839337911,87611491761174361864840766,287
1437,8656839337911,87611491761174361864840766,287
1537,8656839337911,87611491761174361864840766,287
1637,8656839337911,87611491761174361864840766,287
1737,8656839337911,87611491761174361864840766,287
1837,8656839337911,87611491761174361864840766,287
1937,8656839337911,87611491761174361864840766,287
2037,8656839337911,87611491761174361864840766,287
2137,8656839337911,87611491761174361864840766,287
2237,8656839337911,87611491761174361864840766,287
2337,8656839337911,87611491761174361864840766,287
2437,8656839337911,87611491761174361864840766,287
2537,8656839337911,87611491761174361864840766,287
2637,8656839337911,87611491761174361864840766,287
2737,8656839337911,87611491761174361864840766,287
2837,8656839337911,87611491761174361864840766,287
2937,8656839337911,87611491761174361864840766,287
3037,8656839337911,87611491761174361864840766,287
3137,8656839337911,87611491761174361864840766,287
3237,8656839337911,87611491761174361864840766,287
3337,8656839337911,87611491761174361864840766,287
3437,8656839337911,87611491761174361864840766,287
3537,8656839337911,87611491761174361864840766,287
3637,8656839337911,87611491761174361864840766,287
3737,8656839337911,87611491761174361864840766,287
3837,8656839337911,87611491761174361864840766,287
3937,8656839337911,87611491761174361864840766,287
4037,8656839337911,87611491761174361864840766,287
4137,8656839337911,87611491761174361864840766,287
Table A7. GHG emissions during the material materialization (kgCO2).
No.Prefabricated SegmentPrefabricated MouldPrefabricated Flue SheetPrefabricated CastingFlue Sheet InstallationTotal Emissions
111732091389271557
211732091389271557
311732091389271557
411732091389271557
511732091389271557
611732091389271557
711732091389271557
811732091389271557
911732091389271557
1011732091389271557
1111732091389271557
1211732091389271557
1311732091389271557
1411732091389271557
1511732091389271557
1611732091389271557
1711732091389271557
1811732091389271557
1911732091389271557
2011732091389271557
2111732091389271557
2211732091389271557
2311732091389271557
2411732091389271557
2511732091389271557
2611732091389271557
2711732091389271557
2811732091389271557
2911732091389271557
3011732091389271557
3111732091389271557
3211732091389271557
3311732091389271557
3411732091389271557
3511732091389271557
3611732091389271557
3711732091389271557
3811732091389271557
3911732091389271557
4011732091389271557
4111732091389271557
Table A8. GHG emissions during the materials transportation (kgCO2).
No.Segment TransferSegmentMouldFlue SheetGroutingInternal MaterialsTotal Emissions
1973.081.660.220.731.368.96986.00
2973.082.470.331.102.028.96987.96
3973.083.270.431.472.678.96989.89
4973.084.090.541.833.348.96991.84
5973.084.900.652.204.008.96993.80
6973.085.710.762.574.678.96995.75
7973.086.520.872.935.338.96997.69
8973.087.330.983.306.008.96999.65
9973.088.141.093.676.658.961001.59
10973.088.961.194.037.328.961003.54
11973.089.761.304.407.988.961005.48
12973.0810.571.414.768.658.961007.44
13973.0811.391.525.139.318.961009.39
14973.0812.071.635.509.988.961011.21
15973.0813.001.745.8610.648.961013.29
16973.0813.821.856.2311.318.961015.24
17973.0814.631.956.6011.978.961017.20
18973.0815.432.066.9612.648.961019.14
19973.0816.252.177.3313.308.961021.09
20973.0817.062.287.7013.978.961023.05
21973.0817.882.398.0614.638.961025.00
22973.0818.682.508.4315.308.961026.94
23973.0819.492.618.8015.968.961028.90
24973.0820.312.719.1616.638.961030.85
25973.0821.122.829.5317.298.961032.81
26973.0821.922.939.9017.968.961034.75
27973.0822.743.0410.2618.628.961036.70
28973.0823.553.1510.6319.298.961038.66
29973.0824.373.2611.0019.958.961040.61
30973.0825.173.3711.3620.628.961042.55
31973.0825.983.4811.7321.288.961044.51
32973.0826.803.5812.0921.958.961046.46
33973.0827.603.6912.4622.618.961048.41
34973.0828.413.8012.8323.288.961050.36
35973.0829.233.9113.1923.958.961052.31
36973.0830.044.0213.5624.618.961054.27
37973.0830.844.1313.9325.288.961056.21
38973.0831.664.2414.2925.948.961058.17
39973.0832.474.3414.6626.618.961060.12
40973.0833.284.4515.0327.278.961062.07
41973.0834.064.5615.3927.948.961063.99
Table A9. GHG emissions arising from tunneling (kgCO2).
No.Slurry DisposalSlurry DeliveryShield TunnelingGround Support SystemTotal Emissions
1694.7465.91497.78123.411381.84
2694.7465.91497.78123.411381.84
3694.7465.91497.78123.411381.84
4694.7465.91497.78123.411381.84
5694.7465.91497.78123.411381.84
6694.7465.91497.78123.411381.84
7596.0764.70597.74170.661429.17
8596.0764.70597.74170.661429.17
9315.4865.91389.0555.29825.72
10315.4865.91389.0555.29825.72
11444.24112.33535.52203.791295.88
12414.7169.04551.77113.991149.51
13627.2764.52504.1473.111269.03
14531.5662.49484.7659.071137.87
15427.7248.73546.9779.561102.99
16427.7248.73546.9779.561102.99
17427.7248.73546.9779.561102.99
18705.3674.95941.83304.412026.55
19705.3674.95941.83304.412026.55
20705.3674.95941.83304.412026.55
21705.3674.95941.83304.412026.55
22522.6078.17891.07199.371691.21
23545.87103.65762.21244.971656.69
24594.50172.32632.63283.551683.00
25578.17151.37788.98301.631820.16
26578.17151.37788.98301.631820.16
27578.17151.37788.98301.631820.16
28578.17151.37788.98301.631820.16
29578.17151.37788.98301.631820.16
30668.07196.23993.42285.952143.67
31668.07196.23993.42285.952143.67
32668.07196.23993.42285.952143.67
33668.07196.23993.42285.952143.67
34668.07196.23993.42285.952143.67
35651.91214.141102.70227.792196.55
36425.41251.151212.64322.592211.79
37857.09276.991409.89471.753015.72
38731.75285.30887.83330.432235.31
39704.24278.75840.21324.352147.55
40777.17303.391411.7392.212584.50
41682.29296.751502.92262.592744.55

References

  1. IPCC 2022. Available online: https://www.ipcc.ch/sr15/ (accessed on 25 February 2024).
  2. Liu, Q.Q.; Wang, S.J.; Zhang, W.Z.; Li, J.M.; Kong, Y.L. Examining the effects of income inequality on CO2 emissions: Evidence from non-spatial and spatial perspectives. Appl. Ener. 2019, 236, 163–171. [Google Scholar] [CrossRef]
  3. DOE (Department of Energy, U.S.). Department of Energy Awards over $16 Million for 23 Projects That Will Reduce Carbon Emissions across the Manufacturing Sector. U.S. Department of Energy. 2021. Available online: https://www.energy.gov/eere/articles/department-energy-awards-over-16-million-23-projects-will-reduce-carbon-emissions (accessed on 25 February 2024).
  4. Dong, F.; Bian, Z.; Yu, B.; Wang, Y.; Zhang, S.; Li, J.; Su, B.; Long, R. Can land urbanization help to achieve CO2 intensity reduction target or hinder it? Evidence from China. Resour. Conserv. Recycl. 2018, 134, 206–215. [Google Scholar] [CrossRef]
  5. Khan, H.; Weili, L.; Khan, I. Environmental innovation, trade openness and quality institutions: An integrated investigation about environmental sustainability. Environ. Dev. Sustain. 2021, 24, 3832–3862. [Google Scholar] [CrossRef]
  6. Wu, P.; Song, Y.; Wang, J.; Wang, X.; Zhao, X.; He, Q. Regional variations of credits obtained by LEED 2009 certified green buildings-a country level analysis. Sustainability 2017, 10, 20. [Google Scholar] [CrossRef]
  7. Wang, T.; Wang, J.; Wu, P.; Wang, J.; He, Q.; Wang, X. Estimating the environmental costs and benefits of demolition waste using life cycle assessment and willingness-to-pay: A case study in Shenzhen. J. Clean. Prod. 2018, 172, 14–26. [Google Scholar] [CrossRef]
  8. Miliutenko, S.; Åkerman, J.; Bjorklund, A. Energy use and green-house gas emissions during the Life Cycle stages of a road tunnel -the Swedish case norra lanken. Eur. J. Transport Infrastruct. Res. 2012, 12, 39–62. [Google Scholar]
  9. Zhang, X. Carbon-emission assessment of large shield tunnel based on data-mining methodology. In Proceedings of the World Tunnel Congress 2016, San Francisco, CA, USA, 22–28 April 2016. [Google Scholar]
  10. Li, X.; Liu, J.; Xu, H.; Zhong, P. Calculation of endogenous carbon dioxide emission during highway tunnel construction: A case Study. In Proceedings of the International Symposium on Water Resource and Environmental Protection, Xi’an, China, 20–22 May 2011; pp. 2260–2264. [Google Scholar]
  11. Huang, L.; Bohne, R.; Bruland, A.; Drevland, P.; Salomonsen, A. Life Cycle Assessment of Norwegian standard road tunnel. In Proceedings of the 6th International Conference on Life Cycle Management in Gothenburg 2013, Gothenburg, Sweden, 25–28 August 2013. [Google Scholar]
  12. Li, Q.S.; Li, L.; Bai, Y. CO2 emissions during the construction of a large diameter tunnel with a slurry shield TBM. In Proceedings of the World Tunnel Congress 2013, Geneva, Switzerland, 31 May–7 June 2013; Anagnostou, G., Ehrbar, H., Eds.; Taylor and Francis Group: Abingdon, UK, 2013. [Google Scholar]
  13. Rodríguez, R.; Pérez, F. Carbon foot print evaluation in tunneling construction using conventional methods. Tunn. Undergr. Space Technol. 2021, 108, 103704. [Google Scholar] [CrossRef]
  14. Fava, J.A.; Denison, R.; Jones, B.; Curran, M.A.; Vigon, B.W.; Selke, S.; Barnum, J. A Technological Framework for Life-Cycle Assessment; Society of Environmental Toxicology and Chemistry (SETAC) Press: Pensacola, FL, USA, 1991. [Google Scholar]
  15. Hendrickson, C.T.; Lave, L.B.; Matthews, H.S. Environmental Life Cycle Assessment of Goods and Services: An Input-Output Approach; Resources for the Future: Washington, DC, USA, 2006. [Google Scholar]
  16. Oladokun, M.G.; Odesola, I.A. Household energy consumption and carbon emissions for sustainable cities e a critical review of modelling approaches. Int. J. Sustain. Built Environ. 2015, 4, 231–247. [Google Scholar] [CrossRef]
  17. Hitchcock, G. An integrated framework for energy use and behaviour in the domestic sector. Energy Build. 1993, 20, 151–157. [Google Scholar] [CrossRef]
  18. Sandanayake, M.; Zhang, G.; Setunge, S. Environmental emissions at foundation construction stage of buildings e two case studies. Build. Environ. 2016, 95, 189–198. [Google Scholar] [CrossRef]
  19. Ahn, C.; Xie, H.; Lee, S.H.; Abourizk, S. Carbon footprints analysis for tunnel construction processes in the preplanning phase using collaborative simulation. In Construction Research Congress 2010: Innovation for Reshaping Construction Practice; ASCE: Reston, VA, USA, 2010; pp. 1538–1546. [Google Scholar] [CrossRef]
  20. Su, B.; Huang, H.C.; Ang, B.W. Input-output analysis of CO2, emissions embodied in trade: The effects of sector aggregation. Energy Econ. 2010, 32, 166–175. [Google Scholar] [CrossRef]
  21. Quota Station for Highway Engineering, MOT. JTGT B06-02-2007 Highway Engineering Budget Quota; China Standard Press: Beijing, China, 2007. (In Chinese) [Google Scholar]
  22. The PRC MOHURD. The Drafting Standard for the Cost Budget of the National Unified Construction Machine Team; China Planning Press: Beijing, China, 2011. (In Chinese) [Google Scholar]
  23. Chau, C.; Soga, K.; O’Riordan, N.; Nicholson, D. Embodied energy evaluation for sections of the UK Channel Tunnel rail link. Proc. Inst. Civ. Eng. Geotech. Eng. 2012, 165, 65–81. [Google Scholar] [CrossRef]
  24. National Development and Reform Commission of Climate Change. Chinese Regional Power Grid Baseline Emission Factors in 2016. 2017. Available online: https://www.ndrc.gov.cn/hdjl/yjzq/index.html (accessed on 1 May 2017). (In Chinese)
  25. IPCC. 2006 IPCC Guidelines for National Greenhouse Gas Inventories; IPCC: Geneva, Switzerland, 2006; Volume 3, pp. 1–40. [Google Scholar]
  26. GB/T 2589-2008; National Standard of the People’s Republic China. General Principle for Calculation of Total Production Energy Consumption. China Standard Press: Beijing, China, 2008.
  27. Department of National Account of National Bureau of Statistics. Input-Output Tables of China in 2012; China Statistics Press: Beijing, China, 2015. [Google Scholar]
  28. Energy Statistics Division of National Bureau of Statistics. China Energy Statistics Yearbook 2013; China Statistics Press: Beijing, China, 2014. [Google Scholar]
  29. Chen, K.; Duan, H.; Zhang, Y. Research on carbon emission intensity and reduction potential in Guangzhou metro shield tunnel construction phase. Tunn. Constr. 2022, 42, 2064. [Google Scholar]
  30. Li, Q.; Bai, Y.; Li, L. Study of Influential Factors and Measures for Low Carbonization during the Construction of Shield Tunnels. Mod. Tunn. Technol. 2015, 52, 1–7. [Google Scholar]
  31. Su, Y.; Zhang, Y.; Duan, H.; Li, Q. Research on Environment impact assessment and emission reduction potential of metro construction: A Case Study in Shenzhen, China. Environ. Eng. 2022, 40, 184–192, 236. [Google Scholar]
Figure 1. System boundary.
Sustainability 16 02702 g001
Figure 2. Model structure.
Sustainability 16 02702 g002
Figure 3. System boundary of the tunnel construction.
Sustainability 16 02702 g003
Figure 4. GHG emissions percentage of four stages during the tunnel construction.
Sustainability 16 02702 g004
Figure 5. Components of four stages during the tunnel construction.
Sustainability 16 02702 g005
Figure 6. GHG emissions produced during the tunnel construction.
Sustainability 16 02702 g006
Figure 7. GHG emissions arising from materials transportation process.
Sustainability 16 02702 g007
Figure 8. GHG emissions caused during tunneling process.
Sustainability 16 02702 g008
Figure 9. Average GHG emissions from materials for each ring.
Sustainability 16 02702 g009
Figure 10. Average GHG emissions during material materialization for each ring.
Sustainability 16 02702 g010
Figure 11. Average GHG emissions from materials transportation for each ring.
Sustainability 16 02702 g011
Figure 12. Average GHG emissions during tunneling each ring.
Sustainability 16 02702 g012
Figure 13. Correlation between average ring number per day and emissions.
Sustainability 16 02702 g013
Table 1. Comparisons between P-LCA and I-O-LCA models.
P-LCAI-O-LCA
AdvantagesDetailed analysis of specific processesObjective boundary selection
Product comparisonsEconomy-wide, system LCA
Simple principlePublicly available and fast-update data
Easy to achieveTake indirect inputs into account
Identify process improvements
DisadvantagesSubjective boundary selectionAggregated level of data
Truncation errorDifficult to identify the process improvements
Take no account of indirect inputsNo detailed analysis of specific processes
Lack of comprehensive in certain casesUncertainty
Data-intensive and time-consuming
Poor timeliness
Uncertainty
Table 2. Average GHG emissions of each ring during the tunnel construction.
ValueMaterials (kgCO2)Materialization (kgCO2)Materials Transportation (kgCO2)Tunnelling
(kgCO2)
Total (kgCO2)
Maximum66,286.81566.5986.0825.7 69,665.0
Minimum66,286.81566.51064.03015.7 71,933.0
Average66,286.81566.51025.01733.070,611.3
Percentage93.88%2.22%1.45%2.45%100%
Table 3. GHG emissions comparison of three types of segments.
Segment TypeThickness (mm)Steel Ratio (kg)Concrete (m3)Steel (kg/m3)Emissions (kgCO2)Variation
600179.358.6179.3 37,865100%
500179.350.2179.3 31,617−16.5%
600161.458.6161.435,290−6.8%
Table 4. Sources of emissions caused by prefabricated segment.
SourcesValueUnitEmission Factor (kgCO2/Unit)Emissions (kgCO2)
Electricity757KWh0.923699
Diesel178L2.655473
Disclaimer/Publisher’s Note: The statements, opinions and data contained in all publications are solely those of the individual author(s) and contributor(s) and not of MDPI and/or the editor(s). MDPI and/or the editor(s) disclaim responsibility for any injury to people or property resulting from any ideas, methods, instructions or products referred to in the content.

