Article

Elite Speech about Climate Change: Analysis of Sentiment from the United Nations Conference of Parties, 1995–2021

1
Department of Psychological and Brain Sciences, College of Natural Sciences, University of Massachusetts Amherst, Amherst, MA 01003, USA
2
Data Analytics and Computational Social Science, College of Social and Behavioral Science, University of Massachusetts Amherst, Amherst, MA 01003, USA
*
Author to whom correspondence should be addressed.
Sustainability 2024, 16(7), 2779; https://doi.org/10.3390/su16072779
Submission received: 31 January 2024 / Revised: 7 March 2024 / Accepted: 19 March 2024 / Published: 27 March 2024
(This article belongs to the Special Issue Transdisciplinary Perspectives on Environment and Communication)

Abstract

:
The Conference of Parties (COP) is the longest running forum for international discussion of climate change and offers rich data in the form of speeches. Studying how elites have historically communicated about climate change can help us understand their approaches to address climate change. In this study, we analyzed 2493 COP statements from 1995 to 2021 to describe how sentiment is used, and to see whether specific issues associated with climate policy (adaptation, mitigation, financing, development, disasters) are discussed in particular sentiment contexts. Quantitative analysis (sentiment analysis with multi-level modelling) revealed that leaders expressed high levels of positive sentiment in these diplomatic statements, but also some negative sentiment. Over time, representatives at COP used more positive, angry, and fearful sentiments in speeches. Representatives of wealthier and more developed countries expressed themselves differently than those from less wealthy and developing countries. To examine sentiment surrounding policy issues we used embedding regression. Countries expressed different sentiments about adaptation, mitigation, and development depending on their development status, and about disasters depending on their wealth. Shifts in sentiment over time were observed when results were plotted graphically, and these shifts may be related to specific events and agreements. Using these two approaches, we highlight how those with the power to make top-down changes to address climate change have historically talked about this issue.

1. Introduction

Severe climate change impacts such as increased extreme weather events, forced migration and displacement, and sea-level rise are occurring or will soon occur [1]. Addressing climate change through mitigation of greenhouse gas (GHG) emissions requires collective action and cooperation across the world. Adaptation is also required to help people and communities cope with a changing climate, but this requires transfer of technology, knowledge, and funding to ensure that those most impacted can adapt. To facilitate this kind of cooperation, international environmental agreements have been established which codify cooperation and shared climate goals [2,3]. One example of the use of these agreements is the United Nations Framework Convention on Climate Change (UNFCCC), which created a forum for leaders from around the world to discuss climate change mitigation, adaptation, and climate impacts. In our work, we explored the proceedings of the UNFCCC to gain insight into the types of sentiment expressed by high-ranking representatives in speeches about climate change delivered at an international forum, and predictors of such sentiment. Sentiment in speeches can reflect the public position and attitudes of speakers [4,5], and in this case allowed us to see how elites (i.e., people with power, high-ranking decision-makers and officials, politicians) engage with the issue of climate change. Using state-of-the-art computational approaches, we analyzed archived statements from the Conference of Parties (COP) spanning from 1995–2021. We had three questions: first, how has sentiment in elite speech about climate change shifted over time? Second, does sentiment in speeches differ as a function of characteristics of a representative’s country? Third, what sentiment is associated with specific issues of adaptation, mitigation, financing, development, and disasters?

1.1. Sentiment in Elite Speech and Climate Change Emotions

Systemic changes from leaders will be necessary to address climate change, and examining the communication methods of elites who may be positioned to make these changes could provide insight into their attitudes. Leader and political communication in its various forms has been the subject of much scholarship to understand social phenomena [5,6,7]. The tone and focus of public discourse within a nation can be influenced by leaders, and leaders will alter their speech depending on public attitudes [8]. Authority figures have strong social influence [9,10], so the ways that they discuss issues are likely to influence individual attitudes and behaviors.
Sentiment is a feature of leader speech that has been studied [4,11]. Detecting expressed emotions in speech provides insight into leader attitudes towards specific issues. In the climate change domain, the role of emotion in communication has also received considerable attention [12,13,14,15,16]. In this study, we focused on fear, anger, sad, positive, and negative sentiments, because there is work in the climate communication domain which suggests experiencing or eliciting these emotions has an influence on attitudes and behaviors.
Fear, for example, is associated with a motivation to engage in protective behaviors to avoid a threat. In the context of communication about hazards, however, it has been found that evoking fear is insufficient on its own to promote protective behaviors; additional kinds of information must also be included, such as provision of possible solutions to avoid or mitigate the threat [17,18,19]. When talking about climate change, leaders may attempt to evoke fear as a call to action—to draw attention to a threat that needs to be addressed.
Anger can indicate experienced harm, assignation of blame and responsibility, and motivate collective action [20,21]. When people perceive that the majority feels angry about climate change, this increases their support for climate policy [22]. While we might expect that leaders would avoid anger in the name of diplomacy, there is a history of leaders expressing anger as a means of eliciting concessions from those they are communicating with [23]. It has also been found that leader speech containing anger can precede acts of aggression [7,24]. Climate change is a justice issue [25,26] and leaders may use the international stage to draw attention to this injustice and express anger to increase support for policy change.
Individuals experience sadness in response to a loss, and the emotional experience can promote reflection, rest, and signals distress to others to elicit helping [27]. Messages about climate change which convey sadness can increase individual pro-environmental behavior [28]. Leaders at COP might use sadness to draw attention to losses they have experienced (e.g., disasters), or to try to obtain assistance.
Positive sentiments such as hope and optimism are important at the level of an individual, particularly in the face of an existential threat such as climate change that requires long-term engagement [29,30]. It has been theorized that positive emotions promote collective action, for instance, because feelings of enthusiasm might increase loyalty towards political leaders and thus willingness to take action [31]. Pro-environmental attitudes and behaviors may also be increased through positive emotions [32].
When communicators choose to use sentiment, different emotions being elicited or expressed have different implications for the audience. Leaders might strategically use different framings to evoke emotions in the audience. Impassioned speech could be used as a means of garnering support from an international audience. On the other hand, leaders might hesitate to use emotional language for the sake of diplomacy. Some work has also found that expression of emotion as compared with neutral language can undermine a communicator’s credibility [33,34]. The emotion in speech might also be influenced by and reflect societal events [35]. Studying sentiment in the speeches delivered at COP provides insight into the attitudes and potential motivations of leaders and may reveal trends in sentiment over time. Besides describing the sentiment in these speeches, we delved into two questions: first, how has sentiment in statements changed over the course of the COP, and second, how do other contextual factors (features of the speaker’s country, topics of discussion) relate to sentiment?

1.2. History of the Conference of Parties

To study elite speech on the topics of climate policy and impacts, we used the context of the UNFCCC. The UNFCCC is an international treaty adopted in 1992 to address climate change [36]. An important feature of the Framework Convention is that it separates party members into Annex I and Non-Annex I countries, representing developed and developing nations, respectively. The UNFCCC established the COP as a forum for parties to negotiate commitments. At these annual conferences, politicians, ministers, and other governmental staff, along with some observers (such as NGOs and research groups) are provided with the opportunity to communicate and negotiate. Key agreements, including the Kyoto Protocol, which entered into force in 2005, and the Paris Agreement, which entered into force in 2016 [37], resulted from these conferences. Longer discussions of the development and history of the UNFCCC and COP are available elsewhere [37,38,39,40,41]. Our interest was in studying statements from COP1–COP26 to describe elite sentiment about climate policy and issues.

1.3. Existing Analyses of COP Statements

Researchers have studied communications from the COP using a variety of methods. Traditional qualitative approaches have included the discourse analysis of a set of speeches from the Convention on Biological Diversity [42] and the study of whether Annex membership influenced the negotiation processes by coding statements to identify whether they declared support for other parties [43]. These examples employed traditional human coding approaches which allowed for in-depth exploration and interpretation of statement content. However, these approaches are limited by the number of statements that can feasibly be included. Computational text-as-data approaches offer alternate methods of classifying, describing, and extracting the contextual meaning of text [44], and we employed these methods in our study.
Some analyses of the COP have utilized computational analysis, reflecting the growing interest in the field for using these methods for large corpora. For instance, Genovese [45] analyzed text to see whether being part of a coalition can result in the convergence of views depending on the similarity and affinity of the members of that coalition. Using word embeddings, they identified the relative positionality of countries using speeches from COP16–COP22. By creating similarity scores between pairs of statements, they evaluated whether statement similarity was explained by membership in coalitions, shared Annex membership, similarity in climate risk, and other features of the countries (e.g., language, geographic distance, ideological similarity) [45]. This study found that the statements of members of homogenous groups in the UNFCCC were similar, and belonging to a coalition increased statement similarity. Another study from Mehmood and Honkela [46] employed a feature extraction approach to generate a term-frequency matrix, which they then represented visually in a two-dimensional space using a Self-Organizing Map to clarify statement similarity. Besides identifying similarities across statements, they were also able to include contextual information about the speaker’s country (e.g., socioeconomic characteristics) and tested whether this information related to similarity. While these two studies make use of new computational approaches to studying text, both used a limited number of statements, and did not examine sentiment.

1.4. The Current Study

Given the volume of speeches delivered over the past two decades, human coding approaches would be infeasible. One of the strengths of computational text analyses that we leverage in this study is that they can extract information from large quantities of text data. Sentiment analysis allows us to evaluate the level of emotive expression. In dictionary-based sentiment analysis, terms in a document are compared to the terms in a dictionary that consists of lists of words which have been assigned a sentiment score [47]. Counting instances of terms associated with sentiment, and weighting in multiple ways (e.g., the proportion of the frequency of sentiment scored terms to the length of a document), an overall sentiment score for a given document can be calculated [48]. This bag-of-words approach, is useful for broadly describing and understanding a phenomenon through large bodies of text [49], and in our study allows us to understand sentiment at the document (statement) level in relation to the time period and representative’s country characteristics.
However, this approach does not account for context, which is a recognized limitation of bag-of-words sentiment analysis [50,51], including the inability to incorporate negation into the computation of sentiment. Another method we use to analyze sentiment while taking the context into account is embedding regression [52]. This state-of-the-art approach allows us to understand sentiment towards specific policies and issues while considering characteristics of the representative’s country. Because words tend to be used in certain contexts, each word in a sentence can be numerically expressed using the distribution of co-occurring words, and a sense of meaning can be extracted through these word embeddings. By using distributions of words surrounding key terms, embedding approaches allow us to better understand those terms in context, and in relation to other relevant terms and word lists [52].

1.4.1. Sentiment Trends over Time

In this study, we employ sentiment analysis in combination with two analytic methods, multi-level modeling and embedding regression, to study three questions. First, how has sentiment changed over time from the first conference in 1995 until the 26th in 2021? The impacts of climate change have accelerated in the past decades, along with GHG emissions. Since the start of the UNFCCC, there has been increased research on, documentation of, and understanding of climate change and its impacts [1]. These phenomena likely influence sentiment. Further, because there has been a failure at a global level to meet targets set for GHG emissions, and the time to prevent potentially catastrophic environmental tipping points is becoming shorter and shorter, frustration might increase in speeches. While there have been efforts towards sustainable solutions to climate change, overall progress has been insufficient, and impacts of climate change have increased, which may result in greater negativity, more fear, and more sadness in acknowledgement of these losses and failures, and greater anger towards a failure to achieve targets. We also believed positive sentiment might decrease due to less expressed hopefulness or optimism. However, key events which took place might disrupt this trend (e.g., increased positivity and less negativity following COP21 and adoption of the Paris Agreement).

1.4.2. Sentiment towards Climate Policy and Impacts

Second, how do leaders talk about different issues in relation to sentiment over time? There are different facets of climate policy and impacts that leaders have focused on. Sentiment is highly contextual in terms of the topics that a speaker delivers, which can generate a document with a mix of opposite types of sentiment. In embedding regression, we can identify seed words which we then examine in context. Here, we chose to focus on ‘adaptation’, ‘mitigation’, ‘financing’, ‘development’, and ‘disaster’. In its initial version, the UNFCCC had the overarching goal of mitigating GHG emissions to limit concentrations of such gases to prevent “dangerous anthropogenic interference with the climate system” (p. 4, UN, 1992). While mitigation was a major goal, the view of some was that adaptation efforts were akin to giving up [44]. One argument was that relying on or planning for adaptation would impede mitigation efforts [53,54]. However, it is apparent that adaptation is needed—climate impacts and increasing vulnerability of people around the world demand action. While mitigation requires global efforts, adaptation can be achieved at a smaller scale if those implementing adaptation have access to the necessary resources [54]. Within the UNFCCC, adaptation was discussed during the first conference, yet the adaptation fund was not established until COP6 [55]. An adaptation committee was established in 2010 to better coordinate support for adaptation projects [56], although at the same time the adaptation fund was considered to be severely underfunded. At COP15, parties agreed that $100 billion USD would be needed yearly and yet the following year the fund contained only $30 billion.
The second set of terms relevant to the UNFCCC are ‘financing’ and ‘development’. Annex I countries were initially expected to be the leaders on mitigation and adaptation under the Kyoto Protocol, but the Paris Agreement calls on all parties, including Non-Annex I parties, to establish GHG commitments [37]. However, the overarching principle that parties with more wealth, greater access to technology and expertise should still be leading the way and helping other parties achieve their goals remains. Sentiment towards financing might vary, such that representatives from Annex I and higher income countries discuss positive aspects of financing (e.g., money they have contributed), whereas those from lower-income or developing nations would discuss financing in the context of calls to action. Next, development is an important issue under the UNFCCC, given that one of the conditions is that the efforts to address climate change should not impede development or developing nations [37]. The development of high income countries relied on fossil fuels which developing nations are now discouraged from using. Attitudes towards development may change over time as GHG emissions have continued to increase, in part due to pursuit of continued economic growth and development. Developing nations might express different attitudes about development than developed ones—perhaps greater hope or optimism about their development, or negative sentiment due to concerns about the difficulty of pursuing sustainable development pathways.
Finally, we wanted to examine sentiment surrounding the consequences of climate change. We chose to examine how these elites talk about disasters. Climate change is associated with the increased frequency and intensity of many natural disasters [57]. Studying sentiment towards disasters, whether it be in pleas to take action to prevent harm or in the context of acknowledging losses, is one way that we can understand how the impacts of climate change are being felt. Previous work has found that experience of disasters is associated with increased belief in anthropogenic climate change, and increased concern about the risks of climate change [58,59], and perhaps communication about or reminders of disasters would also reflect this. Besides studying sentiment towards these climate-related seed words over time, there are also interesting questions about variation in sentiment by features of the representative speaker’s country.

1.4.3. Positionality of Leaders and Sentiment

Because leaders from different countries have different motivations in coming to the COP, our third main question was how features of their country—income, climate risk, and Annex status—relate to sentiment. There are 197 parties to the convention, and these parties are diverse in terms of socio-economic features, responsibilities according to the UNFCCC, and climate risk.
One characteristic of the convention is that responsibilities and commitments are not equally distributed across parties. Annex I countries are seen to have greater responsibility to address climate change through mitigation and adaptation because of their historical contributions to GHG emissions and their access to resources to be able to implement climate solutions. Although the Paris Agreement changed the way that responsibilities are distributed from legally binding agreements (Kyoto Protocol) to voluntary emissions targets [37], there is still an expectation that efforts on climate change should be led by Annex I countries. In their statements, we would predict that Annex I countries would want to focus on the positives and achievements (e.g., highlighting how much money they have contributed by discussing financing positively), and would be less likely to draw attention to their own failings, or to spend too much time emphasizing the need for urgent action, because they bear greater responsibility to take such action. On the other hand, Non-Annex I countries which are developing and lower in income may be more willing to draw attention to the negatives: the impacts of climate change that they are not able to deal with effectively (e.g., speaking about the negative impacts of disasters) or concerns for their country’s uncertain future. However, an alternate argument could be made that lower income countries would want to avoid negativity and blame (i.e., anger) in their speeches to ensure that other parties are still willing to provide help to their country. As compared with developed countries which have already reaped the benefits of fossil fuels during their economic and industrial development, developing countries are pressured to pursue more sustainable development pathways, even when those pathways are difficult to realize. Discussion of development might be more fraught for Non-Annex I countries which have a right to develop, but who are also constrained and asked to do their part in mitigation following the Paris Agreement. For this topic, sentiment differences may be more nuanced as well, such that differences by Annex may be less apparent than differences by income.
The harms of climate change are not equally distributed and vary greatly as a function of location. Extreme weather events have disproportionately impacted poorer countries [60]. We predicted that sentiment would vary by risk exposure: countries that are highly vulnerable to climate shocks would be more concerned about the issue of climate change. Thus, some speakers would be more motivated to draw attention to climate harms and losses they may have experienced (which will likely include fear and sadness, particularly around disasters), and more blame towards those they may perceive as being responsible for failures to prevent such harms and losses (expressions of anger).
Prior to the computational analyses of these texts, both authors read a hundred statements from each Annex, randomly sampled across years, and this reading informed some of these predictions. In addition to looking at each predictor of sentiment on its own, we wanted to identify whether any of these were uniquely predictive of each sentiment using regression models. In past work, Annex membership, for example, was found to be a strong predictor of statement similarity between parties, above and beyond other characteristics [45]. Certain features might interact to predict specific sentiments. For example, income could interact with climate risk to predict sadness, such that the relationship between climate risk and sadness is strongest for lower income countries, which have less ability to address the climate risks they face, and thus express sadness in the face of inevitable loss. Because the literature on the corpus of interest (and generally on political speech about climate change) is limited, we did not make specific predictions regarding which country features will most strongly predict each sentiment nor about how they might interact.
In the following sections, we will describe the data used and the way it was prepared for analysis. Next, the methods of analysis are explained. First, we explain how sentiment analysis was used in conjunction with multi-level modeling. Second, we discuss our approach using embedding regression, a method designed by Rodriguez and colleagues [52] who refined this analytic approach using earlier work and data from Osnabrügge and colleagues [34]. Although the first method we used allows us to broadly understand sentiment at the document level, using word embeddings in conjunction with sentiment analysis allowed us to understand sentiment in context. The results of these two approaches are then discussed.

2. Materials and Methods

2.1. Corpus and Meta-Data

The primary data used in this study consisted of publicly available records of statements delivered at COP from 1995–2021. Although these statements vary in length, given the time limit provided to speakers, most consist of one to two pages of text. All available statements (N = 3501) were downloaded from the UNFCCC Digital Archives (https://archive.unfccc.int/ (accessed on 17 June 2023)). All analyses were performed using R. Before pre-processing, all non-English language speeches were removed (n = 960), first by using the cld2 package [61] to detect language, and then by manually checking speech classifications. Next, duplicate records were removed (n = 48). The corpus consisted of 2493 statements, 1886 of which were delivered by representatives of a country (rather than observers or UN leaders). Details and descriptive statistics for the documents, and details on the pre-processing of the text are provided in the Supplementary Materials. The top 150 terms in the corpus following removal of stop words are shown in Figure 1. Although frequency of a word does not necessarily represent its importance, reviewing these top terms helped us to identify the seed words we used in the later analyses.
For each statement from a country representative, where it was available, we attached meta-data including that country’s income, climate risk, and Annex membership. In the corpus, there were statements from 177 countries, none of which had a dominant presence. Australia, Japan, Kenya, and Indonesia had the most statements, yet each contributed statements that made up only 1% of the corpus. To capture a country’s income, we used per capita GDP in 2015 U.S. dollars by year, available through the UN statistics division (https://unstats.un.org/unsd/snaama/ (accessed on 20 June 2023)). After combining this data with the appropriate statement, year, and country, the median income of the countries included in the corpus was $5125, but this ranged from $122–179,465. For our approach using embedding regression, we then used this GDP variable to create a classification for each statement as low, lower middle, upper middle, or high using the quartiles as cut-off points for each category. We also added the Annex status of the country as of 2022, accessed via the UNFCCC website (https://unfccc.int/process/parties-non-party-stakeholders/parties-convention-and-observer-states (accessed on 20 June 2023)). Although Annex membership does correlate with the income of a country, there are countries which sometimes have low GDP that are in Annex I (e.g., Ukraine), and countries which sometimes have a high GDP (e.g., Bahamas) that are not in Annex I, so we thought it important to include both measures. Table 1 provides further detail on the classification of statements in the corpus. We wanted to capture climate risk experienced, and used an index created by GermanWatch, The Global Climate Risk Index (CRI) for 2021. This index is calculated by analyzing extreme weather events along with socioeconomic information. A country’s CRI score is based on information on risk exposure and losses from 2000–2019 (GermanWatch, 2021). However, it is a time invariant measure, so for each country’s statement, regardless of the year, only one CRI score is used. The CRI is normally scored such that lower scores indicate greater risk, but we reverse-coded this variable to make interpretation easier, such that higher scores indicate more climate risk. The rescaled risk scores ranged from 0–164, with a mean of 89, and a standard deviation of 40.

2.2. Sentiment Analysis in Multi-Level Models

Once the data had been pre-processed, we conducted lexicon-based sentiment analysis [62] using an adapted version of the NRC EmoLex [63]. Because we were interested in sentiment in the climate domain, we adapted the lexicon to the context. For example, we removed sentiment coding of the term ‘change’ as this term was used primarily in the phrase ‘climate change’ (see Supplementary Materials for other changes). To calculate sentiment the number of terms which are coded as having a particular sentiment were divided by the total number of terms included in the document and multiplied by 100. Thus, for positive, negative, fear, anger, and sadness sentiments, the score of a speech can be understood as what percentage of terms express the given sentiment. To calculate polarity, the negative score of a speech was subtracted from the positive score for a speech, such that positive scores would indicate the speech contained more positive than negative sentiment, whereas a negative score would indicate more negative than positive sentiment.
These document sentiment scores were used in our multi-level modeling approach as our dependent variables. Because the statements from a given country were not truly independent (i.e., there is some expectation that countries will have some consistency in their climate goals and action), we used a two-level model in which years were nested in countries, with the dependent variable being the sentiment. We were interested in time trends but needed to account for the clustered nature of the data. In these models, we regressed sentiment on year, income, climate risk, and Annex. The unit of analysis here was the entire document, which provides useful but coarse results about the general or overall sentiment expressed.

2.3. Embedding Regression of Sentiment

The second method of sentiment analysis used word embeddings in a regression-like framework [52]. The embedding regression approach allows us to see how words are used differently by covariates of interest: across time, between statements from different income groups, and between Annex I and Non-Annex I. The bag-of-words approach we used in the multi-level modeling does not allow us to distinguish what the targets of sentiment are, and limits our interpretation of how representative speakers might feel about climate change. For instance, while conventional sentiment analysis ignores all specific contexts which could have differently contributed to the level of computed sentiments in a document because it aggregates all scored terms regardless of specific context where positive or negative sentiments are expressed, specific sentiment about substantive issues (e.g., needed financing for an adaptation program) could be mentioned only once or twice. The embedding regression with sentiment approach helps us attend to more granular analysis, and has been developed to work even with very few instances of a seed word [52], meaning that we can use this approach to better understand sentiment towards these policy issues, even when they are mentioned infrequently.
More specifically, embedding regression with sentiment analysis uses word embeddings, which represent text as a vector of values, the size of which is determined by the size of the window around a focal term rather than by the size of the entire document (i.e., total number of terms) [52]. Therefore, the context of a seed word is more precise and becomes more concrete. The reasoning behind this approach is that word embeddings provide contextual meaning, defined based on the neighboring words around seed words, via distributed representations in the form of vectors, which we can then compare with other vectors for similarity. We can calculate the inner product between these vectors, and when the inner product is high it means that the terms appear in similar contexts, and thus are inferred to have a similar meaning [52]. In the context of sentiment analysis, the embedding regression approach allows us to compare the embedding of a seed word (e.g., “adaptation”) to the aggregate embedding of word lists from a sentiment dictionary (e.g., embeddings of “anger” words). Using the adapted version of the NRC we generated wordlists for positive, negative, angry, fear, and sad sentiments. We then embedded the seed words and sentiment words using à la carte embeddings with a six-word window, using GloVe embeddings and the transformation matrix A from Khodak et al. [52,64], which down weights the impact of frequently used but less important terms, following the method described by Rodriguez and colleagues [52]. To implement this analysis, we aggregated embeddings of the seed words, such that each observation represented the aggregate embedding of the seed word from all statements delivered in a given year, income level, and Annex. This results in values of sentiment for a seed word, for example, being calculated for 1997-Low Income-Annex I or 2015-High Income-Non-Annex I. The terms we chose were ‘adaptation’, ‘mitigation’, ‘financing’, ‘development’, and ‘disasters’, which were important and frequent terms over time (see Figure 1). Information about the frequency of these terms is provided in the Supplementary Materials Table S6.

3. Results

3.1. Sentiment Analysis with Multi-Level Modeling

First, we examined average sentiment across the entire corpus and correlations of sentiment with our key predictors, see Table 2. Overall, across all statements, positive sentiment was more common than other sentiments, and sad sentiment the least common. The bivariate associations revealed that increases in GDP were associated with less negative, less fearful, less angry, and less sad sentiment. Climate risk was positively correlated with fear and sadness. Annex I countries expressed less negative, fear, angry, and sad sentiments. Time was also associated with increase positive, negative, fear, anger, and sad sentiments.
We also examined sentiment by year, see Figure 2. These plots show average sentiment by year grouped by Annex. In observing these figures, it is of interest to compare the ranges of sentiment by Annex. For instance, when looking at sad sentiment (bottom-right panel of Figure 2), we can see that there is little overlap in terms of the range of values for Annex I and Non-Annex I, such that the lowest values for Non-Annex I are similar to the highest observed values of sad sentiment for Annex I statements.
For our primary analyses using these sentiment scores as outcomes, we tested multi-level models, with years nested in countries. For these analyses, we only included speeches from a party (i.e., no observer or non-party statements were included). First, we tested unconditional models to examine whether clustering was necessary (i.e., was there significant variability associated with country). These unconditional models found that there was significant variation by country, indicating the necessity of using a two-level model. We then tested a linear growth model, examining the role of time in predicting sentiment, where years were nested in country. The form of the equation was as follows:
Level 1 (within-country)
S e n t i m e n t i j = β 0 j + β 1 j Y e a r i j + r i j
Level 2 (between-country)
β 0 j = γ 00 + u 0 j β 1 j = γ 10 + u 1 j
Mixed equation:
S e n t i m e n t i j = γ 00 + γ 10 Y e a r i j + u 1 j Y e a r i j + u 0 j + r i j
where i represents each individual statement, and j represents each country. The results of these analyses are presented in Table 3. At level 1, we calculate the best regression line to fit each country (j). β0j represents the average sentiment score when year = 0 (1995). The slope parameter β1j indicates the yearly rate of change in sentiment for each country, and r i j represents residual error in the estimate. At Level 2, γ 00 represents the average variability in initial sentiment and γ 10 represents the average rate of change. Further details on the modeling approach are provided in the Supplementary Materials.
We observed that there was a significant increase in positive, anger, and fear sentiments over time, see Table 3. These models also revealed that much of the variance in the models could be attributed to random effects, i.e., variability between countries. However, there were few differences in variability between countries in the rate of change for any of these sentiments. One unexpected finding was the high level of positive sentiment in comparison to other sentiments. Initial sentiment (i.e., in 1995) was 13.50, and this increased over time. We did not observe the expected increases in negative or sad sentiment over time. The increases we did observe, in positive, anger, and fear sentiment were small, yet significant. While these increased over time, they did so slowly over the 26-year period. The models only account for a small amount of variance in these sentiments, so our next step was to see whether we could better explain variation in sentiment by accounting for other features besides the time the speech was delivered.

3.1.1. Annex, Income, and Climate Vulnerability

Our next set of analyses examined whether country Annex, climate risk, and GDP interacted with year to predict sentiment. Here, the general form of the equation was:
S e n t i m e n t i j = γ 00 + γ 01 × A n n e x + γ 10 × Y e a r i j + γ 11 × Y e a r i j × A n n e x + u 1 j + u 0 j + r i j
where Annex would be replaced with the relevant predictor. Due to space constraints, full results for these models are presented in the Supplementary Materials, and the main findings are discussed here.
When the interaction between Year and Annex (or GDP, CRI) was not significant, we re-ran the model without the interaction to be able to describe the unconditional effects of each predictor on the sentiment.
For the relationships between Annex, Year, and sentiment, we found that there was no significant moderation of the effect of time by Annex status for negative, positive, anger, or fear sentiment. Year was significantly associated with increased positive, angry, and fearful sentiment, controlling for Annex status. Annex I status was associated with less negative, fearful, and angry sentiment, controlling for year. For sadness, there was a significant interaction, such that over time, the negative relationship between Annex status and sad sentiment became stronger (i.e., the difference in how much sadness each Annex was expressing increased over time), see Table S3. While sentiment changed over time, as compared with Annex I representatives, Non-Annex I representatives expressed more negative sentiment, anger, fear, and sadness.
Country wealth did not moderate the relationship between year and any sentiment. Year was associated with positive, anger, fear, and sad sentiment, controlling for GDP. Higher GDP was associated with less expression of negative sentiment, anger, and fear. This is not surprising, considering that we found a similar relationship between Annex I status and these negative sentiments.
Climate risk and year did not interact to predict sentiment. When controlling for year, climate risk was not associated with any sentiment, see Table S5.

3.1.2. Summarizing Findings from Sentiment Analysis with Multi-Level Models

Our analyses revealed that politicians were expressing sentiment in these diplomatic speeches, even if it was limited. Sentiment did change over time, and some of our predictions were supported. Anger and fear increased over time, but there was no relationship between year and polarity, sadness, or negative sentiments. Contrary to our expectation, positive sentiment, the most prevalent sentiment, increased over time. We believe that this may reflect an overarching motivation across groups to be diplomatic, and to avoid offending or alienating other leaders. Mixed emotions in these speeches could reflect that while fearful and angry sentiments are increasing over time, the representatives still recognize the need to maintain diplomacy and want to balance increasing negativity with the amount of positivity expressed. Non-Annex I party statements contained significantly more sentiment which was sad, fearful, and angry. While higher GDP predicted less sad sentiment, it was otherwise not related to sentiment when accounting for time. Surprisingly, there were no relationships between climate risk of a country and the sentiment expressed in their statement, although this might be explained by our measure of climate risk. The CRI is based on 20 years-worth of data but provides a single score per country across that time period, and was thus time invariant. This limits our ability to understand changes in climate risk over time with this measure, and changes from year to year are not accounted for, which might explain the lack of significant relationships. Comprehensive data on climate vulnerability over time for all countries would be needed to better analyze questions about climate risk. While we considered other sources of disaster data, we did not find a suitable data source which had a focus on climate change-related disaster frequency, severity, and likelihood which had data for all countries in our dataset for the period of study.
While these analyses allowed us to observe the broad trends in sentiment, and revealed changes in some sentiment over time, they did not allow us to understand how representatives were using these sentiments–what they were talking about, and what their attitudes were towards different topics. To address this drawback, we carried out embedding regression.

3.2. Embedding Regression

Descriptive information, including the range of sentiment values for each seed word, is provided in the Supplementary Materials Table S6. When interpreting raw scores from these analyses, it should be noted that a positive score (inner product) represents greater similarity of contexts between the seed word and sentiment, and negative scores indicate dissimilarity in the contexts in which the seed word and sentiment terms are used.
First, we looked at the correlations for each seed word between sentiment and income, Annex, and year, see Table 4. These correlations can help us to understand how sentiment of the seed words differed between, for example, Non-Annex I and Annex I statements, where a positive correlation would indicate that Annex I, as compared with Non-Annex I, statements used the seed word in contexts which were more similar to the sentiment. Negative sentiment, fear, anger, and sadness for adaptation were negatively associated with Annex (see Table 4), such that Annex I statement tended to use the term adaptation in contexts dissimilar to these negative sentiments. Income was negatively correlated with negative, angry, fearful, and sad attitudes towards adaptation. As compared with Non-Annex I, Annex I statements also tended to express greater positivity about mitigation. Year was negatively correlated with positive, negative, fear, and sad sentiments expressed about financing. Annex I status was correlated with greater sentiment of all types for development. Although some correlations were marginally significant there was a trend where Annex I status was associated with less negative, fear, anger, and sad sentiments. Higher income was correlated with less negative, anger, fear, and sad sentiments about disasters.
These correlations indicate that sentiment about these different policy issues does vary between groups, however, we found no simple linear relationship between time and sentiment about most of these topics. The negative bivariate relationships between year and financing sentiment might suggest that this topic was discussed less emotionally over time. Our next step was to conduct exploratory analyses. We ran regressions, using the outcomes of the embedding regressions as dependent variables, to see whether there were unique effects of Annex, income, and year on sentiment for each of these terms. These models involved regressing each sentiment for each seed word on Annex I status, income, and year. The full results of these analyses are presented in the Supplementary Materials, but we described them briefly, focusing on the direction of effects.

3.2.1. Adaptation and Mitigation

Annex membership status was uniquely predictive of negative, anger, fear, and sad sentiments for adaptation, see Figure 3. Non-Annex I use of the term adaptation was significantly associated with more negative contexts as compared with Annex I statements, see Supplementary Table S7, although the variance explained by these models was small (6–13%).
Positive sentiment toward mitigation was predicted by Annex I status, controlling for year and income, see Table S8. Annex I countries were more likely to use mitigation with positive sentiment than non-Annex I countries, and this model explained 8% of the variance in positive sentiment. One possible explanation is that when Annex I countries are talking about mitigation, they are likely discussing their achievements in meeting mitigation targets, rather than drawing attention to deficits. There were no other significant associations for adaptation and mitigation between year, income, or Annex and sentiment.
We examined whether there were significant differences in positive and negative sentiments toward adaptation as compared with mitigation, since we were interested in whether mitigation (the initial goal of the UNFCCC) was viewed more positively than adaptation. When we tested whether these differences were significant when accounting for Annex, year, and income; we did not observe any significant difference in the sentiments used regarding adaptation and mitigation, see Supplementary Table S9.
Another approach to this data was to examine the plots of sentiment (Figure 3) for each word to identify fluctuations, and high and low points in sentiment scores which may be interesting to examine in the context of key events at COP. For instance, there are a number of agreements made at COP relevant to mitigation. In 1997 (COP3) the Kyoto Protocol was formally adopted, and in 2005 it entered into force [65]. If we examine the plot for mitigation (Figure 3), which was the primary goal of the Kyoto Protocol, we can see that there was initially high positive mitigation sentiment from the inception of the COP from Annex I countries which decreased until the early 2000s. At COP7 in 2001, the goal was to finalize preparations for the Kyoto Protocol, rules and procedures which were codified in the Marrakech Accords which were highly similar to the previous year’s Bonn Agreement. At this point, it was agreed upon that mitigation targets should be binding, and that parties which failed to keep their commitments should be penalized [55]. Our sentiment analyses suggest that for Annex I countries this may have been a point at which they were less willing to speak positively when discussing mitigation as compared with previously when they were idealizing the climate goals. At COP15, in 2009, there was some controversy over a failure to adopt a post-Kyoto agreement. At this conference, a document which was drafted by only a few parties before the conference as a proposed replacement for the Kyoto Protocol was leaked [55]. This draft did not make agreements legally binding, called on developing countries to implement mitigation, and made provision of funding to developing countries dependent on them implementing mitigation. Developing countries reportedly expressed anger about the agreement being created without their participation and negotiation, and ultimately no new climate agreement was adopted [55].
Negative and positive sentiment for adaptation appears to peak for Annex I statements around 2008–2010, see Figure 3, whereas negative sentiment for adaptation was highest for Non-Annex I in 1995. If we examine the events during those periods, we know that the Cancun Adaptation Framework was drafted in 2010–11, and the Adaptation Committee was established. Perhaps the fact that the Kyoto Protocol was entering into force, with final commitments being made around mitigation lead to less focus on, less desire to support, and less urgency for adaptation. For Non-Annex I statements, there was an increase in positive sentiment towards adaptation over time, in this case we might expect that speakers from these countries asking for support for or describing progress in adaptation would be framed positively, perhaps to encourage continued financing and support. Although we might have expected more negative sentiment in general surrounding adaptation in earlier years (particularly as compared with mitigation, Pielke, 2007), that was not observed.
These interpretations are purely speculative, as a full accounting of the specific agreements and important events at the COP is beyond the scope of the paper, but we believe that other researchers might make use of this method of probing different terms as a means of studying the course of specific events during COP. Alternate explanations for these trends are also plausible. For example, the Global Financial Crisis in 2008 may have had an impact on sentiment of these leaders. Researchers have found through discourse analysis that following the GFC, some key economic organizations increasingly made policy recommendations for ‘green’ growth, pairing climate mitigation with opportunities for continued economic growth, yet it seemed that the GFC led to less willingness to pursue mitigation at the expense of growth [66]. Following the GFC in 2009 and 2010, carbon emissions increased to a greater extent than previous years [67]. Leaders during this period may have been more wary of making ambitious climate mitigation commitments at this time due to a desire to prioritize their economic growth.

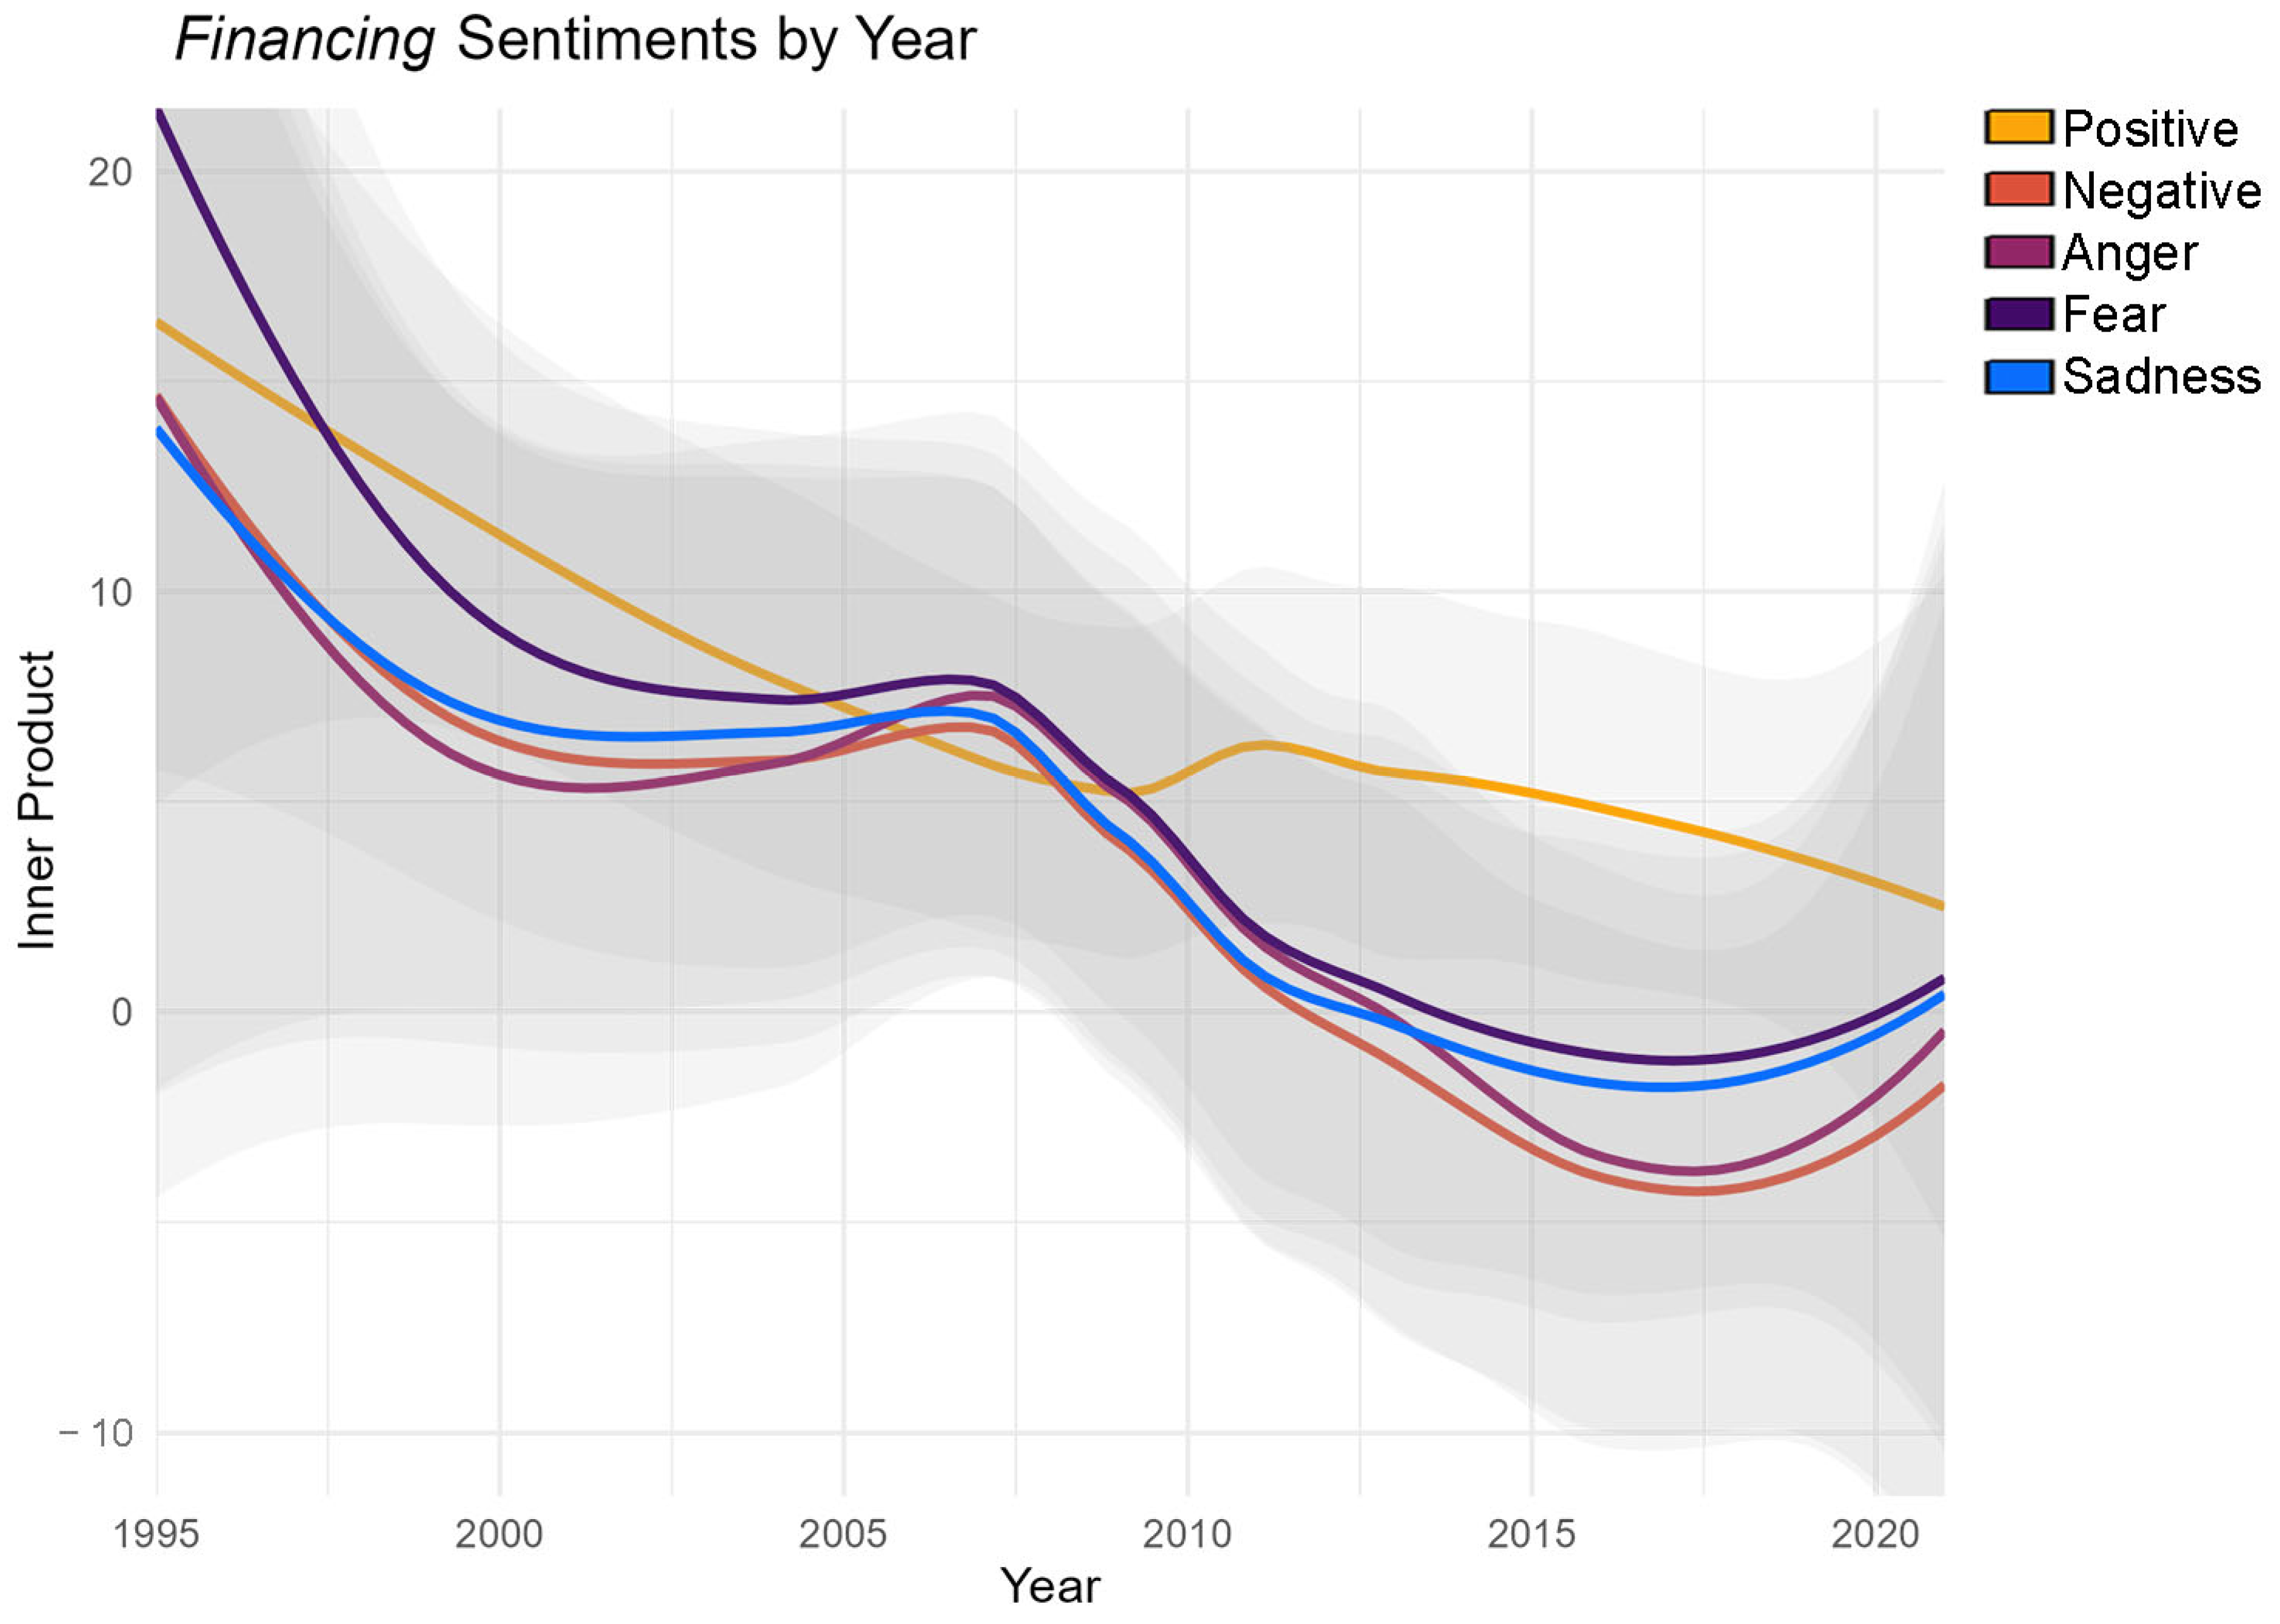
3.2.2. Financing and Development

Sentiment towards financing changed over time. Controlling for Annex I status and income, year was predictive of less positive, negative, anger, fear, and sadness, see Supplemental Materials Table S10. Over time, it seems that discussion around financing was becoming less emotionally charged, across Annex and income groups, see Figure 4. Although the differences were not significant, controlling for year, observing the plot of positive and negative sentiments, we observe slightly different patterns by Annex. For Annex I statements, positive attitudes towards financing were high initially, then decreased until around 2008, at which point they increased until peaking around 2013.
Sentiments around development were uniquely associated with Annex, such that Annex I status was associated with more positive, negative, angry, fearful, and sad sentiments, see Figure 5. Statements from developing countries used less sentiment when discussing development as compared with developed countries, and we believe there may be a tendency for the developing countries to discuss development in more neutral and less emotive contexts. There was a significant association between income and less negative and sad sentiment, controlling for Annex and year. Statements from lower income nations tended to discuss development more negatively and with greater sadness.

3.2.3. Disaster

Although there were significant correlations between income and disaster sentiment and between Annex and disaster sentiment, when controlling for each other and year, neither was predictive of any sentiment, see Table S12. Nonetheless, the bivariate relationships between Annex status and these sentiments remained apparent when examining the plots, see Figure 6. Non-Annex I statements showed a general decline in these sentiments about disaster from 1995 until 2014, then they increased. Annex I statements were not discussing disasters in these negative contexts prior to 2000, and throughout the time we analyzed, even the highest inner products for negative disaster sentiments for Annex I were in the same range as the minimum values observed for Non-Annex I negative disaster sentiment. If comprehensive climate risk or disaster data were available across years, future researchers might try to see whether these trends line up with cases of disaster experience. The divergence between sentiment from these developed and developing countries is stark around 2015, which was the year that the Paris Agreement was signed. One possible explanation for these differences in sentiment after this point could be that this agreement downplayed the ‘differentiated’ part of the principle of ‘common but differentiated responsibilities’, in spite of the continued inequities in who experiences climate harms. Developed and developing countries were all called on to mitigate their emissions, yet the impacts of climate change in those developing countries continued to be much worse than in developed countries. These countries may be bringing up disasters in a negative light to draw attention to the fact that although they are now also considered responsible for mitigation and adaptation, that they are unequally and unfairly impacted by climate change. However, there are other possible explanations for this divergence, and further qualitative work is needed to understand these differences.

4. Discussion

Previous work has used computational methods to analyze the statements from COP [45,46], and our work adds to this literature by analyzing sentiment across a longer time period, from the first Conference of Parties until the twenty-sixth. Our findings suggest that while sentiment is used in these statements, the degree of language which is emotive is generally somewhat limited. Sentiment expressed tended to be more positive than negative, however, we do detect the use of negative sentiment, anger, sadness, and fear. We also found that a speaker’s country’s GDP, Annex, and the year that a speech was delivered were associated at a bivariate with the overall sentiment expressed in statements. Countries with more wealth tended to use less negative sentiment, as did countries in Annex I. Year was correlated with increased negative sentiment. Using a multi-level model, we found support for the idea that fear and anger have increased over time. However, contrary to our predictions, positive sentiment also increased. Further qualitative analysis of these statements might help us to better understand why these changes were occurring. For instance, towards whom is the anger directed, and which subjects are people expressing fear about?
This study also allowed us to examine how particular climate change issues are discussed. Sentiment about climate policy issues such as mitigation and adaptation do fluctuate over time—but relationships are complex and should be examined in the context of events relevant to the issues, such as the drafting of international climate agreements. While these findings allow us to get a snapshot of what the sentiment was like at a given COP, further study might incorporate more information on the COP processes—such as which agreements were being made, which committees were especially active, which coalitions were formed, and so on [55]. The archived documents from these conferences provide a rich history of progress on international climate action, and using information on sentiment allows us to identify trends in how that action was discussed. For example, over time, discussions of financing seemed to be less sentimental. Further study might examine whether there were shifts from using emotional appeals in general to elicit financing or to discuss financing commitments as compared with other reasoning approaches (e.g., highlighting efficacy and other concrete arguments). To understand these and other shifts over time, researchers might use other computational approaches like structural topic modeling, and use covariates of specific events (e.g., pre- vs. post-first commitment period for Kyoto protocol; pre- vs. post- global financial crisis) to see whether any specific historical events might help explain these shifts.
Our finding that communication differs by Annex, particularly when looking at negative sentiments, is in line with previous work finding that speeches differ by Annex in terms of content [43,45]. Non-Annex I party statements about adaptation and disasters were more negative, fearful, sad, and angry than Annex I statements. We believe that the patterns for these two terms might highlight how the needs of the Annex I and Non-Annex I parties differ. Non-Annex I parties might be employing these sentiments around these topics both as a reflection of greater experience of climate impacts and a call to action to address those impacts to avoid further negative consequences. While our work helps to highlight these differences by Annex in the meaning of the terms ‘disaster’ and ‘adaptation’, further qualitative work is needed to understand those differences.
Finally, while we focused on how country features and time predicted sentiment, another approach would be to see how sentiment in one year influenced the country’s subsequent behavior, for example implementation of climate policy, instances of meeting or failing to meet commitments, or amount of financing committed to UN funds. For instance, the Environmental Performance Index [68] ranks countries using 40 indicators of their performance on climate change, ecosystem vitality, and environmental health. However, this index uses different metrics over time, meaning that comparing these scores over time is not appropriate. Data which cover the entire span of the COP (1995–2021), with complete information on the environmental performance for the majority of parties, are lacking or exist in forms which are not easily compared for use in this kind of analysis. For example, while parties must report to the COP on their Nationally Determined Contributions, the form of these reports is not uniform, and extracting data that could be compared across parties over the length of the conferences would require considerable effort. Future work might focus on a subset of parties where such information is available, to be able to examine, in depth, how statements reflect elite behavior, or how behavior is reflected in the statements.
There are some limitations of the work that should be noted. First, we focused only on English-language statements, which resulted in the exclusion of more than 1000 statements. A valid criticism of much historical text analysis is that it focus on English-centric text [69]. While automatic translations of English sentiment dictionaries are available, because they rely on coding conducted by English-speakers, they do not account for cultural differences across languages in the sentiment associations for words [70], making it difficult to compare across corpuses. Similarly, automated translations of statements could unintentionally alter the intent of the speaker and fail to accurately translate cultural nuances in sentiment. The exclusion of non-English texts means that we cannot make broad claims about how leaders express themselves outside of English-speaking contexts. Second, the records available of statements were incomplete at the time we conducted the study—archiving these conferences digitally is an ongoing process. We do not know exactly how many records might not be included, but we do know, for example, that we were only able to collect mainly observer statements from COP8 (2002) because most party statements are not yet publicly archived. In addition to this, our research neglects to fully make use of the 2493 statements we collected; observer statements are not included in our more advanced models going beyond simply describing overall sentiment. The speakers represent organizations that vary greatly in terms of size, goals, power, and so on, so treating them as a single group is inappropriate. Finding a way to code or categorize these statements could open a new line of questions regarding the differences in speech from, say, industry-oriented speakers and NGOs focused on human rights. When we make use of these approaches to understand sentiment, we are accepting the distribution hypothesis, which assumes that meaning can be derived from context [52]. While our approach allowed us to look at sentiment for issues across a large body of text, further human-coding of the texts to better understand whether the analyses accurately reflect the nuances of sentiment that deeper analysis reveals would help to support these findings. There are other ways to measure sentiment, for example, we might study video recordings of the proceedings to consider the body language and intonation in speeches to capture emotional arousal [5].
Besides addressing these limitations, future research might also incorporate text from other relevant forums, for example to see whether the ways that a country’s representative expresses themselves relates to the ways that politicians discuss climate change within their country (e.g., in parliamentary debates). Other researchers have studied the ways that politicians have discussed climate change in their own country (e.g., frequency of climate change speeches by German members of parliament [71]) or continent (e.g., arguments for and against climate change action in the European Parliament [72]). Because the COP statements identify the specific speaker, it would be interesting to see whether we could create a corpus of parallel statements about climate change by the same speakers in the same timeframes, to compare how they express themselves when communicating about it within their own nation, both to other politicians and to the public, rather than on a world stage. This might allow us to better understand elite international climate change speech in comparison with national elite communication on climate change.

5. Conclusions

The Conference of Parties serves as a container in which elites who have the power to enact systematic change discuss climate change. Managing climate change through mitigation and adapting to its impacts requires large-scale collective action and cooperation, both of which are planned at these conferences. Our work contributes to the understanding of how climate change has been addressed, particularly in terms of emotion on the international diplomatic stage, by analyzing the ways that representatives of parties to the convention have discussed these issues across a 26-year period. Annex membership emerged as an important factor in understanding differences in sentiment in these statements. Parties who have historically held different responsibilities and obligations under UNFCCC do not express themselves in the same way—Non-Annex I parties tended to express greater negativity. While some changes in sentiment over time were observed, they were not explained in a simple linear way, granular sentiment analysis focusing on specific seed words shows ups and downs in all sentiment across the years which suggests the need for future work. The aim of this article was to highlight which sentiment is used, and by whom, in the history of these climate negotiations. While this work revealed interesting trends and predictors of sentiment, future work is needed to better understand the content and consequences of the sentiment. While our methodology allowed us to examine the entire available archive of statements, qualitative approaches could build on this work, examining time periods which displayed shifts in emotive rhetoric. Ultimately, we need both bottom-up and top-down change to address climate change, and research to understand how elites discuss policy and climate impacts might help us gain insight into their attitudes.

Supplementary Materials

The following supporting information can be downloaded at: https://www.mdpi.com/article/10.3390/su16072779/s1, S1. Pre-processing of text. S2. Supplementary methods & results: sentiment analysis with multi-level modeling. S3. Embedding regression with sentiment.

Author Contributions

Conceptualization, A.M. and E.S.; methodology, A.M. and E.S.; formal analysis, A.M. and E.S.; data curation, A.M.; writing—original draft preparation, A.M.; writing—review and editing, E.S.; visualization, A.M. All authors have read and agreed to the published version of the manuscript.

Funding

This research received no external funding.

Institutional Review Board Statement

Not applicable.

Informed Consent Statement

Not applicable.

Data Availability Statement

These data were derived from the following resources available in the public domain. The COP statements analyzed in this work can be accessed from the United Nations digital archive: https://archive.unfccc.int/ (17 June 2023). The Climate Risk Index can be accessed from Germanwatch: https://www.germanwatch.org/en/cri (20 June 2023). Information on GDP was sourced from UNdata: https://data.un.org/Data.aspx?d=SNAAMA&f=grID%3a101%3bcurrID%3aUSD%3bpcFlag%3a1 (20 June 2023). Information on Annex status was accessed from the UNFCCC website: https://unfccc.int/process/parties-non-party-stakeholders/parties-convention-and-observer-states (20 June 2023). The NRC EmoLex is available here: https://saifmohammad.com/WebPages/NRC-Emotion-Lexicon.htm (1 July 2023).

Conflicts of Interest

The authors declare no conflicts of interest.

References

  1. IPCC. 2021: Summary for Policymakers. In Climate Change 2021: The Physical Science Basis. Contribution of Working Group I to the Sixth Assessment Report of the Intergovernmental Panel on Climate Change; Masson Delmotte, V., Zhai, P., Pirani, A., Connors, S.L., Péan, C., Berger, S., Caud, N., Chen, Y., Goldfarb, L., Gomis, M.I., Eds.; Cambridge University Press: Cambridge, UK, 2021. [Google Scholar]
  2. Held, D.; Roger, C. Three Models of Global Climate Governance: From Kyoto to Paris and Beyond. Glob. Policy 2018, 9, 527–537. [Google Scholar] [CrossRef]
  3. Mitchell, R.B.; Andonova, L.B.; Axelrod, M.; Balsiger, J.; Bernauer, T.; Green, J.F.; Hollway, J.; Kim, R.E.; Morin, J.-F. What We Know (and Could Know) About International Environmental Agreements. Glob. Environ. Politics 2020, 20, 103–121. [Google Scholar] [CrossRef]
  4. Abercrombie, G.; Batista-Navarro, R. ParlVote: A Corpus for Sentiment Analysis of Political Debates. In Proceedings of the Twelfth Language Resources and Evaluation Conference, Marseille, France, 11–16 May 2020; European Language Resources Association: Marseille, France, 2020; pp. 5073–5078. [Google Scholar]
  5. Cochrane, C.; Rheault, L.; Godbout, J.-F.; Whyte, T.; Wong, M.W.-C.; Borwein, S. The Automatic Analysis of Emotion in Political Speech Based on Transcripts. Political Commun. 2022, 39, 98–121. [Google Scholar] [CrossRef]
  6. Dumitrescu, D. Nonverbal Communication in Politics: A Review of Research Developments, 2005–2015. Am. Behav. Sci. 2016, 60, 1656–1675. [Google Scholar] [CrossRef]
  7. Matsumoto, D.; Frank, M.G.; Hwang, H.C. The Role of Intergroup Emotions in Political Violence. Curr. Dir. Psychol. Sci. 2015, 24, 369–373. [Google Scholar] [CrossRef]
  8. Windsor, L.; Dowell, N.; Windsor, A.; Kaltner, J. Leader Language and Political Survival Strategies. Int. Interact. 2018, 44, 321–336. [Google Scholar] [CrossRef]
  9. Blass, T. The Milgram Paradigm After 35 Years: Some Things We Now Know About Obedience to Authority. J. Appl. Soc. Psychol. 1999, 29, 955–978. [Google Scholar] [CrossRef]
  10. Milgram, S. Some Conditions of Obedience and Disobedience to Authority. Hum. Relat. 1965, 18, 57–76. [Google Scholar] [CrossRef]
  11. Gennaro, G.; Ash, E. Emotion and Reason in Political Language. Econ. J. 2022, 132, 1037–1059. [Google Scholar] [CrossRef]
  12. Chapman, D.A.; Lickel, B.; Markowitz, E.M. Reassessing Emotion in Climate Change Communication. Nat. Clim. Chang. 2017, 7, 850–852. [Google Scholar] [CrossRef]
  13. Bloodhart, B.; Swim, J.K.; Dicicco, E. “Be Worried, Be VERY Worried”: Preferences for and Impacts of Negative Emotional Climate Change Communication. Front. Commun. 2019, 3, 63. [Google Scholar] [CrossRef]
  14. Nabi, R.L.; Gustafson, A.; Jensen, R. Framing Climate Change: Exploring the Role of Emotion in Generating Advocacy Behavior. Sci. Commun. 2018, 40, 442–468. [Google Scholar] [CrossRef]
  15. Roeser, S. Risk Communication, Public Engagement, and Climate Change: A Role for Emotions. Risk Anal. 2012, 32, 1033–1040. [Google Scholar] [CrossRef] [PubMed]
  16. Salama, S.; Aboukoura, K. Role of Emotions in Climate Change Communication. In Handbook of Climate Change Communication: Vol. 1: Theory of Climate Change Communication; Leal Filho, W., Manolas, E., Azul, A.M., Azeiteiro, U.M., McGhie, H., Eds.; Climate Change Management; Springer International Publishing: Cham, Switzerland, 2018; pp. 137–150. ISBN 978-3-319-69838-0. [Google Scholar]
  17. Reser, J.P.; Bradley, G.L. Fear Appeals in Climate Change Communication. Available online: https://oxfordre.com/climatescience/display/10.1093/acrefore/9780190228620.001.0001/acrefore-9780190228620-e-386?__prclt=9mz3Yntu (accessed on 14 February 2023).
  18. Ruiter, R.A.C.; Kessels, L.T.E.; Peters, G.-J.Y.; Kok, G. Sixty Years of Fear Appeal Research: Current State of the Evidence. Int. J. Psychol. 2014, 49, 63–70. [Google Scholar] [CrossRef]
  19. Tannenbaum, M.B.; Hepler, J.; Zimmerman, R.S.; Saul, L.; Jacobs, S.; Wilson, K.; Albarracin, D. Appealing to Fear: A Meta-Analysis of Fear Appeal Effectiveness and Theories. Psychol. Bull. 2015, 141, 1178–1204. [Google Scholar] [CrossRef] [PubMed]
  20. Li, K.; Xu, Y.; Yang, S.; Guo, Y. Social Class, Group-Based Anger, and Collective Action Intentions in China. J. Pac. Rim Psychol. 2019, 13, e13. [Google Scholar] [CrossRef]
  21. van Zomeren, M.; Spears, R.; Fischer, A.H.; Leach, C.W. Put Your Money Where Your Mouth Is! Explaining Collective Action Tendencies Through Group-Based Anger and Group Efficacy. J. Personal. Soc. Psychol. 2004, 87, 649–664. [Google Scholar] [CrossRef] [PubMed]
  22. Sabherwal, A.; Pearson, A.R.; Sparkman, G. Anger Consensus Messaging Can Enhance Expectations for Collective Action and Support for Climate Mitigation. J. Environ. Psychol. 2021, 76, 101640. [Google Scholar] [CrossRef]
  23. Wong, S.S. Stoics and Hotheads: Leaders’ Temperament, Anger, and the Expression of Resolve in Face-to-Face Diplomacy. J. Glob. Secur. Stud. 2019, 4, 190–208. [Google Scholar] [CrossRef]
  24. Matsumoto, D.; Hwang, H.C.; Frank, M.G. Emotions Expressed in Speeches by Leaders of Ideologically Motivated Groups Predict Aggression. Behav. Sci. Terror. Political Aggress. 2014, 6, 1–18. [Google Scholar] [CrossRef]
  25. Moellendorf, D. Climate Change Justice. Philos. Compass 2015, 10, 173–186. [Google Scholar] [CrossRef]
  26. Bou-Habib, P. Climate Justice and Historical Responsibility. J. Politics 2019, 81, 1298–1310. [Google Scholar] [CrossRef]
  27. Bonanno, G.A.; Goorin, L.; Coifman, K.G. Sadness and Grief. In Handbook of Emotions, 3rd ed.; The Guilford Press: New York, NY, USA, 2008; pp. 797–810. ISBN 978-1-59385-650-2. [Google Scholar]
  28. Schwartz, D.; Loewenstein, G. The Chill of the Moment: Emotions and Proenvironmental Behavior. J. Public Policy Mark. 2017, 36, 255–268. [Google Scholar] [CrossRef]
  29. Ojala, M. Hope and Climate-Change Engagement from a Psychological Perspective. Curr. Opin. Psychol. 2023, 49, 101514. [Google Scholar] [CrossRef] [PubMed]
  30. Syropoulos, S.; Mah, A.; Markowitz, E. Personal Legacy Motivation as A Psychological Mechanism for Increasing Climate Action and Coping with Climate Change Stressors. J. Ment. Health Clim. Chang. 2023, 1, 16–29. [Google Scholar] [CrossRef]
  31. van Zomeren, M. Toward an Integrative Perspective on Distinct Positive Emotions for Political Action: Analyzing, Comparing, Evaluating, and Synthesizing Three Theoretical Perspectives. Political Psychol. 2021, 42, 173–194. [Google Scholar] [CrossRef]
  32. Schneider, C.R.; Zaval, L.; Markowitz, E.M. Positive Emotions and Climate Change. Curr. Opin. Behav. Sci. 2021, 42, 114–120. [Google Scholar] [CrossRef]
  33. Lewis, K.M. When Leaders Display Emotion: How Followers Respond to Negative Emotional Expression of Male and Female Leaders. J. Organ. Behav. 2000, 21, 221–234. [Google Scholar] [CrossRef]
  34. Osnabrügge, M.; Hobolt, S.B.; Rodon, T. Playing to the Gallery: Emotive Rhetoric in Parliaments. Am. Political Sci. Rev. 2021, 115, 885–899. [Google Scholar] [CrossRef]
  35. Calvo-Gonz’alez, O.; Eizmendi, A.; Reyes, G. The Shifting Attention of Political Leaders: Evidence from Two Centuries of Presidential Speeches. 1 September 2022. Available online: https://www.researchgate.net/publication/363208968_The_Shifting_Attention_of_Political_Leaders_Evidence_from_Two_Centuries_of_Presidential_Speeches (accessed on 10 August 2023).
  36. Timeline—UNFCCC—25 Years of Effort and Achievement. Available online: https://unfccc.int/timeline/ (accessed on 29 April 2023).
  37. Kuyper, J.; Schroeder, H.; Linnér, B.-O. The Evolution of the UNFCCC. Annu. Rev. Environ. Resour. 2018, 43, 343–368. [Google Scholar] [CrossRef]
  38. Agrawala, S. Structural and Process History of the Intergovernmental Panel on Climate Change. Clim. Chang. 1998, 39, 621–642. [Google Scholar] [CrossRef]
  39. Gupta, J. A History of International Climate Change Policy. WIREs Clim. Chang. 2010, 1, 636–653. [Google Scholar] [CrossRef]
  40. Nulman, E. Brief History of Climate Change Policy and Activism. In Climate Change and Social Movements: Civil Society and the Development of National Climate Change Policy; Nulman, E., Ed.; Palgrave Macmillan UK: London, UK, 2015; pp. 5–23. ISBN 978-1-137-46879-6. [Google Scholar]
  41. Randalls, S. History of the 2 °C Climate Target. WIREs Clim. Chang. 2010, 1, 598–605. [Google Scholar] [CrossRef]
  42. Lee, S.H.; Kang, Y.H.; Dai, R. Toward a More Expansive Discourse in a Changing World: An Analysis of Political Leaders’ Speeches on Biodiversity. Sustainability 2021, 13, 2899. [Google Scholar] [CrossRef]
  43. Castro, P.; Hörnlein, L.; Michaelowa, K. Constructed Peer Groups and Path Dependence in International Organizations: The Case of the International Climate Change Negotiations. Glob. Environ. Chang. 2014, 25, 109–120. [Google Scholar] [CrossRef]
  44. Wilkerson, J.; Casas, A. Large-Scale Computerized Text Analysis in Political Science: Opportunities and Challenges. Annu. Rev. Political Sci. 2017, 20, 529–544. [Google Scholar] [CrossRef]
  45. Genovese, F.; McAlexander, R.J.; Urpelainen, J. Institutional Roots of International Alliances: Party Groupings and Position Similarity at Global Climate Negotiations. Rev. Int. Organ. 2023, 18, 329–359. [Google Scholar] [CrossRef]
  46. Mehmood, Y.; Honkela, T. Comparing Talks, Realities and Concerns over the Climate Change: Comparing Texts with Numerical and Categorical Data. In Proceedings of the Conference on Language and Technology; 2012; pp. 21–27. Available online: http://www.cle.org.pk/clt12/pdf/4.pdf (accessed on 5 March 2024).
  47. Taboada, M.; Brooke, J.; Tofiloski, M.; Voll, K.; Stede, M. Lexicon-Based Methods for Sentiment Analysis. Comput. Linguist. 2011, 37, 267–307. [Google Scholar] [CrossRef]
  48. Reagan, A.J.; Danforth, C.M.; Tivnan, B.; Williams, J.R.; Dodds, P.S. Sentiment Analysis Methods for Understanding Large-Scale Texts: A Case for Using Continuum-Scored Words and Word Shift Graphs. EPJ Data Sci. 2017, 6, 28. [Google Scholar] [CrossRef]
  49. Jurafsky, D.; Martin, J.H. Speech and Language Processing: An Introduction to Natural Language Processing, Computational Linguistics, and Speech Recognition, 2nd ed.; Prentice Hall Series in Artificial Intelligence; Pearson Education: Upper Saddle River, NJ, USA, 2009; ISBN 978-0-13-504196-3. [Google Scholar]
  50. Asmi, A.; Ishaya, T. Negation Identification and Calculation in Sentiment Analysis. In Proceedings of the Second International Conference on Advances in Information Mining and Management; 2012; pp. 1–7. Available online: https://www.google.com.hk/url?sa=t&rct=j&q=&esrc=s&source=web&cd=&cad=rja&uact=8&ved=2ahUKEwikr8C7yYKFAxU61TQHHYdYDEcQFnoECBMQAQ&url=https%3A%2F%2Fwww.thinkmind.org%2Fdownload.php%3Farticleid%3Dimmm_2012_1_10_20033&usg=AOvVaw3sU48UIyHYDwt5RVyTlCUi&opi=89978449 (accessed on 5 March 2024).
  51. Loughran, T.; Mcdonald, B. When Is a Liability Not a Liability? Textual Analysis, Dictionaries, and 10-Ks. J. Financ. 2011, 66, 35–65. [Google Scholar] [CrossRef]
  52. Rodriguez, P.L.; Spirling, A.; Stewart, B.M. Embedding Regression: Models for Context-Specific Description and Inference. Am. Political Sci. Rev. 2023, 117, 1255–1274. [Google Scholar] [CrossRef]
  53. Gore, A.J. Earth in the Balance. Earth in the Balance: Ecology and the Human Spirit; Rodale: New York, NY, USA, 1992. [Google Scholar]
  54. Pielke, R.; Prins, G.; Rayner, S.; Sarewitz, D. Climate Change 2007: Lifting the Taboo on Adaptation. Nature 2007, 445, 597–598. [Google Scholar] [CrossRef] [PubMed]
  55. Skidmore, C.; Farrell, W. Lessons from the Past—towards a Better Future: A Brief History of the United Nations Climate Change Conferences: COPs 1-27. 2023. Available online: https://www.hks.harvard.edu/centers/mrcbg/publications/awp/awp219 (accessed on 10 December 2023).
  56. UNFCCC: Cancun Agreements: Cancun Agreements. Available online: https://unfccc.int/tools/cancun/index.html (accessed on 13 November 2023).
  57. Stott, P. How Climate Change Affects Extreme Weather Events. Science 2016, 352, 1517–1518. [Google Scholar] [CrossRef] [PubMed]
  58. Albright, E.A.; Crow, D. Beliefs about Climate Change in the Aftermath of Extreme Flooding. Clim. Chang. 2019, 155, 1–17. [Google Scholar] [CrossRef]
  59. Sloggy, M.R.; Suter, J.F.; Rad, M.R.; Manning, D.T.; Goemans, C. Changing Opinions on a Changing Climate: The Effects of Natural Disasters on Public Perceptions of Climate Change. Clim. Chang. 2021, 168, 25. [Google Scholar] [CrossRef]
  60. Climate and Weather Related Disasters Surge Five-Fold over 50 Years, but Early Warnings Save Lives—WMO Report|UN News. Available online: https://news.un.org/en/story/2021/09/1098662 (accessed on 14 November 2023).
  61. Ooms, J. Cld2: Google’s Compact Language Detector 2. 2023. Available online: https://github.com/CLD2Owners/cld2 (accessed on 1 July 2023).
  62. D’Andrea, A.; Ferri, F.; Grifoni, P.; Guzzo, T. Approaches, Tools and Applications for Sentiment Analysis Implementation. Int. J. Comput. Appl. 2015, 125, 26–33. [Google Scholar] [CrossRef]
  63. Mohammad, S.M.; Turney, P.D. Crowdsourcing a Word-Emotion Association Lexicon. Comput. Intell. 2013, 29, 436–465. [Google Scholar] [CrossRef]
  64. Khodak, M.; Saunshi, N.; Liang, Y.; Ma, T.; Stewart, B.; Arora, S. A La Carte Embedding: Cheap but Effective Induction of Semantic Feature Vectors. 2018. Available online: https://aclanthology.org/P18-1002/ (accessed on 1 July 2023).
  65. Leggett, J. The United Nations Framework Convention on Climate Change, the Kyoto Protocol, and the Paris Agreement: A Summary; Congressional Research Service Report. 2020. Available online: https://sgp.fas.org/crs/misc/R46204.pdf (accessed on 10 December 2023).
  66. Meckling, J.; Allan, B.B. The Evolution of Ideas in Global Climate Policy. Nat. Clim. Chang. 2020, 10, 434–438. [Google Scholar] [CrossRef]
  67. Peters, G.P.; Marland, G.; Le Quéré, C.; Boden, T.; Canadell, J.G.; Raupach, M.R. Rapid Growth in CO2 Emissions after the 2008–2009 Global Financial Crisis. Nat. Clim. Chang. 2012, 2, 2–4. [Google Scholar] [CrossRef]
  68. Wolf, M.J.; Emerson, J.W.; Esty, D.C.; de Sherbinin, A.; Wendling, Z.A. 2022 Environmental Performance Index (EPI) Results. 2022. Available online: https://epi.yale.edu/epi-results/2022/component/epi (accessed on 10 December 2023).
  69. Atari, M.; Henrich, J. Historical Psychology. Curr. Dir. Psychol. Sci. 2023, 32, 176–183. [Google Scholar] [CrossRef]
  70. Mohammad, S.M. Practical and Ethical Considerations in the Effective Use of Emotion and Sentiment Lexicons. arXiv 2011, arXiv:2011.03492. [Google Scholar]
  71. Debus, M.; Himmelrath, N. Advocates of Climate Action? The Age of Members of Parliament and Their Activity in Legislative Debates on Climate Change. Clim. Action 2022, 1, 16. [Google Scholar] [CrossRef]
  72. Forchtner, B.; Lubarda, B. Scepticisms and beyond? A Comprehensive Portrait of Climate Change Communication by the Far Right in the European Parliament. Environ. Politics 2023, 32, 43–68. [Google Scholar] [CrossRef]
Figure 1. Most frequent terms in the corpus. Note. The size of words in the word cloud reflects their frequency. The seed words used in the embedding regression, apart from ‘disaster(s)’ and ‘financing’ emerged in the top 150 terms.
Sustainability 16 02779 g001
Figure 2. Polarity and sentiment by year and Annex. Note. The plotted lines show the average sentiment by Annex and for the entire sample. The solid line shows average sentiment for Annex I, the dotted line represents Non-Annex I, and the dashed line represents sentiment for Observer/Non-Annex statements. The grey line shows the overall trend for the corpus for each sentiment generated using locally estimated scatterplot smoothing (LOESS). Each point in the background represents sentiment for a single statement.
Sustainability 16 02779 g002
Figure 3. Positive and negative sentiments: Adaptation, Mitigation, and Financing. Note. The panels on the left show positive sentiment scores (y-axis) for adaptation, mitigation, and financing over time (x-axis) by Annex, where Annex I is represented by the solid line, and Non-Annex I statements are represented by the dotted line. The panels on the right show negative sentiment (y-axis) over time by Annex.
Sustainability 16 02779 g003
Figure 4. Sentiment over time: Financing. Note. Lines depict the average yearly sentiment across all Annex and income groups.
Sustainability 16 02779 g004
Figure 5. Sentiment over time by Annex status: Development. Note. The y-axis represents the inner product for each sentiment (i.e., similarity score), and year is shown on the x-axis. Annex I statements are represented by a solid line, and Non-Annex I statements are represented by a dashed line.
Sustainability 16 02779 g005
Figure 6. Negative, anger, fear, and sad sentiments by Annex: Disaster. Note. The y-axis represents the inner product for each sentiment (i.e., similarity score), and year is shown on the x-axis. Annex I statements are represented by a solid line, and Non-Annex I statements are represented by a dashed line.
Sustainability 16 02779 g006
Table 1. Features of the statement classifications in the corpus.
FeatureCategoryNumber of Statements (%)
Annex representationAnnex I618 (24.8)
Non-Annex I1262 (50.6)
No Annex Classification 1:613 (24.6)
Year1995–1999444 (17.8)
2000–2004 2254 (10.2)
2005–2009510 (20.5)
2010–2014591 (23.7)
2015–2019567 (22.7)
2021127 (5.1)
1 Statements delivered by NGOs, UN leadership, industry groups, research groups, and other observers. 2 Because the majority of COP8 (2002) statements have not been archived, fewer statements than expected were available.
Table 2. Average sentiment and correlations with income, climate risk, Annex, and year.
SentimentM (SD) 1RangeCorrelations
GDP
(n = 1866)
Climate Risk
(n = 1734)
Annex I
(n = 1883)
Year
(n = 2493)
Positive13.96 (2.78)5.62–25.81−0.03<0.01−0.010.06 *
Negative4.25 (1.78)0.00–12.85−0.11 ***−0.02−0.15 ***0.05 **
Polarity9.71 (3.74)−4.03–27.960.030.010.06 ***0.02
Fear2.11 (1.21)0.00–8.84−0.18 ***0.07 ***−0.26 ***0.11 ***
Anger1.55 (1.02)0.00–8.33−0.13 ***0.03−0.23 ***0.20 ***
Sadness1.45 (1.04)0.00–10.63−0.28 ***0.08 ***−0.35 ***0.08 ***
1 Mean, standard deviation. The values reported for positive, negative, fear, anger, and sadness represent the average percentage of terms in the statements which are associated with each sentiment. For polarity, the score represents the % positive—% negative sentiment. n denotes the number of statements included in the analysis. * p < 0.05, ** p < 0.01, *** p < 0.001. n denotes the number of statements. For Annex I, we examined the correlations between Annex I vs. Non-Annex I statements, excluding observer statements.
Table 3. Two-level linear growth curve model, with year predicting sentiment.
PositiveNegativePolarityAngerFearSadness
PredictorsEstimatesCIpEstimatesCIpEstimatesCIpEstimatesCIpEstimatesCIpEstimatesCIp
(Intercept)13.5013.17–13.83<0.0014.324.12–4.52<0.0019.188.73–9.63<0.0011.971.83–2.11<0.0011.231.14–1.33<0.0011.521.42–1.62<0.001
Year0.030.01–0.040.0110.01−0.00–0.020.1000.01−0.01–0.040.2920.020.01–0.02<0.0010.030.02–0.03<0.0010.00−0.01–0.010.711
Random Effects 1
σ25.892.149.851.020.710.66
τ00 country1.51 0.51 3.09 0.28 0.06 0.13
τ11 country × year0.00 0.00 0.01 0.00 0.00 0.00
ρ01 country−0.66−0.44−0.60−0.210.090.44
ICC0.150.240.220.260.230.34
Marginal R2/Conditional R20.005/0.1550.002/0.2430.001/0.2190.009/0.2660.039/0.2570.000/0.338
Note. These models include 175 countries, and 1885 statements. 1 σ2 = avg. variability in sentiment scores within each year. τ00 = variability in baseline sentiment between countries. τ11 = random slope for the interaction of year and country, variability in the rate of change between countries. ρ01 = correlation between τ00 and τ11, relationship between initial sentiment and rate of change in sentiment. Marginal R2 represents the variance explained by fixed factors, conditional R2 includes variances explained by both fixed and random factors.
Table 4. Correlations between Annex, year, and income with sentiment for each seed word.
Seed WordVariablePositiveNegativeAngerFearSadness
Adaptation
(n = 138)
Annex I0.08−0.27 **−0.37 ***−0.29 ***−0.25 **
Year0.10−0.07−0.09−0.15−0.10
Income−0.02−0.20 *−0.20 *−0.19 *−0.20 *
Mitigation
(n = 127)
Annex I0.26 **−0.03−0.09−0.07−0.01
Year0.12−0.02<0.01−0.03−0.01
Income0.01−0.08−0.04−0.07−0.08
Financing
(n = 99)
Annex I0.12−0.07−0.10−0.06−0.08
Year−0.23 *−0.24 *−0.19 +−0.25 *−0.21 *
Income0.09−0.010.010.01−0.02
Development
(n = 157)
Annex I0.20 *0.26 **0.19 *0.20 *0.23 **
Year−0.07−0.09−0.14−0.16*−0.13
Income<0.01−0.09−0.10−0.08−0.11
Disaster
(n = 72)
Annex I0.15−0.25 *−0.23 +−0.23 +−0.28 *
Year−0.14−0.05−0.17−0.09−0.12
Income−0.09−0.27 *−0.26 *−0.25 *−0.23 *
* p < 0.05, ** p < 0.01. *** p < 0.001. + p = 0.06. n represents the number of year-annex-gdp triples which included the term of interest (i.e., one could represent the average sentiment of the term for all Annex I statements for 1996 which were high income). For Annex, 0 = Non-Annex I, 1 = Annex I. Income was scaled such that 1 = Low income and 4 = High income. Annex and income were significantly correlated, r = 0.52, p < 0.001.
Disclaimer/Publisher’s Note: The statements, opinions and data contained in all publications are solely those of the individual author(s) and contributor(s) and not of MDPI and/or the editor(s). MDPI and/or the editor(s) disclaim responsibility for any injury to people or property resulting from any ideas, methods, instructions or products referred to in the content.

