Multi-Attribute Decision-Making Method in Preventive Maintenance of Asphalt Pavement Based on Optimized Triangular Fuzzy Number

Abstract
:1. Introduction
2. Optimized TFN-MADA Method
2.1. Triangular Fuzzy Numbers
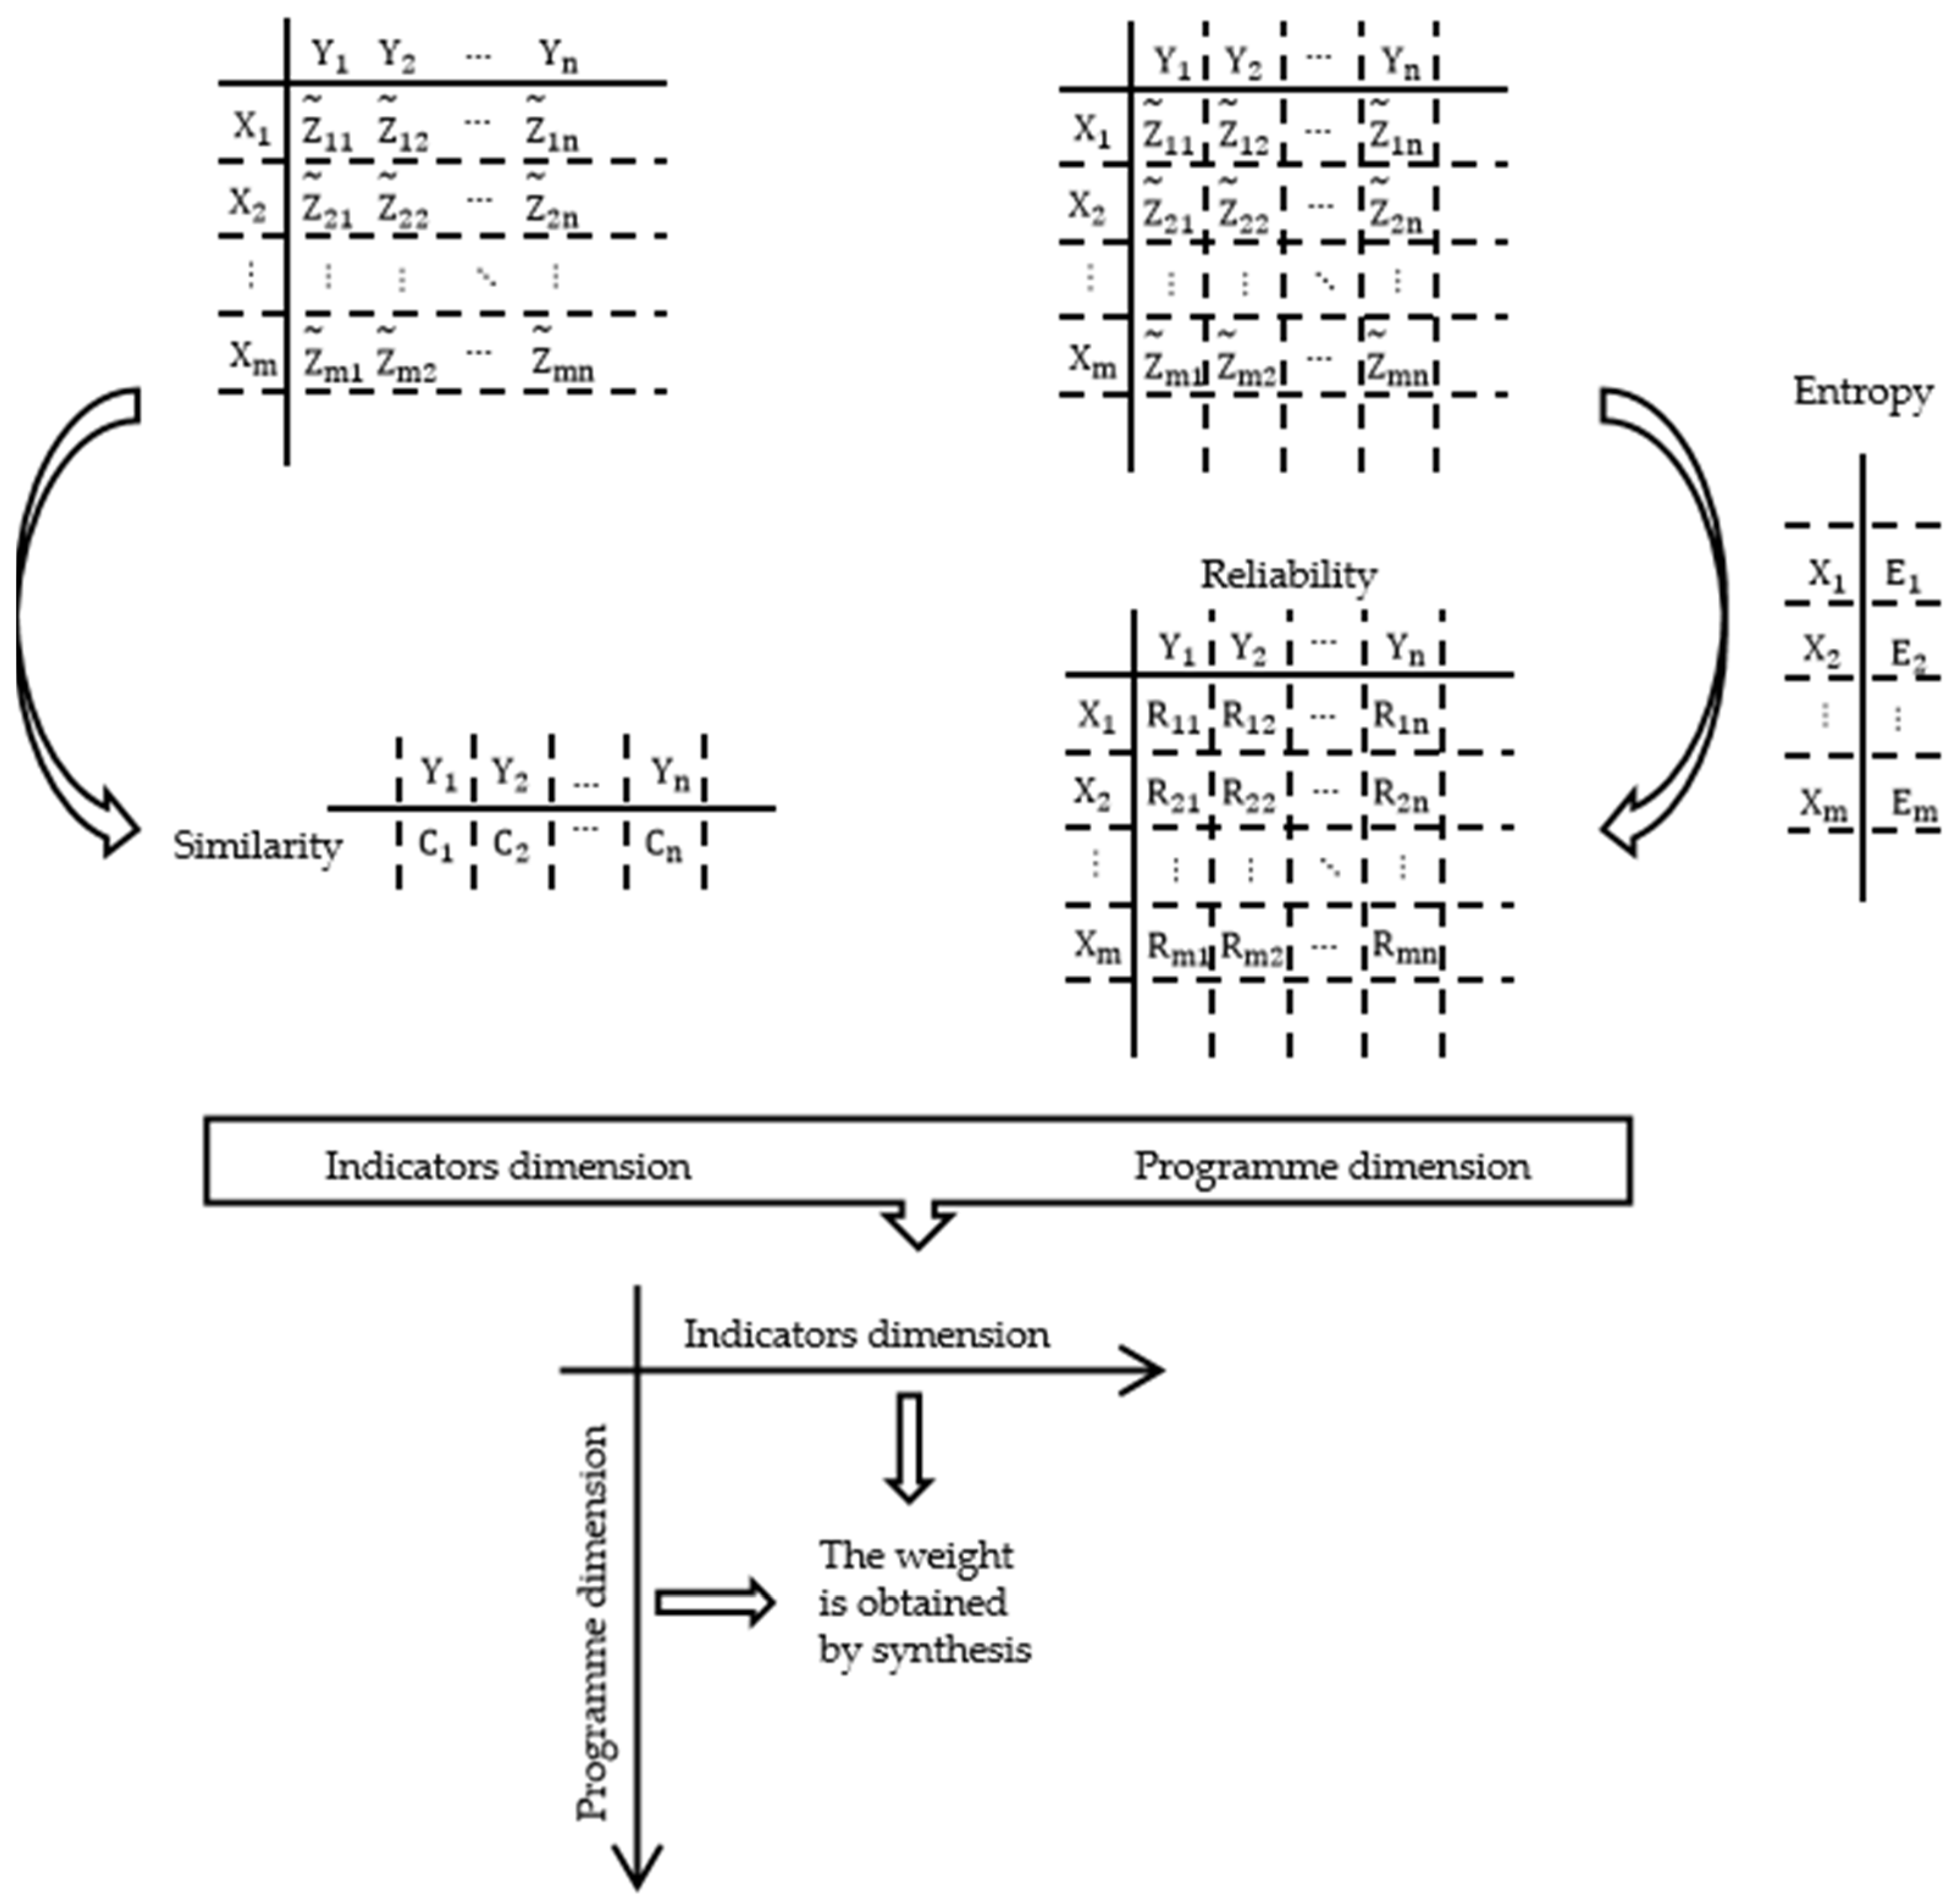
2.2. Basic Model
2.3. Similarity
2.4. Reliability
2.5. Decision Sequencing
3. Evaluation Indicators
3.1. Benefit-Based Indicators
3.1.1. Material Strength
3.1.2. Pavement Performance
3.1.3. Pavement Life
3.1.4. Comfort
3.1.5. Pavement Skid Resistance
3.1.6. Pavement Aesthetics
3.2. Cost-Based Indicators
3.2.1. Engineering Costs
3.2.2. Traffic Disruption
3.2.3. Carbon Emissions
3.2.4. Noise Pollution
4. Road Maintenance Case
4.1. Overview of the Project
4.2. Case Calculations
- Step 1: Initial data
- Step 2: Normalization Processing
- Step 3: Numerical calculation
- Step 4: Weighted post-processing
- Step 5: Relationship Matrix
- Step 6: Output of the optimal solution
4.3. Case Validation
5. Conclusions
- (1)
- This paper applies the optimization TFN-MADA method, based on expert scoring data, to analyze the indicators and maintenance programs affecting the preventive maintenance of pavements, applies the principles of deviation maximization and entropy weighting to consider and analyze the indicators and the program perspectives, respectively, and scientifically selects the preferred maintenance program.
- (2)
- The validity of the model was verified by the case study, and the preferred order of maintenance programs for the target road section was obtained: fog sealing technology > joint sealing technology > micro-surfacing technology > slurry sealing technology > crushed stone sealing technology > hot in-place recycling technology > thin layer covering technology > composite seal overlay techniques.
- (3)
- Because the fog sealing layer technology has convenient construction, fast traffic, good economic benefits [62], more friendly to the environment [63] etc., it is more reasonable to obtain a higher score in this case; because the composite sealing layer and sealing cover technology adopt two technologies, their economic cost is significantly higher than other preventive maintenance technologies [64], so their score is lower in this case.
- (4)
- The decision-making method of small data pavement maintenance applied in this paper can quickly and scientifically select the preliminary maintenance scheme at the decision-making site, and can also select the scheme without the influence of data loss.
- (5)
- The small-data pavement maintenance decision-making methodology applied in this research allows for rapid, scientific, and reliable selection of preliminary maintenance programs at the decision-making site.
- (6)
- Because the decision-making method in this study is to deal with the expert score, and then sort the scheme, the score of the expert score has a great influence on the decision-making result. However, the number of expert score samples in this case is limited. Therefore, in the future, a database of scores can be constructed, and algorithms such as deep learning can be used to further optimize the initial triangular fuzzy number decision matrix, making the selection of preventive maintenance schemes more accurate.
- (7)
- Due to the limited data in this case, which is a road in Jiangsu, China, the extreme weather, slope, natural disasters, and other indicators are not considered. In the future, when using this method, it is necessary to improve the index set according to the local situation. This paper mainly discusses the road maintenance schemes commonly used in Jiangsu and does not study maintenance schemes such as ultra-thin wear layers. In the future, more practical cases need to be accumulated, and more maintenance schemes need to be considered.
Author Contributions
Funding
Institutional Review Board Statement
Informed Consent Statement
Data Availability Statement
Conflicts of Interest
Correction Statement
Appendix A
References
- Yang, G.F.; Wang, H.Y.; Pan, Y.L. Asphalt pavement performance prediction based on mixed effect model. J. Highw. Transp. Res. Dev. 2018, 35, 19–27. [Google Scholar]
- Lanotte, M.; Kutay, M.E.; Haider, S.W.; Musunuru, G.K. New calibration approach to improve Pavement ME Design thermal cracking prediction: Mixture-specific coefficients–the Michigan case study. Road Mater. Pavement Des. 2020, 21, 1859–1871. [Google Scholar] [CrossRef]
- Yang, S.R. The current situation and problems of scientific decision-making in highway maintenance management. China J. Highw. Transp. 2023, 03, 20–25. [Google Scholar]
- Yañez, J.M.d.C.; Lee, M.M.J.; Swei, O. Sustainable Infrastructure Is a Two-Way Street: Balancing Environmental and Condition Performance Goals. J. Manag. Eng. 2023, 39, 05023004. [Google Scholar] [CrossRef]
- Fani, A.; Golroo, A.; Ali, M.; Gandomi, A. Pavement maintenance and rehabilitation planning optimisation under budget and pavement deterioration uncertainty. Int. J. Pavement Eng. 2022, 23, 414–424. [Google Scholar] [CrossRef]
- Correia, M.G.; Bonates, T.D.E.; Prata, B.D.; Nobre, E.F. An integer linear programming approach for pavement maintenance and rehabilitation optimization. Int. J. Pavement Eng. 2022, 23, 2710–2727. [Google Scholar] [CrossRef]
- Masoumi, S.; Molana, S.M.H.; Javadi, M.; Azizi, A. Designing integrated model of decision-making-robust optimisation to manage the maintenance of inter-urban routes under uncertainty. Int. J. Pavement Eng. 2022, 23, 3522–3535. [Google Scholar] [CrossRef]
- Altarabsheh, A.; Altarabsheh, I.; Ventresca, M. A hybrid genetic algorithm to maintain road networks using reliability theory. Struct. Infrastruct. Eng. 2023, 19, 810–823. [Google Scholar] [CrossRef]
- Jooste, F.J.; Costello, S.B.; Rainsford, S. Prediction of network level pavement treatment types using multi-classification machine learning algorithms. Road Mater. Pavement Des. 2023, 24, 410–426. [Google Scholar] [CrossRef]
- Shokoohi, M.; Golroo, A.; Ardeshir, A. Pavement maintenance planning using a risk-based approach and fault tree analysis. Int. J. Pavement Eng. 2023, 24, 2276160. [Google Scholar] [CrossRef]
- Fani, A.; Golroo, A.; Fahmani, M.; Naseri, H.; Nejad, F.M. Analysis of the pavement deterioration uncertainty scenarios on pavement maintenance and rehabilitation planning optimization. Struct. Infrastruct. Eng. 2023, 1–18. [Google Scholar] [CrossRef]
- Naseri, H.; Jahanbakhsh, H.; Foomajd, A.; Galustanian, N.; Karimi, M.M.; Waygood, E.O.D. A newly developed hybrid method on pavement maintenance and rehabilitation optimization applying Whale Optimization Algorithm and random forest regression. Int. J. Pavement Eng. 2023, 24, 2147672. [Google Scholar] [CrossRef]
- Eddula, S.V.; Peraka, N.S.P.; Biligiri, K.P. Stakeholder-Oriented Optimization of Pavement Maintenance Interventions Using Multi-Criteria Decision-Making Approach. Int. J. Pavement Res. Technol. 2023. [Google Scholar] [CrossRef]
- Amin, M.A. Pavement Maintenance Program at the Network Level: Mixed-Integer Programming with Multiple Objectives. Transp. Res. Rec. 2023, 2677, 490–502. [Google Scholar] [CrossRef]
- Santos, J.; Cristina, T.M.; Samuel, M.; Veronique, C. A fuzzy logic expert system for selecting optimal and sustainable life cycle maintenance and rehabilitation strategies for road pavements. Int. J. Pavement Eng. 2022, 23, 425–437. [Google Scholar] [CrossRef]
- Jahanshahloo, G.R.; Lotfi, F.H.; Shoja, N.; Tohidi, G. A method for generating all efficient solutions of 0–1 multi-objective linear programming problem. Appl. Math. Comput. 2005, 169, 874–886. [Google Scholar] [CrossRef]
- Rejani, V.U.; Sunitha, V.; Mathew, S.; Veeraragavan, A. A Network Level Pavement Maintenance Optimisation Approach Deploying GAMS. Int. J. Pavement Res. Technol. 2022, 15, 863–875. [Google Scholar] [CrossRef]
- Zhao, H.; Zhang, H.-Y. On hesitant neutrosophic rough set over two universes and its application. Artif. Intell. Rev. 2020, 53, 4387–4406. [Google Scholar] [CrossRef]
- Chen, R.-M. A rough-set and AI based approach for hierarchical cognitive processing of perceptions. Appl. Soft Comput. 2023, 136, 110143. [Google Scholar] [CrossRef]
- Rezaei, J. Best-worst multi-criteria decision-making method. Omega Int. J. Manag. Sci. 2015, 53, 49–57. [Google Scholar] [CrossRef]
- Haseli, G.; Sheikh, R. Base Criterion Method (BCM). Mult. Criteria Decis. Mak. 2022, 407, 17–38. [Google Scholar]
- Haseli, G.; Ranjbarzadeh, R.; Hajiaghaei-Keshteli, M.; Ghoushchi, S.J.; Hasani, A.; Deveci, M.; Ding, W. HECON: Weight assessment of the product loyalty criteria considering the customer decision’s halo effect using the convolutional neural networks. Inf. Sci. 2023, 623, 184–205. [Google Scholar] [CrossRef]
- Li, J.; Liao, C.X.; Xiong, C.L.; Chen, C.P.; Wang, Z.D.; Wu, C.H.; Li, S.Q.; Li, W.X.; Xu, X.Q. Research on distresses detection, evaluation and maintenance decision-making for highway pavement in reconstruction and expansion project. Waste Manag. 2023, 19, e02451. [Google Scholar] [CrossRef]
- Zhao, Q.M.; Liu, Z.H.; Yao, X.F.; Wu, L.; Lu, X.J.; Zhao, H.; Liu, Y.X. Preventive maintenance decision model of highway asphalt pavement based on analytic hierarchy process. Highway 2023, 68, 381–387. [Google Scholar]
- Andreou, A.; Mavromoustakis, C.X.; Markakis, E.K.; Song, H.B. On the Integration of User Preferences by Using a Hybrid Methodology for Multi-Criteria Decision Making. IEEE Access 2023, 11, 139157–139170. [Google Scholar] [CrossRef]
- Torres-Machi, C.; Nasir, F.; Achebe, J.; Saari, R.; Tighe, S.L. Sustainability Evaluation of Pavement Technologies through Multicriteria Decision Techniques. J. Infrastruct. Syst. 2019, 25, 04019023. [Google Scholar] [CrossRef]
- Kumar, R.; Suman, S.K. Prioritization of Flexible Pavement Sections for Maintenance Using Multi-criteria FAHP Integrated with Multi-attribute Utility Theory. Process Integr. Optim. Sustain. 2022, 6, 633–656. [Google Scholar] [CrossRef]
- Papageorgiou, G. Twofold Appraisal of Pavement Maintenance Technologies. J. Eng. Sci. Technol. Rev. 2022, 15, 208–214. [Google Scholar] [CrossRef]
- Sirin, O.; Gunduz, M.; Shamiyeh, M.E. Application of analytic hierarchy process (AHP) for sustainable pavement performance management in Qatar. Eng. Constr. Archit. Manag. 2021, 28, 3106–3122. [Google Scholar] [CrossRef]
- Mahmood, Y.A.; Ahmadi, A.; Verma, A.K.; Srividya, A.; Kumar, U. Fuzzy fault tree analysis: A review of concept and application. Int. J. Syst. Assur. Eng. Manag. 2013, 4, 19–32. [Google Scholar] [CrossRef]
- Romaniuk, M.; Hryniewicz, O. Estimation of maintenance costs of a pipeline for a U-shaped hazard rate function in the imprecise setting. Eksploat. I Niezawodn.–Maint. Reliab. 2020, 22, 352–362. [Google Scholar] [CrossRef]
- Xie, X.-P.; Lu, J.Q.; Yue, D.; Ding, D.-W. Enhanced Fuzzy Fault Estimation of Discrete-Time Nonlinear Systems via a New Real-Time Gain-Scheduling Mechanism. IEEE Trans. Cybern. 2023, 53, 1607–1617. [Google Scholar] [CrossRef] [PubMed]
- Bukowski, L.; Werbińska-Wojciechowska, S. Using fuzzy logic to support maintenance decisions according to Resilience-Based Maintenance concept. Eksploat. I Niezawodn.–Maint. Reliab. 2021, 23, 294–307. [Google Scholar] [CrossRef]
- Ali, D.; Yohanna, M.; Puwu, M.I.; Garkida, B.M. Long-term load forecast modelling using a fuzzy logic approach. Pac. Sci. Rev. A Nat. Sci. Eng. 2016, 18, 123–127. [Google Scholar] [CrossRef]
- Temelcan, G. A solution algorithm for finding the best and the worst fuzzy compromise solutions of fuzzy rough linear programming problem with triangular fuzzy rough number coefficients. Granul. Comput. 2023, 8, 479–489. [Google Scholar] [CrossRef]
- Ammar, E.-S.; Emsimir, A. A mathematical model for solving fuzzy integer linear programming problems with fully rough intervals. Granul. Comput. 2021, 6, 567–578. [Google Scholar] [CrossRef]
- Ghoushchi, S.J.; Osgooei, E.; Gholamreza, H.; Hana, T. A Novel Approach to Solve Fully Fuzzy Linear Programming Problems with Modified Triangular Fuzzy Numbers. Mathematics 2021, 9, 2937. [Google Scholar] [CrossRef]
- Oreto, C.; Biancardo, S.A.; Abbondati, F.; Veropalumbo, R. Leveraging Infrastructure BIM for Life-Cycle-Based Sustainable Road Pavement Management. Materials 2023, 16, 1047. [Google Scholar] [CrossRef] [PubMed]
- Zakeri, S.; Konstantas, D.; Bratvold, R.B.; Pamucar, D. A Supplier Selection Model Using the Triangular Fuzzy-Grey Numbers. IEEE Access 2023, 11, 107511–107532. [Google Scholar] [CrossRef]
- Jiang, B.; Liang, X.A.; Gao, Y.J.; Zhang, Y.M. Triangular fuzzy number multi-attribute decision making method based on reliability to determine attribute weights. Fuzzy Syst. Math. 2021, 35, 113–123. [Google Scholar]
- Laarhoven, P.J.M.v.; Pedrycz, W. A fuzzy extension of Saaty’s priority theory. Fuzzy Sets Syst. 1983, 11, 229–241. [Google Scholar] [CrossRef]
- Kaufmann, A.; Gupta, M.M. Introduction to Fuzzy Arithmetic: Theory and Applications, 3rd ed.; Van Nostrand Reinhold: New York, NY, USA, 1986. [Google Scholar]
- Kalashnikov, A.V.; Kostenko, V.A. A parallel algorithm of simulated annealing for multiprocessor scheduling. J. Comput. Syst. Sci. Int. 2008, 47, 455–463. [Google Scholar] [CrossRef]
- Huang, Z.L.; Luo, J. Possibility degree relation method for uncertain multi-criteria decision making with triangular fuzzy numbers. Control. Decis. 2015, 30, 1365–1371. [Google Scholar]
- Angelo, A.A.; Sasai, K.; Kaito, K. Assessing Critical Road Sections: A Decision Matrix Approach Considering Safety and Pavement Condition. Sustainability 2023, 15, 7244. [Google Scholar] [CrossRef]
- Dong, S.; Xu, Z.; Wang, J.W.; Lin, F.L.; Yang, D.T. Comparison and Docking Study on Evaluation Standards of Asphalt Pavement Technical Conditions in China, Japan, the United States and Canada. J. Chongqing Jiaotong Univ. (Nat. Sci.) 2023, 42, 44–51. [Google Scholar]
- David, D.; Ahmed, S.S.; Sarwar, T.M.; Fountas, G.; Anastasopoulos, P. An In-Depth Econometric Analysis of Pavement Performance and Service Life by Pavement Rehabilitation Treatment Type and Delivery Method. J. Infrastruct. Syst. 2023, 29, 04023024. [Google Scholar] [CrossRef]
- Strategic Highway Research Program. Pavement Distress Identification Manual, 3rd ed.; National Research Council: Washington, DC, USA, 1991. [Google Scholar]
- Zhan, Y.; Luo, Z.W.; Lin, X.Q.; Nie, Z.L.; Deng, Q.S.; Qiu, Y.; Wang, T.F. Pavement preventive maintenance decision-making for high antiwear and optimized skid resistance performance. Constr. Build. Mater. 2023, 400, 132757. [Google Scholar] [CrossRef]
- JTG 5142-2019; Technical Specifications for Maintenance of Highway Asphalt Pavement. Chinese Standard: Beijing, China, 2019.
- Garcia-Segura, T.; Montalbán-Domingo, L.; Llopis-Castelló, D.; Sanz-Benlloch, A.; Pellicer, E. Integration of deep learning techniques and sustainability-based concepts into an urban pavement management system. Expert Syst. Appl. 2023, 231, 120851. [Google Scholar] [CrossRef]
- Rejani, V.U.; Janani, L.; Venkateswaralu, K.; Sunitha, V.; Mathew, S. Strategic Pavement Maintenance and Rehabilitation Analysis of Urban Road Network Using HDM-4. Int. J. Pavement Res. Technol. 2023, 16, 927–942. [Google Scholar] [CrossRef]
- Renard, S.; Corbett, B.; Swei, O. Minimizing the global warming impact of pavement infrastructure through reinforcement learning. Resour. Conserv. Recycl. 2021, 167, 105240. [Google Scholar] [CrossRef]
- Liu, Q.; Cai, M.M.; Yu, B.; Qin, S.Y.; Qin, X.C.; Zhang, J.P. Life cycle assessment of greenhouse gas emissions with uncertainty analysis: A case study of asphaltic pavement in China. J. Clean. Prod. 2023, 411, 137263. [Google Scholar] [CrossRef]
- Fernandez, M.D.; Chava, N.; Quintana, S. Noise exposure of workers of the construction sector. Appl. Acoust. 2009, 70, 753–760. [Google Scholar] [CrossRef]
- Li, J. Research on Maintenance Management Decision Optimization of Expressway Asphalt Pavement. Transp. Technol. Manag. 2023, 4, 171–173. [Google Scholar]
- Kong, L.Y.; Wang, J.; Luo, Y.D. The influence of micro-surfacing gradation and admixture on road traffic noise. J. Chongqing Jiaotong Univ. (Nat. Sci.) 2022, 41, 87–91. [Google Scholar]
- Guo, Y.C. Study on Structural Behavior and Material Design of Fiber Asphalt Gravel Seal. Ph.D. Thesis, Chang’an University, Xi’an, China, 2012. [Google Scholar]
- Xiao, Q.Y.; Wu, K.W.; Cui, X.Y.; Gong, F.Y.; Li, Z.Y. Study on the bonding properties of anti-sliding surface of epoxy composites. Thermosetting Resin 2023, 38, 1–5+16. [Google Scholar]
- Pan, F.; Qiu, Z.X.; Wang, H. Application of Slurry Seal in Kaiyang Expressway. Highway 2003, 08, 80–83. [Google Scholar]
- Liu, L.; Shao, P.W. The experimental research and technical performance comparison of the lower seal material of asphalt pavement. J. China Foreign Highw. 2011, 31, 217–220. [Google Scholar]
- Zhang, X.; Wang, H.N.; Hasan, M.R.M.; Gao, J.F.; Irfan, M. Traffic open time prediction of fog seal with sand using image processing technology. Constr. Build. Mater. 2019, 209, 9–19. [Google Scholar] [CrossRef]
- Zhang, L.; Wang, P.; Yang, Y.Z.; Xing, C.; Tan, Y.Q. Analysis of energy consumption and emission of asphalt pavement with different design life based on LCA. Mater. Rep. 2023, 2023, 1–18. [Google Scholar]
- Hu, Y.Y. Research on Post-Evaluation of Preventive Maintenance Technology for Ordinary Highways in Mountainous Areas. Master’s Thesis, Chongqing Jiaotong University, Chongqing, China, 2023. [Google Scholar]


| Norm | Mileage/km | Score (of Student’s Work) | Make One’s Judgment | ||
|---|---|---|---|---|---|
| Excellent | Very Much | Total | |||
| Pavement Damage Condition Index PCI | 90 | 6 | 96 | 97.89 | first class |
| Road Travel Quality Index RQI | 96 | 0 | 96 | 94.34 | excellent |
| Rutting Depth Index RDI | 88 | 8 | 96 | 92.42 | excellent |
| Slip Resistance Index (SRI) | 32 | 64 | 96 | 89.19 | excellent |
| Indicator | |
|---|---|
| Benefit-based indicators | Material strength Y1 |
| Pavement Performance Y2 | |
| Pavement life Y3 | |
| Comfort Y4 | |
| Anti-skid road surface Y5 | |
| Pavement aesthetics Y6 | |
| Cost-based indicators | Project cost Y7 |
| Traffic Disruption Y8 | |
| Carbon emissions Y9 | |
| Noise pollution Y10 |
| D1 | Y1 | Y2 | Y3 | Y4 | Y5 | Y6 |
|---|---|---|---|---|---|---|
| X1 | [1.199, 1.276, 1.338] | [1.241, 1.330, 1.422] | [1.497, 1.567, 1.636] | [1.447, 1.548, 1.642] | [0.556, 0.529, 0.731] | [1.029, 1.109, 1.166] |
| X2 | [1.243, 1.306, 1.400] | [1.064, 1.131, 1.216] | [1.241, 1.338, 1.400] | [1.184, 1.339, 1.496] | [1.349, 1.454, 1.644] | [1.260, 1.347, 1.445] |
| X3 | [1.272, 1.350, 1.446] | [1.182, 1.269, 1.343] | [1.327, 1.426, 1.527] | [1.283, 1.409, 1.551] | [0.913, 1.101,1.324] | [1.214, 1.300, 1.379] |
| X4 | [1.228, 1.306, 1.385] | [1.108, 1.193, 1.295] | [1.344, 1.444, 1.564] | [1.316, 1.426, 1.551] | [0.913, 1.101, 1.233] | [1.244, 1.331, 1.445] |
| X5 | [1.127, 1.231, 1.308] | [1.167, 1.239, 1.311] | [0.629, 0.687, 0.782] | [0.625, 0.713, 0.858] | [1.230, 1.451, 1.644] | [1.275, 1.347, 1.429] |
| X6 | [1.199, 1.276, 1.338] | [1.226, 1.315, 1.406] | [1.548, 1.620, 1.691] | [1.431, 1.600, 1.770] | [0.397, 0.529, 0.685] | [0.814, 0.887, 0.969] |
| X7 | [1.040, 1.098, 1.185] | [1.152, 1.223, 1.311] | [0.578, 0.634, 0.709] | [0.543, 0.661, 0.785] | [2.421, 2.731, 2.922] | [1.321, 1.395, 1.494] |
| X8 | [1.084, 1.157, 1.246] | [1.211, 1.300, 1.390] | [1.190, 1.285, 1.382] | [1.184, 1.304, 1.442] | [0.913, 1.101, 1.324] | [1.198, 1.284, 1.363] |
| D2 | Y7 | Y8 | Y9 | Y10 |
|---|---|---|---|---|
| X1 | [1.575, 1.873, 2.269] | [1.285, 1.432, 1.585] | [1.027, 1.088, 1.180] | [1.675, 1.824, 1.994] |
| X2 | [1.002, 1.150, 1.378] | [1.304, 1.411, 1.500] | [1.228, 1.297, 1.414] | [1.100, 1.164, 1.241] |
| X3 | [1.002, 1.150, 1.285] | [1.087, 1.174, 1.255] | [1.135, 1.257, 1.372] | [1.129, 1.183, 1.241] |
| X4 | [0.973, 1.150, 1.285] | [1.126, 1.195, 1.277] | [1.089, 1.201, 1.331] | [1.072, 1.144, 1.200] |
| X5 | [0.705, 0.808, 0.919] | [1.126, 1.195, 1.309] | [1.290, 1.442, 1.548] | [1.139, 1.213, 1.292] |
| X6 | [1.575, 1.873, 2.269] | [1.186, 1.256, 1.351] | [1.174, 1.241, 1.305] | [1.139, 1.203, 1.272] |
| X7 | [0.516, 0.573, 0.652] | [1.067, 1.143, 1.213] | [1.228, 1.322, 1.439] | [1.053, 1.105, 1.180] |
| X8 | [1.224, 1.424, 1.609] | [1.107, 1.195, 1.277] | [1.058, 1.152, 1.247] | [1.100, 1.164, 1.211] |
| Rij | Y1 | Y2 | Y3 | Y4 | Y5 | Y6 | Y7 | Y8 | Y9 | Y10 |
|---|---|---|---|---|---|---|---|---|---|---|
| X1 | 0.573 | 0.746 | 0.573 | 0.801 | 0.721 | 0.561 | 2.853 | 1.232 | 0.628 | 1.312 |
| X2 | 0.729 | 0.701 | 0.736 | 1.444 | 1.368 | 0.854 | 1.743 | 0.910 | 0.861 | 0.653 |
| X3 | 0.798 | 0.736 | 0.915 | 1.232 | 1.886 | 0.757 | 1.301 | 0.771 | 1.087 | 0.516 |
| X4 | 0.731 | 0.870 | 1.024 | 1.093 | 1.483 | 0.933 | 1.448 | 0.703 | 1.121 | 0.592 |
| X5 | 0.869 | 0.690 | 0.733 | 1.114 | 1.983 | 0.740 | 1.027 | 0.876 | 1.236 | 0.733 |
| X6 | 0.589 | 0.760 | 0.602 | 1.432 | 1.217 | 0.653 | 2.934 | 0.697 | 0.551 | 0.564 |
| X7 | 0.738 | 0.807 | 0.662 | 1.225 | 2.542 | 0.875 | 0.693 | 0.738 | 1.073 | 0.647 |
| X8 | 0.729 | 0.804 | 0.864 | 1.161 | 1.850 | 0.743 | 1.735 | 0.763 | 0.851 | 0.500 |
| Xi | X1 | X2 | X3 | X4 | X5 | X6 | X7 | X8 |
|---|---|---|---|---|---|---|---|---|
| Unit cost (yuan) | 10 | 21.5 | 17.5 | 16.5 | 55 | 7.5 | 57.5 | 24 |
| Service life (year) | 1.5 | 2.5 | 2.5 | 2 | 3.5 | 1.5 | 5 | 2 |
| Xi | X1 | X2 | X3 | X4 | X5 | X6 | X7 | X8 |
|---|---|---|---|---|---|---|---|---|
| Equivalent annual cost method | 7.3366 | 9.8280 | 7.9995 | 9.2515 | 18.6299 | 5.5025 | 14.3964 | 13.4567 |
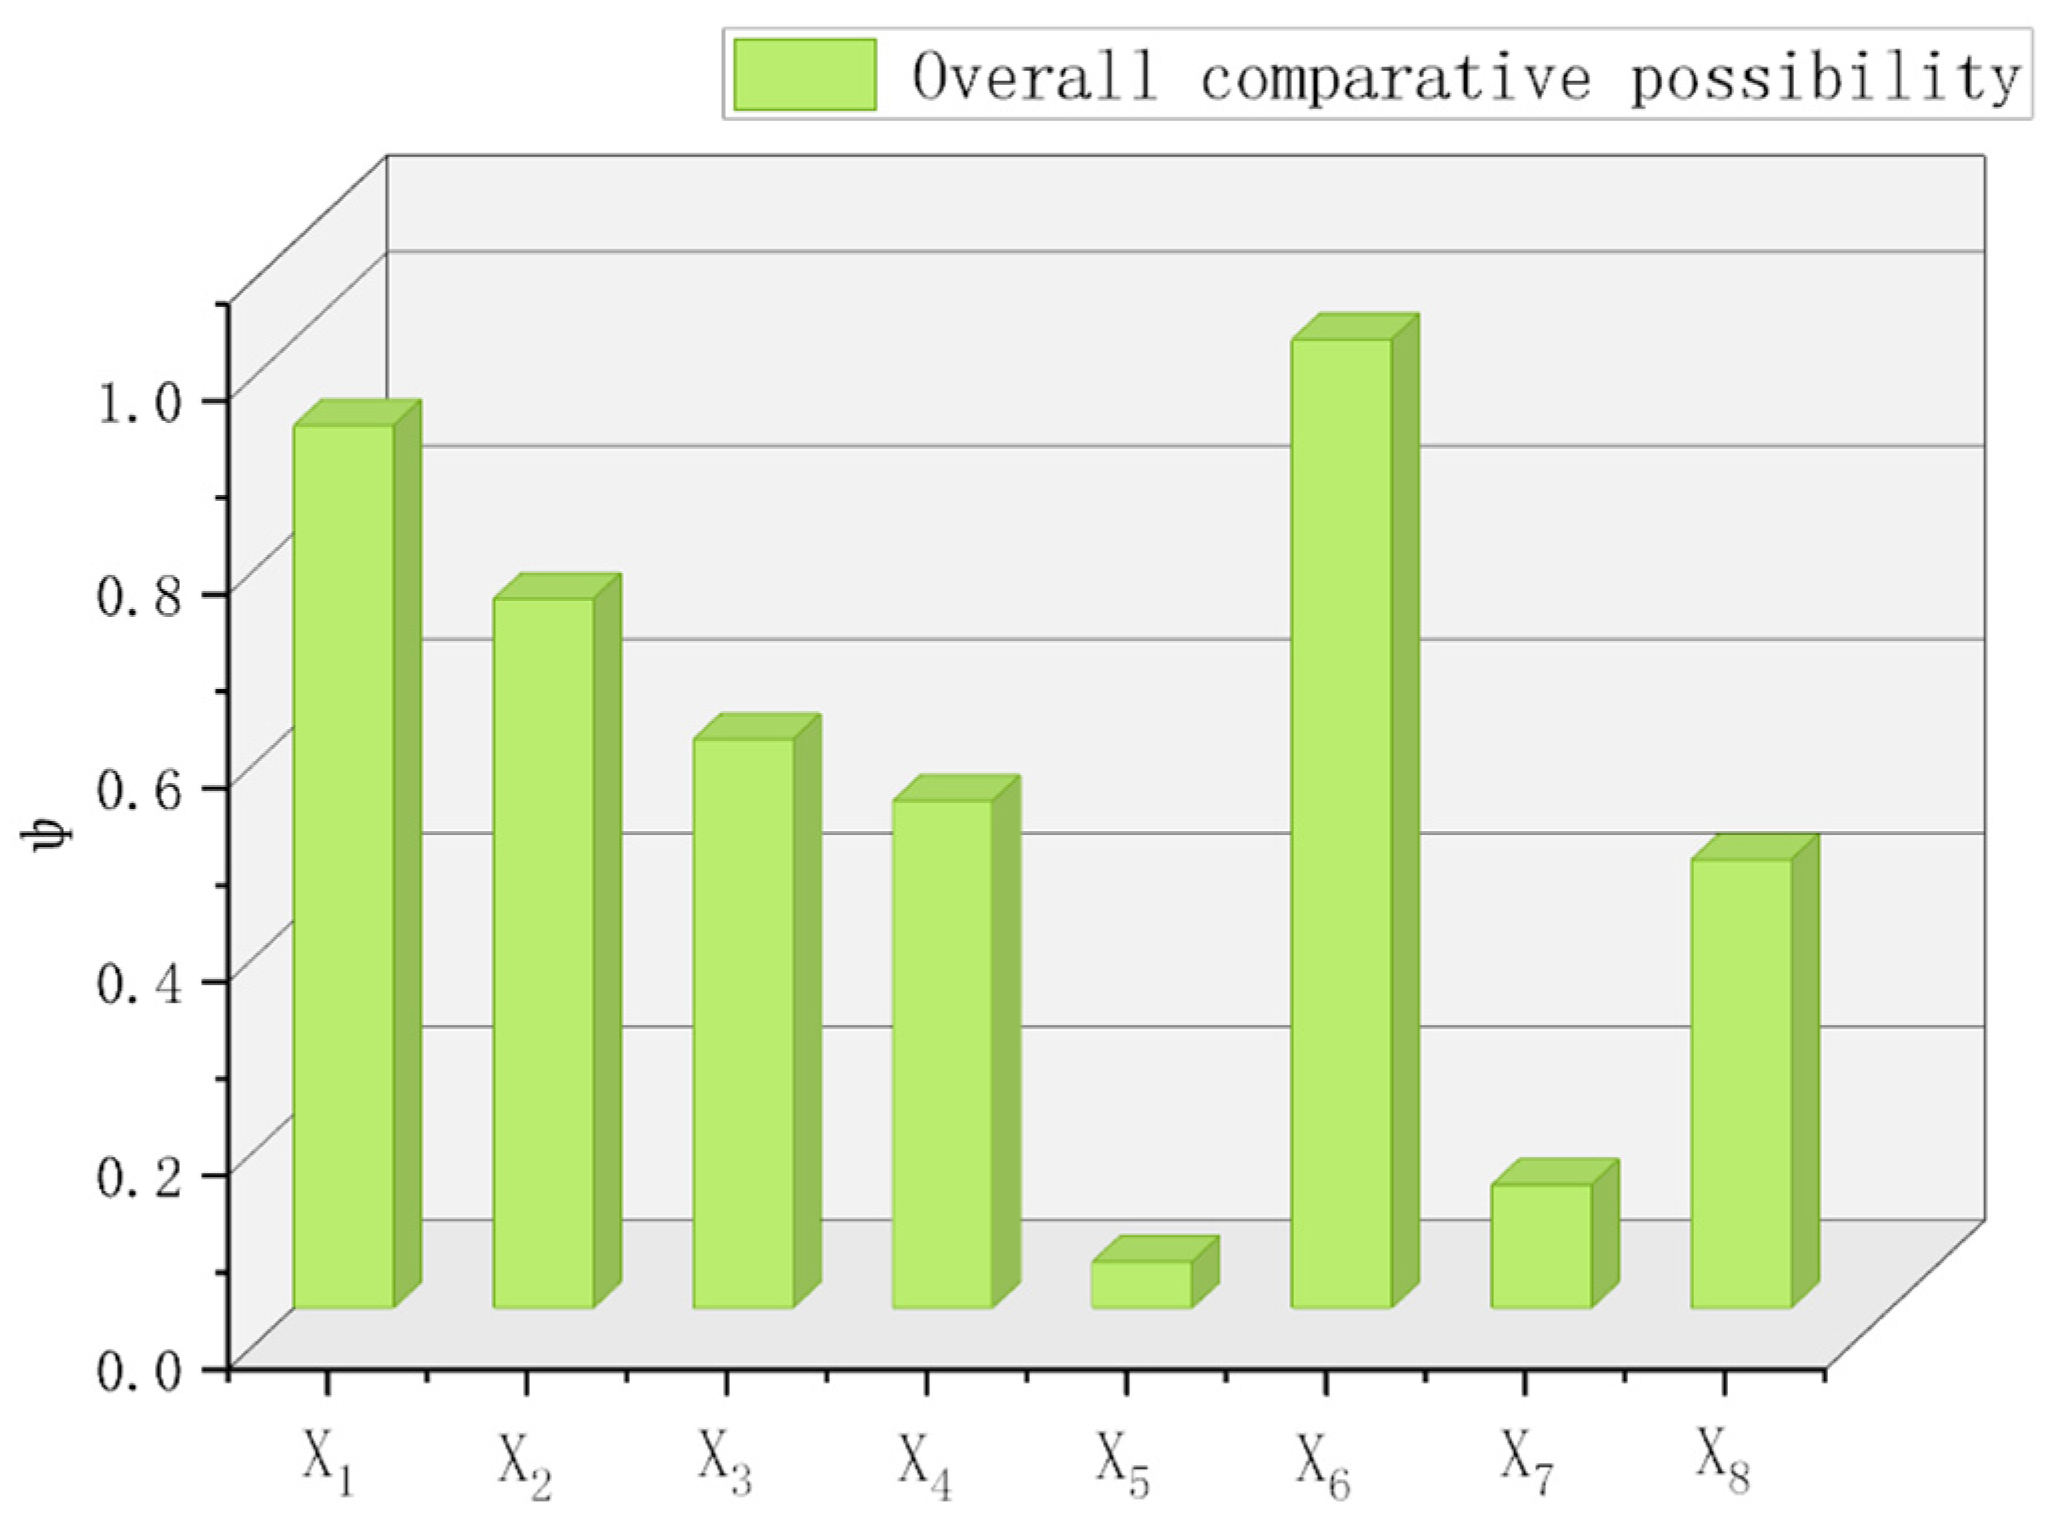
| Overall comparative possibility degree | 0.9113 | 0.7322 | 0.5871 | 0.5236 | 0.0477 | 1.0002 | 0.1272 | 0.4630 |
Disclaimer/Publisher’s Note: The statements, opinions and data contained in all publications are solely those of the individual author(s) and contributor(s) and not of MDPI and/or the editor(s). MDPI and/or the editor(s) disclaim responsibility for any injury to people or property resulting from any ideas, methods, instructions or products referred to in the content. |
© 2024 by the authors. Licensee MDPI, Basel, Switzerland. This article is an open access article distributed under the terms and conditions of the Creative Commons Attribution (CC BY) license (https://creativecommons.org/licenses/by/4.0/).
Share and Cite
Xu, X.; Wang, S.; Kang, F.; Li, S.; Li, Q.; Wu, T. Multi-Attribute Decision-Making Method in Preventive Maintenance of Asphalt Pavement Based on Optimized Triangular Fuzzy Number. Sustainability 2024, 16, 2787. https://doi.org/10.3390/su16072787
Xu X, Wang S, Kang F, Li S, Li Q, Wu T. Multi-Attribute Decision-Making Method in Preventive Maintenance of Asphalt Pavement Based on Optimized Triangular Fuzzy Number. Sustainability. 2024; 16(7):2787. https://doi.org/10.3390/su16072787
Chicago/Turabian StyleXu, Xunqian, Siwen Wang, Fengyi Kang, Shue Li, Qi Li, and Tao Wu. 2024. "Multi-Attribute Decision-Making Method in Preventive Maintenance of Asphalt Pavement Based on Optimized Triangular Fuzzy Number" Sustainability 16, no. 7: 2787. https://doi.org/10.3390/su16072787