Article

The Spatiotemporal Impact of Digital Economy on High-Quality Agricultural Development: Evidence from China

School of Economics and Business Administration, Heilongjiang University, Harbin 150080, China
*
Author to whom correspondence should be addressed.
Sustainability 2024, 16(7), 2814; https://doi.org/10.3390/su16072814
Submission received: 15 February 2024 / Revised: 24 March 2024 / Accepted: 25 March 2024 / Published: 28 March 2024
(This article belongs to the Special Issue Agricultural Economic Transformation and Sustainable Development)

Abstract

:
China’s high-quality economic development is strongly supported by the high-quality development of agriculture, and the digital economy has emerged as a key driver for promoting shared prosperity and high-quality economic development. Against this backdrop, investigating the connection between high-quality agricultural development and the digital economy holds significant importance. This study utilized the entropy-weighted TOPSIS model to evaluate comprehensive evaluation indicators of the two according to panel data from 30 provinces in China between 2011 and 2021. Subsequently, GIS spatial analysis and exploratory spatial data analysis (ESDA) were employed to investigate the spatiotemporal evolution features and spatial correlations. Finally, the spatiotemporal geographically weighted regression (GTWR) model was constructed to examine the spatiotemporal impact of the digital economy on the advancement of high-quality agricultural growth. The results indicate that: (1) from 2011 to 2021, China’s high-quality agricultural development and digital economy both demonstrated a general increasing trend. In terms of spatial distribution, there were significant spatial variations, with a general trend of “Southeast is higher, whereas the Northwest is lower”. The regions with significant value were primarily clustered in the coastal areas in the east and several provincial capitals. (2) Both of the two exhibited significant global spatial self-correlation, and there were also significant spatiotemporal clustering effects in high-quality agricultural growth, gradually forming a high-value cluster centered around Shanghai and a low-value cluster centered around western provinces. (3) The digital economy positively influences the enhancement of high-quality agricultural development, demonstrating notable spatial and temporal heterogeneity. In contrast to the southeastern areas, the influence is more pronounced in the northern and central-western areas.

1. Introduction

China stands as a prominent global agricultural force, with agriculture holding considerable importance in the nation’s economic landscape. “The White Paper on China’s Food Security” pointed out that China has undergone a significant transition from hunger to sufficiency and then to moderate prosperity. In 2022, China achieved an overall grain output of 687 million tons [1], and some key agricultural products have consistently held the top position globally in terms of production. Despite China’s remarkable achievements in agriculture, it finds itself in a dual predicament of low efficiency, low innovation drive, and environmental pollution. The high agricultural inputs are accompanied by low grain yields which are far below those of European and American developed nations [2]. The application of synthetic fertilizers not only seriously pollutes the environment but also accelerate the depletion of resources [3]. Traditional production factors, agricultural production techniques, and agricultural development models can no longer provide sustainable momentum for achieving high-quality agricultural development. Insufficient innovation drive in agriculture and inadequate international competitiveness of agricultural products have gradually become important factors restricting the modernization of agriculture and the overall revitalization of the countryside. It is imperative to investigate new paths to foster high-quality agricultural growth.
The digital economy has emerged as a key driver for promoting shared prosperity and high-quality economic development. The Chinese government has repeatedly emphasized the necessity of implementing rural digital development initiatives, expediting the creation of digital application scenarios, and accelerating the growth of “smart agriculture”. In the last few years, China has been committed to implementing the digital agricultural growth strategy, and modern agriculture is moving towards digitization. Agricultural digitization has emerged as a significant factor contributing to high-quality agricultural growth and providing a new impetus for rural economic development [4,5]. Against this backdrop, studies that explore the connection between the digital economy and high-quality agricultural development are both theoretically and practically significant.

2. Literature Review

There is a relatively abundant body of studies related to this topic, which mainly focuses on three aspects. One aspect is the connotation, spatial patterns, and economic effects of the digital economy. “Digital economy” is a recently emerged economy that has been shaped by advancements in information and communication technologies (ICTs). Since the formal proposal of the idea of the “digital economy” by Tapscott [6], scholars both domestically and internationally have engaged in plenty of discussions on different aspects, leading to a substantial body of studies. In relation to the connotation, Tapscott suggests that its prominent features include digitization, the fact that it is knowledge-based, virtualization, and interconnectedness. In terms of spatial patterns, there are notable regional disparities, primarily because of variations in available resources and digital infrastructure [7,8,9,10]. Research has found that China’s digital economy has evolved from an initial stage of agglomeration to a more balanced and diffused development pattern. Regarding economic effects, Zhang proposed that it promotes the modernizing of the industrial framework and enhances industrial economy’s technological content [11]. Zhang and colleagues suggested that it is beneficial for top-notch economic growth and shared prosperity. It can enhance resource allocation efficiency to promote top-notch economic growth [12,13]. Cao proposed that it can encourage top-notch industrial growth through new models such as networked collaboration and personalized customization [14]. Su and colleagues pointed out that it offers strong support for environmentally conscious development of the tourism industry and for promoting energy-saving, low-carbon, and top-notch development of the tourism sector [15].
The second aspect involves the investigation of high-quality agricultural development. The existing literature has explored it from two perspectives. Firstly, researchers have primarily focused on constructing evaluation systems and measuring indicators. A key metric for assessing the rise of a nation’s wealth is total factor productivity (TFP), which is especially important in developing nations [16,17,18]. It has become a crucial metric for measuring superior agricultural development. However, TFP in agriculture primarily considers capital and labor factors while neglecting environmental factors related to the growth of sustainable agriculture. Therefore, it is unable to adequately capture the environmental advantages of high-quality agricultural development [19]. Secondly, consider the natural motivations and pathways leading to high-quality agricultural development. Currently, there is abundant research in the theoretical field. This research includes studies on the incremental inputs of key resources like land and labor [20], technological innovation, and digital finance [21]. These factors are all important in influencing high-quality agricultural development. Furthermore, innovation in agricultural technology is essential for achieving high-quality agricultural advancement [22,23]. Informatization is a key driver of technological innovation, and agricultural informatization helps to improve the TFP in agriculture [24].
The third aspect involves studying the connection between the digital economy and advanced agricultural development. With the swift advancement of new-generation information technologies, the digital economy is constantly empowering agriculture and becoming a fresh source of power and momentum for high-quality agricultural development [25,26]. Scholars such as Zhou and Li have suggested that the digital economy has the potential to overcome the constraints of time and space in exchanging information, thus facilitating the integration of agricultural resources and thereby improving agricultural productivity and development [27,28]. Zhang and colleagues suggested that advancements in agricultural technology within the digital economy could enhance overall green productivity in agriculture [29]. Wang and colleagues discovered that digital finance could enhance the process of high-quality agricultural development, but there are dual thresholds for the impact of the former on the latter [30]. Tang Y. highlighted the importance of agricultural digitalization in achieving the goals of high-quality agricultural advancement [31].
The significance of leveraging the digital economy to enhance the quality of agricultural development has been acknowledged and underscored. A comprehensive examination of the relationship between the two from an empirical perspective has been fairly thorough. However, the current body of literature is deficient in novel methodologies and innovative viewpoints for investigating the relationship between the two entities. Currently, there has been no utilization of ArcGIS spatial visualization techniques and GTWR models to investigate the spatiotemporal impact effects of the two. Hence, examining the influence of the digital economy on the advancement of high-quality agriculture from both temporal and spatial viewpoints, bears significant practical and theoretical implications. The study will utilize data collected from 30 provinces in China between 2011 and 2021. The study aims to investigate the spatiotemporal distribution patterns and effects of the two in China by utilizing the entropy-weighted TOPSIS model, geographic information system (GIS) spatial analysis, and the GTWR model. The objective is to further clarify the relationship between the two and provide valuable insights for achieving high-quality agricultural development in the context of agricultural and rural modernization.

3. Model Construction and Indicator Description

3.1. Entropy-Weighted TOPSIS

The entropy-weighted TOPSIS method is used to evaluate the levels of different subsystems and the overall levels of digital economy and high-quality agricultural development. This method integrates the entropy weight method with the TOPSIS model to offer a comprehensive evaluation approach. The integration of both methods can mitigate the challenges of exclusively relying on the entropy method for ranking evaluation outcomes and the subjectivity concerns linked to the exclusive use of the TOPSIS model. This integration enhances the objectivity and comparability of research findings. The principle entails the application of the entropy weight method to standardize indicators of each subsystem, determining the weights of each evaluation indicator in the overall indicator system. Subsequently, the TOPSIS method is employed to calculate the comprehensive scores of the evaluation subjects. It is a frequently employed multi-criteria decision-making analysis technique. It is well-suited for comparative studies involving multiple scenarios and objects, aiming to determine the optimal choice or the most competitive object. The evaluation process involves ranking objects by assessing the distance between each object and the ideal and worst solutions, thereby providing a comprehensive score. An object is deemed optimal when it is in proximity to the ideal solution and distant from the worst solution; otherwise, it is considered non-optimal. The subsequent stages outline the exact steps involved in the calculation.
(1)
The entropy weighting technique is employed to determine the weights of the indicators. The variable m denotes the sample size, while n represents the number of evaluation indicators. Additionally, k = 1/ln(m). Initially, the entropy values of each indicator are calculated using Equation (1), where “yi “represents the value of the j-th indicator in the i-th sample, and ej denotes the entropy value of each indicator, with 0 ≤ ej ≤ 1. Subsequently, the weights of each indicator are calculated based on the entropy values ej of each indicator, as shown in Equation (2), where Wj represents the weight of the j-th indicator.
e j = k i = 1 m y i j / i = 1 m y i j × ln y i j / i = 1 m y i j
W j = 1 e j / j = 1 n 1 e j
(2)
The Euclidean distance is calculated, representing the distance of evaluation indicators from the ideal solution D i + and the worst solution D i , as shown in Equations (3) and (4), where v i j denotes the weighted normalized matrix of each indicator ( v i j = W j y i j ), v j + denotes the ideal solution ( v i j = W j y i j ), and v j denotes the worst solution ( v i j = W j y i j ).
D i + = j = 1 m v i j v j + 2
D i = j = 1 m v i j v j 2
(3)
The comprehensive evaluation index is calculated, specifically measuring the relative closeness of each evaluation object to the optimal solution.
N i = D i / D i + + D i
In the equation, Ni denotes the comprehensive score, which refers to the comprehensive evaluation index. The value of Ni ranges from 0 to 1; if Ni approaches 1, it signifies that the indicator is closer to the optimal value. Conversely, if Ni approaches 0, it suggests that the indicator is closer to the worst level.

3.2. Exploratory Spatial Data Analysis (ESDA)

ESDA is used to observe the correlation and variation of phenomena in space and involves both global and local aspects. The Global Moran’s I is used to measure the dispersion or clustering degree among all spatial units in the entire study area. The formula is as follows:
I G = i = 1 n j = 1 n w i j ( x i x _ ) ( x j x _ ) S 2 i = 1 n j = 1 n w i j
In the equation, I G represents the Global Moran′s index, n represents the number of cities in the study, x i   a n d   x j , respectively, represent the attribute values of cities i and j, x ¯ represents the average value of the attribute, S 2 represents the sample variance of the attribute values of the research units, and w i j represents the inverse distance spatial weight matrix.
In the local autocorrelation test, the LISA statistic is introduced to measure the spatial clustering features of different samples in space, as follows:
L I S A = X i X _ S 2 j = 1 n w i j ( X j X _ )

3.3. GTWR Model

Huang [32] first proposed the use of the spatiotemporal geographic weighted regression model (GTWR) for modeling spatiotemporal changes in house prices. Compared with the traditional geographic weighted regression model [33], the GTWR model incorporates a time dimension, which can better handle the non-stationarity of “time–space” and produce more effective estimation results [34]. Therefore, this paper adopts the GTWR model to analyze the impact in different spatiotemporal dimensions. The model is as follows:
Y i = β 0 ( u i , v i , t i ) + k = 1 p β k ( u i , v i , t i ) X i k + ε i
In the equation, Y i represents the observed value. u i , v i represents the latitude and longitude of the i-th observation point. t i represents the time parameter. u i , v i , t i represents the spatiotemporal coordinates of the i-th observation point. β 0 represents the regression constant. β k u i , v i , t i symbolizes the k-th independent variable’s regression coefficient at the i-th observation point. ε i represents the residual.
The core elements of the GTWR model are the selection of the spatiotemporal weight matrix and bandwidth. The spatiotemporal weight matrix provides an estimation for each spatiotemporal location of the observation point “i” and the independent variable “k”, as illustrated in the following formula:
β ^ ( u i , v i , t i ) = X T W ( u i , v i , t i ) X 1 X T W ( u i , v i , t i ) Y
In the equation, β ^ u i , v i , t i symbolizes the estimated value of β k u i , v i , t i ; W u i , v i , t i symbolizes the spatiotemporal weight matrices; X T presents the transposition of the matrices; and Y represents the matrices composed of observed values.
This study employs the bi-square spatial weighting function, a finite Gaussian function, to mitigate the “long tail effect” resulting from data dispersion. The model is presented as follows:
W i j S T = 1 d i j S T b i 2 2 , d i j S T b i 0 , d i j S T > b i
In the equation, W i j S T represents the spatiotemporal weight matrices produced from the bi-square spatial weight function, and d i j S T represents the spatiotemporal distance between observation point “i” and observation point “j”. The formula is as follows: δ u i u j 2 + v i v j 2 + μ ( t i t j ) 2 .Clearly, the selection of the bandwidth “b” in the formula will have a big impact on how the spatiotemporal weight matrix is established, and this paper utilizes the AICc criterion method to determine an adaptive bandwidth.

3.4. Indicator Description

3.4.1. Dependent Variable

The comprehensive assessment index system for promoting high-quality agricultural development is built upon five key development principles: creativity, collaboration, sustainability, openness, and innovation [35], as well as the viewpoints of improving quality and efficiency and integrating industries, drawing from relevant research. The system consists of five dimensions: basic development, quality improvement, integrated development, new quality development, and shared development (Table 1). Subsequently, the level of high-quality agricultural growth was assessed using the TOPSIS approach for 30 Chinese provinces between 2011 and 2021.
In terms of the basic development dimension, a solid agricultural foundation is an essential and important support. The stability, efficiency, and sustainable development of the agricultural sector cannot be achieved without the development and application of revolutionary cutting-edge technologies. With the trend of modern agricultural production being dominated by large-scale land use, modern mechanical equipment has begun to be widely utilized [36]. Therefore, this study integrates the degree of mechanization in addition to the per unit area grain yield to jointly measure the level of agricultural basic development.
In terms of the quality improvement dimension, development must consider both quality and efficiency. This dimension includes improving the living standards of rural residents and promoting agricultural innovation. Therefore, this study utilizes rural residents’ net income and the rural Engel coefficient to depict the production and living conditions of farmers. Additionally, the urban/rural income ratio and urban/rural consumption ratio are chosen to assess the urban/rural development gap [37]. The study also incorporates the agricultural industry structure adjustment index, labor productivity, and land productivity to assess agricultural innovation.
In terms of the integrated development dimension, the integration of agricultural industries is indispensable [38]. The deep integration of agriculture with industries such as ecology, culture, tourism, and elderly care represents an inevitable choice. Deep integration refers to efficient integration across various agricultural stages by widening the industrial chain, extending vertically, making the industry multifunctional, and aggregating factors based on agricultural production [39,40]. It enhances the effectiveness, sustainability, and competitiveness of agricultural production by combining the output of the primary sector, the processing and sales of the secondary industry, and the services of the tertiary sector. This study employs the ratio of the output value of the agriculture, forestry, animal husbandry, and fishery service industry, the output value proportion of the agricultural product processing industry, and the added value of the tertiary industry as indicators to quantify agricultural industry integration.
In terms of the new quality development dimension, this study integrates agricultural green and sustainable development and introduces the concept of “new quality development”. The precondition for the green development of agriculture is to avoid excessive consumption of resources and environmental pollution. Hence, the study employs the per unit area of plastic film usage as a metric to assess resource consumption levels. (Agricultural plastic films require significant amounts of raw materials such as petroleum, natural gas, and water in their production processes, potentially resulting in considerable resource depletion. During the utilization phase, inadequate management practices may result in wastage and the frequent replacement of plastic films, leading to resource depletion). Additionally, the measurement of environmental pollution levels includes the assessment of fertilizer and pesticide usage per unit area. The sustainable development of agriculture emphasizes the effective management and sustainable utilization of natural resources. This approach aims to prevent the overuse and wastage of resources, thereby guaranteeing the long-term stability of resource availability. Hence, this study opts to utilize forest coverage and the effective irrigation rate as indicators to assess the degree of sustainable agricultural resource utilization.
The shared development dimension includes both domestic shared development and international shared development. For domestic agricultural shared development, local financial resources directed towards agricultural education expenditure and providing financial support to the agricultural sector are considered. The intensity of financial support for agriculture reflects the strength of national financial investment [41], and it is an important policy for supporting agricultural development, as well as a significant approach to addressing the shortage of funds for agricultural production among farmers. For international shared development, the level of agricultural foreign trade is used to reflect the influence of a country’s agriculture and its level of openness. This paper selects the proportion of total agricultural import and export trade to measure this.

3.4.2. Explanatory Variables

According to previous studies, considering data availability and continuity, this study has chosen three dimensions—digital industrial development, digital infrastructure, and digital inclusive finance—to establish a comprehensive evaluation system for the digital economy (Table 2). This study employed the TOPSIS approach to obtain the thorough index of the digital economy for every province and city. The Digital Inclusive Finance Index incorporates the Inclusive Finance Index, a collaborative effort between Peking University Digital Finance Research Center and Ant Financial Group [42]. This dataset provides three secondary indicators: coverage breadth, depth of usage, and level of digitization. It is widely acknowledged as a reputable source of data in China.

3.4.3. Selection of Control Variables

The following control variables are included: (1) urbanization level (ur), determined by the ratio of urban population to total population; urbanization provides support for the advancement of agriculture in terms of market, technology, and funding, creating objective conditions for the process of modernizing and improving agriculture. (2) Rural education level (edu), determined by the average number of years of education among rural dwellers. (3) The industrial structure level (jgh) is indicated by the ratio of value added from the tertiary industry to the value added from the secondary industry. Upgrading the industrial structure promotes the optimization and adjustment of the agricultural production structure and increases the demand for higher-quality agricultural products. (4) Level of openness (open) is represented by the proportion of the actual total import and export volume of each province to the regional gross domestic product. It can promote regional economic prosperity and accelerate rural agricultural modernization. (5) The old-age dependency (old) refers to the severe shortage of human capital caused by the aging of the rural workforce, which will hinder the further development of rural industries.

3.4.4. Source of Data

Given the importance of data accessibility and timeliness, this study opted to utilize panel data from 30 Chinese provinces between 2011 and 2021 as the sample for analysis. The data primarily originate from the annual publications such as the China Rural Statistical Yearbook, China Agricultural Products Processing Industry Yearbook, China Statistical Yearbook, China Agricultural Yearbook, as well as from various provincial statistical yearbooks. Missing data were approximated through the utilization of the mean annual growth rate and interpolation.

4. Results and Analysis

4.1. The Spatiotemporal Evolution of the Digital Economy and the High-Quality Development of Agricultural Economy

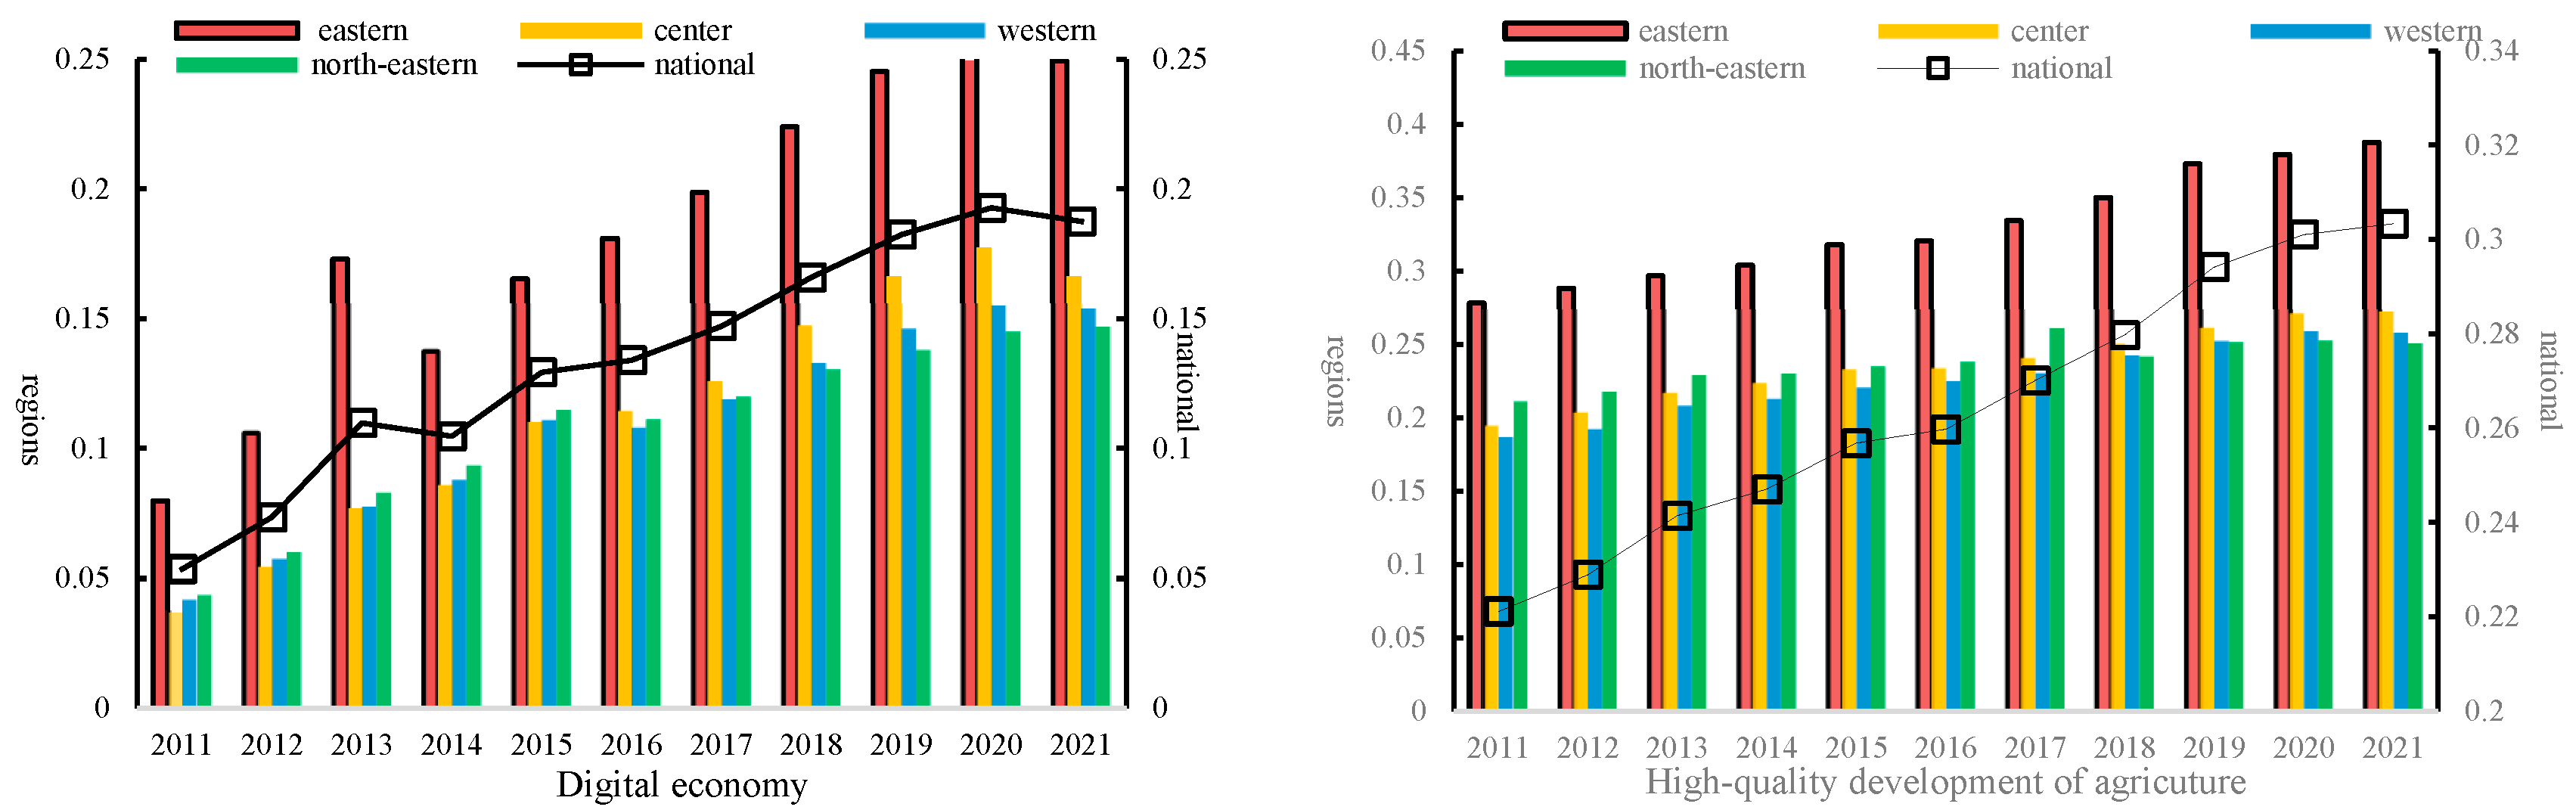
4.1.1. Time Series Feature Analysis

The time series chart (Figure 1) depicted in this study illustrates the comprehensive evaluation index of the digital economy and high-quality agriculture for 30 provinces. The index was calculated using the entropy-weighted TOPSIS method. The line graph illustrates the aggregated composite scores calculated by averaging the composite scores of the 30 provinces, while the bar graph depicts the composite scores of different sub-regions obtained by averaging the composite scores of the corresponding provincial regions. The data presented in Figure 1 illustrate a continuous upward trend in China’s digital economy from 2011 to 2021. The comprehensive score of the digital economy increased from 0.053 in 2011 to 0.187 in 2021, indicating a relatively rapid growth rate. Furthermore, a consistent upward trend has been noted in various regions. Particularly noteworthy is the higher level in the eastern regions compared to other areas annually, indicating a geographical distribution pattern of “East > Central > West > Northeast”. The phenomenon can be attributed to the larger economic scale and faster economic growth rate in the eastern region coupled with policy incentives aimed at fostering the digital revolution and expanding the digital industry.
From Figure 1, it is evident that China’s level of high-quality agricultural development has been steadily rising between 2011 and 2021. The level in various regions has also shown an overall stable upward trend; however, there are significant regional variations: the level in the eastern region surpasses that in other regions, suggesting a high quality of agricultural development. Conversely, the western and northeastern regions exhibit levels below the national average, indicating a lower quality of agricultural development. Possible reasons for this include the following: (1) the accelerated pace of agricultural advancement in the eastern regions has resulted in a more pronounced reduction in arable land area compared to the western regions. This situation necessitates an improvement in efficiency and yield to compensate for losses, consequently fostering a higher standard of agricultural development; (2) provinces with high-quality agricultural development have received better financial and technological support, enabling more efficient use of resources, accelerating agricultural transformation, promoting industrial structure adjustment, and continuously improving industrial efficiency and productivity; (3) provinces with low-quality agricultural development face different limiting factors, with some provinces lacking in environmental resources, while others, despite abundant resources, have relatively weak production efficiency and technological innovation.
Through comparative analysis, it was found that there is a high degree of consistency in the temporal characteristics of digital economy and high-quality development of agriculture between the country and various regions. Therefore, a preliminary prediction can be made: the digital economy possesses the possibility to drive agriculture towards high-quality development.

4.1.2. Spatial Distribution Characteristics Analysis

Utilizing ArcGIS and the natural breaks method to visualize the levels of digital economy and high-quality agricultural development in 2011, 2016, and 2021 allows for an intuitive observation of the spatial agglomeration characteristics and evolutionary trends in different provinces, as depicted in Figure 2 and Figure 3.
In terms of the spatial distribution of the digital economy, significant regional disparities are evident among the eastern, central, and western regions. In 2011, it showed significantly greater progress in the eastern areas compared to other areas, with the northeastern and northwestern areas surpassing the central and western areas. Areas with low levels of it were primarily concentrated in the central and western regions. From 2016 to 2021, there was a consistent pattern of gradual decline observed from the coastal areas in the east towards the northwestern and northeastern regions. Specifically, high-value areas were primarily concentrated in the eastern coastal areas and sporadically dispersed in the central and western areas. Shanghai, Beijing, Zhejiang Province, and Fujian Province consistently maintained their positions in the top five rankings. Low-value regions were mostly centered on the northwestern and northeastern areas, like Xinjiang Province, Gansu Province, Qinghai Province, Jilin Province, and Heilongjiang Province, which consistently maintained relatively low levels.
High-quality agricultural development showed a spatial distribution pattern with high levels in the southeastern coastal areas and low levels in the central, western, and northeastern regions, and the distribution of high- and low-value areas demonstrated relatively stable changes over time. In terms of geographical distribution, Shanghai, Beijing, Fujian Province, Zhejiang Province, and Tianjin consistently maintained their status as high-value areas. The surrounding radiation areas, centered around Hunan Province and Shandong Province, were considered secondary high-value areas. The majority of the central, western, and northeastern regions had levels of high-quality agricultural development below the national average, classifying them as low-value areas. Specifically, Shanghai consistently maintained the highest level, while Gansu Province and Shanxi Province consistently remained at the lowest level.

4.2. Spatial Correlation Analysis

4.2.1. Global Spatial Autocorrelation

From a spatial perspective (Table 3), the Global Moran’s index is positive and has passed the significance test at the 1% level. This indicates the presence of significant global spatial autocorrelation.

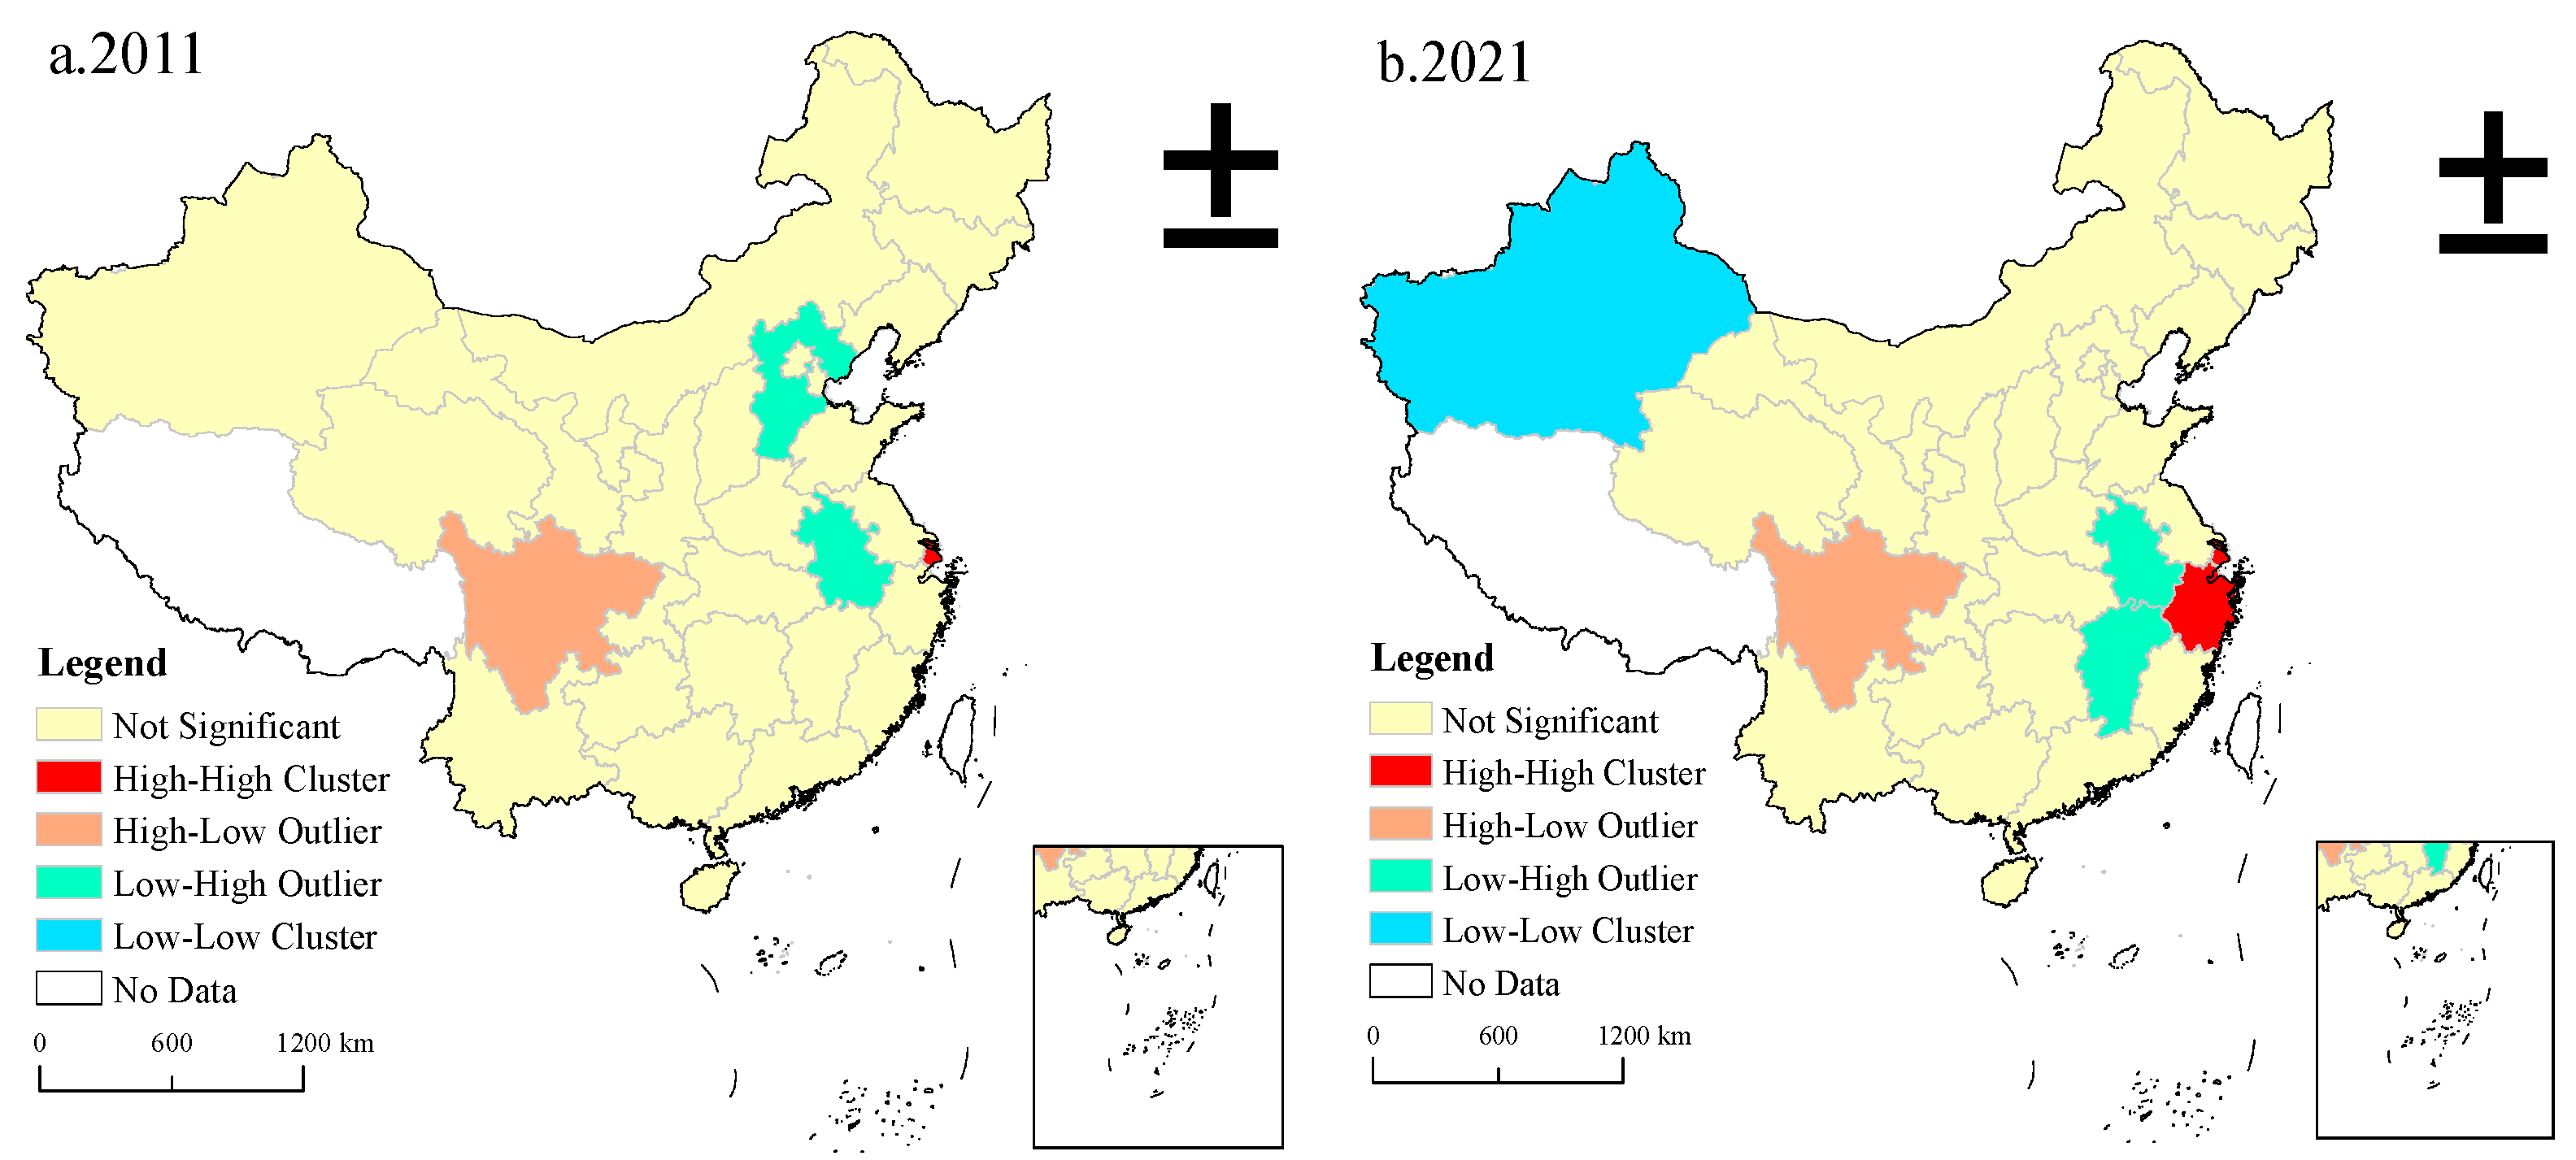
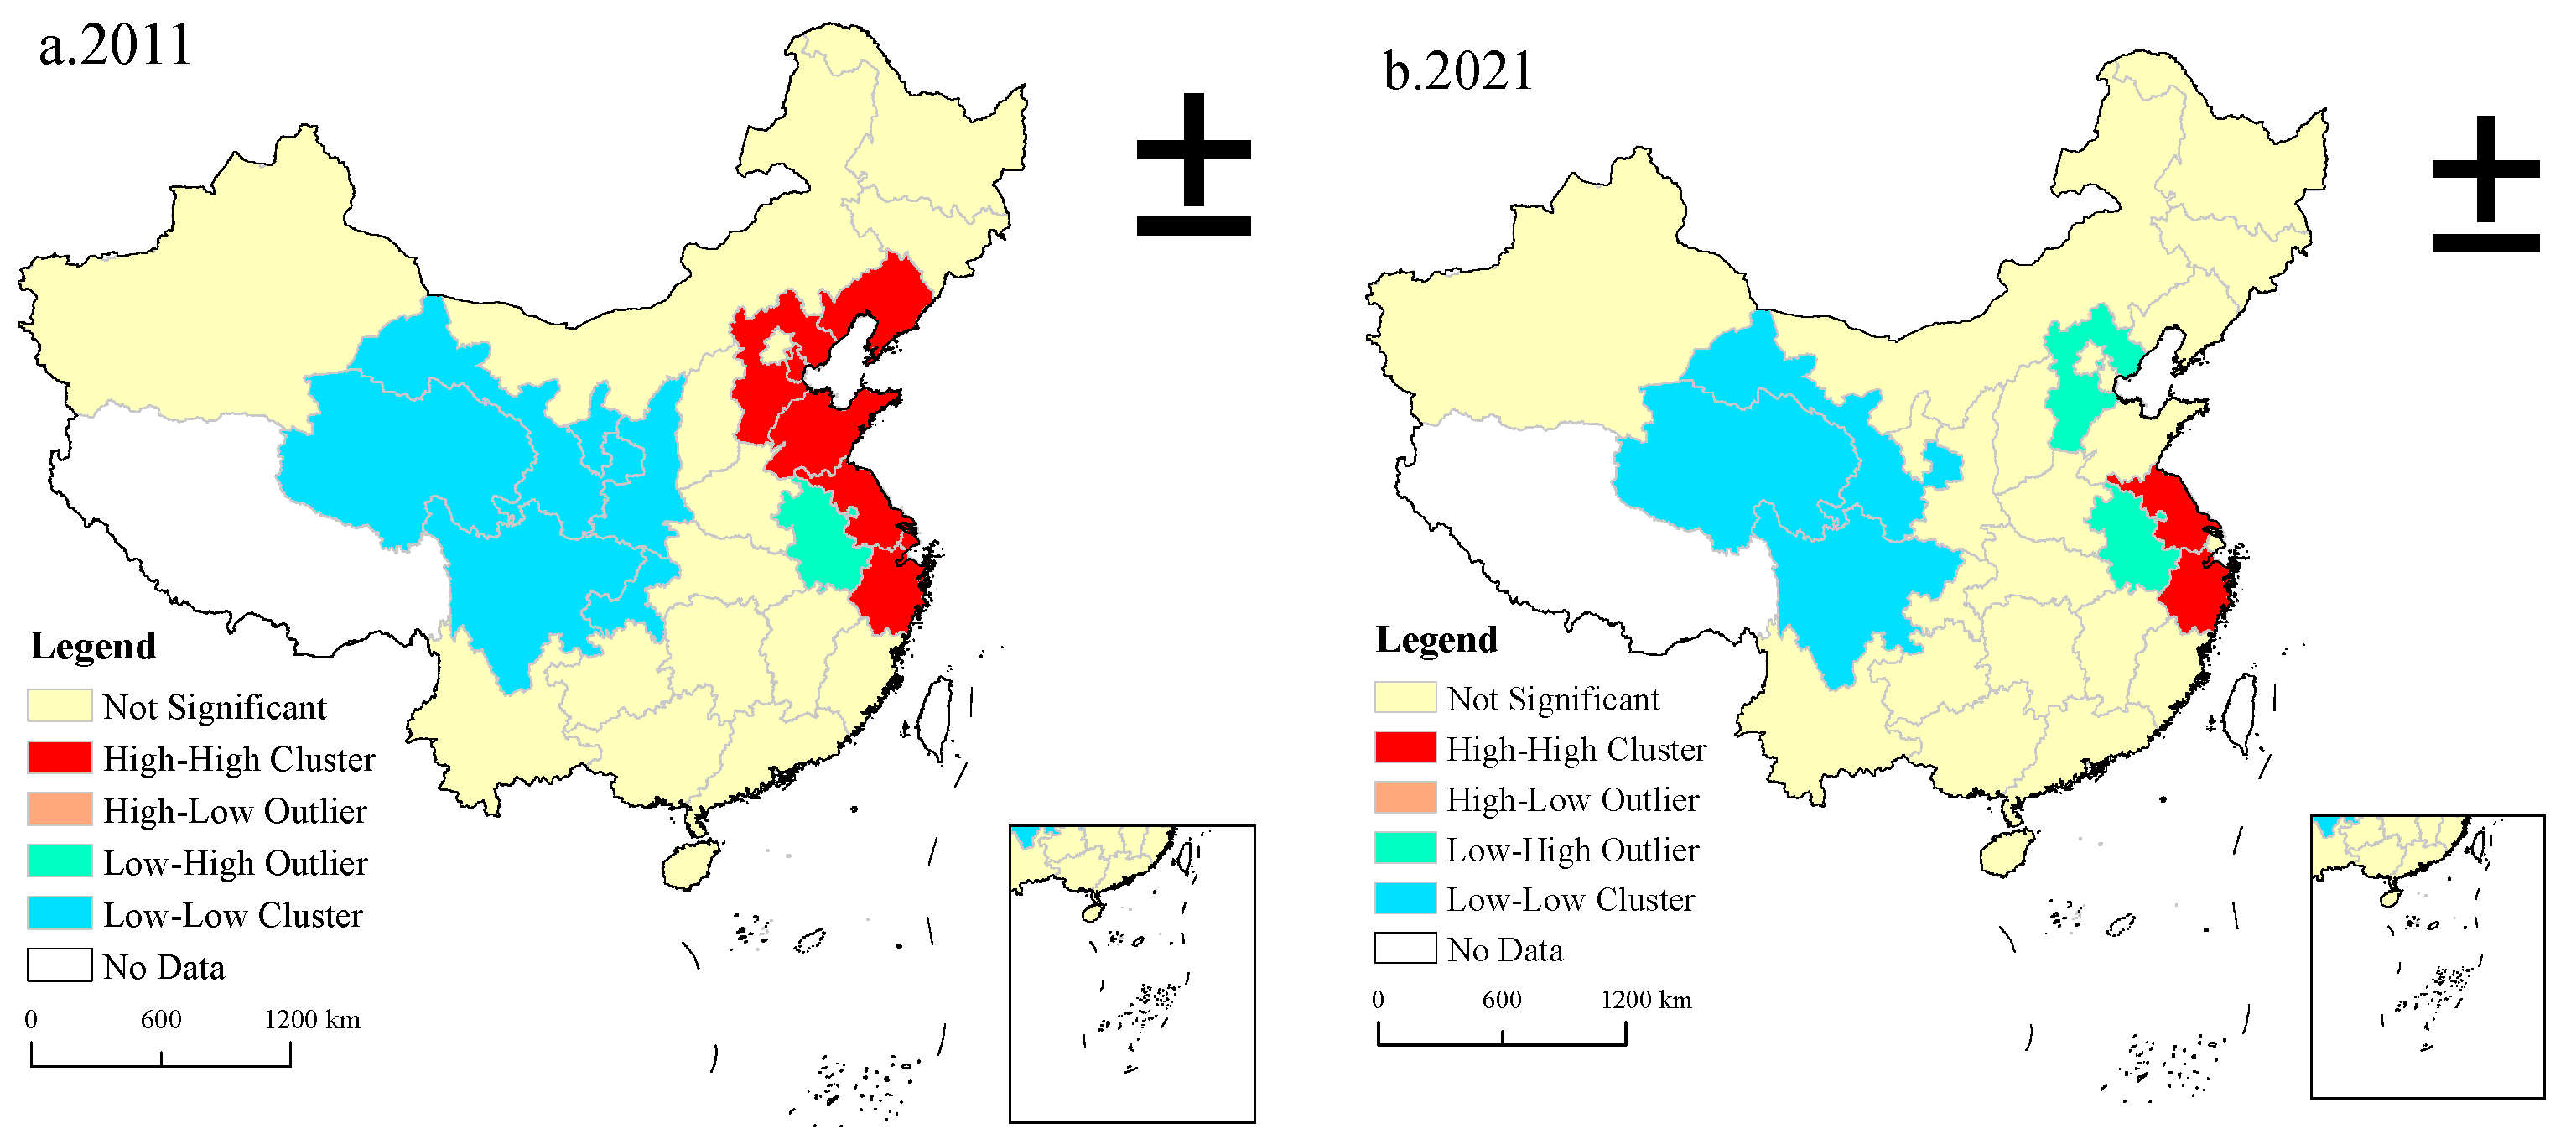
4.2.2. Local Spatial Autocorrelation

However, local spatial autocorrelation allows for the assessment of spatial correlation among individual spatial entities within a specific region and their neighboring entities, a capability not provided by the Global Moran’s index. Hence, this study opted to analyze the local spatial autocorrelation in 2011 and 2021. Building on the Global Moran’s index, LISA cluster maps were generated to visually represent the spatial clustering of heterogeneous characteristics, as depicted in Figure 4 and Figure 5. As shown in Figure 4, the region characterized by high–high agglomeration in terms of digital economy development in 2011 is situated in Shanghai. In contrast, by 2021, the high–high aggregation area has extended from Shanghai to Zhejiang Province, while the low–low aggregation region was primarily concentrated in Xinjiang Province. As depicted in Figure 5, high and low levels of agglomeration are observed in the high-quality agricultural development in China, and the high–high agglomeration areas are mainly concentrated in the eastern coastal areas. A comparison reveals a significant overlap of high-value cluster areas between the two during the study period. Therefore, it is inferred that by enhancing the digital economy development in these areas and leveraging the driving and overflow impacts of the digital economy, high-quality development can be promoted.

4.3. Spatiotemporal Non-Stationarity Analysis

4.3.1. Prior Estimation of the Model

To avoid multicollinearity issues between variables and the problem of spurious regression, tests for multicollinearity and panel data stationarity were conducted, and Table 4 presents the findings. The value of VIF for each variable is less than 3, suggesting the absence of multicollinearity issues among the driving factors. The variables of the LLC test show that the panel data are steady at the 1% significance level and there are no issues of spurious regression, thus allowing for direct parameter estimation. The industrial structure and degree of openness did not meet the IPS test criteria. After first-order differentiating all variables, they all passed the IPS test, suggesting that all variables exhibit first-order integration. Given that the economic implications of variables may alter following first-order differentiation, panel cointegration tests were performed to optimize the utilization of the original sequence data. The test results indicate that both the Pedroni test and the Westerlund test reject the null hypothesis at a significance level of 1%. This confirms the presence of cointegration among the original sequence data, thereby enabling direct regression analysis.

4.3.2. Model Testing and Selection

Leveraging ArcGIS to compare and contrast the goodness of fit (R-squared), AICc, and RSS for the OLS, TWR, GWR, and GTWR models enhances the scientific rigor of model selection. The model automatically sets the optimal bandwidth based on the AICc criterion. A higher R-squared value indicates a better model fit, while smaller RSS and AICc values indicate better model fit. Table 5 displays the results. The GTWR model demonstrates the lowest RSS and AICc values as well as the highest R-squared value, indicating that the GTWR model’s fit is better. Consequently, the GTWR model was chosen.

4.3.3. Robustness Test

In this study, the explanatory variable “digital economy” was replaced by three variables: digital infrastructure (dig1), industrial digitalization (dig2), and digital inclusive finance (dig3). Subsequently, regression analysis was performed using the OLS and GTWR model. As demonstrated in Table 6, it is clear that the R-squared values for these three variables are higher in the GTWR model, with smaller RSS and AICc, suggesting that the GTWR model’s fit is better than the OLS model, thus demonstrating the robustness of the model selection.

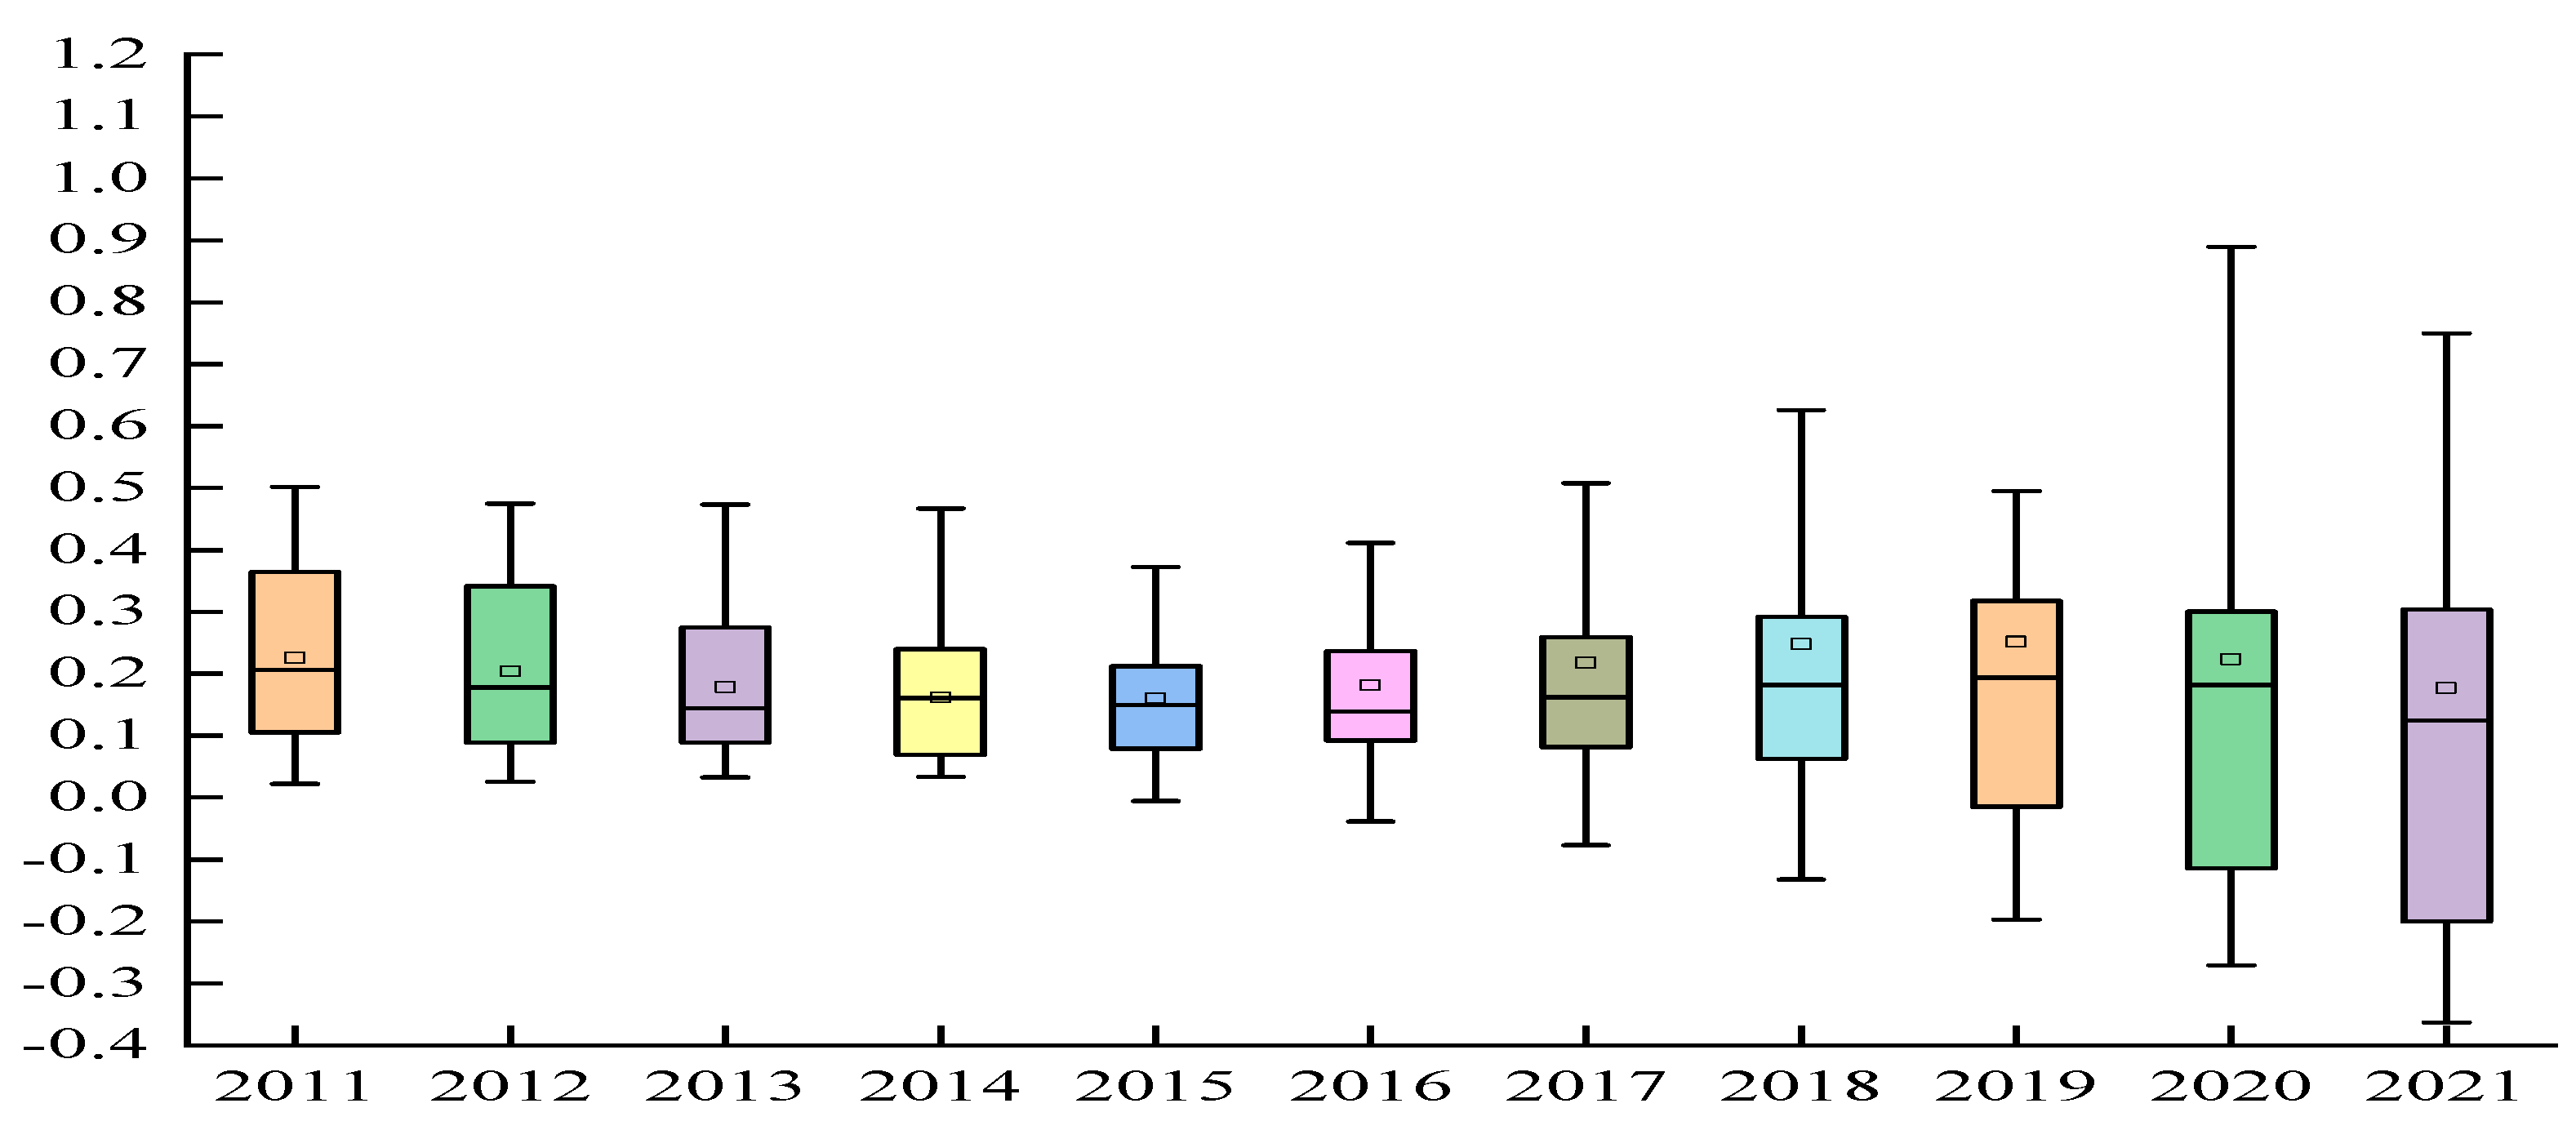
4.3.4. Temporal Non-Stationarity Evolution of the Impact of the Digital Economy

Using ArcGIS 10.8 software, the regression coefficients for the impact of the digital economy under the GTWR model were calculated, and the trend over time (Figure 6) was further visualized. From Figure 6, it is evident that the average value of it is consistently positive, indicating a significant promotional effect on the high-quality development of agriculture. However, because of factors such as the level of urbanization and industrial structure in various provinces, the promotional effect fluctuates over time, showing significant temporal non-stationarity with significant differences in different years. Additionally, the dispersion of the regression coefficients across provinces gradually decreases from 2011 to 2015 and increases from 2015 to 2021, indicating a significant spatial non-stationarity in the promotional effect.

4.3.5. Spatial Non-Stationarity Evolution of the Impact of the Digital Economy

For the purpose of clearly demonstrating the heterogeneity of the impact of the digital economy on the high-quality development of agriculture in different regions, the regression results of the GTWR model for 2011, 2016, and 2021 were selected for analysis (Figure 7).
It can be observed that the promotional effect shows significant spatial differentiation. In 2011, high-value areas were primarily located in the northwest and southwest regions. In 2016 and 2021, there was a gradual decrease from the northwest to the northeast-southeast, with the low-value areas forming in the southeast, suggesting that the promotional effect is weaker in the southeast coastal areas and stronger in the northwest and northeast areas. Specifically, in 2011, high-value areas were mostly centered in Xinjiang, Gansu, Yunnan, Guizhou, Sichuan, and Zhejiang province, which may be attributed to the following reason: the economic level and agricultural skills in the grain production and sales balance areas were relatively weak in 2011, and the digital economy significantly motivated the efficiency of agriculture by changing traditional agricultural production methods.
In 2016 and 2021, the promotional effect was not significant in the economically developed areas along the southeast coast. High-value areas were mostly concentrated in economically underdeveloped areas such as Xinjiang, Gansu, and the three northeastern provinces. The following are some potential explanations for this: firstly, while rural areas in the northwest and northeast regions may be trailing behind the southeast in terms of infrastructure, factor allocation, and locational conditions, the nascent stage of digital economy development in these areas also suggests a higher potential for development. The spatial spillover capacity of the digital economy is playing a significant role in mitigating the inherent developmental resource disparities, thereby alleviating the weaknesses in agricultural development within these regions. Secondly, the developed southeastern coastal areas have responded actively to the demands of rapid economic development and have successively introduced a large number of other economic policy measures to encourage regional economic development. Therefore, the digital economy has not shown notable effectiveness. In contrast, the economic development of provinces in the northwest and northeast areas has many shortcomings, and the digital economy can bring significant economic dividends to them. Thirdly, in the southeastern coastal areas such as Shanghai, Guangdong, Jiangsu, and Zhejiang, the development of the digital economy has been far ahead of other provinces in recent years. These regions have abundant factor supply and market demand. However, challenges such as heightened competition in the digital technology industry, urgent need for technological innovation, talent shortage, and intense competition of homogenization have gradually emerged, diminishing these areas’ capacity to significantly enhance the high-quality development of agriculture.
In conclusion, it is clear that the promotional effect exhibits significant spatial heterogeneity.

5. Conclusions and Policy Implications

5.1. Conclusions

This study primarily examined the spatiotemporal heterogeneity of the impact of China’s digital economy on the high-quality development levels of agriculture across 30 provinces and municipalities from 2011 to 2021. (1) In terms of temporal characteristics, from 2011 to 2021, there has been a consistent upward trajectory in the advancement of the digital economy in China alongside a steady annual growth in high-quality agricultural development. In terms of spatial distribution characteristics, both sectors demonstrate a spatial distribution trend characterized by higher levels of development in the southeast region and lower levels in the northwest, highlighting notable spatial disparities. (2) Regarding spatial correlation, the Global Moran’s I index indicates that both exhibit significant global spatial autocorrelation, and the LISA cluster map shows a significant spatiotemporal clustering effect of high-quality agricultural development, demonstrating the existence of pronounced “high–high” and “low–low” clustering phenomena. (3) The findings of the GTWR model suggest that the advancement of the digital economy plays a crucial role in fostering the high-quality development of agriculture. Robustness tests reveal that this promotional effect remains significant when the digital economy is tested across different dimensions. (4) This promotional effect exhibits temporal and spatial non-stationarity, with a weaker promotional effect in the southeast coastal areas and a stronger promoting effect in the northwest and northeast regions.
The study makes the following contributions: 1. Innovation in the indicator system for high-quality agricultural development, by constructing a new comprehensive evaluation index system with “basic development, quality improvement, integrated development, new quality development, and shared development” as its core. 2. Innovation in research content, as there are limited publications in the literature exploring the spatiotemporal impact of the digital economy on high-quality agricultural development. 3. Innovation in research methods, by using ArcGIS for spatial visualization to intuitively demonstrate the heterogeneity at the regional and geographical distance levels. Additionally, the study utilizes the GTWR model to analyze spatiotemporal impact. This provides practical evidence for formulating differentiated digital economic policies to serve high-quality agricultural development and offers a new approach for research on high-quality agricultural development, thereby supplementing existing research to a certain extent.

5.2. Policy Implications

Firstly, the rural digital economy should be utilized to stimulate the vitality of rural digital innovation and entrepreneurship. This can be achieved in the following manner: (1) by developing Internet and related communication infrastructure to enhance the digital infrastructure in rural areas. (2) By highlighting innovation in digital technology, cultivating a high-level digital talent team, and fostering agricultural products highly integrated with digital technology. This will accelerate the industrialization and digital transformation of rural digital industries. (3) By promoting the deep integration development of digital inclusive finance with agriculture and rural areas. Emphasis should be placed on innovating and advancing diversified digital financial service models such as credit, insurance, and credit services, enabling better adaptation to the rural areas.
Secondly, enhancement of the market capitalization of agricultural listed companies can be achieved by incorporating digital economy elements and utilizing financial markets. One manner in which to accomplish this is through the implementation of a comprehensive strategy that spans across the stages of production, processing, marketing, distribution, and sales. During production and processing, optimizing digital technology use, fostering innovation in new product development, and embracing value-added processing technologies are essential. In the marketing process, utilizing E-commerce platforms and digital marketing strategies is recommended to expand market reach and target new consumer segments. In the distribution and supply chain stages, it is crucial to streamline distribution and achieve digitalization in the supply chain. The second strategy involves blended finance, which leverages the collaboration of investment funds, securities firms, and angel investors to promote the growth of agricultural finance markets and sustainable agriculture. Blended finance entails leveraging preferential capital from the public sector to attract private capital investment, thereby yielding supplementary development advantages [43]. It can manifest in various forms: 1. equity investment: ownership of shares in agricultural-related companies can be purchased through private equity or public markets (also known as “listed stocks”). 2. Debt investment: various forms of credit can be directly provided to agricultural enterprises or through intermediary entities such as banks or non-bank financial institutions [44]. This blended finance approach leverages public funds to steer private investments towards more high-risk ventures within the agricultural sector, thereby fostering the development of sustainable agricultural practices. This may involve investing in alignment with new financing arrangements or investment counterparts, particularly encouraging the involvement of “mainstream” institutional investors like pension funds [45].
Third, we should aim to optimize agricultural and rural resource allocation and promoting rural transformation and upgrading. On one hand, local governments can improve the efficiency of utilizing rural financial resources by establishing rural financial service centers through the use of digital technologies. The efficiency of land resource allocation can be enhanced by utilizing digital technology to establish land factor circulation platforms. On the other hand, there is a need to facilitate the transformation of traditional financial institutions in rural areas. Cooperation can be encouraged between rural financial institutions and major internet companies in urban areas. The following actions should be carried out: utilizing digital technology to establish cross-regional urban–rural financial service networks, introducing excellent financial products from urban areas to rural areas, and implementing innovative upgrades.
Fourth, we should strengthen inter-provincial communication and cooperation and support for the coordinated development of digital economy and agriculture in various regions. This is recommended to formulate corresponding policy documents to encourage developed provinces to support less developed provinces. The digital economy’s driving and overflow effects can be utilized to support comprehensive and coordinated rural development among regions. Additionally, efforts need to be made by the government to strengthen policy enforcement, especially in regions with relatively slower development and lower policy enforcement. As an additional measure, ensuring the diligent implementation of industry assistance policies is essential for the overall success of comprehensive reform.
Fifth, development strategies that are customized, dynamic, and adapted to local conditions should be clarified. The focus should be on leveraging the digital economy to facilitate the superior agricultural development of the northeastern and western regions. Each region must leverage its unique resource endowment and local characteristics to implement tailored development strategies according to the level of agriculture. The eastern region should leverage its advantages to promote agricultural innovation. Midwest and northeastern regions should accelerate to make up for the shortcomings of basic elements in the construction of digital villages.

Author Contributions

Conceptualization, Q.L.; methodology, Q.L.; software, Q.L.; validation, Q.L.; formal analysis, Q.L.; investigation, Q.L.; resources, Q.L.; data curation, Q.L.; writing—original draft preparation, Q.L.; writing—review and editing, Z.L.; visualization, Q.L.; supervision, Z.L.; project administration, Z.L.; funding acquisition, Z.L. All authors have read and agreed to the published version of the manuscript.

Funding

The Fundamental Research Funds for provincial universities in Heilongjiang Province (grant number: 2021-KYYWF-0092, “Research on Financial Innovation Promoting High-Quality Economic Development in Heilongjiang Province”).

Institutional Review Board Statement

Not applicable.

Informed Consent Statement

Not applicable.

Data Availability Statement

The data presented in this study are available on request from the corresponding author.

Conflicts of Interest

The authors declare no conflicts of interest.

References

  1. China’s 2022 Grain Production New Record High, Exceeding 650b Kg Mark for Eight Consecutive Years. Available online: https://www.globaltimes.cn/page/202212/1281648.shtml (accessed on 20 January 2024).
  2. Yao, W.; Sun, Z. The Impact of the Digital Economy on High-Quality Development of Agriculture: A China Case Study. Sustainability 2023, 15, 5745. [Google Scholar] [CrossRef]
  3. West, P.C.; Gerber, J.S.; Engstrom, P.M.; Mueller, N.D.; Brauman, K.A.; Carlson, K.M.; Cassidy, E.S.; Johnston, M.; MacDonald, G.K.; Ray, D.K.; et al. Leverage Points for Improving Global Food Security and the Environment. Science 2014, 345, 325–328. [Google Scholar] [CrossRef] [PubMed]
  4. Tian, T.; Li, L.; Wang, J. The Effect and Mechanism of Agricultural Informatization on Economic Development: Based on a Spatial Heterogeneity Perspective. Sustainability 2022, 14, 3165. [Google Scholar] [CrossRef]
  5. Ding, J.; Liu, W.; Wu, J. The Influence Factors and Mechanism of Rural Informationizational Spatial Effect. Areal Res. Dev. 2012, 31, 151–155. [Google Scholar]
  6. Tapscott, D. The Digital Economy: Promise and Peril in the Age of Networked Intelligence. Choice Rev. Online 1996, 33, 5199. [Google Scholar] [CrossRef]
  7. Xu, W.; Zhou, J.; Liu, C. The Impact of Digital Economy on Urban Carbon Emissions: Based on the Analysis of Spatial Effects. Geogr. Res. 2022, 41, 111–129. [Google Scholar] [CrossRef]
  8. Han, Z.; Zhao, J.; Wu, H. A Study on the Scale Measurement, Disequilibrium and Regional Differences of China’s Inter-Provincial Digital Economy. J. Quant. Tech. Econ. 2021, 38, 164–181. [Google Scholar]
  9. Wang, B.; Tian, J.; Cheng, L.; Hao, F.; Han, H.; Wang, S. Spatial Differentiation of Digital Economy and Its Influencing Factors in China. Sci. Geogr. Sin. 2018, 38, 859–868. [Google Scholar]
  10. Chen, Z.; Wei, Y.; Shi, K.; Zhao, Z.; Wang, C.; Wu, B.; Qiu, B.; Yu, B. The Potential of Nighttime Light Remote Sensing Data to Evaluate the Development of Digital Economy: A Case Study of China at the City Level. Comput. Environ. Urban. Syst. 2022, 92, 101749. [Google Scholar] [CrossRef]
  11. Zhang, Y. The Development Strategy and Main Tasks of the Digital Economy Driving the Industrial Structure to the Middle and High End. Econ. Rev. 2018, 9, 85–91. [Google Scholar] [CrossRef]
  12. Zhang, Y.; Wang, M.; Liu, T. Spatial Effect of Digital Economy on High-Quality Economic Development in China and Its Influence Path. Geogr. Res. 2022, 41, 1826–1844. [Google Scholar] [CrossRef]
  13. Jing, W.; Sun, B. Digital Economy Promotes High-Quality Economic Development: A Theoretical Analysis Framework. Economist 2019, 2, 66–73. [Google Scholar] [CrossRef]
  14. Cao, Z. Research on the New Manufacturing Model to Promote High-Quality Development of China’s Industry under the Background of Digital Economy. Theor. Investig. 2018, 2, 99–104. [Google Scholar] [CrossRef]
  15. Su, Z.; Zheng, Y.; Guo, L. Impact of the Digital Economy on the Carbon Efficiency of the Tourism Industry and Its Threshold Effect. China Popul. Resour. Environ. 2023, 33, 69–79. [Google Scholar] [CrossRef]
  16. Ju, X.; Xue, Y.; Xi, B.; Jin, T.; Xu, Z.; Gao, S. Establishing an Agro-Ecological Compensation Mechanism to Promote Agricultural Green Development in China. J. Resour. Ecol. 2018, 9, 426–433. [Google Scholar] [CrossRef]
  17. Krugman, P. The Myth of Asia’s Miracle. Foreign Aff. 1994, 73, 62–78. [Google Scholar] [CrossRef]
  18. Johnson, D.G. Agriculture and the Wealth of Nations. Am. Econ. Rev. 1997, 87, 1–12. [Google Scholar]
  19. Feng, Y.; Zhong, S.; Li, Q.; Zhao, X.; Dong, X. Ecological Well-Being Performance Growth in China (1994–2014): From Perspectives of Industrial Structure Green Adjustment and Green Total Factor Productivity. J. Clean. Prod. 2019, 236, 117556. [Google Scholar] [CrossRef]
  20. Kalirajan, K.P.; Obwona, M.B.; Zhao, S. A Decomposition of Total Factor Productivity Growth: The Case of Chinese Agricultural Growth before and after Reforms. Am. J. Agric. Econ. 1996, 78, 331–338. [Google Scholar] [CrossRef]
  21. Deng, F.; Jia, S.; Ye, M.; Li, Z. Coordinated Development of High-Quality Agricultural Transformation and Technological Innovation: A Case Study of Main Grain-Producing Areas, China. Environ. Sci. Pollut. Res. 2022, 29, 35150–35164. [Google Scholar] [CrossRef]
  22. Li, H.; Zhang, J.; Luo, S.; He, K. Impact and Mechanism of Agricultural Technology Innovation on Agricultural Development Quality—Empirical Evidence from the Spatial Perspective. RD Manag. 2021, 33, 1–15. [Google Scholar] [CrossRef]
  23. Fan, S.; Pardey, P.G. Research, Productivity, and Output Growth in Chinese Agriculture. J. Dev. Econ. 1997, 53, 115–137. [Google Scholar] [CrossRef]
  24. Zhu, Q.; Bai, J.; Peng, C.; Zhu, C. Do Information Communication Technologies Improve Agricultural Productivity? Chin. Rural. Econ. 2019, 4, 22–40. [Google Scholar]
  25. Qin, Q.; Guo, H.; Zeng, Y. The Mechanism and Countermeasures of Digital Empowerment to Promote Rural Revitalization. J. Jiangsu Univ. Soc. Sci. Ed. 2021, 23, 22–33. [Google Scholar] [CrossRef]
  26. Gao, D.; Lyu, X. Agricultural Total Factor Productivity, Digital Economy and Agricultural High-Quality Development. PLoS ONE 2023, 18, e0292001. [Google Scholar] [CrossRef] [PubMed]
  27. Zhou, Q.; He, A. High Quality Development of the Yellow River Basin Empowered by Digital Economy. Econ. Probl. 2020, 11, 8–17. [Google Scholar] [CrossRef]
  28. Zhou, Q.; Li, X. Digital Economy and High-Quality Agricultural Development Internal Mechanism and Empirical Analysis. Reform. Econ. Syst. 2022, 6, 82–89. [Google Scholar]
  29. Zhang, Y.; Ji, M.; Zheng, X. Digital Economy, Agricultural Technology Innovation, and Agricultural Green Total Factor Productivity. SAGE Open 2023, 13, 21582440231194388. [Google Scholar] [CrossRef]
  30. Wang, S.; Chen, Y. How Does Digital Inclusive Finance Promote the High-Quality Development of Agriculture? On Intermediary and Threshold Mechanism. J. Manag. 2022, 35, 72–87. [Google Scholar] [CrossRef]
  31. Tang, Y.; Chen, M. The Impact of Agricultural Digitization on the High-Quality Development of Agriculture: An Empirical Test Based on Provincial Panel Data. Land 2022, 11, 2152. [Google Scholar] [CrossRef]
  32. Huang, B.; Wu, B.; Barry, M. Geographically and Temporally Weighted Regression for Modeling Spatio-Temporal Variation in House Prices. Int. J. Geogr. Inf. Sci. 2010, 24, 383–401. [Google Scholar] [CrossRef]
  33. Fotheringham, A.S.; Brunsdon, C.; Charlton, M. Geographically Weighted Regression: The Analysis of Spatially Varying Relationships; John Wiley & Sons: Hoboken, NJ, USA, 2003; ISBN 0-470-85525-8. [Google Scholar]
  34. Fotheringham, A.S.; Crespo, R.; Yao, J. Geographical and Temporal Weighted Regression (GTWR): Geographical and Temporal Weighted Regression. Geogr. Anal. 2015, 47, 431–452. [Google Scholar] [CrossRef]
  35. Liu, R.; Guo, T. Construction and Application of the High-quality Development Index——Also on the High-quality Development of Northeast China’s Economy. J. Northeast. Univ. Soc. Sci. 2020, 22, 31–39. [Google Scholar] [CrossRef]
  36. Wang, J.; Shi, M.; Li, Z. Digital Economy Promotes High-Quality Agricultural Development: Internal Mechanism and Empirical Evidence. J. Univ. Financ. Econ. 2023, 36, 78–89. [Google Scholar] [CrossRef]
  37. Xin, L.; An, X. Construction and Empirical Analysis of Agricultural High-Quality Development Evaluation System in China. Econ. Rev. 2019, 5, 109–118. [Google Scholar] [CrossRef]
  38. Ye, F.; Qin, S.; Nisar, N.; Zhang, Q.; Tong, T.; Wang, L. Does Rural Industrial Integration Improve Agricultural Productivity? Implications for Sustainable Food Production. Front. Sustain. Food Syst. 2023, 7, 1191024. [Google Scholar] [CrossRef]
  39. Xiang, W.; Zhu, K.; Teo, B.S.-X.; Zunirah, M.T. Development Experience and Future Prospects of the Integration of Three Rural Industries in China. Asian J. Soc. Sci. Stud. 2022, 7, 98. [Google Scholar] [CrossRef]
  40. Zhang, L.; Wen, T.; Liu, Y. Integrated Development of Rural Industries and Farmers’ Income Growth: Theoretical Mechanism and Empirical Determination. J. Southwest Univ. 2020, 46, 42–56. [Google Scholar]
  41. Liu, T.; Li, J.; Huo, J. Spatial-Temporal Pattern and Influencing Factors of High-Quality Agricultural Development in China. J. Arid. Land Resour. Environ. 2020, 34, 1–8. [Google Scholar] [CrossRef]
  42. Sun, Y.; Tang, X. The Impact of Digital Inclusive Finance on Sustainable Economic Growth in China. Financ. Res. Lett. 2022, 50, 103234. [Google Scholar] [CrossRef]
  43. Attridge, S.; Engen, L. Blended Finance in the Poorest Countries: The Need for a Better Approach; ODI Report: London, UK, 2019. [Google Scholar]
  44. Havemann, T. Landscape Report: Blended Finance for Agriculture; SAFIN: Zürich, Switzerland, 2019. [Google Scholar]
  45. Havemann, T.; Negra, C.; Werneck, F. Blended Finance for Agriculture: Exploring the Constraints and Possibilities of Combining Financial Instruments for Sustainable Transitions. Agric. Hum. Values 2020, 37, 1281–1292. [Google Scholar] [CrossRef] [PubMed]
Figure 1. Value of the digital economy and high-quality development of agriculture, 2011–2021.
Sustainability 16 02814 g001
Figure 2. Spatial distribution of the digital economy.
Sustainability 16 02814 g002
Figure 3. Spatial distribution of the high-quality development of agriculture.
Sustainability 16 02814 g003
Figure 4. LISA diagram of the digital economy, 2009 and 2021.
Sustainability 16 02814 g004
Figure 5. LISA diagram of the high-quality agricultural development, 2009 and 2021.
Sustainability 16 02814 g005
Figure 6. Temporal changes of regression coefficients for the digital economy, 2011–2021.
Sustainability 16 02814 g006
Figure 7. Spatial distribution of regression coefficients for the digital economy.
Sustainability 16 02814 g007
Table 1. System of evaluation indicators for high-quality development of agriculture.
Primary IndicatorsSecondary IndicatorsIndicator DescriptionCharacteristicsWeight of Indicators
Basic developmentGrain yield per unit areaTotal area of grain cultivation/seeding area+0.01509
Level of agricultural mechanizationTotal agricultural machinery power/arable land area+0.04114
Quality improvementLabor productivityThe combined value of animal husbandry, forestry, and agriculture/number of primary industry employees+0.03242
Land productivityTotal value of agricultural production/crop sown area+0.04593
Rural per capita incomeAverage income per person in rural family+0.0441
Index of agricultural industrial structure adjustmentValue of agricultural products/the combined value of animal husbandry, forestry, and agriculture+0.00605
Engel coefficient of rural residentsEngel coefficient of rural populations0.01028
Urban/rural income ratioUrban dwellers’ per capita disposable income/rural dwellers’ per capital disposable income0.01192
Urban/rural consumption ratioUrban dwellers’ per capita consumption expenses/rural dwellers’ per capita consumption expenses0.01106
Integrated developmentThe proportion of added value of the tertiary industryValue added of the tertiary industry/value added of the primary industry+0.31082
Proportion of agricultural product processing industryThe agricultural product manufacturing sector’s operating income/value of agricultural products+0.11777
Proportion of agriculture, forestry, animal husbandryThe combined value of animal husbandry, forestry, and agriculture/the combined value of primary sector+0.07435
New quality developmentDegree of plastic film usage in agricultureAmount of plastic film used in agriculture/crop sown area0.0058
Level of fertilizer usage in agricultureAmount of fertilizer used in agriculture/crop sown area0.00937
Level of pesticide usageQuantity of pesticide applied/crop sown area0.01644
Forest coverage rateForest area/cultivated land area+0.04131
Rate of efficient irrigationArea of efficient irrigation/cultivated land area+0.03811
Shared developmentLocal financial education levelLocal fiscal education expenditure+0.04487
Financial support for agricultureExpenditure on agricultural, forestry, and water affairs+0.03527
Level of agricultural opennessTotal agricultural product import and export trade/GDP+0.08789
Note: “+” indicates a positive indicator, “−” indicates a negative indicator.
Table 2. System of evaluation indicators for the digital economy.
Primary IndicatorsSecondary IndicatorsCharacteristicsWeight of Indicators
Digital infrastructurePorts available for broadband internet connectivity (in tens of thousands)+0.02861
Long-distance optical cable length (in ten thousand kilometers)+0.01764
Rate of mobile phone ownership per one hundred individuals+0.01178
Domain name count (in ten thousands)+0.06488
Digital industrializationTotal postal business volume (in CNY 100 millions)+0.09503
Total telecommunications business volume (in CNY ten billions)+0.05837
Scale of software product revenue+0.09107
Number of workers in the information service sector (in ten thousands)+0.05252
Expenditure on research and development (in CNY ten billions)+0.48609
Number of patent applications (in thousands)+0.06043
Inclusive digital financeExtent of inclusive digital finance coverage+0.01268
Depth of inclusive digital finance usage+0.01113
Degree of digitization of inclusive digital finance+0.00978
Note: “+” indicates a positive indicator.
Table 3. Global Moran index.
YearHigh-Quality Agricultural DevelopmentDigital Economy
Moran’s IZ Valuep ValueMoran’s IZ Valuep Value
20110.3505.1320.0000.2043.2400.001
20120.3405.0800.0000.2603.9810.000
20130.3855.6280.0000.2125.1080.000
20140.3745.4800.0000.1983.2100.001
20150.3745.5990.0000.1923.1510.002
20160.3605.5290.0000.2624.0780.000
20170.3355.3300.0000.3415.0930.000
20180.3225.1770.0000.2694.2370.000
20190.3175.1580.0000.2153.4920.000
20200.3215.2200.0000.1352.3890.017
20210.3355.4170.0000.1863.0610.002
Table 4. Multicollinearity test and variable unit root test.
VariablesVIF1/VIFLLC TestIPS Test
(Level)
IPS Test
(1st Difference)
ng--−12.161 ***−3.7503 ***−7.3356 ***
dig1.830.545−13.939 ***−5.7094 ***−6.7229 ***
ur2.600.384−5.772 ***−2.4742 ***−3.3516 ***
edu1.770.565−13.367 ***−4.8112 ***−7.9699 ***
jgh1.610.622−6.073 ***−0.4750−4.8186 ***
open1.900.525−4.196 ***0.9432−5.9407 ***
old1.240.806−13.104 ***−4.3520 ***−7.5757 ***
Mean VIF1.83--
Note: *** represents significance at the 1% level.
Table 5. Regression model selection test.
ParametersOLSTWRGWRGTWR
R-squared0.7630.8450.9240.961
Adjusted R-squared-0.8420.9220.960
AICc−746.374−846.323−1025.1−1153.03
RSS1.9291.2700.6240.319
Bandwidth-0.1960.1150.115
Note: bandwidth is the optimal bandwidth of the model, controlling its smoothing level.
Table 6. Robustness test results.
Parametersdig1dig2dig3
OLSGTWROLSGTWROLSGTWR
R-squared0.7690.9760.7530.9450.7720.974
Adjusted R-squared 0.975 0.944 0.973
AICc−1257.9−1770.6−1235.9−1616.12−1260.71735.5
RSS0.4090.0420.4370.0980.4060.047
Bandwidth 0.011 0.017 0.012
Disclaimer/Publisher’s Note: The statements, opinions and data contained in all publications are solely those of the individual author(s) and contributor(s) and not of MDPI and/or the editor(s). MDPI and/or the editor(s) disclaim responsibility for any injury to people or property resulting from any ideas, methods, instructions or products referred to in the content.

