
Moderating the Effect of the Multidimensional Poverty Index on the Relationship between Sustainable Governance Indicators and Worldwide Governance Indicators


Abstract
:1. Introduction
2. Materials and Methods
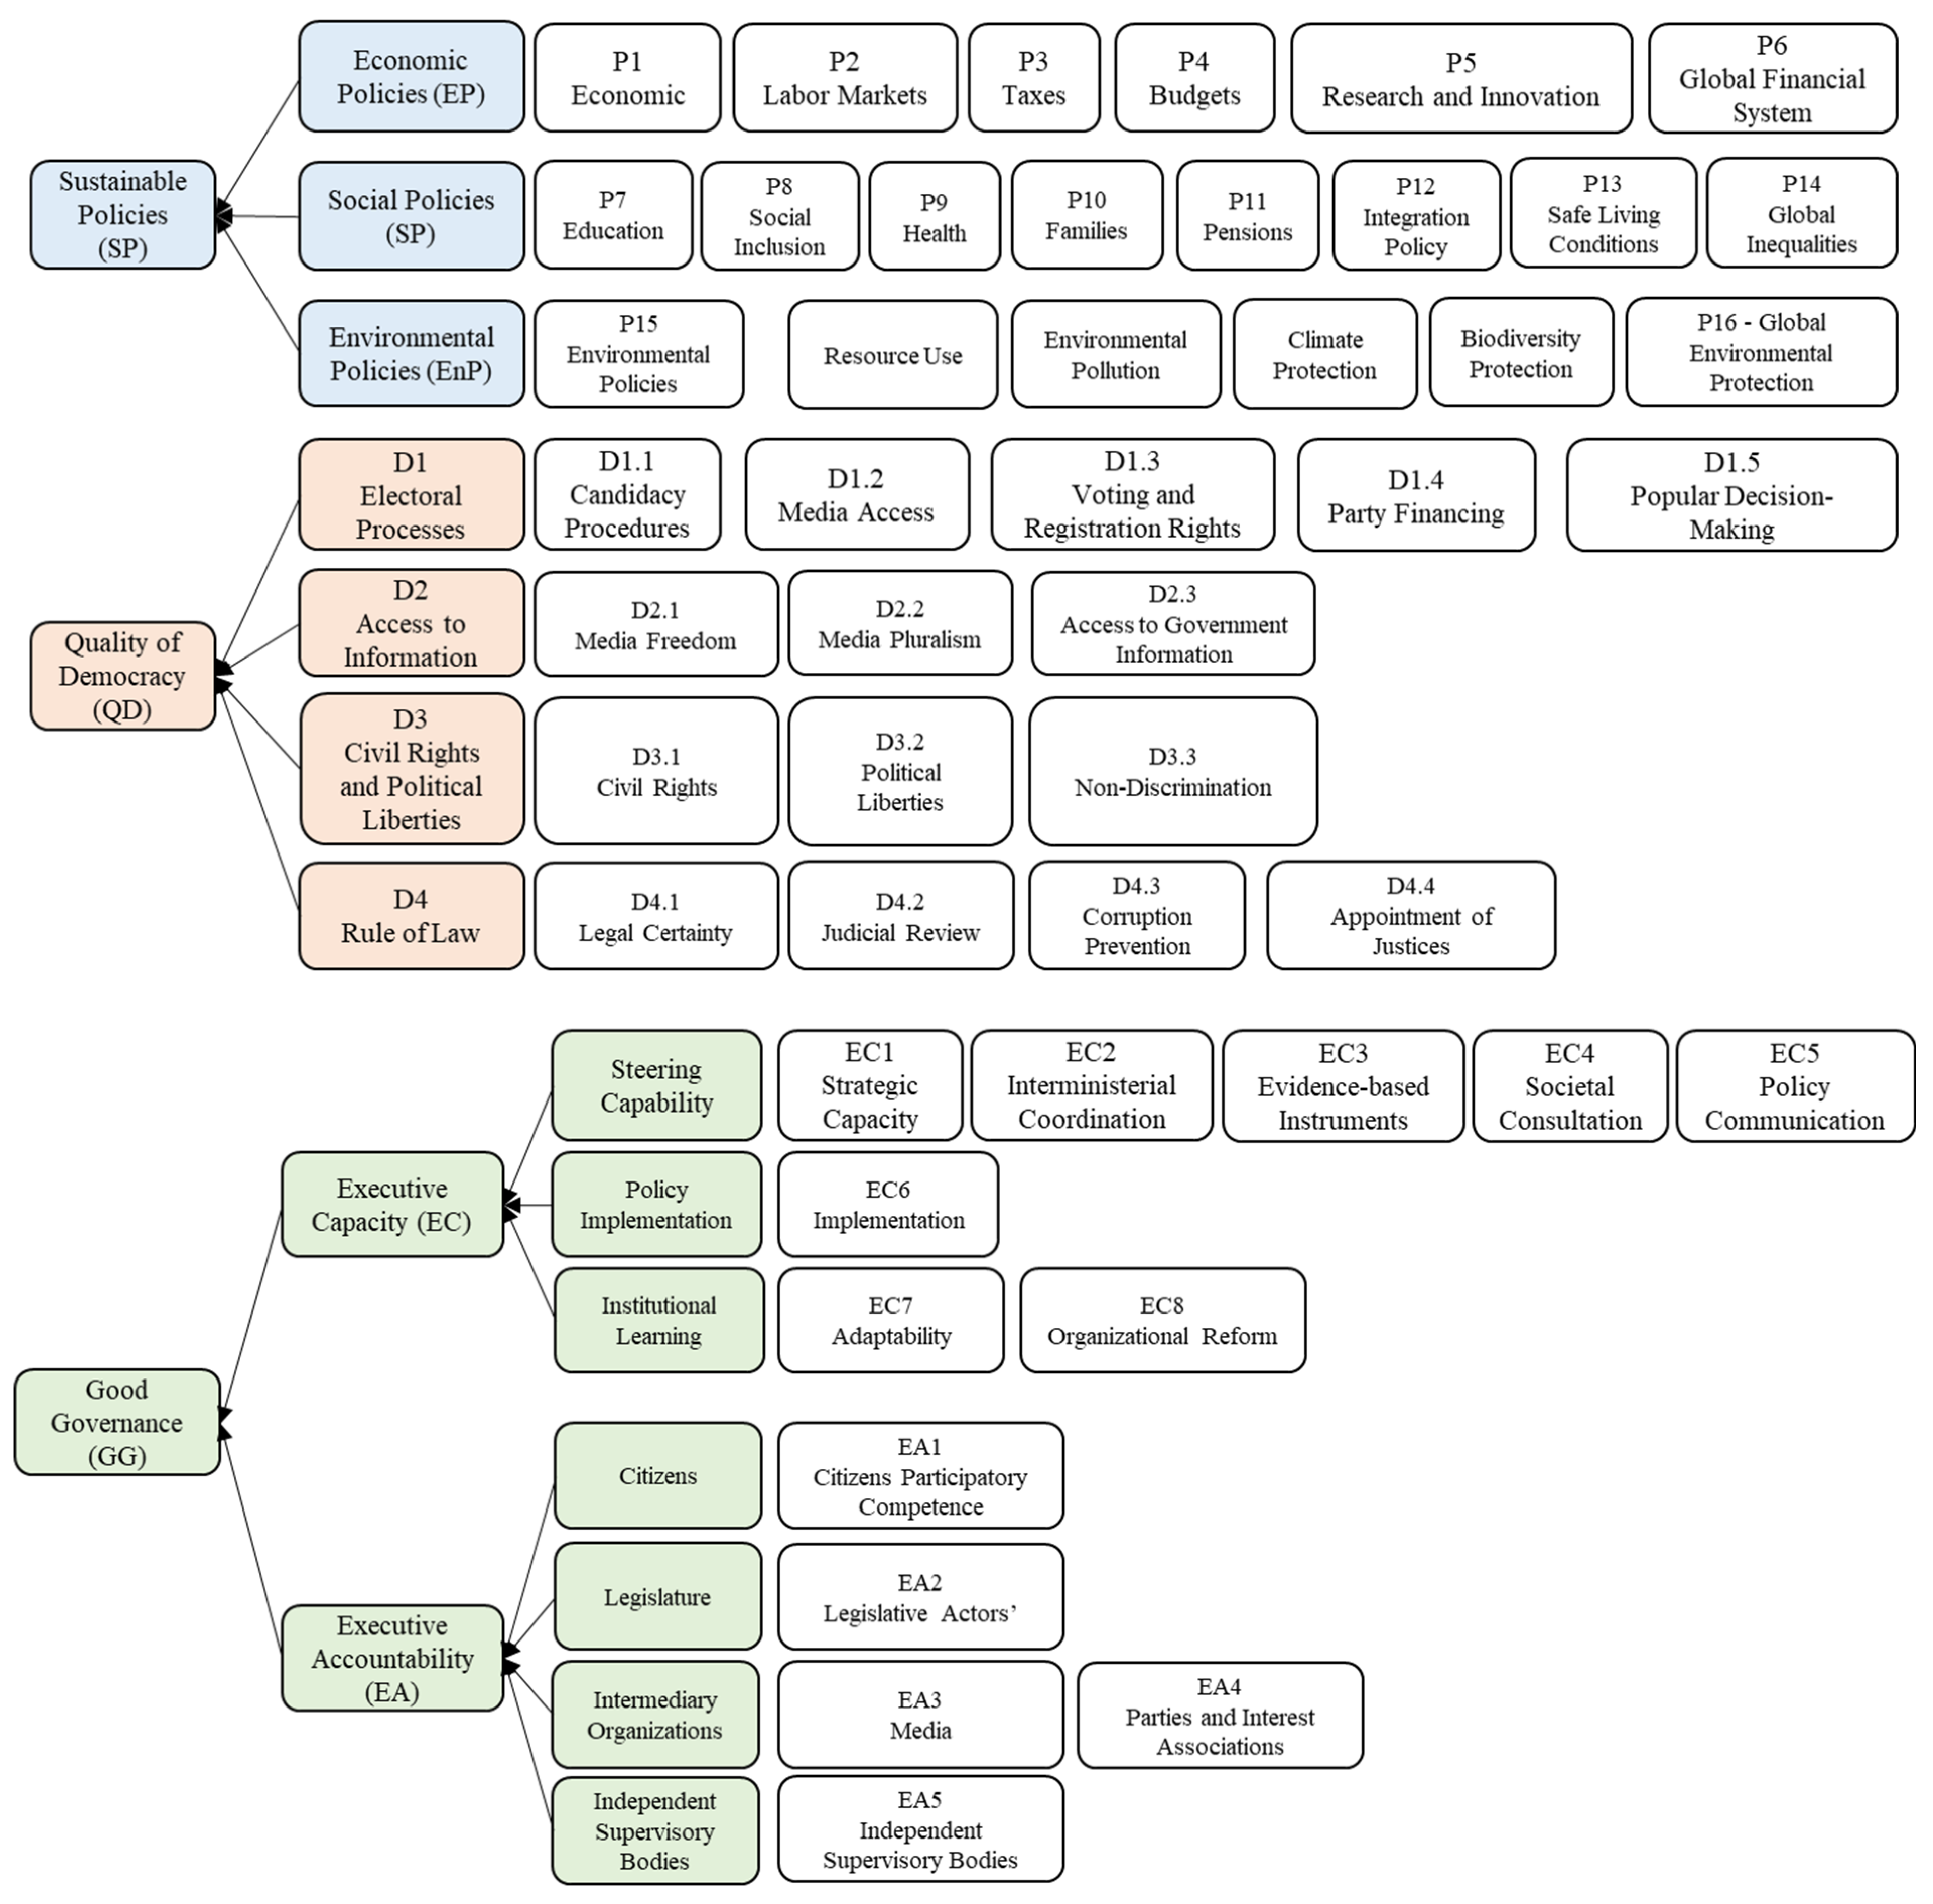
2.1. Sustainable Governance Indicators (SGIs)
2.1.1. Economic Policies (EP)
2.1.2. Environmental Policies (EnPs)
2.1.3. Social Policies (SPs)
2.1.4. Quality of Democracy (QD)
2.1.5. Good Governance (GG)
2.1.6. Score Sustainable Governance Indicators (SGIs)
2.2. Worldwide Governance Indicators (WGIs)
2.3. Multidimensional Poverty Index (MPI)
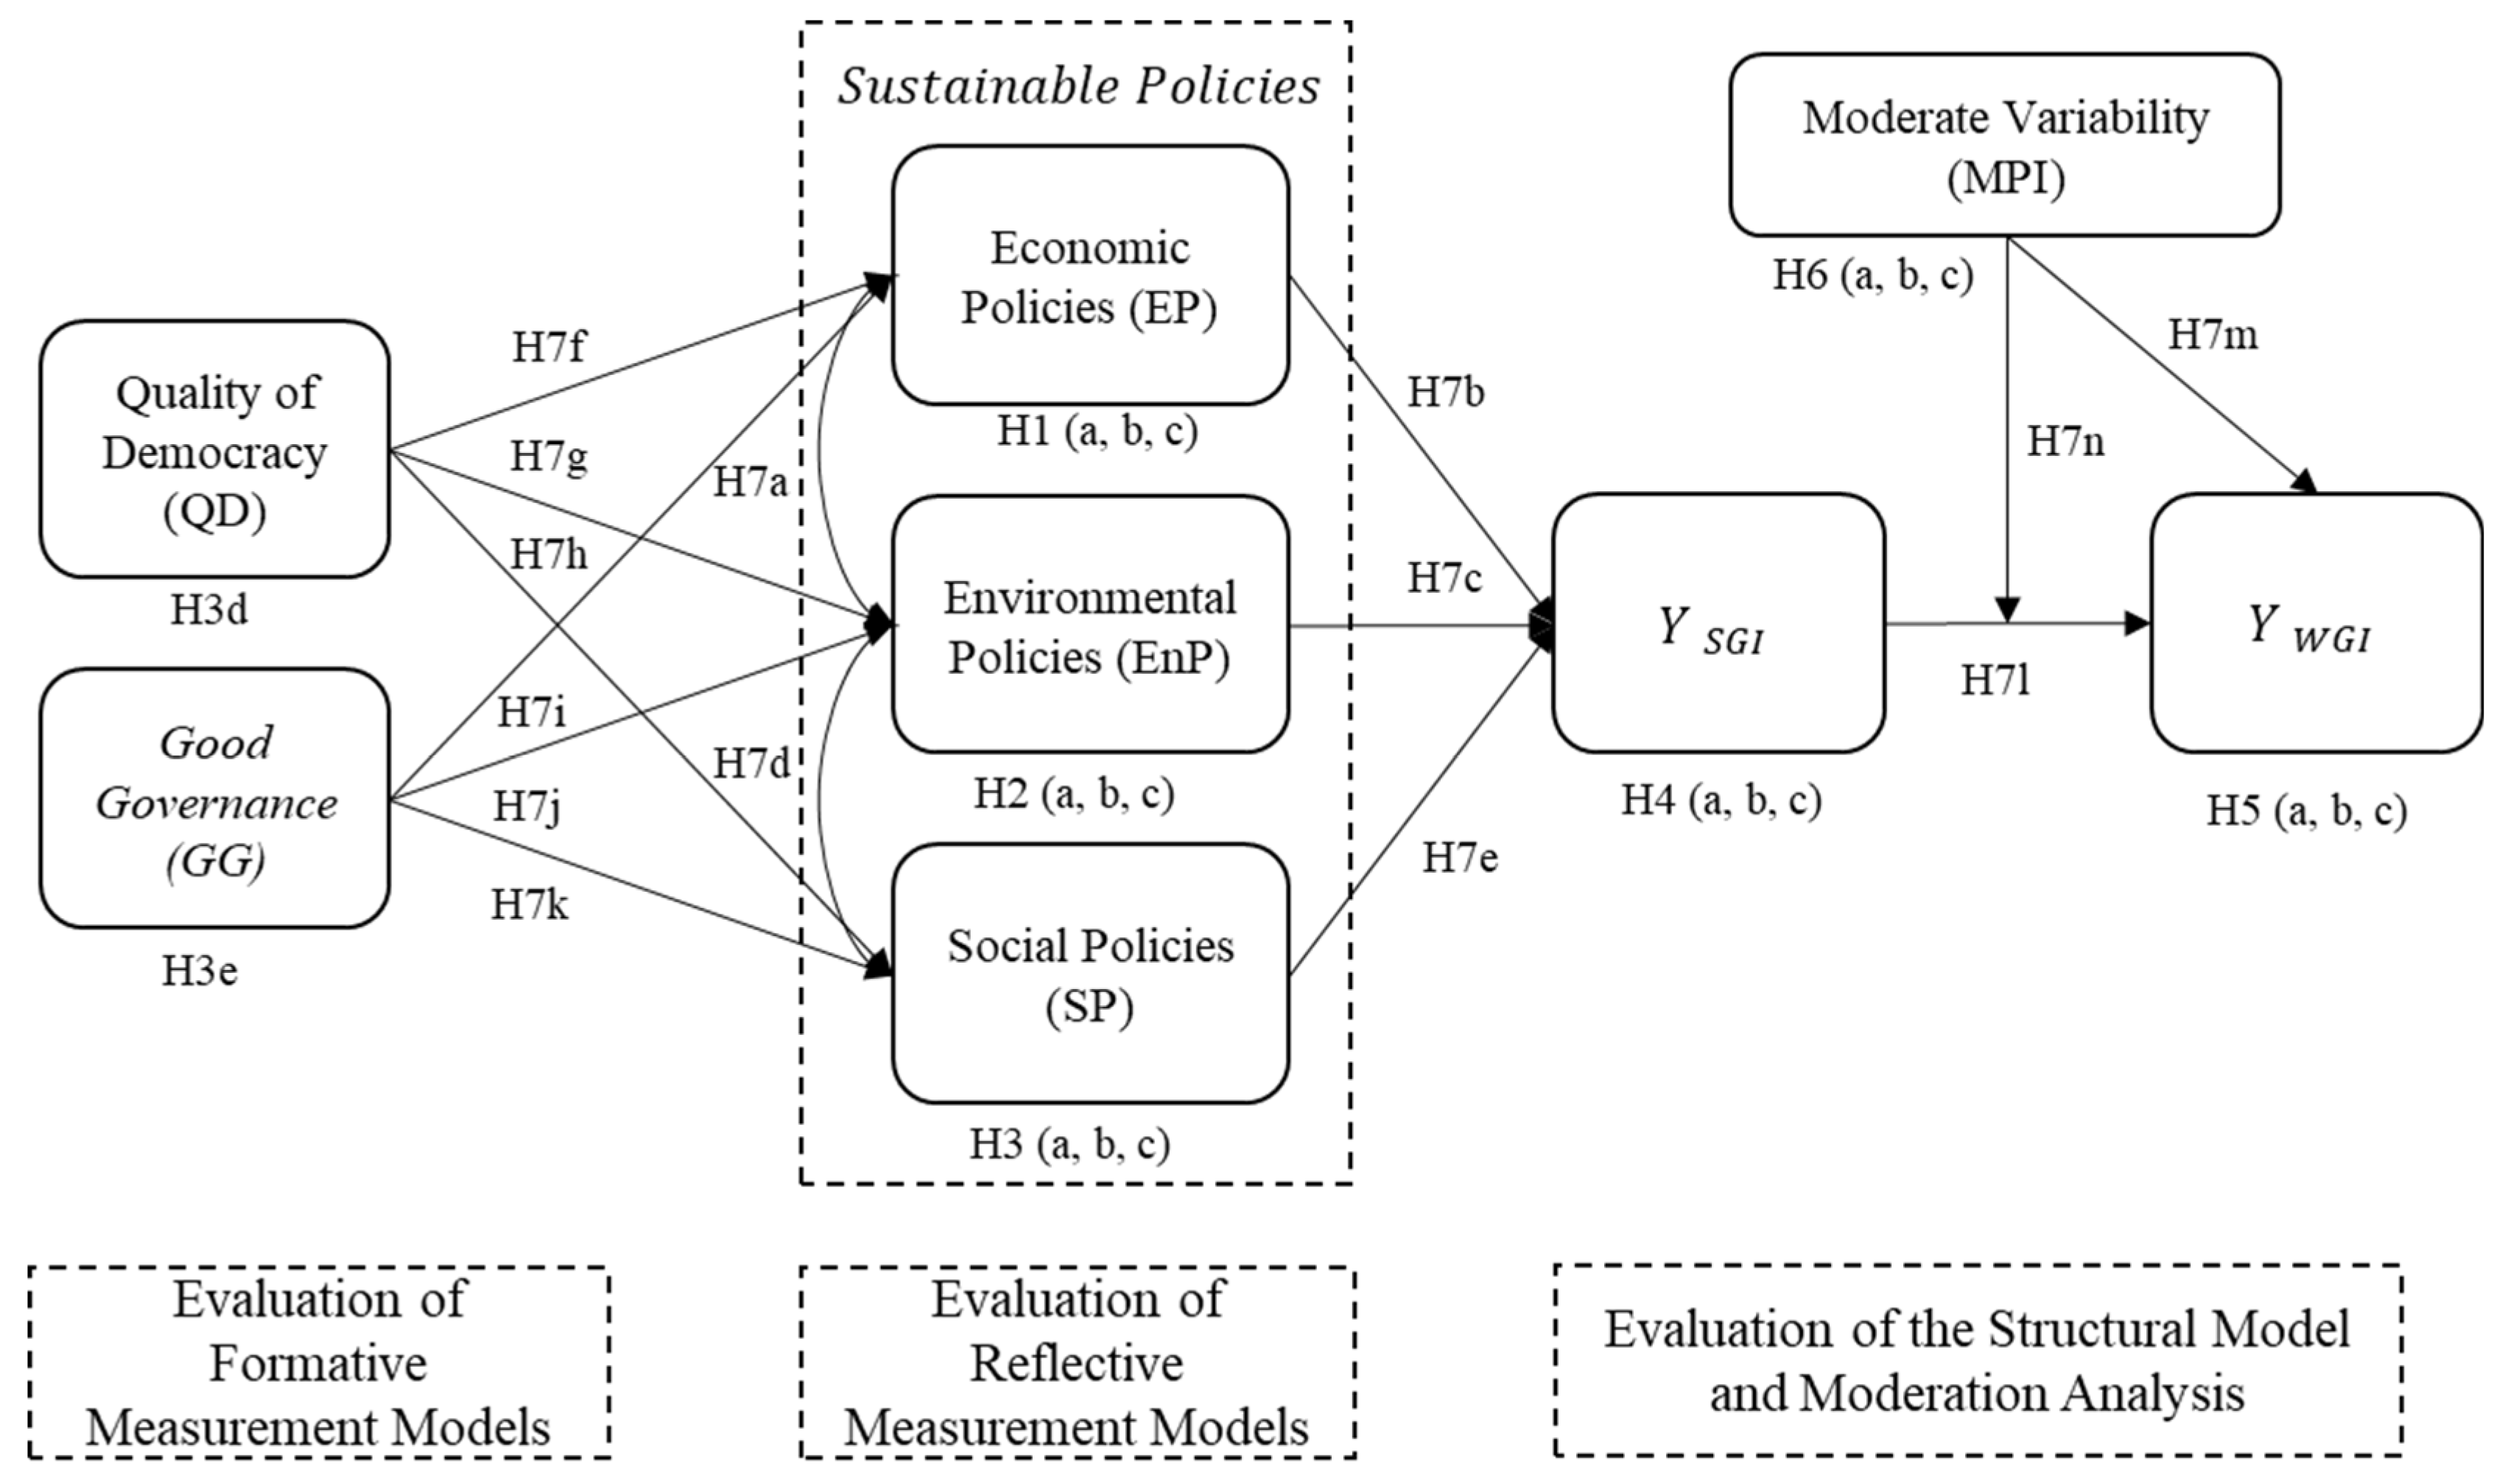
3. Data and Method
4. Analysis of Data
5. Results
5.1. Reflective Measurement Model Analysis
5.2. Analysis of the Formative Measurement Model
5.3. Structural Model Analysis
5.4. Analysis of the Moderating Variable
5.5. Bootstraping PLS SEM Método Básico SMARTPLS
6. Discussion
7. Conclusions
8. Recommendations
Author Contributions
Funding
Institutional Review Board Statement
Informed Consent Statement
Data Availability Statement
Acknowledgments
Conflicts of Interest
Appendix A

| N° | OECD Countries | Sustainable Governance Indicators (SGIs) | World Governance Indicators (WGIs) | ||||||||||
|---|---|---|---|---|---|---|---|---|---|---|---|---|---|
| Susp | EP | SP | EnP | QD | GG | wgi_1 | wgi_2 | wgi_3 | wgi_4 | wgi_5 | wgi_6 | ||
| 1 | Australia | 5.73 | 6.02 | 6.4 | 4.7 | 7.30 | 7.09 | 93.24 | 81.60 | 92.92 | 99.53 | 91.04 | 95.28 |
| 2 | Austria | 6.34 | 6.40 | 6.3 | 6.3 | 7.27 | 6.73 | 94.20 | 68.87 | 91.51 | 87.26 | 95.75 | 84.91 |
| 3 | Belgium | 6.02 | 6.15 | 6.5 | 5.4 | 7.34 | 6.43 | 92.75 | 65.57 | 84.91 | 86.79 | 88.21 | 89.62 |
| 4 | Bulgaria | 5.27 | 5.57 | 4.4 | 5.8 | 5.39 | 5.29 | 57.00 | 52.36 | 42.92 | 61.79 | 49.53 | 50.00 |
| 5 | Canada | 6.53 | 6.57 | 7.3 | 5.8 | 8.04 | 8.05 | 95.65 | 73.58 | 94.34 | 95.75 | 92.92 | 93.40 |
| 6 | Chile | 5.64 | 5.76 | 5.1 | 6.0 | 6.59 | 6.05 | 78.26 | 51.42 | 69.34 | 81.13 | 72.64 | 80.66 |
| 7 | Croatia | 5.54 | 5.32 | 5.1 | 6.3 | 5.63 | 5.15 | 66.18 | 66.98 | 70.28 | 68.40 | 61.32 | 59.91 |
| 8 | Cyprus | 5.04 | 5.03 | 5.5 | 4.6 | 5.65 | 4.57 | 73.91 | 58.96 | 75.47 | 75.47 | 68.87 | 66.04 |
| 9 | Czechia | 5.78 | 6.04 | 6.1 | 5.2 | 7.04 | 6.26 | 80.68 | 75.00 | 81.13 | 88.68 | 83.49 | 74.53 |
| 10 | Denmark | 7.87 | 7.84 | 7.7 | 8.1 | 8.90 | 8.58 | 98.07 | 77.36 | 98.58 | 98.58 | 99.53 | 100.00 |
| 11 | Estonia | 6.96 | 7.12 | 6.9 | 6.9 | 8.86 | 7.37 | 87.92 | 71.70 | 89.62 | 92.92 | 89.62 | 91.04 |
| 12 | Finland | 7.41 | 7.22 | 7.3 | 7.8 | 9.15 | 8.73 | 98.55 | 79.72 | 96.70 | 97.17 | 100.00 | 99.53 |
| 13 | France | 6.91 | 6.42 | 6.8 | 7.5 | 7.27 | 6.92 | 85.99 | 56.13 | 83.02 | 85.38 | 85.38 | 85.38 |
| 14 | Germany | 7.30 | 7.29 | 7.1 | 7.5 | 8.73 | 7.78 | 94.69 | 67.45 | 88.21 | 92.45 | 91.98 | 95.75 |
| 15 | Greece | 4.70 | 4.26 | 5.1 | 4.7 | 7.02 | 6.40 | 76.81 | 49.06 | 66.51 | 67.45 | 59.91 | 56.60 |
| 16 | Hungary | 5.11 | 5.12 | 5.0 | 5.3 | 3.22 | 4.24 | 59.90 | 67.92 | 68.87 | 64.62 | 63.21 | 51.42 |
| 17 | Iceland | 6.09 | 6.02 | 7.1 | 5.2 | 6.17 | 6.67 | 95.17 | 95.28 | 93.87 | 88.21 | 95.28 | 91.51 |
| 18 | Ireland | 6.74 | 7.00 | 6.8 | 6.4 | 8.27 | 7.41 | 96.14 | 78.77 | 93.40 | 95.28 | 91.51 | 93.87 |
| 19 | Israel | 5.84 | 6.96 | 6.0 | 4.6 | 6.50 | 6.67 | 67.63 | 11.79 | 85.38 | 86.32 | 81.13 | 78.77 |
| 20 | Italy | 6.09 | 5.66 | 6.0 | 6.6 | 7.23 | 6.61 | 82.61 | 58.49 | 66.98 | 68.87 | 58.49 | 68.87 |
| 21 | Japan | 5.89 | 5.55 | 6.0 | 6.2 | 5.54 | 6.53 | 80.19 | 86.79 | 96.23 | 91.51 | 92.45 | 90.57 |
| 22 | Latvia | 6.20 | 6.45 | 5.2 | 6.9 | 8.00 | 6.60 | 43.48 | 37.26 | 44.34 | 38.21 | 39.62 | 47.17 |
| 23 | Lithuania | 6.49 | 6.59 | 6.1 | 6.8 | 8.04 | 7.16 | 81.16 | 69.34 | 79.72 | 87.74 | 83.02 | 76.42 |
| 24 | Luxembourg | 7.42 | 7.07 | 7.7 | 7.5 | 7.62 | 7.57 | 97.10 | 86.32 | 97.64 | 98.11 | 98.58 | 96.23 |
| 25 | Malta | 5.71 | 6.37 | 5.7 | 5.1 | 5.80 | 6.09 | 83.57 | 80.66 | 76.89 | 73.11 | 76.42 | 61.79 |
| 26 | Mexico | 4.65 | 4.94 | 3.8 | 5.2 | 5.13 | 5.74 | 42.03 | 21.70 | 42.45 | 46.70 | 20.75 | 17.45 |
| 27 | The Netherlands | 6.52 | 6.94 | 6.6 | 6.0 | 6.63 | 6.15 | 97.58 | 71.23 | 95.28 | 96.70 | 93.40 | 96.70 |
| 28 | New Zealand | 6.55 | 6.60 | 7.0 | 6.1 | 8.24 | 7.67 | 99.52 | 96.23 | 89.15 | 99.06 | 96.70 | 99.06 |
| 29 | Norway | 7.65 | 7.04 | 7.9 | 8.0 | 8.91 | 8.63 | 100.00 | 76.42 | 98.11 | 91.98 | 98.11 | 98.11 |
| 30 | Poland | 5.17 | 5.76 | 5.1 | 4.6 | 4.61 | 5.44 | 65.22 | 61.79 | 61.79 | 74.53 | 64.15 | 68.40 |
| 31 | Portugal | 6.17 | 5.99 | 6.2 | 6.3 | 7.56 | 6.25 | 89.86 | 75.94 | 80.19 | 75.00 | 83.96 | 75.94 |
| 32 | Romania | 5.10 | 4.91 | 4.5 | 5.9 | 4.88 | 4.68 | 63.77 | 60.85 | 53.30 | 63.68 | 62.26 | 55.66 |
| 33 | Slovakia | 5.64 | 5.56 | 5.4 | 6.0 | 6.68 | 5.27 | 75.36 | 59.91 | 63.68 | 76.89 | 70.28 | 60.38 |
| 34 | Slovenia | 6.39 | 5.97 | 6.6 | 6.6 | 6.74 | 6.29 | 77.78 | 70.75 | 80.66 | 73.58 | 82.55 | 78.30 |
| 35 | Republic of Korea | 6.03 | 6.79 | 6.1 | 5.2 | 6.76 | 6.57 | 0.00 | 30.19 | 7.08 | 0.00 | 4.72 | 2.36 |
| 36 | Spain | 6.51 | 5.80 | 6.7 | 7.0 | 7.25 | 7.03 | 79.71 | 53.30 | 77.83 | 75.94 | 77.36 | 75.00 |
| 37 | Sweden | 7.98 | 7.66 | 7.5 | 8.8 | 9.29 | 8.90 | 96.62 | 80.19 | 94.81 | 96.23 | 93.87 | 97.64 |
| 38 | Switzerland | 7.32 | 7.47 | 7.0 | 7.5 | 8.81 | 7.57 | 99.03 | 92.45 | 99.53 | 94.34 | 97.64 | 97.17 |
| 39 | Turkey | 4.78 | 5.04 | 5.2 | 4.1 | 2.79 | 4.12 | 23.19 | 13.68 | 43.87 | 43.40 | 36.79 | 34.91 |
| 40 | United Kingdom | 6.97 | 6.47 | 6.8 | 7.6 | 7.33 | 7.88 | 89.37 | 62.26 | 85.85 | 93.40 | 89.15 | 92.92 |
| 41 | United States | 5.44 | 5.97 | 5.9 | 4.5 | 7.38 | 7.38 | 72.95 | 45.28 | 86.79 | 91.04 | 88.68 | 82.55 |
| N° | OECD Countries | Multidimensional Poverty Index (MPI) | ||||
|---|---|---|---|---|---|---|
| mpi_1 | mpi_2 | mpi_3 | mpi_4 | mpi_5 | ||
| 1 | Australia | 5.0 | 5.9 | 7 | 5.8 | 2.5 |
| 2 | Austria | 6.3 | 6.1 | 7 | 6.1 | 7.4 |
| 3 | Belgium | 7.5 | 7.0 | 8 | 7.9 | 7.5 |
| 4 | Bulgaria | 4.1 | 4.6 | 6 | 4.3 | 3.5 |
| 5 | Canada | 5.3 | 4.6 | 8 | 6.4 | 6.1 |
| 6 | Chile | 3.4 | 6.9 | 5 | 3.2 | 4.4 |
| 7 | Croatia | 5.0 | 5.2 | 5 | 6.4 | 3.4 |
| 8 | Cyprus | 7.1 | 5.7 | 4 | 7.2 | 7.1 |
| 9 | Czechia | 8.2 | 5.3 | 6 | 8.0 | 8.5 |
| 10 | Denmark | 7.2 | 7.7 | 9 | 8.1 | 9.2 |
| 11 | Estonia | 5.1 | 4.2 | 10 | 6.6 | 4.7 |
| 12 | Finland | 7.9 | 7.7 | 8 | 9.0 | 8.5 |
| 13 | France | 6.7 | 8.0 | 10 | 6.8 | 8.1 |
| 14 | Germany | 5.9 | 5.4 | 8 | 6.9 | 6.3 |
| 15 | Greece | 5.3 | 5.7 | 5 | 5.3 | 8.2 |
| 16 | Hungary | 7.1 | 4.7 | 5 | 7.4 | 8.0 |
| 17 | Iceland | 8.2 | 8.0 | 10 | 8.4 | 8.9 |
| 18 | Ireland | 7.3 | 6.1 | 7 | 7.8 | 8.5 |
| 19 | Israel | 3.0 | 4.1 | 7 | 3.0 | 4.0 |
| 20 | Italy | 4.6 | 9.0 | 5 | 4.7 | 6.8 |
| 21 | Japan | 3.7 | 7.1 | 5 | 5.6 | 3.7 |
| 22 | Latvia | 3.5 | 4.2 | 7 | 6.6 | 1.0 |
| 23 | Lithuania | 4.8 | 4.3 | 7 | 6.0 | 3.4 |
| 24 | Luxembourg | 6.3 | 7.1 | 9 | 6.2 | 8.8 |
| 25 | Malta | 6.7 | 5.7 | 7 | 6.4 | 7.1 |
| 26 | Mexico | 3.3 | 5.6 | 4 | 3.7 | 3.7 |
| 27 | The Netherlands | 7.2 | 8.3 | 6 | 7.6 | 8.5 |
| 28 | New Zealand | 5.0 | 7.8 | 8 | 5.3 | 4.7 |
| 29 | Norway | 7.1 | 7.7 | 9 | 7.5 | 9.5 |
| 30 | Poland | 6.5 | 5.1 | 5 | 7.5 | 7.0 |
| 31 | Portugal | 5.9 | 8.9 | 7 | 5.9 | 7.1 |
| 32 | Romania | 3.4 | 4.5 | 5 | 3.1 | 5.2 |
| 33 | Slovakia | 7.1 | 5.8 | 4 | 6.2 | 8.8 |
| 34 | Slovenia | 7.5 | 5.5 | 9 | 8.4 | 7.1 |
| 35 | Republic of Korea | 3.8 | 5.8 | 5 | 6.9 | 1.0 |
| 36 | Spain | 4.1 | 7.2 | 7 | 3.5 | 6.6 |
| 37 | Sweden | 6.4 | 9.1 | 10 | 6.5 | 8.4 |
| 38 | Switzerland | 6.1 | 7.5 | 4 | 6.3 | 4.9 |
| 39 | Turkey | 3.6 | 9.7 | 4 | 2.6 | 6.0 |
| 40 | United Kingdom | 5.0 | 5.2 | 7 | 5.5 | 5.1 |
| 41 | United States | 2.8 | 3.7 | 7 | 3.4 | 2.7 |
| Code | Median | Observed Min | Observed Max | Standard Deviation | Excess Kurtosis | Skewness | Number of Observations Used | Cramér-von Mises Test Statistic | Cramér-Von Mises p Value |
|---|---|---|---|---|---|---|---|---|---|
| D1 | 0.025 | −0.960 | 1.241 | 0.452 | 0.346 | 0.160 | 41.000 | 0.065 | 0.318 |
| D2 | −0.004 | −0.649 | 0.760 | 0.300 | 0.451 | 0.198 | 41.000 | 0.046 | 0.555 |
| D3 | 0.003 | −0.750 | 0.343 | 0.247 | 1.876 | −1.164 | 41.000 | 0.100 | 0.107 |
| D4 | −0.030 | −0.665 | 0.696 | 0.367 | −0.585 | 0.276 | 41.000 | 0.075 | 0.231 |
| EA1 | 0.066 | −1.347 | 0.803 | 0.503 | −0.031 | −0.619 | 41.000 | 0.071 | 0.262 |
| EA2 | −0.014 | −1.641 | 1.800 | 0.783 | −0.429 | −0.034 | 41.000 | 0.069 | 0.285 |
| EA3 | 0.039 | −1.053 | 0.963 | 0.455 | 0.019 | −0.220 | 41.000 | 0.031 | 0.821 |
| EA4 | 0.196 | −1.386 | 1.541 | 0.694 | −0.460 | −0.043 | 41.000 | 0.078 | 0.215 |
| EA5 | 0.011 | −1.726 | 1.509 | 0.689 | 0.201 | −0.271 | 41.000 | 0.036 | 0.753 |
| EC1 | 0.080 | −1.367 | 1.688 | 0.755 | −0.756 | 0.046 | 41.000 | 0.053 | 0.453 |
| EC2 | 0.127 | −1.770 | 1.471 | 0.866 | −1.074 | −0.108 | 41.000 | 0.084 | 0.179 |
| EC3 | 0.015 | −1.930 | 1.442 | 0.826 | −0.090 | −0.444 | 41.000 | 0.046 | 0.564 |
| EC4 | −0.048 | −0.970 | 1.031 | 0.559 | −1.170 | 0.003 | 41.000 | 0.102 | 0.103 |
| EC5 | −0.003 | −1.860 | 1.271 | 0.798 | −0.288 | −0.323 | 41.000 | 0.031 | 0.826 |
| EC6 | 0.034 | −1.038 | 0.905 | 0.485 | −0.507 | −0.104 | 41.000 | 0.028 | 0.872 |
| EC7 | 0.022 | −1.896 | 0.892 | 0.590 | 0.840 | −0.750 | 41.000 | 0.105 | 0.092 |
| EC8 | −0.144 | −2.121 | 1.723 | 0.784 | 0.270 | 0.078 | 41.000 | 0.068 | 0.293 |
| EP | −0.005 | −1.312 | 1.110 | 0.432 | 1.593 | −0.126 | 41.000 | 0.052 | 0.471 |
| EnP | 0.195 | −1.189 | 0.896 | 0.568 | −0.732 | −0.502 | 41.000 | 0.146 | 0.026 |
| GG | 0.010 | −0.591 | 0.941 | 0.375 | 0.083 | 0.573 | 41.000 | 0.061 | 0.359 |
| P1 | −0.034 | −1.176 | 1.522 | 0.547 | 0.643 | 0.467 | 41.000 | 0.122 | 0.053 |
| P10 | −0.073 | −1.844 | 1.292 | 0.657 | 0.472 | −0.143 | 41.000 | 0.090 | 0.147 |
| P11 | −0.019 | −1.396 | 1.742 | 0.631 | 0.323 | 0.131 | 41.000 | 0.016 | 0.990 |
| P12 | −0.105 | −1.430 | 1.432 | 0.727 | −0.697 | −0.010 | 41.000 | 0.035 | 0.770 |
| P13 | 0.060 | −2.239 | 1.491 | 0.694 | 1.554 | −0.756 | 41.000 | 0.067 | 0.296 |
| P14 | −0.021 | −1.162 | 2.589 | 0.720 | 3.015 | 1.283 | 41.000 | 0.149 | 0.024 |
| P15 | −0.051 | −0.602 | 0.917 | 0.336 | 0.267 | 0.618 | 41.000 | 0.079 | 0.204 |
| P16 | 0.039 | −1.269 | 0.781 | 0.461 | 0.307 | −0.698 | 41.000 | 0.067 | 0.299 |
| P2 | 0.099 | −1.587 | 1.279 | 0.658 | −0.328 | −0.214 | 41.000 | 0.032 | 0.817 |
| P3 | 0.070 | −1.201 | 1.670 | 0.572 | 1.362 | 0.240 | 41.000 | 0.193 | 0.006 |
| P4 | −0.054 | −2.158 | 1.571 | 0.847 | 0.456 | −0.548 | 41.000 | 0.041 | 0.648 |
| P5 | −0.020 | −1.210 | 1.532 | 0.710 | −0.584 | 0.336 | 41.000 | 0.051 | 0.495 |
| P6 | 0.044 | −2.102 | 1.193 | 0.659 | 1.211 | −0.611 | 41.000 | 0.048 | 0.528 |
| P7 | −0.025 | −1.346 | 1.116 | 0.533 | 0.081 | 0.088 | 41.000 | 0.025 | 0.904 |
| P8 | 0.052 | −1.413 | 1.337 | 0.589 | 0.622 | −0.304 | 41.000 | 0.095 | 0.126 |
| P9 | 0.006 | −1.033 | 1.080 | 0.545 | −0.884 | 0.006 | 41.000 | 0.034 | 0.778 |
| QD | 0.055 | −1.148 | 1.072 | 0.436 | 0.862 | −0.453 | 41.000 | 0.062 | 0.345 |
| SP | 0.022 | −1.083 | 1.021 | 0.429 | 0.519 | −0.155 | 41.000 | 0.027 | 0.881 |
| SusP | 0.008 | −0.511 | 0.405 | 0.187 | 1.185 | −0.683 | 41.000 | 0.066 | 0.305 |
| mpi_1 | −0.092 | −0.619 | 1.010 | 0.439 | −0.428 | 0.637 | 41.000 | 0.112 | 0.075 |
| mpi_2 | −0.221 | −1.387 | 2.598 | 0.905 | 0.237 | 0.753 | 41.000 | 0.094 | 0.132 |
| mpi_3 | 0.029 | −1.556 | 1.613 | 0.773 | −0.463 | −0.114 | 41.000 | 0.049 | 0.518 |
| mpi_4 | 0.146 | −1.490 | 1.203 | 0.645 | −0.455 | −0.398 | 41.000 | 0.058 | 0.393 |
| mpi_5 | 0.040 | −1.426 | 1.086 | 0.574 | 0.330 | −0.562 | 41.000 | 0.056 | 0.424 |
| wgi_1 | 0.007 | −0.627 | 0.582 | 0.238 | 1.051 | 0.038 | 41.000 | 0.063 | 0.335 |
| wgi_2 | 0.032 | −2.348 | 1.259 | 0.599 | 4.630 | −1.261 | 41.000 | 0.061 | 0.354 |
| wgi_3 | 0.028 | −0.628 | 0.717 | 0.239 | 1.743 | −0.058 | 41.000 | 0.147 | 0.025 |
| wgi_4 | 0.091 | −1.135 | 0.631 | 0.300 | 4.189 | −1.376 | 41.000 | 0.179 | 0.009 |
| wgi_5 | −0.004 | −0.455 | 0.518 | 0.178 | 2.087 | 0.227 | 41.000 | 0.132 | 0.039 |
| wgi_6 | 0.021 | −0.613 | 0.479 | 0.232 | 0.235 | −0.209 | 41.000 | 0.033 | 0.795 |
References
- Brusis, M.; Siegmund, J. Designing Sustainable Governance Indicators 2011: Criteria and Methodology. Bertelsmann Stift. 2011, 1, 2–25. [Google Scholar]
- ONU. Organización de las Naciones Unidas: Objetivos de Desarrollo Sostenible. 2023. Available online: https://www.un.org/sustainabledevelopment/es/poverty/ (accessed on 2 September 2023).
- SGI. Sustainable Governance Indicators. 2022. Available online: https://www.sgi-network.org/2022/ (accessed on 11 September 2023).
- Kaufmann, D.; Kraay, A.; Mastruzzi, M. Governance Matters III: Governance Indicators for 1996–2002. World Bank Policy Res. Work. Pap. 2003, 3106, 116. [Google Scholar]
- Alkire, S.; Santos, M.E. Acute multidimensional poverty: A new index for developing countries. World Dev. 2014, 59, 251–274. [Google Scholar] [CrossRef]
- Jahn, D.; Suda, S. Sustainable policy performance and types of governance: Is there a trade-off between consensus and efficiency? Eur. Policy Anal. 2022, 8, 209–230. [Google Scholar] [CrossRef]
- Bazzan, G.; Álamos-Concha, P.; Rihoux, B. Identifying diverse paths toward successful policy performance in Organization for Economic Co-operation and Development (OECD) and European Union countries: A Qualitative Comparative Analysis (QCA) exploitation of the Sustainable Governance Indicators. Eur. Policy Anal. 2022, 8, 178–208. [Google Scholar] [CrossRef]
- Bandelow, N.C.; Hornung, J. How do good governance and democratic quality affect policy performance? Eur. Policy Anal. 2022, 8, 130–135. [Google Scholar] [CrossRef]
- Kaufmann, D.; Kraay, A.; Mastruzzi, M. The Worldwide Governance Indicators: Methodology and Analytical Issues. Policy Res. Work. Pap. 2010, 3, 220–246. Available online: http://hdl.handle.net/10986/3913 (accessed on 20 October 2023). [CrossRef]
- Croissant, A.; Pelke, L. Measuring Policy Performance, Democracy, and Governance Capacities: A conceptual and methodological assessment of the Sustainable Governance Indicators (SGI). Eur. Policy Anal. 2022, 8, 136–159. [Google Scholar] [CrossRef]
- Jindra, C.; Vaz, A. Good governance and multidimensional poverty: A comparative analysis of 71 countries. Governance 2019, 32, 657–675. [Google Scholar] [CrossRef]
- Lameira, V.d.J.; Ness, W.L. The Relationship between Governance and Sustainable Development. SSRN Electron. J. 2010, 1–15. [Google Scholar] [CrossRef]
- Anand, S.; Sen, A. Human Development and Economic Sustainability. World Dev. 2000, 28, 2029–2049. [Google Scholar] [CrossRef]
- Tosun, J.; Howlett, M. Analyzing national policy styles empirically using the Sustainable Governance Indicators (SGI): Insights into long-term patterns of policy-making. Eur. Policy Anal. 2022, 8, 160–177. [Google Scholar] [CrossRef]
- Antoniades, A.; Widiarto, I.; Antonarakis, A.S. Financial crises and the attainment of the SDGs: An adjusted multidimensional poverty approach. Sustain. Sci. 2019, 15, 1683–1698. [Google Scholar] [CrossRef]
- Ward, H.; Dorussen, H. Public Information and Performance: The Role of Spatial Dependence in the Worldwide Governance Indicators among African Countries. World Dev. 2015, 74, 253–263. [Google Scholar] [CrossRef]
- Saladini, F.; Betti, G.; Ferragina, E.; Bouraoui, F.; Cupertino, S.; Canitano, G.; Gigliotti, M.; Autino, A.; Pulselli, F.M.; Riccaboni, A.; et al. Linking the water-energy-food nexus and sustainable development indicators for the Mediterranean region. Ecol. Indic. 2018, 91, 689–697. [Google Scholar] [CrossRef]
- Wagschal, U. The influence of democracy, governance and government policies on the COVID-19 pandemic mortality. Eur. Policy Anal. 2022, 8, 231–247. [Google Scholar] [CrossRef] [PubMed]
- Hair, J.F.; Hult, G.T.M.; Ringle, C.M.; Sarstedt, M.; Thiele, K.O. Mirror, mirror on the wall: A comparative evaluation of composite-based structural equation modeling methods. J. Acad. Mark. Sci. 2017, 45, 616–632. [Google Scholar] [CrossRef]
- Ringle, C.M.; Wende, S.; Becker, J.M. SmartPLS 3. SmartPLS GmbH, Boenningstedt. 2015. Available online: http://www.smartpls.com (accessed on 30 December 2023).
- Henseler, J.; Ringle, C.M.; Sarstedt, M. A new criterion for assessing discriminant validity in variance-based structural equation modeling. J. Acad. Mark. Sci. 2015, 43, 115–135. [Google Scholar] [CrossRef]
- Duclos, J.-Y.; Sahn, D.E.; Younger, S.D. Robust Multidimensional Poverty Comparisons. Econ. J. 2006, 116, 943–968. [Google Scholar] [CrossRef]
- Antony, G.M.; Visweswara Rao, K. A composite index to explain variations in poverty, health, nutritional status and standard of living: Use of multivariate statistical methods. Public Health 2007, 212, 578–587. [Google Scholar] [CrossRef]
- Ezzrari, A.; Verme, P. A Multiple Correspondence Analysis Approach to the Measurement of Multidimensional Poverty in Morocco 2001–2007; Springer: Boston, MA, USA, 2013. [Google Scholar]
- Alkire, S.; Foster, J.; Seth, S.; Santos, M.E.; Roche, J.M.; Ballón, P. Multidimenional Poverty Measurement and Analysis; Oxford University Press: Oxford, UK, 2015. [Google Scholar]
- Alkire, S.; Foster, J. Counting and multidimensional poverty measurement. J. Public Econ. 2011, 95, 476–487. [Google Scholar] [CrossRef]
- UN Data Revolution. A World That Counts: Mobilising the Data Revolution for Sustainable Development. United Nations: Independent Expert Advisory Group on a Data Revolution for Sustainable Development. 2014. Available online: https://www.undatarevolution.org/wp-content/uploads/2014/11/A-World-That-Counts.pdf (accessed on 25 October 2023).
- Alkire, S.; Seth, S. Multidimensional Poverty Reduction in India between 1999 and 2006: Where and How? World Dev. 2015, 72, 93–108. [Google Scholar] [CrossRef]
- Alkire, S.; Jindra, C.; Robles, G.; Vaz, A. Multidimensional Poverty Index 2016: Brief Methodological Note and Results. OPHI Brief. 2016, 42, 1–23. [Google Scholar] [CrossRef]
- Alkire, S.; Roche, J.M.; Vaz, A. Changes Over Time in Multidimensional Poverty: Methodology and Results for 34 Countries. World Dev. 2017, 94, 232–249. [Google Scholar] [CrossRef]
- Martinez, A.; Perales, F. The Dynamics of Multidimensional Poverty in Contemporary Australia. Soc. Indic. Res. 2017, 130, 479–496. [Google Scholar] [CrossRef]
- Alkire, S.; Jindra, C.; Robles, G.A.; Vaz, A. Multidimensional Poverty Reduction Among Countries in Sub-Saharan Africa. Forum Soc. Econ. 2017, 46, 178–191. [Google Scholar] [CrossRef]
- Suppa, N. Transitions in poverty and its deprivations: An analysis of multidimensional poverty dynamics. Soc. Choice Welf. 2018, 51, 235–258. [Google Scholar] [CrossRef]
- Salecker, L.; Ahmadov, A.K.; Karimli, L. Contrasting Monetary and Multidimensional Poverty Measures in a Low-Income Sub-Saharan African Country. Soc. Indic. Res. 2020, 151, 547–574. [Google Scholar] [CrossRef]
- Mahadevan, R.; Jayasinghe, M. Examining Multidimensional Poverty in Sri Lanka: Transitioning Through Post War Conflict. Soc. Indic. Res. 2020, 149, 15–39. [Google Scholar] [CrossRef]
- Ravallion, M. The Debate on Globalization, Poverty, and Inequality: Why Measurement Matters. Int. Aff. 2003, 79, 739–753. [Google Scholar] [CrossRef]
- Alkire, S.; Santos, M.E. Measuring Acute Poverty in the Developing World: Robustness and Scope of the Multidimensional Poverty Index. World Dev. 2014, 59, 251–274. [Google Scholar] [CrossRef]
- Whelan, C.T.; Nolan, B.; Maître, B. Multidimensional poverty measurement in Europe: An application of the adjusted headcount approach. J. Eur. Soc. Policy 2014, 24, 183–197. [Google Scholar] [CrossRef]
- Liu, Y.; Xu, Y. A geographic identification of multidimensional poverty in rural China under the framework of sustainable livelihoods analysis. Appl. Geogr. 2016, 73, 62–76. [Google Scholar] [CrossRef]
- Santos, M.E.; Villatoro, P. A Multidimensional Poverty Index for Latin America. Rev. Income Wealth 2018, 64, 52–82. [Google Scholar] [CrossRef]
- Angulo, R.; Díaz, Y.; Pardo, R. The Colombian Multidimensional Poverty Index: Measuring Poverty in a Public Policy Context. Soc. Indic. Res. 2016, 127, 1–38. [Google Scholar] [CrossRef]
- Padda, I.U.H.; Hameed, A. Estimating multidimensional poverty levels in rural Pakistan: A contribution to sustainable development policies. J. Clean. Prod. 2018, 197, 435–442. [Google Scholar] [CrossRef]
- Becerra, R.M.; Vélez, A.M. Gobernanza y Gerencia del Desarrollo Sostenible; Ediciones Uniandes-Universidad de los Andes: Bogotá, Colombia, 2018. [Google Scholar]
- Alkire, S.; Fang, Y. Dynamics of Multidimensional Poverty and Uni-dimensional Income Poverty: An Evidence of Stability Analysis from China. Soc. Indic. Res. 2019, 142, 25–64. [Google Scholar] [CrossRef]
- Chen, K.M.; Leu, C.H.; Wang, T.M. Measurement and Determinants of Multidimensional Poverty: Evidence from Taiwan. Soc. Indic. Res. 2019, 145, 459–478. [Google Scholar] [CrossRef]
- Fransman, T.; Yu, D. Multidimensional poverty in South Africa in 2001–16. Dev. S. Afr. 2019, 36, 50–79. [Google Scholar] [CrossRef]
- Dong, Y.; Jin, G.; Deng, X.; Wu, F. Multidimensional measurement of poverty and its spatio-temporal dynamics in China from the perspective of development geography. J. Geogr. Sci. 2021, 31, 130–148. [Google Scholar] [CrossRef]
- Hair, J.J.F.; Hult, G.T.M.; Ringle, C.M.; Sarstedt, M. A Primer on Partial Least Squares Structural Equation Modeling (PlS-SEM), 3rd ed.; SAGE Publications Inc.: Thousand Oaks, CA, USA, 2021. [Google Scholar]
- Ringle, C.M.; Wende, S.; Becker, J.M. SmartPLS4. Oststeinbek: SmartPLS. 2022. Available online: https://www.smartpls.com/ (accessed on 5 December 2023).
- Fornell, C.; Larcker, D. Evaluating structural equation models with unobservable variables and measurement error. J. Mark. Res. 1981, 18, 39–50. [Google Scholar] [CrossRef]
- Henseler, J. Partial least squares path modeling. Adv. Methods Model. Mark. 2017, 1, 361–381. [Google Scholar] [CrossRef]
- Chin, W. Commentary: Issues and opinion on structural equation modeling. MIS Q. 1998, 22, vii–xvi. [Google Scholar]


| Code | Worldwide Governance Indicators (WGIs) | Description |
|---|---|---|
| wgi_1 | Voice and Accountability | Reflects perceptions of the extent to which a country’s citizens are able to participate in selecting their government, as well as freedom of expression, freedom of association, and free media. |
| wgi_2 | Political Stability and Absence of Violence/Terrorism | Measures perceptions of the likelihood of political instability and/or politically motivated violence, including terrorism. |
| wgi_3 | Government Effectiveness | Reflects perceptions of the quality of public services, the quality of the civil service and the degree of its independence from political pressures, the quality of policy formulation and implementation, and the credibility of the government’s commitment to such policies. |
| wgi_4 | Regulatory Quality | Reflects perceptions of the ability of the government to formulate and implement sound policies and regulations that permit and promote private sector development. |
| wgi_5 | Rule of Law | Reflects perceptions of the extent to which agents have confidence in and abide by the rules of society, and in particular the quality of contract enforcement, property rights, the police, and the courts, as well as the likelihood of crime and violence. |
| wgi_6 | Control of Corruption | Reflects perceptions of the extent to which public power is exercised for private gain, including both petty and grand forms of corruption, as well as “capture” of the state by elites and private interests. |
| Code | Indicators | Description | The Supporting Literature |
|---|---|---|---|
| mpi_1 | Poverty Rate | The poverty rate is the ratio of the number of people (in a given age group) whose income falls below the poverty line, which is taken as half the median household income of the total population. It is also available by broad age group: child poverty (0–17 years old), working-age poverty, and elderly poverty (66-year-olds or more). | [13,22,23,26,27,28,29,30] |
| mpi_2 | Low Pay Incidence | Share of workers earning less than 2/3 of median earnings. | [31,32,33,34,35] |
| mpi_3 | Family Policy | It is based on the assumption that an optimal system of family support should enable women to decide freely whether and when they want to take up or proceed with full- or part time employment. | [23,24,25,36,37] |
| mpi_4 | Child Poverty Rate | Child poverty rate, children less than 18 years old, cutoff point 50 percent of median equivalized disposable income. | [22,25,26,37] |
| mpi_5 | Senior Citizen Poverty | Senior citizen poverty rate, persons 65 years or older, cutoff point 50 percent of median equivalized disposable income. | [22,25,32,37] |
| Hypothesis | Latent Variable | Indicators | Convergent Validity | Internal Consistency Reliability | Discriminant Validity | |||
|---|---|---|---|---|---|---|---|---|
| Loadings | Indicator Reliability | AVE | Cronbach’s Alpha | Reliability ρA | HTMT | |||
| >0.70 | >0.50 | >0.50 | 0.70–0.90 | 0.70–0.90 | Significantly Lower than 0.85 (0.90)? | |||
| H1a–c | EP | P1 | 0.769 | 0.592 | 0.470 | 0.834 | 0.855 | Yes |
| P2 | 0.630 | 0.397 | ||||||
| P3 | 0.808 | 0.653 | ||||||
| P4 | 0.432 | 0.187 | ||||||
| P5 | 0.673 | 0.453 | ||||||
| P6 | 0.735 | 0.540 | ||||||
| H2a–c | EnP | P15 | 0.951 | 0.904 | 0.726 | 0.826 | 0.863 | Yes |
| P16 | 0.740 | 0.548 | ||||||
| H3a–c | SP | P7 | 0.830 | 0.690 | 0.535 | 0.901 | 0.905 | Yes |
| P8 | 0.783 | 0.613 | ||||||
| P9 | 0.730 | 0.533 | ||||||
| P10 | 0.769 | 0.591 | ||||||
| P11 | 0.679 | 0.462 | ||||||
| P12 | 0.631 | 0.398 | ||||||
| P13 | 0.651 | 0.424 | ||||||
| P14 | 0.753 | 0.567 | ||||||
| H4a–c | SGI | sgi_1 | 0.865 | 0.748 | 0.792 | 0.957 | 0.961 | Yes |
| sgi_2 | 0.791 | 0.625 | ||||||
| sgi_3 | 0.878 | 0.772 | ||||||
| sgi_4 | 0.845 | 0.714 | ||||||
| sgi_5 | 0.967 | 0.934 | ||||||
| sgi_6 | 0.979 | 0.958 | ||||||
| H5a–c | WGI | wgi_1 | 0.978 | 0.956 | 0.874 | 0.976 | 0.979 | Yes |
| wgi_2 | 0.865 | 0.748 | ||||||
| wgi_3 | 0.948 | 0.898 | ||||||
| wgi_4 | 0.830 | 0.689 | ||||||
| wgi_5 | 0.976 | 0.953 | ||||||
| wgi_6 | 0.999 | 0.998 | ||||||
| H6a–c | MPI | mpi_1 | 0.758 | 0.574 | 0.439 | 0.783 | 0.823 | Yes |
| mpi_2 | 0.347 | 0.120 | ||||||
| mpi_3 | 0.822 | 0.675 | ||||||
| mpi_4 | 0.571 | 0.326 | ||||||
| mpi_5 | 0.707 | 0.500 | ||||||
| Hypothesis | Formative Constructs | Formative Indicators | VIF | Outer Weights | t Value | p Value | 95% Confidence Interval (with Bias Correction) | Significance (p < 0.05)? |
|---|---|---|---|---|---|---|---|---|
| H3d | QD | D1 | 4.265 | 0.892 | 0.385 | 0.700 | [−0.334; 0.539] | No |
| D2 | 7.154 | 0.954 | 1.071 | 0.284 | [−0.247; 0.881] | No | ||
| D3 | 4.925 | 0.969 | 2.078 | 0.038 | [0.015; 0.917] | Yes | ||
| D4 | 5.936 | 0.930 | 0.788 | 0.431 | [−0.203; 0.643] | No | ||
| H3e | GG | EA1 | 5.506 | 0.864 | 0.939 | 0.348 | [−0.254; 0.464] | No |
| EA2 | 2.717 | 0.622 | 0.026 | 0.979 | [−0.215; 0.230] | No | ||
| EA3 | 5.218 | 0.891 | 1.370 | 0.171 | [−0.045; 0.742] | No | ||
| EA4 | 3.919 | 0.720 | 0.709 | 0.478 | [−0.459; 0.242] | No | ||
| EA5 | 3.004 | 0.725 | 1.048 | 0.295 | [−0.148; 0.347] | No | ||
| EC1 | 5.823 | 0.655 | 1.684 | 0.092 | [−0.795; 0.014] | No | ||
| EC2 | 3.760 | 0.501 | 0.173 | 0.863 | [−0.319; 0.253] | No | ||
| EC3 | 3.064 | 0.563 | 0.013 | 0.989 | [−0.258; 0.383] | No | ||
| EC4 | 5.951 | 0.829 | 1.922 | 0.055 | [0.036; 0.813] | No | ||
| EC5 | 3.333 | 0.603 | 0.602 | 0.547 | [−0.364; 0.234] | No | ||
| EC6 | 5.572 | 0.874 | 2.205 | 0.027 | [0.050; 0.854] | Yes | ||
| EC7 | 3.406 | 0.808 | 2.045 | 0.041 | [−0.032; 0.558] | Yes | ||
| EC8 | 4.560 | 0.621 | 0.288 | 0.774 | [−0.468; 0.329] | No |
| Hypothesis | Relationship | Path Coefficients | t Value | p Value | 95% Confidence Interval (with Bias Correction) | Significance (p < 0.05)? |
|---|---|---|---|---|---|---|
| H7a | EP → EnP | 0.074 | 0.297 | 0.766 | [−0.189; 0.664] | No |
| H7b | EP → SGI | 0.350 | 5.375 | 0.000 | [0.224; 0.472] | Yes |
| H7c | EnP → SGI | 0.349 | 8.429 | 0.000 | [0.286; 0.450] | Yes |
| H7d | SP → EnP | −0.276 | 1.191 | 0.234 | [−0.610; 0.291] | No |
| H7e | SP → SGI | 0.399 | 6.637 | 0.000 | [0.282; 0.515] | Yes |
| H7f | QD → EP | 0.032 | 0.165 | 0.869 | [−0.263; 0.442] | No |
| H7g | QD → EnP | 0.060 | 0.3 | 0.764 | [−0.355; 0.457] | No |
| H7h | QD → SP | 0.003 | 0.015 | 0.988 | [−0.494; 0.270] | No |
| H7i | GG → EP | 0.837 | 4.775 | 0.000 | [0.406; 1.091] | Yes |
| H7j | GG → EnP | 0.922 | 2.432 | 0.015 | [−0.588; 1.343] | Yes |
| H7k | GG → SP | 0.866 | 5.111 | 0.000 | [0.578; 1.264] | Yes |
| H7l | SGI → WGI | 0.474 | 2.82 | 0.005 | [0.177; 0.819] | Yes |
| H7m | MPI → WGI | 0.371 | 2.579 | 0.010 | [0.072; 0.627] | Yes |
| H7n | MPI x SGI → WGI | −0.184 | 2.091 | 0.037 | [−0.369; −0.020] | Yes |
| Hypothesis | Relationship | Total Effect | t Value | p Value | 95% Confidence Interval (with Bias Correction) | Significance (p < 0.05)? |
|---|---|---|---|---|---|---|
| H8a | EP → EnP | 0.074 | 0.297 | 0.766 | [−0.189; 0.664] | No |
| H8b | EP → SGI | 0.376 | 3.597 | 0.000 | [0.243; 0.655] | Yes |
| H8c | EP → WGI | 0.178 | 2.334 | 0.020 | [0.075; 0.428] | Yes |
| H8d | EnP → SGI | 0.349 | 8.429 | 0.000 | [0.286; 0.450] | Yes |
| H8e | EnP → WGI | 0.165 | 2.891 | 0.004 | [0.070; 0.293] | Yes |
| H8f | SP → EnP | −0.276 | 1.191 | 0.234 | [−0.610; 0.291] | No |
| H8g | SP → SGI | 0.302 | 3.052 | 0.002 | [0.144; 0.534] | Yes |
| H8h | SP → WGI | 0.143 | 2.094 | 0.036 | [0.054; 0.385] | Yes |
| H8i | QD → EP | 0.032 | 0.165 | 0.869 | [−0.263; 0.442] | No |
| H8j | QD → EnP | 0.062 | 0.305 | 0.761 | [−0.324; 0.483] | No |
| H8k | QD → SP | 0.003 | 0.015 | 0.988 | [−0.494; 0.270] | No |
| H8l | QD → SGI | 0.034 | 0.34 | 0.734 | [−0.161; 0.189] | No |
| H8m | QD → WGI | 0.016 | 0.322 | 0.747 | [−0.084; 0.099] | No |
| H8n | GG → EP | 0.837 | 4.775 | 0.000 | [0.406; 1.091] | Yes |
| H8o | GG → EnP | 0.745 | 3.768 | 0.000 | [0.237; 1.063] | Yes |
| H8p | GG → SP | 0.866 | 5.111 | 0.000 | [0.578; 1.264] | Yes |
| H8q | GG → SGI | 0.898 | 9.397 | 0.000 | [0.681; 1.040] | Yes |
| H8r | GG → WGI | 0.426 | 2.677 | 0.007 | [0.169; 0.784] | Yes |
| H8s | SGI → WGI | 0.474 | 2.820 | 0.005 | [0.177; 0.819] | Yes |
| H8t | MPI → WGI | 0.371 | 2.579 | 0.010 | [0.072; 0.627] | Yes |
| H8u | MPI x SGI → WGI | −0.184 | 2.091 | 0.037 | [−0.369; −0.020] | Yes |
Disclaimer/Publisher’s Note: The statements, opinions and data contained in all publications are solely those of the individual author(s) and contributor(s) and not of MDPI and/or the editor(s). MDPI and/or the editor(s) disclaim responsibility for any injury to people or property resulting from any ideas, methods, instructions or products referred to in the content. |
© 2024 by the authors. Licensee MDPI, Basel, Switzerland. This article is an open access article distributed under the terms and conditions of the Creative Commons Attribution (CC BY) license (https://creativecommons.org/licenses/by/4.0/).
Share and Cite
Puente De La Vega Caceres, A.; Quispe Ramos, E.; Ramos Meza, C.S. Moderating the Effect of the Multidimensional Poverty Index on the Relationship between Sustainable Governance Indicators and Worldwide Governance Indicators. Sustainability 2024, 16, 2855. https://doi.org/10.3390/su16072855
Puente De La Vega Caceres A, Quispe Ramos E, Ramos Meza CS. Moderating the Effect of the Multidimensional Poverty Index on the Relationship between Sustainable Governance Indicators and Worldwide Governance Indicators. Sustainability. 2024; 16(7):2855. https://doi.org/10.3390/su16072855
Chicago/Turabian StylePuente De La Vega Caceres, Abraham, Estela Quispe Ramos, and Carlos Samuel Ramos Meza. 2024. "Moderating the Effect of the Multidimensional Poverty Index on the Relationship between Sustainable Governance Indicators and Worldwide Governance Indicators" Sustainability 16, no. 7: 2855. https://doi.org/10.3390/su16072855
APA StylePuente De La Vega Caceres, A., Quispe Ramos, E., & Ramos Meza, C. S. (2024). Moderating the Effect of the Multidimensional Poverty Index on the Relationship between Sustainable Governance Indicators and Worldwide Governance Indicators. Sustainability, 16(7), 2855. https://doi.org/10.3390/su16072855