
Advancing Sustainable Building Practices: Intelligent Methods for Enhancing Heating and Cooling Energy Efficiency


Abstract
1. Introduction
2. Background
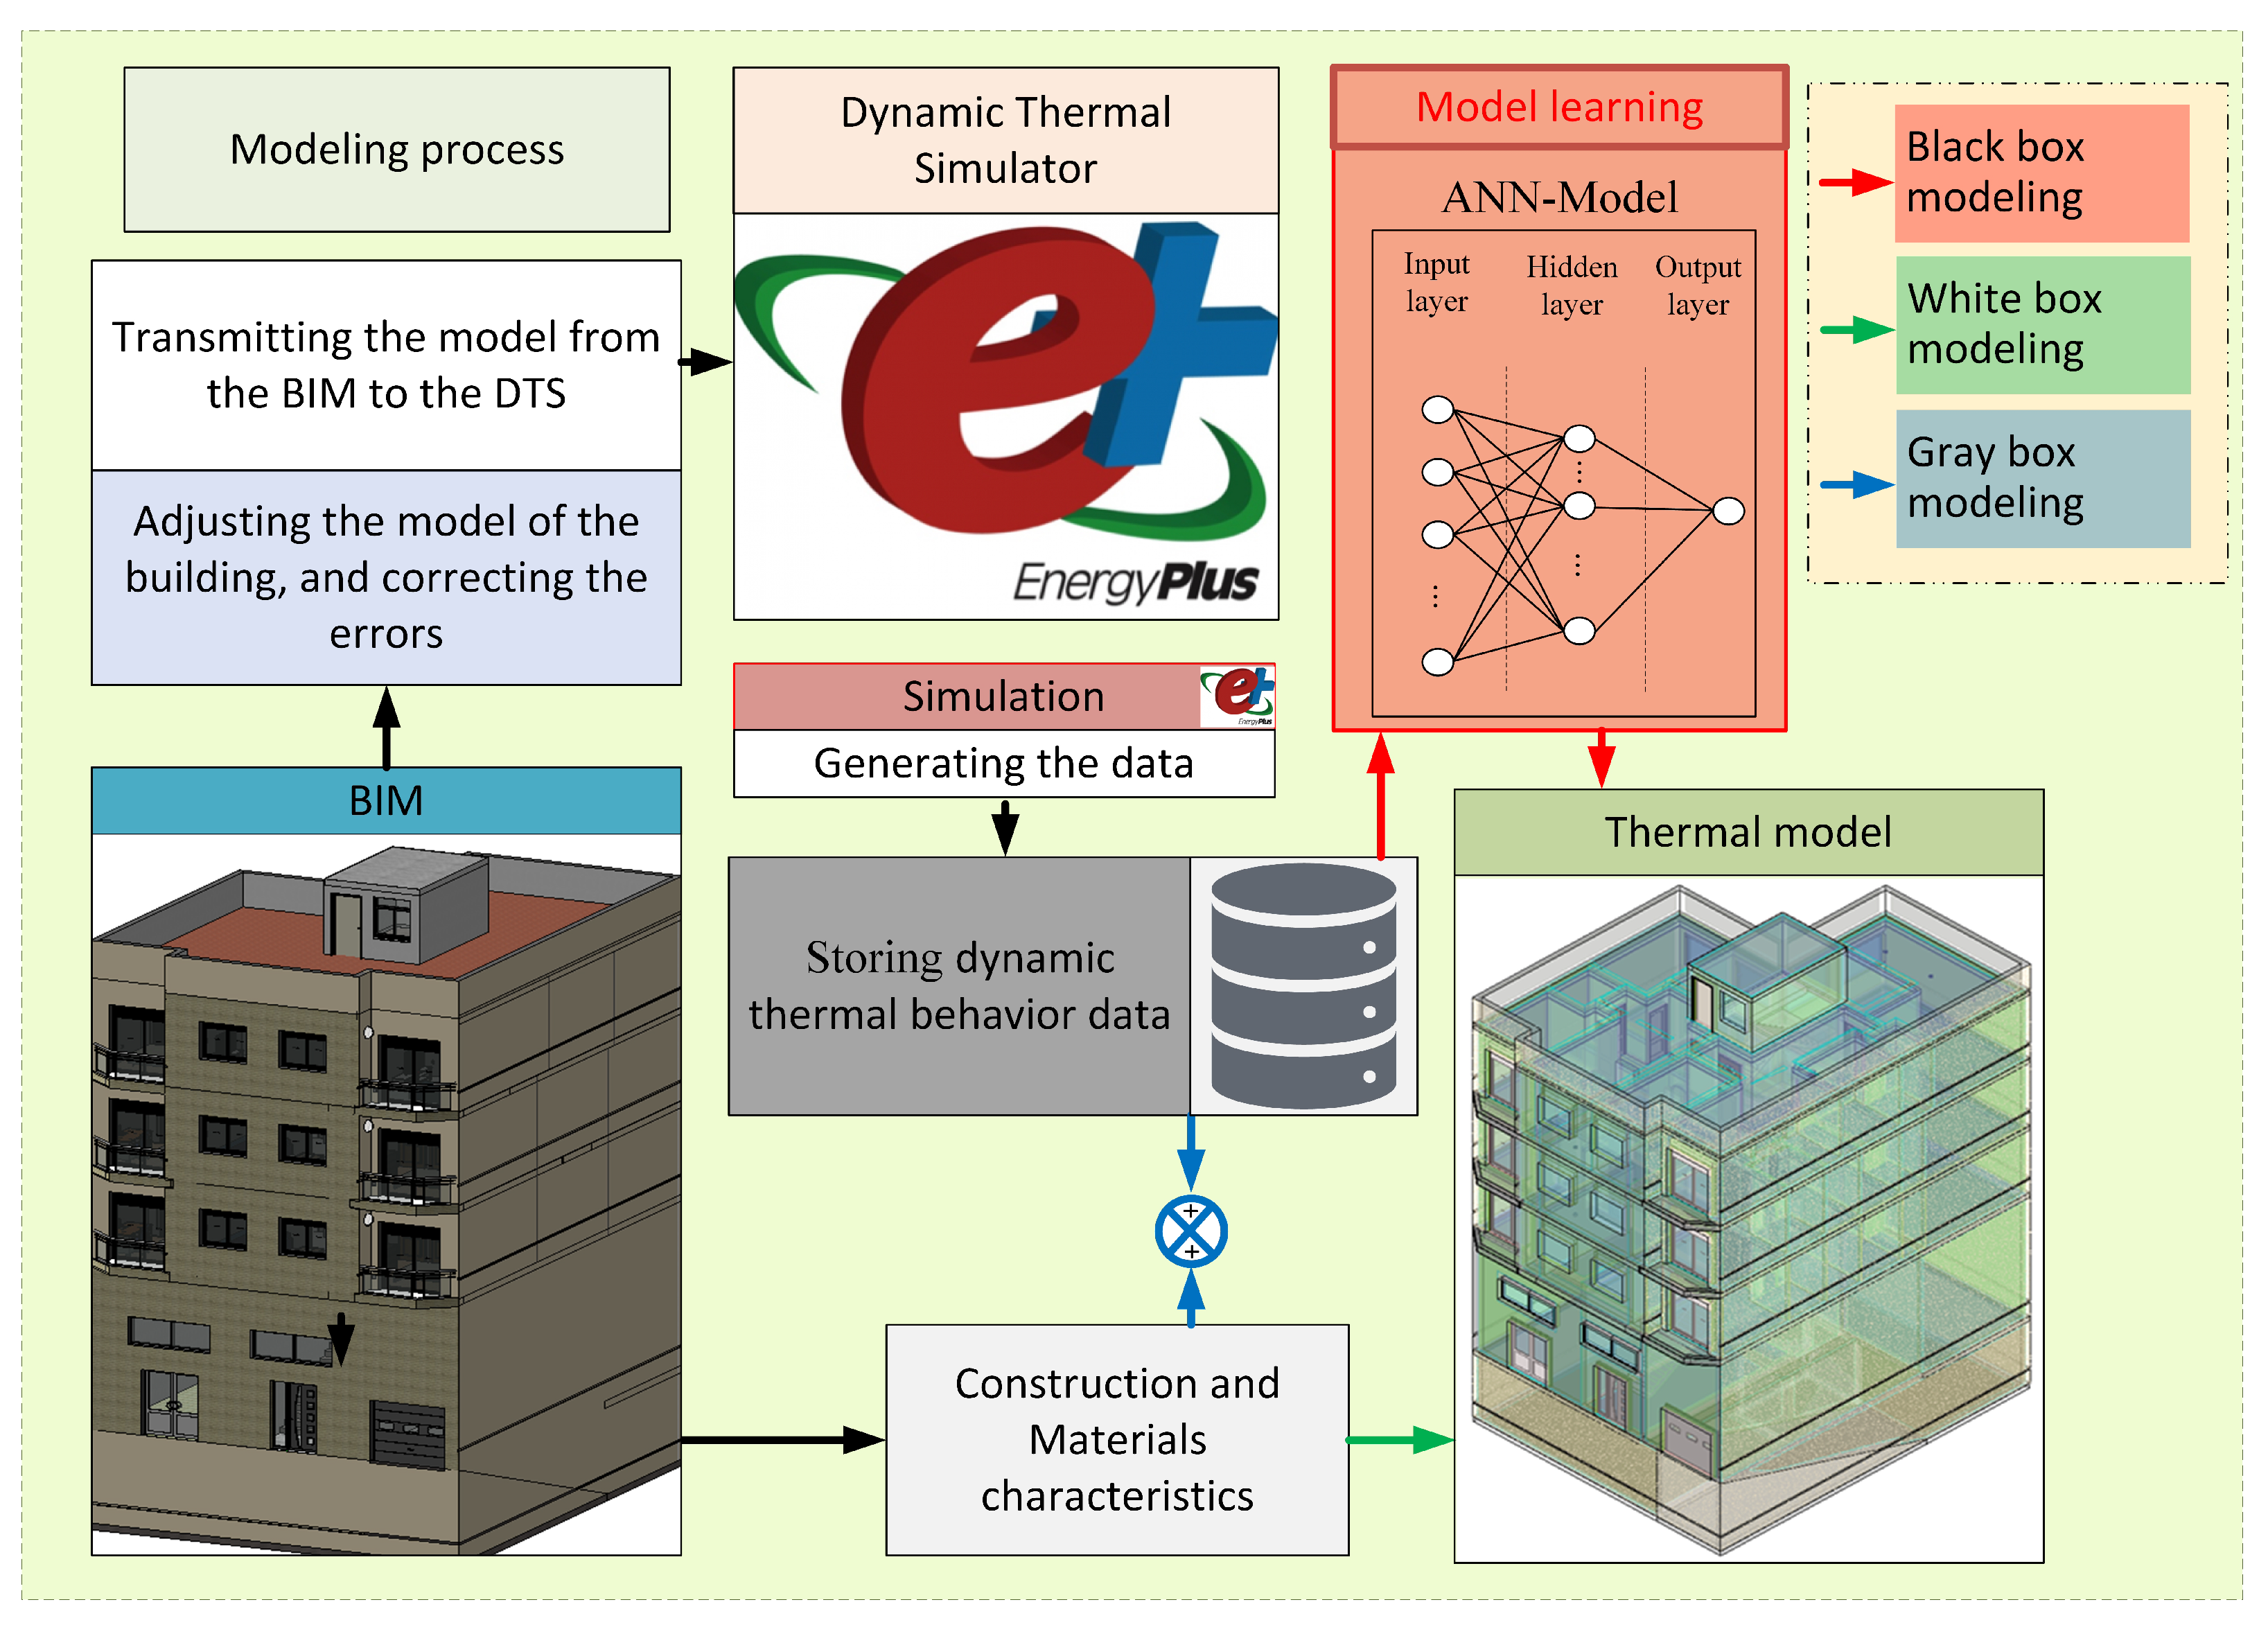
2.1. Building Energy Modeling
2.2. Control Methods for Buildings
3. Methodology
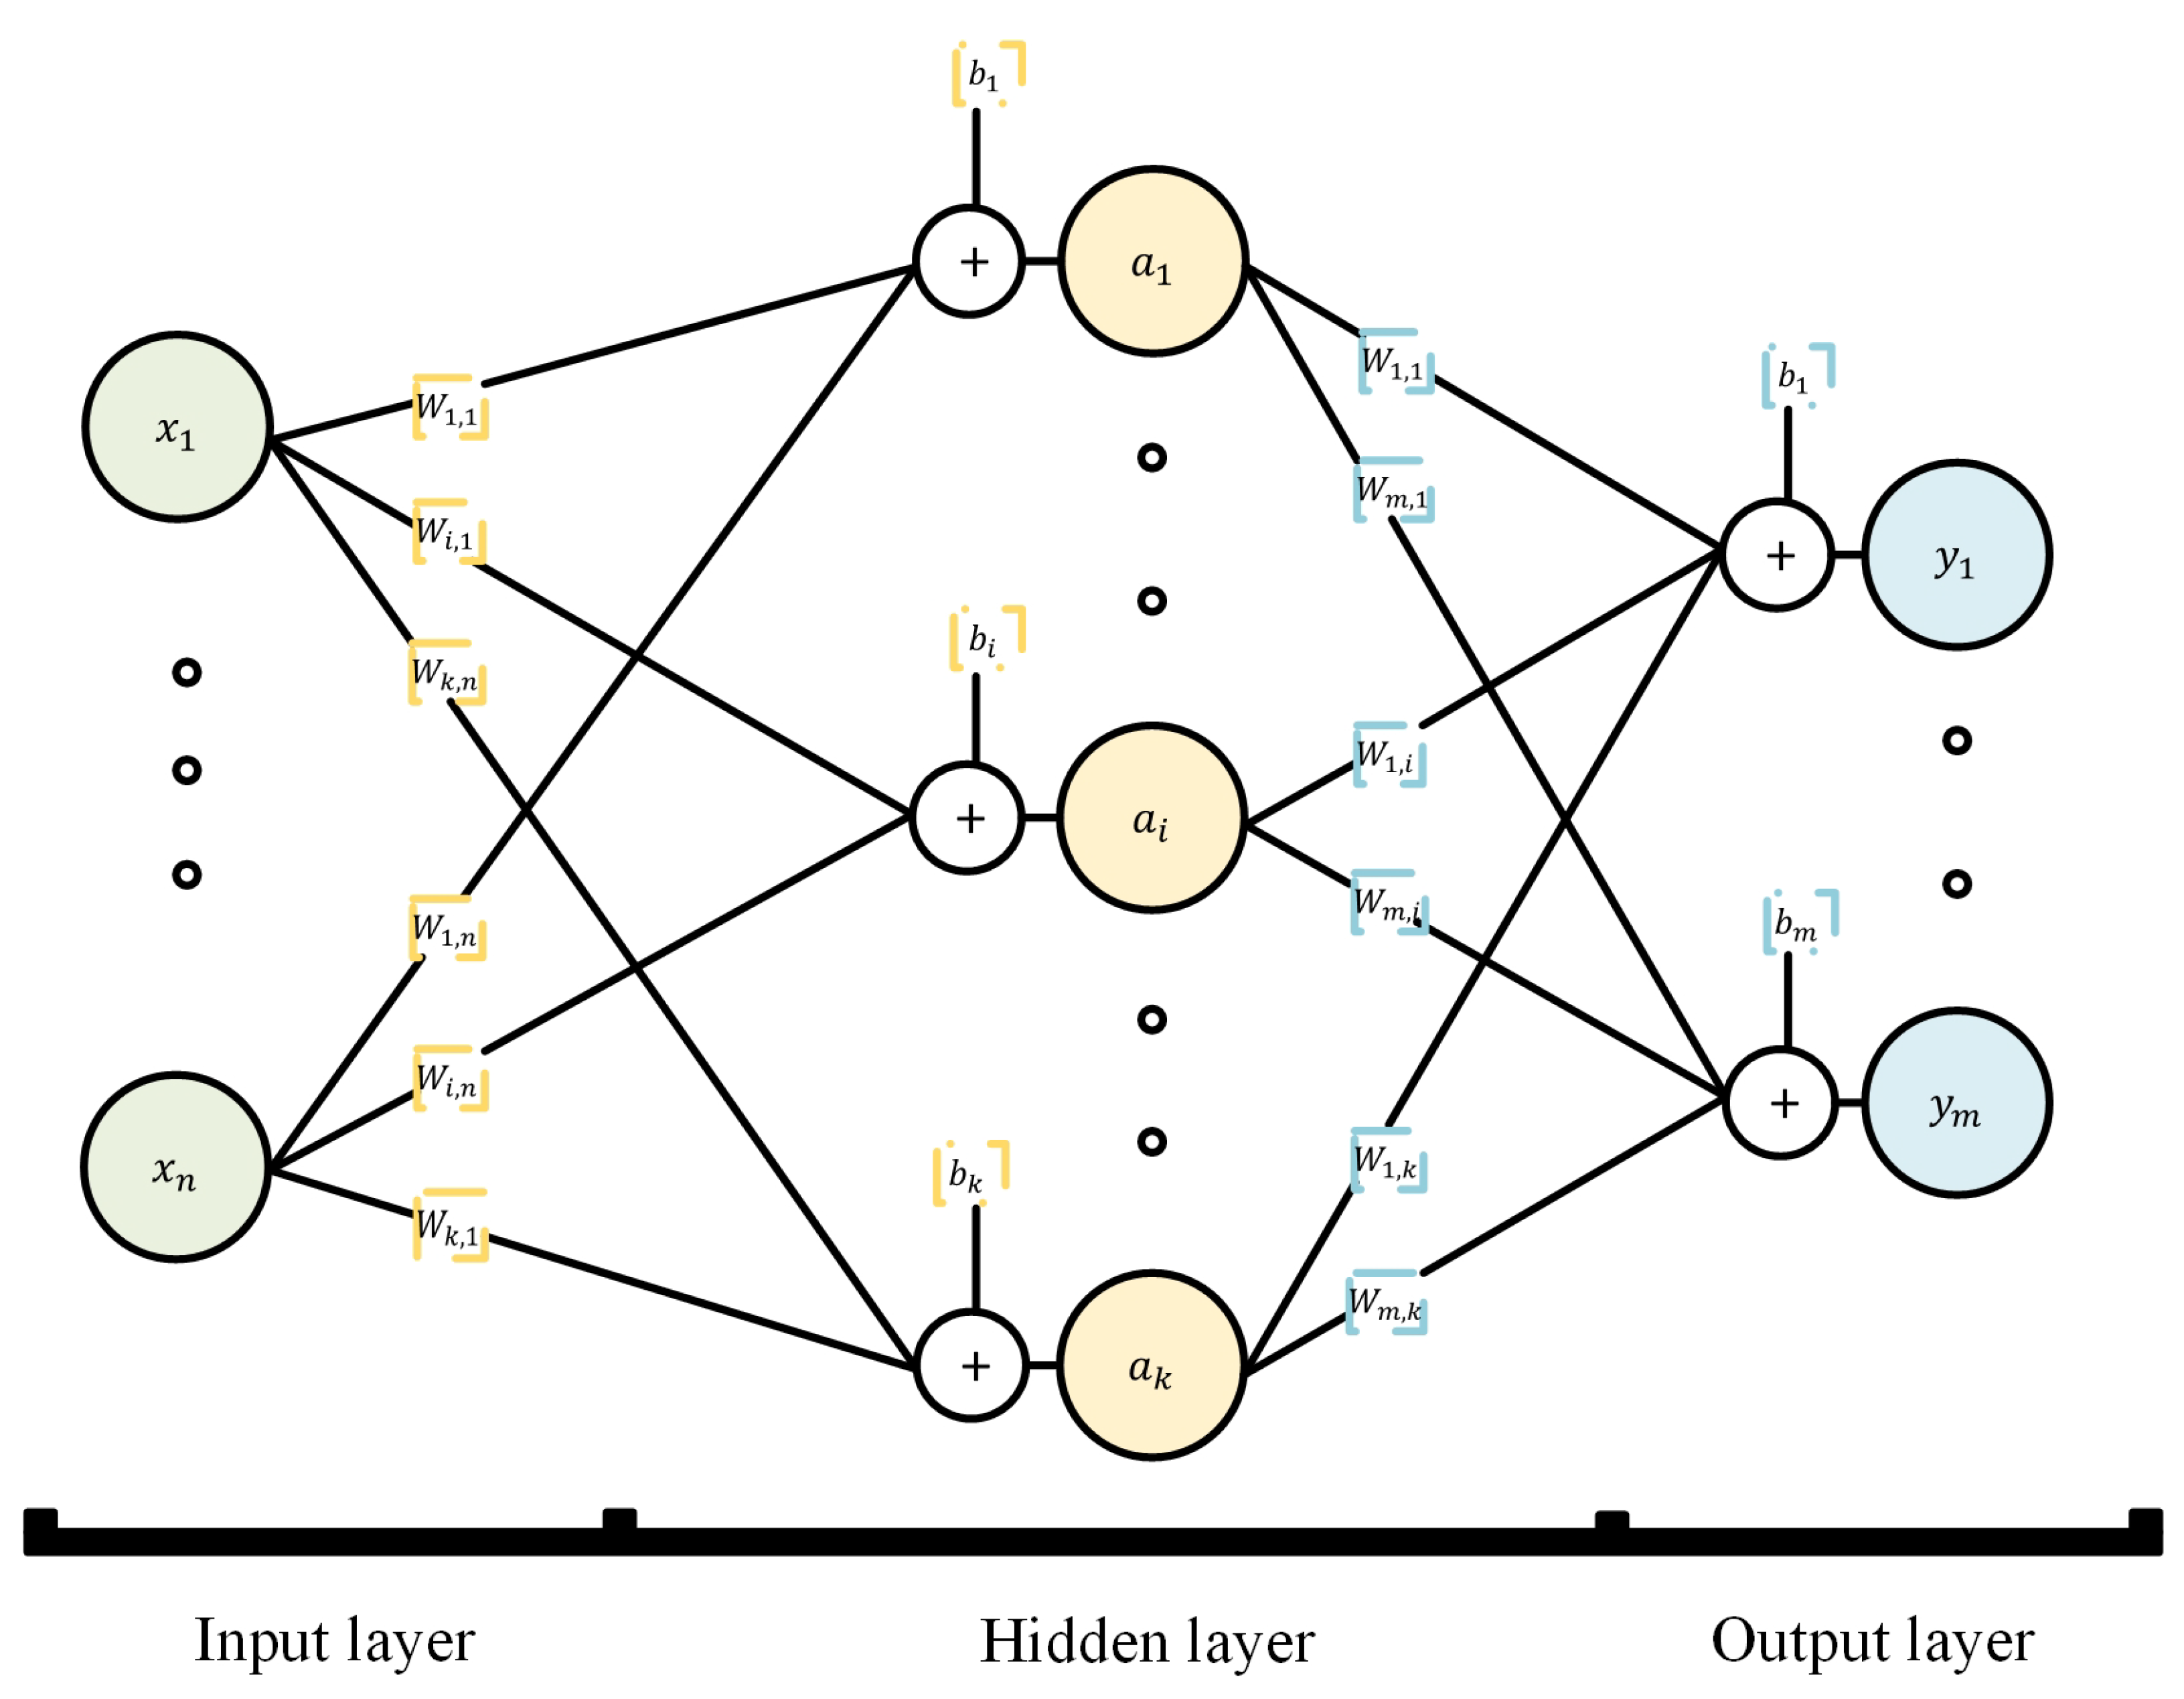
3.1. ANN Model
- : the simulated or measured data;
- : the predicted data from the ANN;
- N: N expresses the number of simulated or measured data.
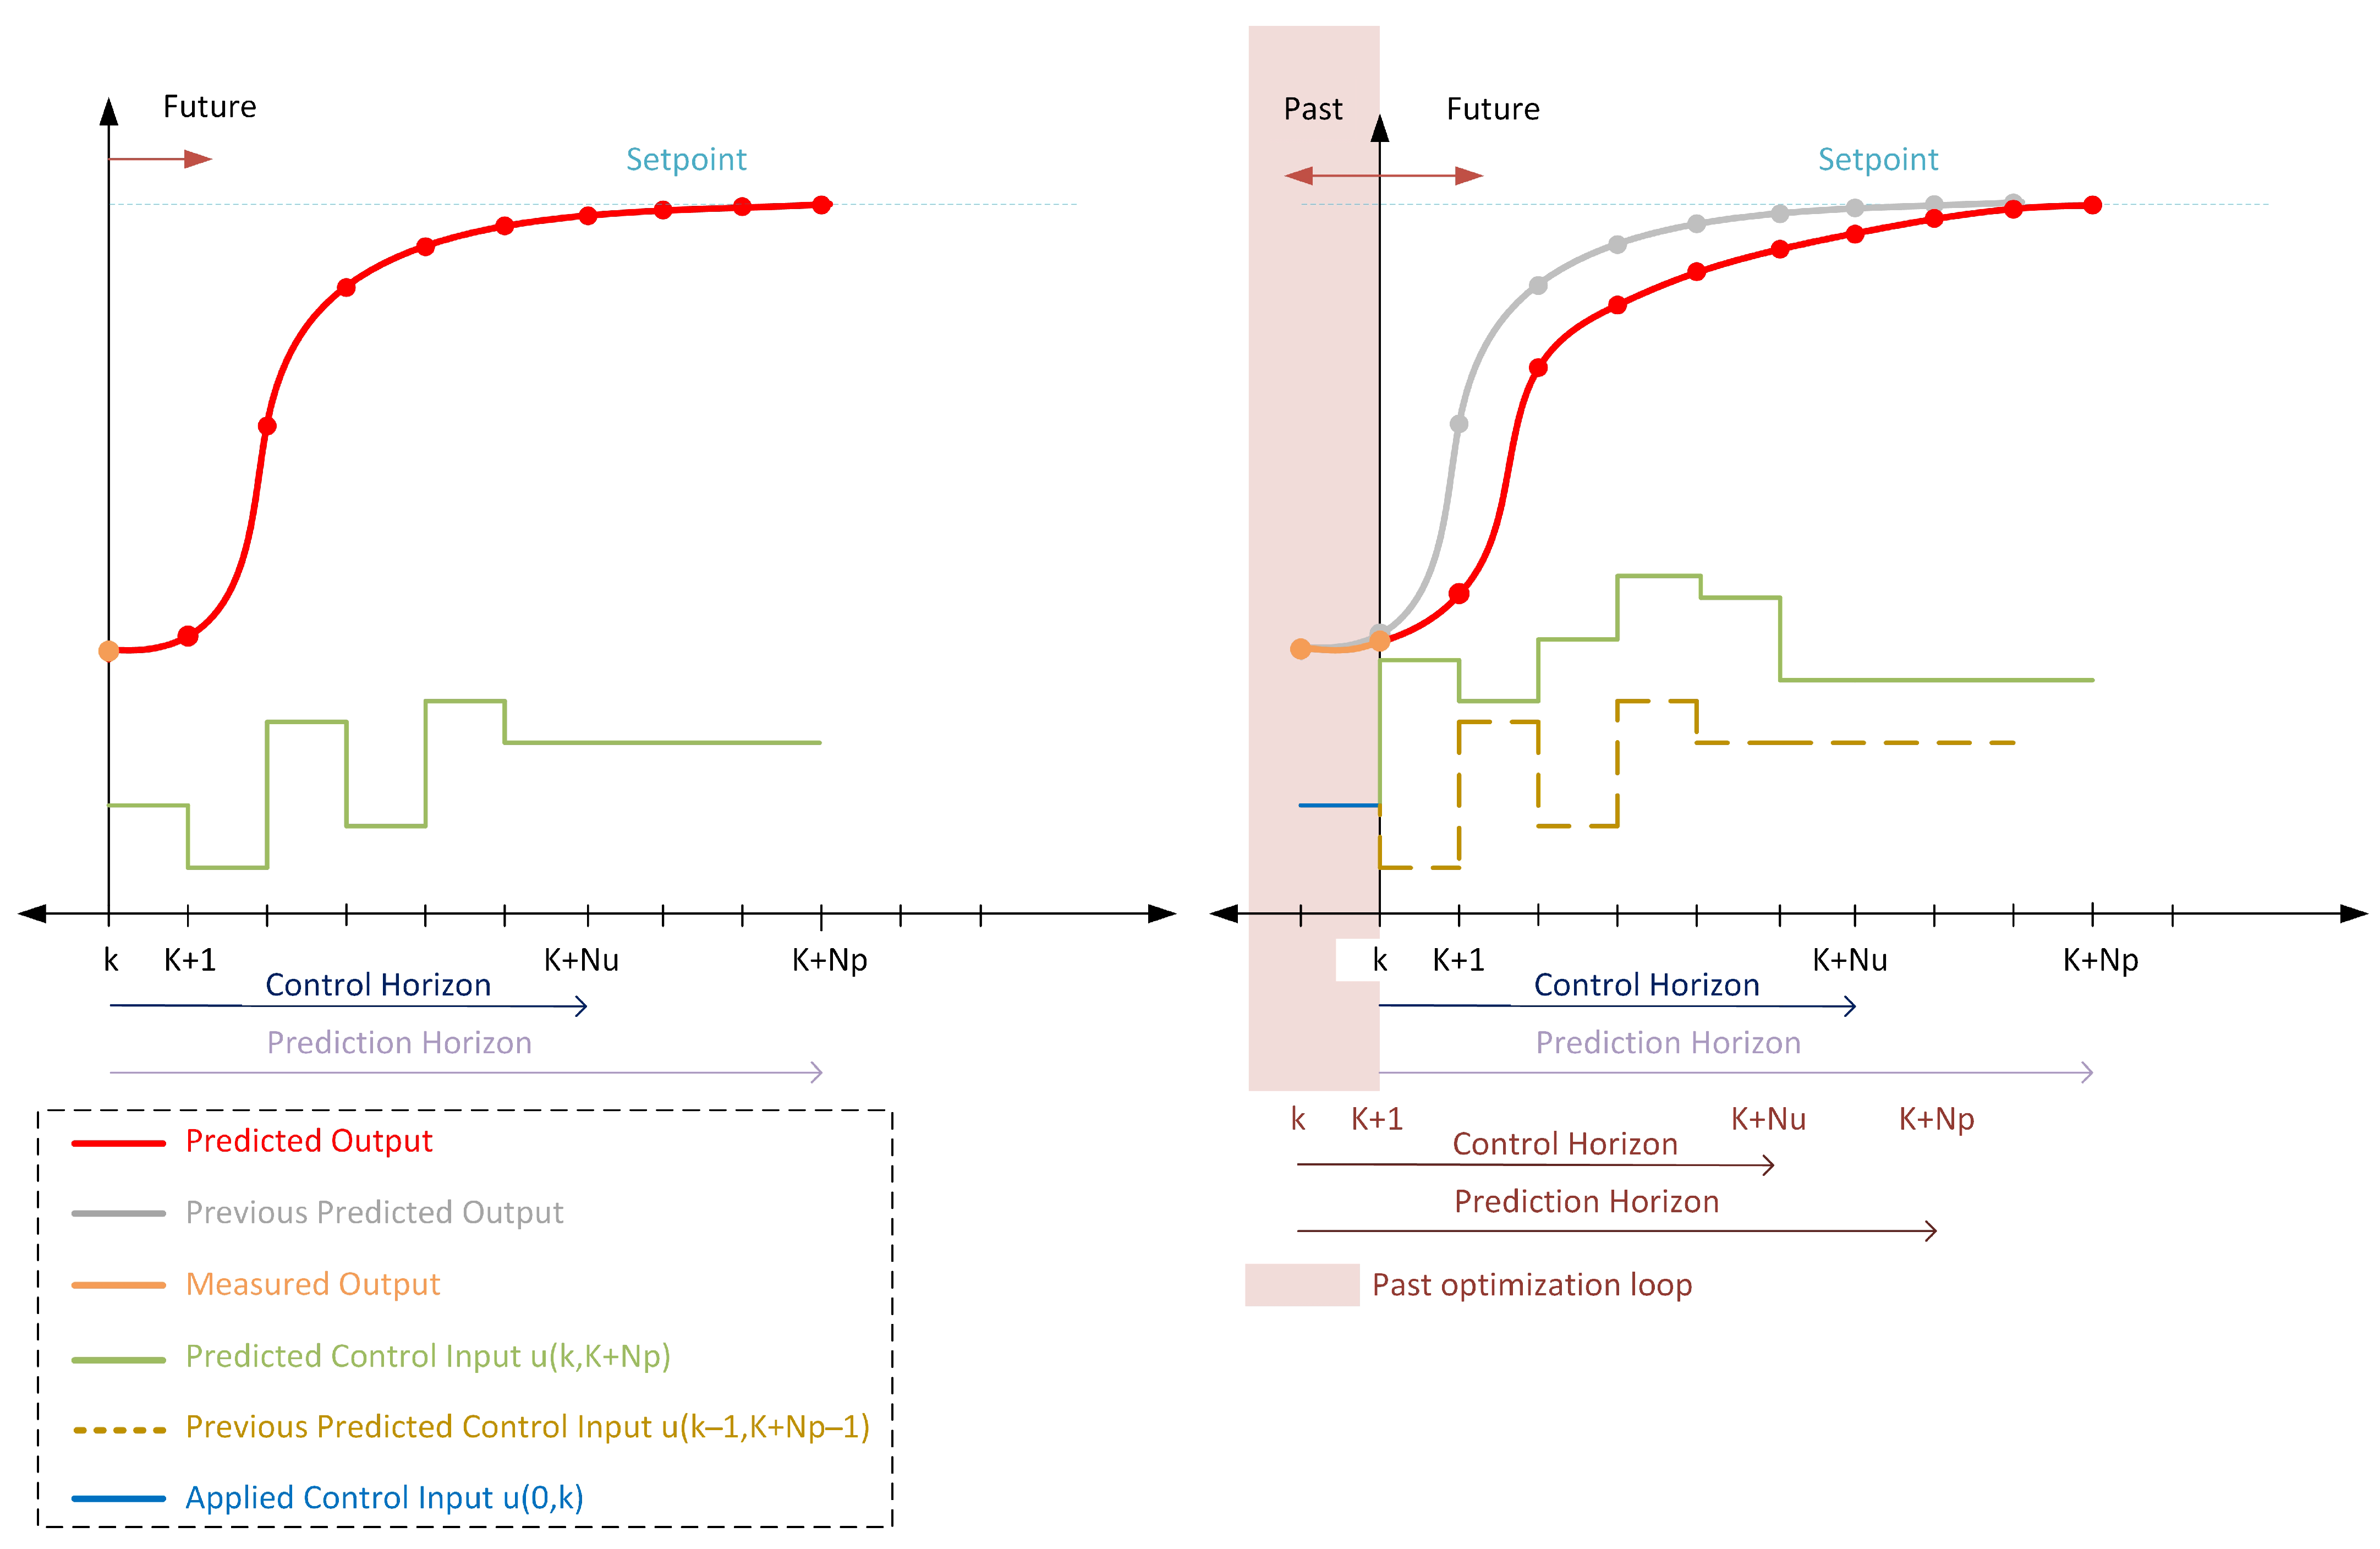
3.2. MPC
3.3. PYNQ Implementation
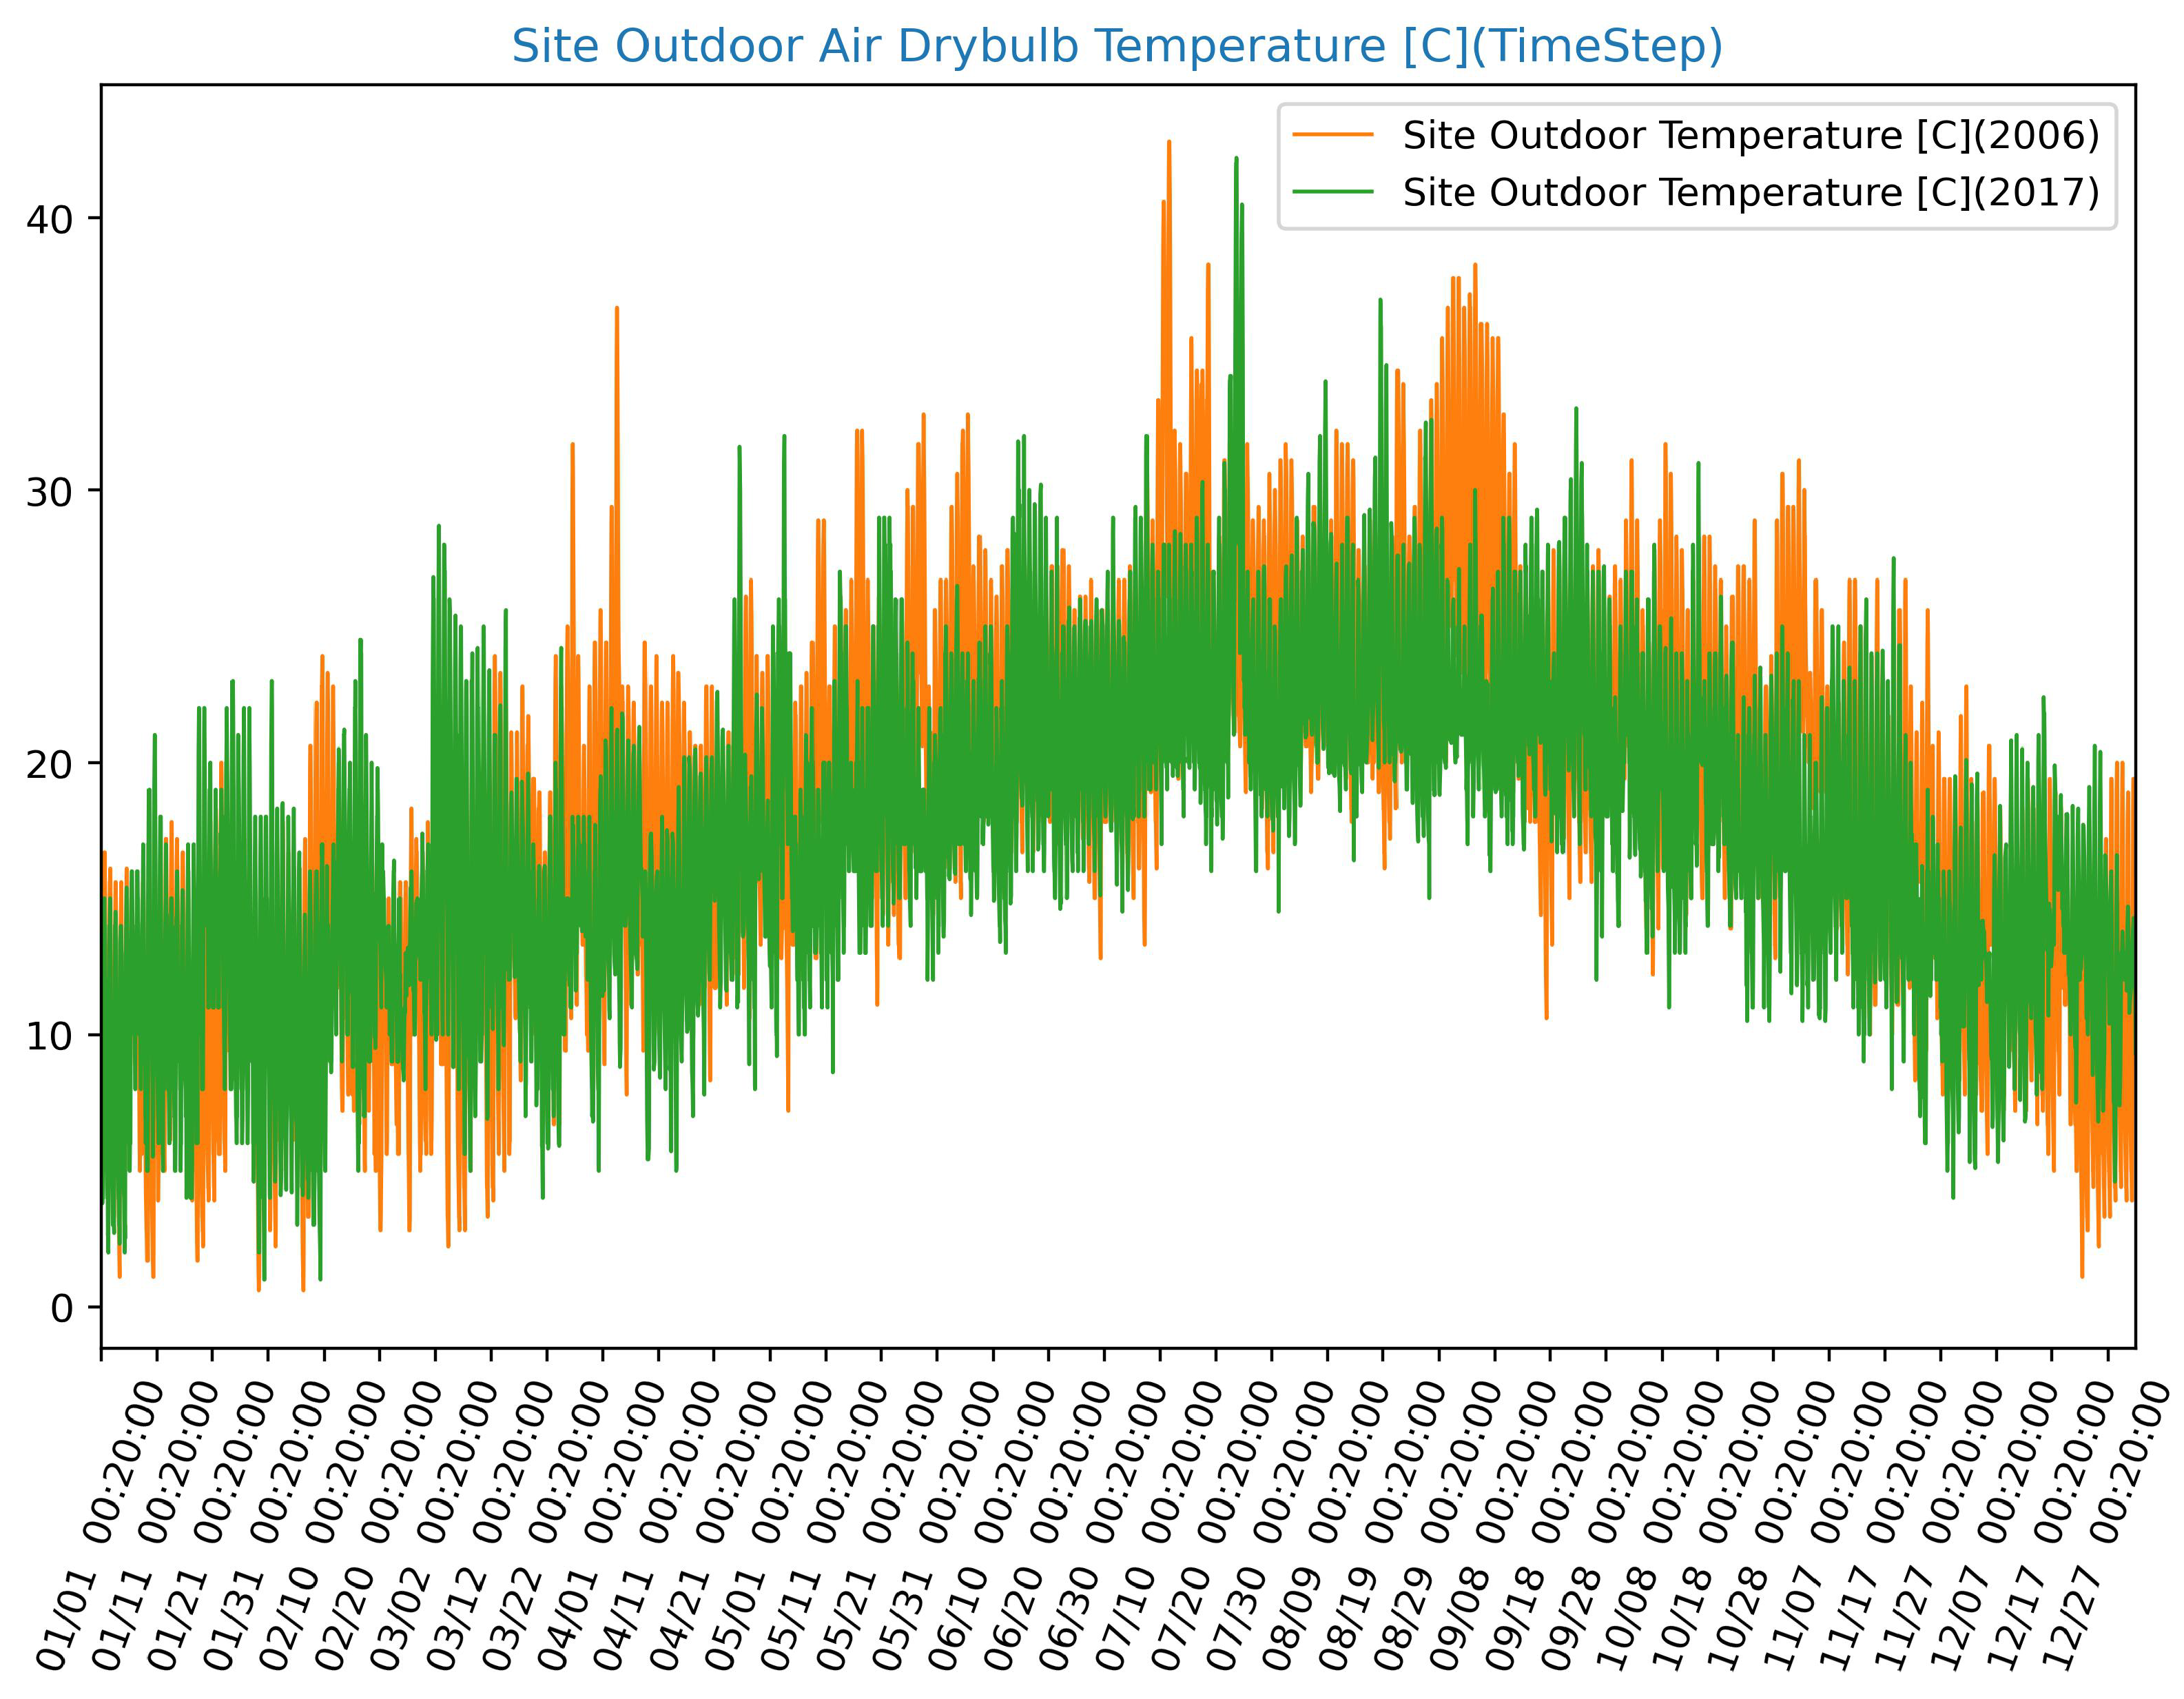
4. Results
5. Discussion
6. Conclusions
Author Contributions
Funding
Institutional Review Board Statement
Informed Consent Statement
Data Availability Statement
Conflicts of Interest
Abbreviations
| ACH | Air Changes per Hour |
| AI | Artificial Intelligence |
| AMEE | Moroccan Agency for Energy Efficiency |
| ANN | Artificial Neural Network |
| DNN | Deep Neural Network |
| DTS | Dynamic Thermal Simulation |
| EPMPC | EnergyPlus Model Predictive Control |
| FPGA | Field-Programmable Gate Arrays |
| GA | Genetic Algorithm |
| HVAC | Heating, Ventilation, and Air Conditioning |
| IoT | Internet of Things |
| IpOpt | Interior Point Optimizer |
| MA-CWSC | Multi-Agent Cooling Water System Control |
| ML | Machine Learning |
| MPC | Model Predictive Control |
| MSE | Mean Squared Error |
| NLP | Nonlinear Programming |
| NMPC | Nonlinear Model Predictive Control |
| NNMPC | Neural Network Model Predictive Control |
| NZEB | Nearly Zero-Energy Building |
| PID | Proportional Integral Derivative |
| PMV | Predicted Mean Vote |
| PPD | Predicted Percentage Dissatisfied |
| RMSE | Root Mean Squared Error |
| RTCM | Reglement Thermique de Construction au Maroc |
| Thermal regulations for construction in Morocco | |
| SMC | Sliding Mode Control |
References
- Final Energy Consumption of Buildings Relative to Other Sectors. Charts—Data & Statistics. 2022. Available online: https://www.iea.org/data-and-statistics/charts/final-energy-consumption-of-buildings-relative-to-other-sectors-2022 (accessed on 9 November 2023).
- AMEE. Energy Efficiency in Buildings. Available online: https://www.amee.ma/en/node/118 (accessed on 8 April 2022).
- Ioannou, A.; Itard, L. Energy performance and comfort in residential buildings: Sensitivity for building parameters and occupancy. Energy Build. 2015, 92, 216–233. [Google Scholar] [CrossRef]
- Irshad, A.S.; Noori, A.G. Evaluating the effects of passive cooling and heating techniques on building energy consumption in Kandahar using CLTD method. Mater. Today Proc. 2022, 57, 595–602. [Google Scholar] [CrossRef]
- Yoon, Y.; Seo, B.; Cho, S. Potential Cooling Energy Savings of Economizer Control and Artificial-Neural-Network-Based Air-Handling Unit Discharge Air Temperature Control for Commercial Building. Buildings 2023, 13, 1174. [Google Scholar] [CrossRef]
- De Sousa, M.; Muhieldeen, M.W.; Lau, J.; Tey, W.Y.; Hou, T.K.; Rahman, U.Z.A. Polyethylene Bubble Aluminium SB250-FR+ for Reduced Energy Consumption Building: An Experimental Study. In Technological Advancement in Mechanical and Automotive Engineering; Ismail, M.Y., Mohd Sani, M.S., Kumarasamy, S., Hamidi, M.A., Shaari, M.S., Eds.; Springer Nature: Singapore, 2023; pp. 685–693. [Google Scholar] [CrossRef]
- Hadini, M.H.; Dewi, O.C.; Putra, N.S.D.; Hanjani, T. Heat gain reduction and cooling energy minimization through building envelope material. ARTEKS J. Tek. Arsit. 2023, 8, 73–82. [Google Scholar] [CrossRef]
- Taher, R.; Abdelkader, W.A.; Fahim, A.A.A. Sustainable Building: To Achieve Thermal Comfort in Highly Glazed Buildings Using Smart Glass. In Proceedings of the Visions for Future Cities (VFC-2022), Cairo, Egypt, 23–25 September 2022; Volume 1113, p. 012021. [Google Scholar] [CrossRef]
- Boyano, A.; Hernandez, P.; Wolf, O. Energy demands and potential savings in European office buildings: Case studies based on EnergyPlus simulations. Energy Build. 2013, 65, 19–28. [Google Scholar] [CrossRef]
- Pérez-Lombard, L.; Ortiz, J.; Pout, C. A review on buildings energy consumption information. Energy Build. 2008, 40, 394–398. [Google Scholar] [CrossRef]
- Yilmaz, I. An Automated Building Energy Model Calibration Workflow to Improve Indoor Climate Controls. Master’s Thesis, Carleton University, Ottawa, ON, Canada, 2022. [Google Scholar] [CrossRef]
- Wang, S.; Xu, X. Simplified building model for transient thermal performance estimation using GA-based parameter identification. Int. J. Therm. Sci. 2006, 45, 419–432. [Google Scholar] [CrossRef]
- Agouzoul, A.; Simeu, E.; Tabaa, M. Synthesis of model predictive control based on neural network for energy consumption enhancement in building. AEU Int. J. Electron. Commun. 2024, 173, 155021. [Google Scholar] [CrossRef]
- Foucquier, A.; Robert, S.; Suard, F.; Stéphan, L.; Jay, A. State of the art in building modelling and energy performances prediction: A review. Renew. Sustain. Energy Rev. 2013, 23, 272–288. [Google Scholar] [CrossRef]
- Bahramnia, P.; Hosseini Rostami, S.M.; Wang, J.; Kim, G.J. Modeling and Controlling of Temperature and Humidity in Building Heating, Ventilating, and Air Conditioning System Using Model Predictive Control. Energies 2019, 12, 4805. [Google Scholar] [CrossRef]
- Bastida, H.; Ugalde-Loo, C.E.; Abeysekera, M.; Qadrdan, M.; Wu, J. Thermal Dynamic Modelling and Temperature Controller Design for a House. Energy Procedia 2019, 158, 2800–2805. [Google Scholar] [CrossRef]
- Ogunsola, O.T.; Song, L. Application of a simplified thermal network model for real-time thermal load estimation. Energy Build. 2015, 96, 309–318. [Google Scholar] [CrossRef]
- Tol, H.İ.; Madessa, H.B. Development of a white-box dynamic building thermal model integrated with a heating system. J. Build. Eng. 2023, 68, 106038. [Google Scholar] [CrossRef]
- Ding, L.; Wang, G.; Song, L. Development, calibration, and validation of a novel gray-box energy model for residential split air conditioners. Energy Build. 2023, 295, 113271. [Google Scholar] [CrossRef]
- Li, X.; Wen, J. Review of building energy modeling for control and operation. Renew. Sustain. Energy Rev. 2014, 37, 517–537. [Google Scholar] [CrossRef]
- Shabani, A.; Dhamo, L.; Zavalani, O. Modelling Building Energy Systems using Electric Circuit Analogy. Eur. J. Electr. Eng. Comput. Sci. 2023, 7, 56–61. [Google Scholar] [CrossRef]
- Hua, L.; Tang, J.; Dourra, H.; Zhu, G. A Gray-Box Surrogate Vehicle Energy Consumption Model Capable of Real-Time Updating. IEEE ASME Trans. Mechatron. 2023, 28, 2092–2100. [Google Scholar] [CrossRef]
- Gouda, M.; Danaher, S.; Underwood, C. Application of an Artificial Neural Network for Modelling the Thermal Dynamics of a Building’s Space and its Heating System. Math. Comput. Model. Dyn. Syst. 2002, 8, 333–344. [Google Scholar] [CrossRef]
- Guyot, D.; Giraud, F.; Simon, F.; Corgier, D.; Marvillet, C.; Tremeac, B. Overview of the use of artificial neural networks for energy-related applications in the building sector. Int. J. Energy Res. 2019, 43, 6680–6720. [Google Scholar] [CrossRef]
- Chen, Y.; Norford, L.K.; Samuelson, H.W.; Malkawi, A. Optimal control of HVAC and window systems for natural ventilation through reinforcement learning. Energy Build. 2018, 169, 195–205. [Google Scholar] [CrossRef]
- Balali, Y.; Chong, A.; Busch, A.; O’Keefe, S. Energy modelling and control of building heating and cooling systems with data-driven and hybrid models—A review. Renew. Sustain. Energy Rev. 2023, 183, 113496. [Google Scholar] [CrossRef]
- Qin, H.; Yu, Z.; Li, T.; Liu, X.; Li, L. Heating Control Strategy Based on Dynamic Programming for Building Energy Saving and Emission Reduction. Int. J. Environ. Res. Public Health 2022, 19, 14137. [Google Scholar] [CrossRef] [PubMed]
- Fu, Q.; Chen, X.; Ma, S.; Fang, N.; Xing, B.; Chen, J. Optimal control method of HVAC based on multi-agent deep reinforcement learning. Energy Build. 2022, 270, 112284. [Google Scholar] [CrossRef]
- Esmaeilzadeh, A.; Deal, B.; Yousefi-Koma, A.; Zakerzadeh, M.R. How Multi-Criterion Optimized Control Methods Improve Effectiveness of Multi-Zone Building Heating System Upgrading. Energies 2022, 15, 8675. [Google Scholar] [CrossRef]
- Abderrahmane, J.; Sauter, D.; Alami, K.; Brahim, C.; Abdellah, A. Model Predictive Control (MPC) for Building Optimal Temperature Control. In Proceedings of the 2nd International Conference on Smart Applications and Data Analysis for Smart Cities, Casablanca, Morocco, 27–28 February 2018. [Google Scholar] [CrossRef]
- Richalet, J.; Rault, A.; Testud, J.; Papon, J. Model algorithmic control of industrial processes. IFAC Proc. Vol. 1977, 10, 103–120. [Google Scholar] [CrossRef]
- Richalet, J.; Rault, A.; Testud, J.; Papon, J. Model predictive heuristic control. Automatica 1978, 14, 413–428. [Google Scholar] [CrossRef]
- Yang, S.; Wan, M.P.; Chen, W.; Ng, B.F.; Dubey, S. Model predictive control with adaptive machine-learning-based model for building energy efficiency and comfort optimization. Appl. Energy 2020, 271, 115147. [Google Scholar] [CrossRef]
- Ferrarini, L.; Rastegarpour, S. Neural network predictive schemes for building temperature control: A comparative study. In Proceedings of the 2022 IEEE 18th International Conference on Automation Science and Engineering (CASE), Mexico City, Mexico, 20–24 August 2022; pp. 1274–1280. [Google Scholar] [CrossRef]
- Eini, R.; Abdelwahed, S. A Neural Network-based Model Predictive Control Approach for Buildings Comfort Management. In Proceedings of the 2020 IEEE International Smart Cities Conference (ISC2), Piscataway, NJ, USA, 28 September–1 October 2020; pp. 1–7. [Google Scholar] [CrossRef]
- Chen, X.; Wang, Q.; Srebric, J. Model predictive control for indoor thermal comfort and energy optimization using occupant feedback. Energy Build. 2015, 102, 357–369. [Google Scholar] [CrossRef]
- Bălan, R.; Cooper, J.; Chao, K.M.; Stan, S.; Donca, R. Parameter identification and model based predictive control of temperature inside a house. Energy Build. 2011, 43, 748–758. [Google Scholar] [CrossRef]
- Álvarez, J.; Redondo, J.; Camponogara, E.; Normey-Rico, J.; Berenguel, M.; Ortigosa, P. Optimizing building comfort temperature regulation via model predictive control. Energy Build. 2013, 57, 361–372. [Google Scholar] [CrossRef]
- Eini, R.; Abdelwahed, S. Learning-based Model Predictive Control for Smart Building Thermal Management. In Proceedings of the 2019 IEEE 16th International Conference on Smart Cities: Improving Quality of Life Using ICT & IoT and AI (HONET-ICT), Charlotte, NC, USA, 6–9 October 2019; pp. 38–42. [Google Scholar] [CrossRef]
- Yadav, Y.; Kowli, A. Data-driven simulation for energy and local comfort optimization: Case study of a laboratory. J. Build. Eng. 2022, 54, 104612. [Google Scholar] [CrossRef]
- Ma, G.; Liu, Y.; Shang, S. A Building Information Model (BIM) and Artificial Neural Network (ANN) Based System for Personal Thermal Comfort Evaluation and Energy Efficient Design of Interior Space. Sustainability 2019, 11, 4972. [Google Scholar] [CrossRef]
- Hagan, M.T.; Demuth, H.B.; Jesús, O.D. An introduction to the use of neural networks in control systems. Int. J. Robust Nonlinear Control 2002, 12, 959–985. [Google Scholar] [CrossRef]
- Patan, K. Robust and Fault-Tolerant Control; Neural-Network-Based Solutions, Studies in Systems, Decision and Control; Springer: Cham, Switzerland, 2019; Volume 197. [Google Scholar] [CrossRef]
- Shahin, M.A.; Maier, H.R.; Jaksa, M.B. Data Division for Developing Neural Networks Applied to Geotechnical Engineering. J. Comput. Civ. Eng. 2004, 18, 105–114. [Google Scholar] [CrossRef]
- Wang, B.; Jiao, J.; Xue, Z. Implementation of Continuous Control Set Model Predictive Control Method for PMSM on FPGA. IEEE Access 2023, 11, 12414–12425. [Google Scholar] [CrossRef]
- Babojelic, R.; Belina, B.V.; Iles, S.; Matusko, J. FPGA Implementation of Set-based Model Predictive Control. In Proceedings of the 2022 45th Jubilee International Convention on Information, Communication and Electronic Technology (MIPRO), Opatija, Croatia, 23–27 May 2022; pp. 147–152. [Google Scholar] [CrossRef]
- Dong, F.; Li, X.; You, K.; Song, S. Standoff Tracking Using DNN-Based MPC With Implementation on FPGA. IEEE Trans. Control. Syst. Technol. 2023, 31, 1998–2010. [Google Scholar] [CrossRef]
- Singh, V.K.; Tripathi, R.N.; Hanamoto, T. Implementation Strategy for Resource Optimization of FPGA-Based Adaptive Finite Control Set-MPC Using XSG for a VSI System. IEEE J. Emerg. Sel. Top. Power Electron. 2021, 9, 2066–2078. [Google Scholar] [CrossRef]
- Jeong, M.; Fuchs, S.; Biela, J. When FPGAs Meet Regionless Explicit MPC: An Implementation of Long-horizon Linear MPC for Power Electronic Systems. In Proceedings of the IECON 2020 The 46th Annual Conference of the IEEE Industrial Electronics Society, Singapore, 18–21 October 2020; pp. 3085–3092. [Google Scholar] [CrossRef]
- Wächter, A.; Biegler, L.T. On the implementation of an interior-point filter line-search algorithm for large-scale nonlinear programming. Math. Program. 2006, 106, 25–57. [Google Scholar] [CrossRef]
- Andersson, J.A.E.; Gillis, J.; Horn, G.; Rawlings, J.B.; Diehl, M. CasADi: A software framework for nonlinear optimization and optimal control. Math. Program. Comput. 2019, 11, 1–36. [Google Scholar] [CrossRef]
- Thermique_maroc. Available online: https://www.amee.ma/sites/default/files/inline-files/Le%20reglement%20thermique.pdf (accessed on 8 April 2022).
- Fanger, P.O. Calculation of thermal comfort: Introduction of a basic comfort equation. ASHRAE Trans. Part II 1967, 73, III4.1–III4.20. [Google Scholar]
- Fanger, P.O. Thermal Comfort. Analysis and Applications in Environmental Engineering; Danish Technical Press: Copenhagen, Denmark, 1970. [Google Scholar]
- Li, B.; Yao, R.; Wang, Q.; Pan, Y. An introduction to the Chinese Evaluation Standard for the indoor thermal environment. Energy Build. 2014, 82, 27–36. [Google Scholar] [CrossRef]
- Dyvia, H.A.; Arif, C. Analysis of thermal comfort with predicted mean vote (PMV) index using artificial neural network. In Proceedings of the 1st International Seminar on Civil and Environmental Engineering: “Robust Infrastructure Resilient to Natural Disaster”, Online, 2–4 November 2020; Volume 622, p. 012019. [Google Scholar] [CrossRef]
- Zhao, J.; Lam, K.P.; Ydstie, B.E.; Karaguzel, O.T. EnergyPlus model-based predictive control within design–build–operate energy information modelling infrastructure. J. Build. Perform. Simul. 2015, 8, 121–134. [Google Scholar] [CrossRef]
- Aruta, G.; Ascione, F.; Bianco, N.; Mauro, G.M.; Vanoli, G.P. Optimizing heating operation via GA- and ANN-based model predictive control: Concept for a real nearly-zero energy building. Energy Build. 2023, 292, 113139. [Google Scholar] [CrossRef]
- Ferreira, P.; Ruano, A.; Silva, S.; Conceição, E. Neural networks based predictive control for thermal comfort and energy savings in public buildings. Energy Build. 2012, 55, 238–251. [Google Scholar] [CrossRef]
- Jazizadeh, F.; Ghahramani, A.; Becerik-Gerber, B.; Kichkaylo, T.; Orosz, M. User-led decentralized thermal comfort driven HVAC operations for improved efficiency in office buildings. Energy Build. 2014, 70, 398–410. [Google Scholar] [CrossRef]
- Naseem, T.; Javed, A.; Hamayun, M.T.; Jawad, M.; Ansari, E.A.; Fayyaz, M.A.B.; Ansari, A.R.; Nawaz, R. Design of an EnergyPlus Model-Based Smart Controller for Maintaining Thermal Comfortable Environment in Non-Domestic Building. IEEE Access 2023, 11, 33134–33147. [Google Scholar] [CrossRef]
- Dong, B.; Lam, K.P. A real-time model predictive control for building heating and cooling systems based on the occupancy behavior pattern detection and local weather forecasting. Build. Simul. 2014, 7, 89–106. [Google Scholar] [CrossRef]
- Mohamed AlQadi, R.A.; Zaghloul, A.; Taie, S.A. An occupancy-based strategy employing computer vision for reducing cooling energy consumed in buildings. Bull. Electr. Eng. Inform. 2021, 10, 1729–1738. [Google Scholar] [CrossRef]
- Boudier, K.; Hoffmann, S. Analysis of the Potential of Decentralized Heating and Cooling Systems to Improve Thermal Comfort and Reduce Energy Consumption through an Adaptive Building Controller. Energies 2022, 15, 1100. [Google Scholar] [CrossRef]


| Heating | Cooling | |||||||
|---|---|---|---|---|---|---|---|---|
| NNMPC (kWh) | On/Off (kWh) | Savings (%) | NNMPC (kWh) | On/Off (kWh) | Savings (%) | |||
| 2006 | PYNQ | January | 78.64 | 119.88 | 34.40 | 0.00 | 0.00 | - |
| February | 50.61 | 83.21 | 39.18 | 0.00 | 0.00 | - | ||
| March | 21.12 | 38.60 | 45.29 | 0.00 | 0.00 | - | ||
| April | 34.01 | 59.46 | 42.80 | 0.00 | 0.00 | - | ||
| May | 1.71 | 5.51 | 69.00 | 0.00 | 0.00 | - | ||
| June | 0.00 | 0.00 | - | 1.08 | 3.06 | 64.60 | ||
| July | 0.00 | 0.00 | - | 33.09 | 58.11 | 43.05 | ||
| August | 0.00 | 0.00 | - | 61.50 | 93.96 | 34.55 | ||
| September | 0.00 | 0.00 | - | 80.65 | 113.62 | 29.02 | ||
| October | 0.00 | 0.00 | - | 30.67 | 58.76 | 47.80 | ||
| November | 7.23 | 15.12 | 52.19 | 14.86 | 29.03 | 48.81 | ||
| December | 46.72 | 83.53 | 44.07 | 0.00 | 0.00 | - | ||
| Total | 240.04 | 405.31 | 40.78 | 221.86 | 356.54 | 37.77 | ||
| Desktop | January | 78.59 | 119.88 | 34.44 | 0.00 | 0.00 | - | |
| February | 50.61 | 83.21 | 39.18 | 0.00 | 0.00 | - | ||
| March | 21.10 | 38.60 | 45.33 | 0.00 | 0.00 | - | ||
| April | 34.08 | 59.46 | 42.69 | 0.00 | 0.00 | - | ||
| May | 1.72 | 5.51 | 68.78 | 0.00 | 0.00 | - | ||
| June | 0.00 | 0.00 | - | 1.07 | 3.06 | 64.95 | ||
| July | 0.00 | 0.00 | - | 33.09 | 58.11 | 43.05 | ||
| August | 0.00 | 0.00 | - | 61.50 | 93.96 | 34.55 | ||
| September | 0.00 | 0.00 | - | 80.65 | 113.62 | 29.02 | ||
| October | 0.00 | 0.00 | - | 30.67 | 58.76 | 47.80 | ||
| November | 7.23 | 15.12 | 52.19 | 14.86 | 29.03 | 48.81 | ||
| December | 46.72 | 83.53 | 44.07 | 0.00 | 0.00 | - | ||
| Total | 240.04 | 405.31 | 40.78 | 221.85 | 356.54 | 37.78 | ||
| 2017 | PYNQ | January | 188.74 | 238.40 | 20.83 | 0.00 | 0.00 | - |
| February | 119.01 | 156.38 | 23.90 | 0.00 | 0.00 | - | ||
| March | 70.00 | 100.48 | 30.34 | 0.00 | 0.00 | - | ||
| April | 4.64 | 10.95 | 57.57 | 0.00 | 0.00 | - | ||
| May | 2.12 | 5.06 | 58.02 | 0.00 | 0.00 | - | ||
| June | 0.00 | 0.00 | - | 0.00 | 0.00 | - | ||
| July | 0.00 | 0.00 | - | 42.31 | 67.83 | 37.61 | ||
| August | 0.00 | 0.00 | - | 58.95 | 90.80 | 35.08 | ||
| September | 0.00 | 0.00 | - | 139.65 | 173.93 | 19.71 | ||
| October | 0.00 | 0.00 | - | 95.65 | 134.53 | 28.90 | ||
| November | 0.03 | 0.00 | - | 33.23 | 52.35 | 36.53 | ||
| December | 80.34 | 113.58 | 29.27 | 0.00 | 0.00 | - | ||
| Total | 464.89 | 624.86 | 25.60 | 369.78 | 519.43 | 28.81 | ||
| Desktop | January | 188.68 | 238.40 | 20.86 | 0.00 | 0.00 | - | |
| February | 119.08 | 156.38 | 23.85 | 0.00 | 0.00 | - | ||
| March | 69.99 | 100.48 | 30.35 | 0.00 | 0.00 | - | ||
| April | 4.63 | 10.95 | 57.71 | 0.00 | 0.00 | - | ||
| May | 2.12 | 5.06 | 58.03 | 0.00 | 0.00 | - | ||
| June | 0.00 | 0.00 | - | 0.00 | 0.00 | - | ||
| July | 0.00 | 0.00 | - | 42.31 | 67.83 | 37.62 | ||
| August | 0.00 | 0.00 | - | 58.87 | 90.80 | 35.17 | ||
| September | 0.00 | 0.00 | - | 139.86 | 173.93 | 19.59 | ||
| October | 0.00 | 0.00 | - | 95.66 | 134.53 | 28.89 | ||
| November | 0.03 | 0.00 | - | 33.11 | 52.35 | 36.75 | ||
| December | 80.47 | 113.58 | 29.16 | 0.00 | 0.00 | - | ||
| Total | 465.01 | 624.86 | 25.58 | 369.81 | 519.43 | 28.80 | ||
| NNMPC (%) | On/Off (%) | |||
|---|---|---|---|---|
| PYNQ | Desktop | Desktop | ||
| 2006 | −3.0 < PMV < −1.0 | 0.00 | 0.00 | 0.00 |
| −1.0 < PMV < −0.5 | 0.00 | 0.00 | 0.00 | |
| −0.5 < PMV < 0.5 | 72.35 | 72.45 | 83.75 | |
| 0.5 < PMV < 1.0 | 27.14 | 27.04 | 16.07 | |
| 1.0 < PMV < 3.0 | 0.51 | 0.51 | 0.17 | |
| 2017 | −3.0 < PMV < −1.0 | 0.00 | 0.00 | 0.00 |
| −1.0 < PMV < −0.5 | 0.20 | 0.20 | 0.22 | |
| −0.5 < PMV < 0.5 | 64.98 | 65.06 | 76.77 | |
| 0.5 < PMV < 1.0 | 32.80 | 32.75 | 22.50 | |
| 1.0 < PMV < 3.0 | 2.01 | 2.00 | 0.51 | |
| PMV | ||||
|---|---|---|---|---|
| NNMPC | On/Off | |||
| PYNQ | Desktop | Desktop | ||
| 2006 | Max | 1.26 | 1.26 | 1.11 |
| Min | −0.48 | −0.43 | −0.49 | |
| 2017 | Max | 1.34 | 1.34 | 1.27 |
| Min | −0.81 | −0.81 | −0.83 | |
| Study | Objectives | Methods | Results |
|---|---|---|---|
| Bastida et al. [16] | Temperature regulation. | PI controller. | 8% energy savings for heating. |
| Zhao et al. [57] | Improved energy consumption with maintained thermal comfort. | EnergyPlus MPC. | Substantial energy reductions (28.9% heating, 2.7% cooling). |
| Aruta et al. [58] | Enhance energy efficiency. Minimize heating energy costs based on weather forecasts. | MPC with ANNs and ML. | Significant daily energy savings of 26% for heating. |
| Yang et al. [33] | Emphasize performance building automation. | MPC with adaptive system based on ML. | Substantial savings in cooling energy (58.5% in the office, 36.7% in the lecture theater). |
| Ferreira et al. [59] | Implement radial basis function neural networks for thermal comfort and energy savings. | Radial basis function neural networks. | Estimated energy savings exceeding 50%. |
| Jazizadeh et al. [60] | Develop a comprehensive framework for enhancing occupants’ thermal comfort using a participatory sensing approach. | Fuzzy predictive model. | 39% reduction in daily average airflow rates. |
| Naseem et al. [61] | Compare EnergyPlus MPC, the basic On/Off strategy, and SMC. | EnergyPlus MPC, Sliding Mode Control. | In the summer, MPC used 14.67% less energy than a basic On/Off system controller and saved 11.94% more energy than SMC. In the winter, the MPC used 19.89% less energy than SMC and 17.20% less than the On/Off controller. |
| Dong et al. [62] | Reduce energy consumption. | NMPC. | Measured energy reductions (30.1% in heating, 17.8% in cooling). |
| Mohamed Alqadi et al. [63] | Reduce cooling energy consumption. | Occupancy-based strategy. | Noteworthy 59% reduction in energy consumption. |
| Boudier et al. [64] | Reductions in energy consumption. | Adaptive controller. | Achieved reductions in energy consumption (12.5% in winter, 15.3% in summer). |
| Qin et al. [27] | Achieve building energy savings. | Dynamic programming. | 35.1% reduction in energy consumption and emissions. |
| Fu et al. [28] | Optimize building’s cooling water system. | Multi-agent deep reinforcement learning. | 11.1% improvement compared to rule-based control. |
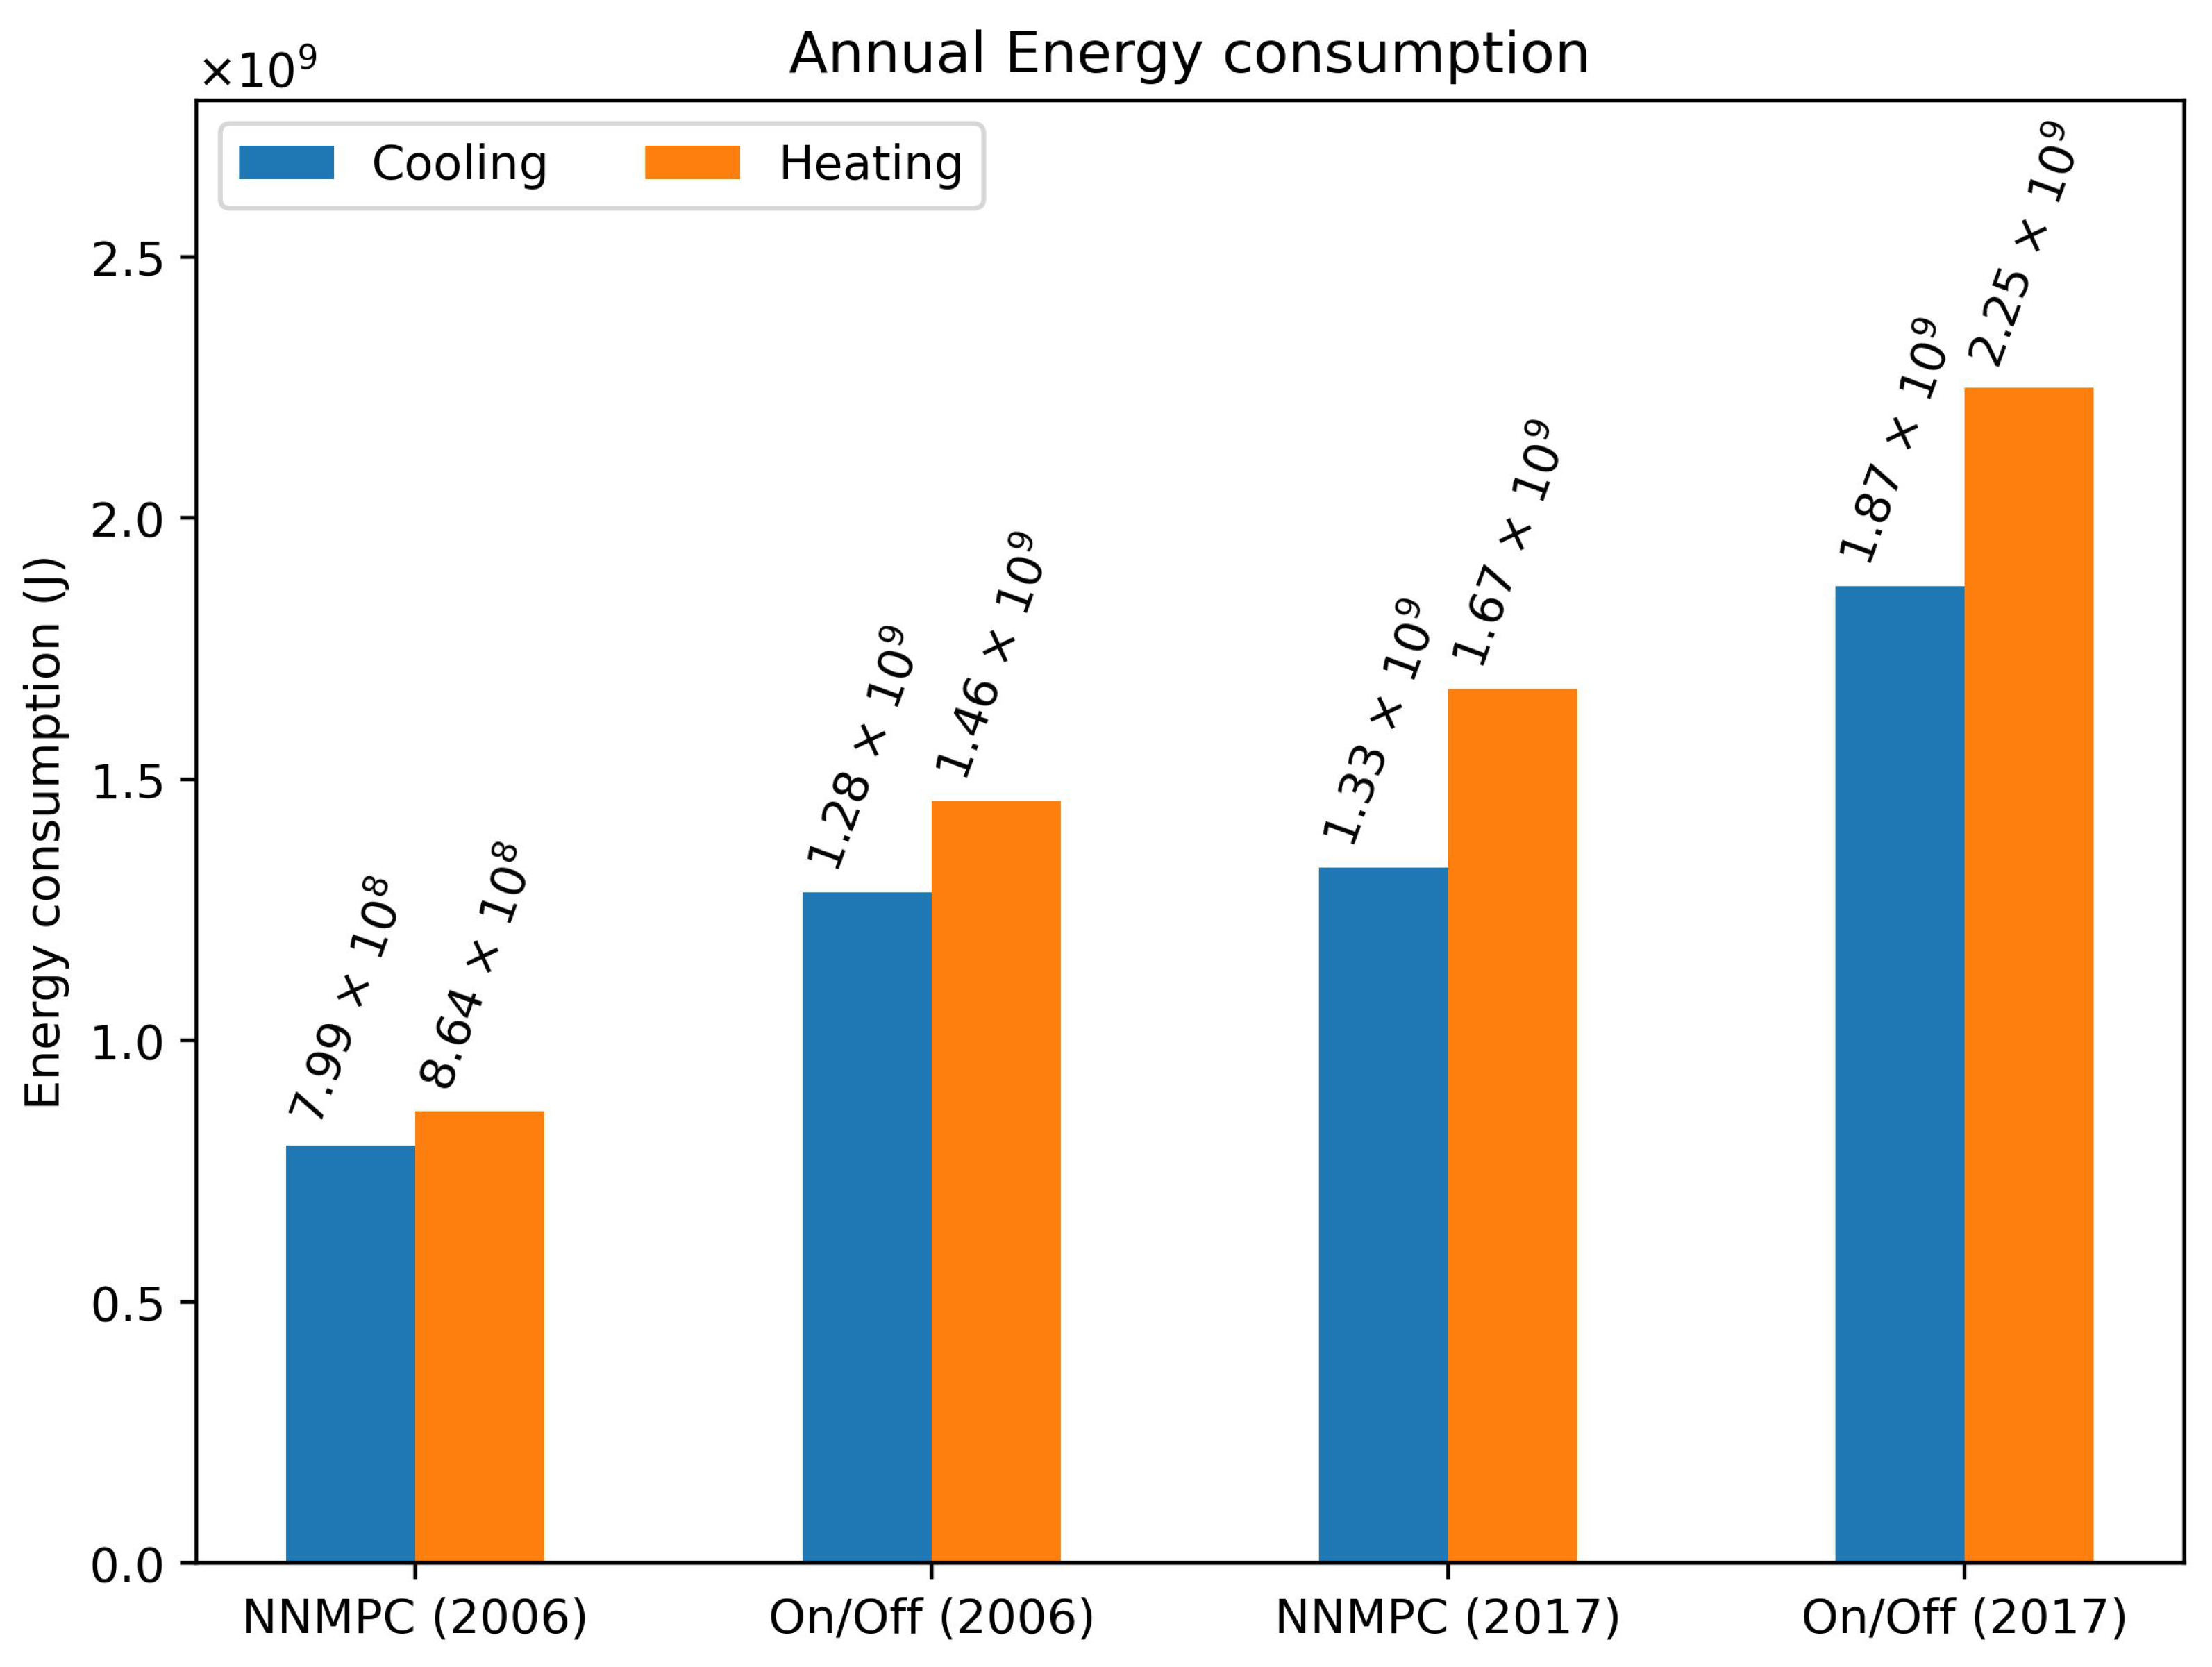
| Present study | Improve energy consumption with maintained thermal comfort. Optimize the building’s cooling and heating system. Reduce energy consumption. | NNMPC. | Year 2006, an annual reduction in heating energy consumption of 40.8% and 37.8% for cooling energy consumption when compared to conventional On/Off control techniques. Year 2017, an annual reduction in cooling energy consumption of 28.8% and 25.6% for heating energy needs when compared to conventional On/Off control techniques. |
Disclaimer/Publisher’s Note: The statements, opinions and data contained in all publications are solely those of the individual author(s) and contributor(s) and not of MDPI and/or the editor(s). MDPI and/or the editor(s) disclaim responsibility for any injury to people or property resulting from any ideas, methods, instructions or products referred to in the content. |
© 2024 by the authors. Licensee MDPI, Basel, Switzerland. This article is an open access article distributed under the terms and conditions of the Creative Commons Attribution (CC BY) license (https://creativecommons.org/licenses/by/4.0/).
Share and Cite
Agouzoul, A.; Simeu, E.; Tabaa, M. Advancing Sustainable Building Practices: Intelligent Methods for Enhancing Heating and Cooling Energy Efficiency. Sustainability 2024, 16, 2879. https://doi.org/10.3390/su16072879
Agouzoul A, Simeu E, Tabaa M. Advancing Sustainable Building Practices: Intelligent Methods for Enhancing Heating and Cooling Energy Efficiency. Sustainability. 2024; 16(7):2879. https://doi.org/10.3390/su16072879
Chicago/Turabian StyleAgouzoul, Abdelali, Emmanuel Simeu, and Mohamed Tabaa. 2024. "Advancing Sustainable Building Practices: Intelligent Methods for Enhancing Heating and Cooling Energy Efficiency" Sustainability 16, no. 7: 2879. https://doi.org/10.3390/su16072879
APA StyleAgouzoul, A., Simeu, E., & Tabaa, M. (2024). Advancing Sustainable Building Practices: Intelligent Methods for Enhancing Heating and Cooling Energy Efficiency. Sustainability, 16(7), 2879. https://doi.org/10.3390/su16072879