Abstract
Urbanization is one of the most visible symptoms of global changes. This process has been driven by the evolution of life on Earth, and it gradually modifies the structure of land use. Urban development is the most apparent indicator and measure of urbanization. The demand for vacant land and sustainable spatial development plans require new methods that support decision-making in the process of changing land use in suburban areas. The aim of this study was to describe a methodology for identifying and localizing urban development boundaries with the use of fuzzy set theory, to evaluate the degree of urbanization, and to analyze the dynamics of land-use changes in areas subjected to direct urbanization pressure with the use of photogrammetric data for 2005, 2010, 2017, and 2022. A case study was conducted in the Polish city of Olsztyn. The study’s results determined the degree of urbanization of the areas in the [0, 1] range, as well as the dynamics of change in each of the twenty-four adopted forms of land use. The results indicate that the proposed methods are useful for identifying the rate and direction of urbanization, and can be applied to optimize and counterbalance the development of settlements and infrastructure.
1. Introduction
Urbanization embodies a cultural and societal evolution that propels the advancement of urban centers, expands the count and expanse of urban communities, fosters the aggregation of inhabitants in cities and their proximate environs, and advocates for the assimilation of urban norms and traditions [1]. At present, urbanization is regarded as a multidimensional complex of economic, social, demographic, cultural, and spatial processes and phenomena. It leads to an increase in the number of cities and the urban population, the concentration of the population in urban areas and their spatial development, and the concentration of commercial and administrative activities. It increases the significance of cities, shapes cultural patterns characteristic of the urban lifestyle, and promotes the development of urban landscapes and architectural patterns [2]. Urbanization is one of the most visible symptoms of global changes. It induces profound changes in space and gradually modifies the land-use structure. It is a diffusion process extending outward from urban centers to surrounding peripheries. The modifications in land-use patterns within these peripheral areas serve as the most conspicuous sign and metric of urban growth.
Urbanization is a highly complex process usually examined in several dimensions, including demographic, social, economic, and spatial [3]. In the spatial context, urbanization is a process that leads to the expansion of the urban landscape, an increase in urban development, and the diffusion of infrastructure and urban-like development in rural areas [4]. In rural and suburban areas, spatial changes induce changes in land use [5]. The rural regions’ layout and buildings’ appearance undergo alteration while technical infrastructure undergoes modernization [6]. Consequently, the spatial aspect of urbanization manifests itself in both urban and rural settings [7]. Rural regions, especially those bordering cities, draw the attention of urban dwellers and undergo continuous transformation [8]. Typically, these processes are characterized by high dynamism, resulting in swift alterations as they reconfigure spatial structures and foster advanced suburbanization and exurbanization [9]. In the literature, these processes are referred to as urban sprawl, namely the rapid expansion of the geographic extent of large cities [10]. Urban sprawl is driven by the socio-economic changes that accompany the rapid and chaotic growth of cities [11]. This occurrence is frequently assessed through the population density gradient (representing the percentage decline in population density with distance from the urban center) [12] or the magnitude of an urban zone [13]. Examination of these factors reveals that the expansion of urban areas surpasses the growth rate of the urban population [14].
One of the phenomena associated with uncontrolled urbanization is suburbanization, which contributes to the emergence of chaotic urban development far away from city boundaries [15]. Suburbanization is a common and an undesirable phenomenon because it compromises the quality of the resulting space [16]. In most cases, areas that are subjected to suburbanization have poor access to technical infrastructure, which increases the costs associated with commuting to work and accessing services in cities [17]. Urban development significantly affects areas at the interface between urban and rural land use, where different land uses overlap [18]. These land-use changes generate an area at the urban–rural boundary that, due to its complex (indeterminate, fuzzy) land use, cannot be uniquely identified as either urban or rural. This area is referred to as an urban–rural transition zone and is characterized by a high alternation of functions over time, and by changes in the forms and uses of individual fragments of land [19]. The transition zone arises as a result of the search for new locations for housing and industrial units. This area can also be referred to as a contact or conflict zone between urban and rural areas [20]. In the scholarly literature, regions encountering direct urbanization pressure are denoted by terms such as the urban–rural transition zone [21,22], the rural–urban continuum [23,24,25,26,27], or the suburban area [28,29,30,31]. The research on these locales delves into incorporating new land into the urban sphere and scrutinizes shifts in land use, infrastructure development, accessibility to markets and amenities, exposure to urban industrial processes, and environmental impacts [32]. Analysis of land-use transformations also extends to the rural–urban fringe [33,34,35,36,37], which forms a verdant buffer encircling the city [35,38,39], along with regions identified as “urban villages” [40]. Moreover, areas undergoing urbanization pressure undergo assessments of their appeal to investors [41,42] based on the performance of local real estate markets [43,44,45,46,47,48]. The shortage of urban space and the resulting increase in real estate prices prompt investors to search for cheaper, attractively located plots outside city boundaries [49].
Demographic and spatial urbanization, which are closely linked, are currently receiving the most attention in ongoing research. This research is mainly based on statistics and land-use data. Photogrammetric and remote sensing data, as well as GIS tools and databases, on land cover are an important support for these studies. Photogrammetric and remote sensing products are used to generate high-resolution land cover images [50,51], identify land-use changes in urban and peri-urban areas [52], and monitor changes due to human activities [53,54]. The degree of urbanization is identified from aerial and satellite imagery, CORINE Land Cover data (CLC), High Resolution Layers data (HRL), Urban Atlas data, Night Light data (NTL), monitoring of land-use change using Landsat time series, vegetation change data, greenhouse gas emissions, or SAR radar data, among others.
Intense urban growth and its associated challenges require the use of ever newer methods to analyze, monitor, and map this phenomenon. It is also important for understanding many social, spatial, economic, and environmental problems in urban space [55]. The fuzzy nature of land use, which is particularly evident in areas under pressure from urbanization, allows fuzzy logic to be applied to the study of its intensity and dynamics [56]. This is particularly true of peripheral urban areas, the nature of which does not allow them to be clearly classified as urban or rural land. Fuzzy set theory was developed for the description of complex phenomena and poorly defined concepts that are difficult to describe with a classical mathematical model, and has been applied in many fields for more than 60 years. Fuzzy set theory is already widely used not only in industry but also in geography, ecology, agriculture, meteorology, finance, and even in philosophy and ethics [57]. Due to the fuzzy nature of some phenomena and processes, it is also increasingly used in management and space planning. Research conducted includes urban area delineation using fuzzy rule-based systems and GIS [58,59], building a decision-making system using multi-criteria analysis in environmental protection [60], assessing the sustainable use of water resources [61], and analyzing the socio-economic diversity of space using fuzzy cluster analysis [62,63].
Achieving sustainable urban progress necessitates a profound grasp of urban expansion dynamics. Hence, the primary objective of this research was to delineate a methodology for recognizing and pinpointing the limits of urban growth, employing fuzzy set theory. Research related to the identification of land-use forms on the basis of coverage using fuzzy set theory was conducted by the authors in earlier works [21,64]. A similar approach to this issue can also be found in articles [65,66,67]. Additionally, it aimed to scrutinize the pace of land-use alterations within regions facing direct urbanization pressure, utilizing photogrammetric data spanning 2005, 2010, 2017, and 2022. This methodology, as delineated, was previously crafted by the authors in an antecedent investigation [22], facilitating the identification and pinpointing of urban zones, and enabling an assessment of the degree of urbanization within the spectrum of [0, 1]. The analysis encompassed a case study conducted in the Polish city of Olsztyn. The research area was chosen because of the dynamic development observed, the specific morphology of the city, the presence of development barriers, access to photogrammetric data, and the possibility of rapid verification.
2. Materials and Methods
2.1. Study Area
The investigation utilized orthophotomaps dated 2005, 2010, 2017, and 2022, obtained from the Olsztyn City Office (Poland). Olsztyn serves as the capital city of the Warmia and Mazury Region and stands as the principal urban hub in northeastern Poland (Figure 1).
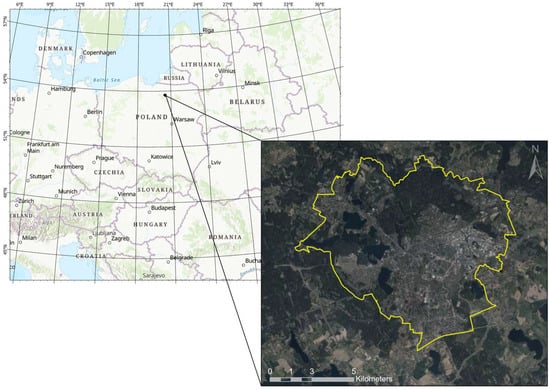
Figure 1.
Location of the study area.
Olsztyn encompasses an area of 88.33 km2 and is rich in forests, lakes, and smaller water bodies. Forests cover over 21% of the city’s land area, with the Municipal Forest being the most significant green space. Within Olsztyn’s administrative boundaries, there are 15 lakes, 13 of which exceed 1 hectare in size. Collectively, these lakes span an area of 725 hectares, constituting over 8% of the city’s total area. Natural features like lakes, forests, and rivers encircle Olsztyn in almost all directions except the southeastern part [68]. For the study’s purposes, Olsztyn was divided into 1012 hexagonal primary fields, each covering an area of 200,000 m2 (Figure 2a–d), resulting in a total study area of 202.40 km2.
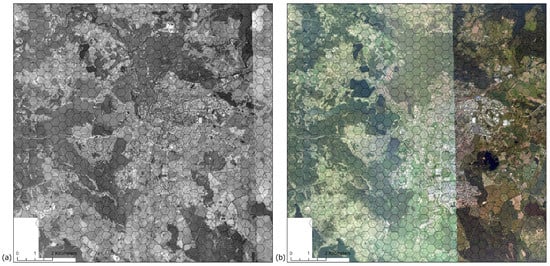
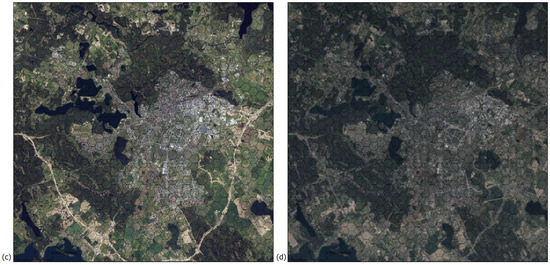
Figure 2.
Study area divided into hexagonal primary fields based on photogrammetric data for (a) 2005, (b) 2010, (c) 2017, (d) 2022.
Authors used a regular grid of hexagons, placed randomly, to eliminate problems of interpretation and comparison of results. The use of hexagons allowed the comparison of individual areas for different time periods, which would not have been possible with delineated natural surface units or existing administrative boundaries [69]. At the same time, when creating strategic studies for the development of a given space, in particular development plans, it is not necessary to refer to administrative boundaries; in fact, they are created for developmentally important fragments [70]. The utilization of hexagonal grids for analyzing land-use data, such as in urban sensing or environmental research, is multifaceted, incorporating a variety of implications. Firstly, hexagonal grids ensure uniform coverage of space, reducing spatial representation variance due to their equidistance from the center to any corner. This property is crucial for the accurate representation of spatial phenomena, particularly through interpolation. Hexagons also facilitate efficient data aggregation, minimizing distance distortion and enhancing the accuracy of summarizing spatial patterns. Compared to square grids, hexagonal grids exhibit minimized edge effects by having fewer neighbors and a shorter perimeter for the same area, thus mitigating potential data distortion at cell edges. However, alongside these benefits, certain considerations arise with the use of hexagonal grids. Challenges in interpolating or sampling data to fit a hexagonal grid might lead to significant information loss or distortion, necessitating careful consideration in the choice of hexagon size and interpolation methods. Selecting an appropriate hexagon size is crucial for balancing spatial detail with analytical efficiency. Moreover, hexagonal grids can complicate comparative analysis with studies utilizing different spatial units, requiring additional efforts for standardization. Lastly, focusing on spatial patterns might inadvertently overlook significant non-spatial factors, such as socio-economic or temporal variables, influencing the studied phenomena [71,72].
The specificity of using geometric fields for the identification of the transition zone dictated the concept of presenting the results through interpolation. The use of hexagonal grids offers the possibility to study the spatial variability of phenomena in a continuous manner, facilitating the generalization of results. This approach allows the study and drawing of conclusions about activities following land-use identification, enriching the understanding of spatial dynamics by using the geometric and computational advantages of hexagonal grids to create models that offer continuous, generalized insights into spatial variability.
2.2. Identification of the Scope of Urban Function
Suburbanization, characterized by the unchecked sprawl of urban areas, often stems from limited space for development initiatives. Hence, it becomes imperative to closely monitor the direction, extent, and pace of urbanization in regions experiencing direct urbanization pressures. Fuzzy logic is an effective tool for analyzing areas with intricate land-use patterns. Unlike classical models, fuzzy logic is adept at describing ambiguous concepts and complex phenomena. While Cantor’s conventional set theory asserts that elements either fully belong (true—1) or do not belong (false—0) to a set, with sets possessing clear-cut boundaries that preclude intermediate values between 0 and 1, fuzzy set theory introduces the notion of intermediate values (partially true or partially false) represented by fractions, alongside the conventional true (1) and false (0) values [73]. This suggests that each element has the potential to belong, not belong, or partially belong to a set, with the membership function of each component being expressed as an absolute number within the interval [0, 1]. The degree of membership signifies the degree to which a specific element is affiliated with a fuzzy set [74,75,76,77]. This fuzzy, undefined character of land use is particularly evident in areas under direct pressure of urbanization. Fuzzy set theory was used here to determine fuzzy measures for different types of land use and the degree to which the analyzed area belongs to a set of urban functions in the interval [0, 1]. The spatial information used in this type of study is often fuzzy (imprecise) and therefore a fuzzy measure can be assigned to each land cover condition to determine its membership in a given category [78,79]. When analyzing urbanization processes spatially, it becomes crucial to delineate and identify the existing land-use functions, particularly in the transition zones between urban and rural areas. According to the principles of fuzzy set theory, the vanishing urban space is supplanted by rural space. Fundamental operations conducted on fuzzy sets suggest that rural functions are encompassed within a fuzzy set as the degree of membership is determined for urban functions. For instance, if the fuzzy measure for urban functions in a specific area reaches 0.85, the fuzzy measure for rural functions will be 0.15. Thus, the analyzed area is decidedly more urban than rural, allowing for an unambiguous classification as urban space. This study applied the previously proposed method for identifying and delineating the urban–rural transition zone to examine an area undergoing direct urbanization pressure. The research proceeded under the premise that the association between land-use categories in urban areas and urban functions can vary. It utilized a set of 24 land-use categories to establish urban development boundaries, and assess the level and pace of urban expansion (Table 1). A prior study by the authors determined the degree of alignment of the examined land-use categories with urban functions through a questionnaire survey [80]. In this current investigation, the existing development status, land-use functions outlined in local zoning regulations, and landscape characteristics were scrutinized to ascertain the degree to which the assessed land-use categories fulfill urban functions. This study examined the current state of development, land-use functions specified in local zoning laws, and landscape traits to determine how well various land-use categories serve urban purposes. A questionnaire survey was conducted, where participants were asked to compare different land-use types in terms of their urban characteristics. The questionnaire consisted of three matrices, with respondents using symbols (“←”, “O”, or “↑”) and a range of values (2-1-0) to indicate which types exhibited more urban features: (1) existing development types (8 types), (2) land-use functions according to zoning plans (18 functions), and (3) landscape types (16 types) [22]. A fuzzy measure of land use was calculated and standardized for each of the 24 land-use categories studied, indicating their association with urban functions within a range of [0, 1] (Table 1).

Table 1.
Degree of membership in a set of urban functions in the interval [0, 1].
In the subsequent phase, the proportionate contribution of the 24 scrutinized land-use categories in each hexagonal area was established for the years 2005, 2010, 2017, and 2022. National databases provided the primary cartographic data, including aerial imagery and information from land and building registries. Field inspections were conducted if specific land-use categories posed identification challenges (July 2023). The study extensively used orthophotomaps as the primary resource for developing GIS databases and visualizing spatial analysis outcomes [81,82]. Photointerpretation included visual interpretation of orthophotomaps, with the results supplemented by other data sources to identify prevailing land-use categories across all 1012 hexagonal areas [83,84,85,86]. Photointerpretation is an effective and relatively simple method of classifying complex and heterogeneous landscapes and spatial objects [87]. This method relies on the main attributes of the depicted objects, including their shape, color, hue, and texture. The physical parameters of the examined objects, such as length and height, are extracted from the images, and the objects depicted in the analyzed images are compared with real-world objects [88]. The study used data from the National Geodetic and Cartographic Resources, both in the form of raster data in geotiff format, as well as data acquired from web services such as the Web Map Service (WMS), which were integrated within ArcGIS PRO 3.1. The data used in the study, which also include historical data, are provided to the public freely as part of the National Spatial Data Infrastructure (SDI). The spatial resolution of the data acquired for 2005, 2010, and 2017 is 0.5 m × 0.5 m, while the resolution for 2022 is 0.25 m × 0.25 m [89,90,91]. The findings from the inventory were utilized to construct a database comprising vector data for every examined year. Discrepancies in the pace of urbanization for each year under scrutiny were established by determining the degree of association with a set of urban functions at a significance level of 0.05.
3. Results
The computed degree of association with a set of urban functions (refer to Table 1) alongside the outcomes of the land-use assessment for the years 2005, 2010, 2017, and 2022 was employed to construct a fuzzy model of Olsztyn City. This model aided in delineating urban development boundaries and identifying the urban–rural transition zone within the area. The degree of association with the set of urban functions was computed for each hexagonal area by summing the products of the analyzed land-use categories across the study area and their respective degrees of association as specified in Table 1. In the first stage of the study, land-use changes in areas experiencing direct urbanization pressure were presented in binned maps. A fuzzy measure of land use was calculated in the interval [0, 1] in each of the 1012 hexagonal fields (Figure 3a–d). In Figure 3, the rate and direction of urban development in each primary field between 2005 and 2022 are represented on a color scale.
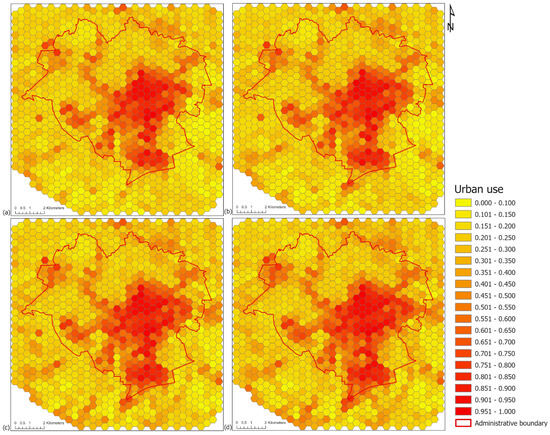
Figure 3.
Urban land use in hexagonal fields indicated by their degree of membership within an interval [0.00, 1.00]: (a) 2005; (b) 2010; (c) 2017; (d) 2022.
The urban morphology is the key factor that drives changes in the urbanization rate. As previously mentioned, Olsztyn is surrounded by natural barriers that prevent smooth spatial development and intensify urbanization processes within the city’s boundaries. The degree of urbanization was highest in central Olsztyn and in areas with a predominance of multi-family housing (particular in the southern part of the analyzed area), services, and industrial facilities (in the eastern part of the study area). The degree of association with a set of urban functions for each hexagonal area in 2005, 2010, 2017, and 2022 is detailed in Table 2.
Table 2.
Number of hexagonal fields in the set of urban functions in the interval [0.00–1.00] in 2005, 2010, 2017, and 2022 in the research area.
The analysis revealed that urban functions in the membership interval [0.501–1.000], that is, fields where the degree of membership in the set of urban functions exceeded 0.50, continued to expand rapidly in the examined period despite the fact that they accounted for a small percentage of the analyzed area. The number and percentage of fields with a predominance of urban functions and the total area in the analyzed period are presented in Table 3.
Table 3.
Changes in the degree of membership in the set of urban functions in the interval [0.501–1.000] in 2005, 2010, 2017, and 2022 in the research area.
In 2005, the total area with a predominance of urban functions in the interval [0.501–1.000] was determined at 3100 ha and it accounted for only 15.32% of the study area. By 2022, the total area with a predominance of urban functions in the interval [0.501–1.000] reached 3700 ha (18.28% of the analyzed area), marking an increase of 600 ha.
The results were used to generate a fuzzy model of the city of Olsztyn in the interval [0, 1]. The developed models of urban land-use in 2005, 2010, 2017, and 2022 are presented in Figure 4. Data were interpolated with the use of the empirical Bayesian kriging (EBK) method which automates the most difficult steps in the modeling process. The main advantage of this approach is that it requires minimal interactive modeling. In comparison with other kriging methods, EBK provides more accurate predictions with smaller standard errors, in particular in analyses of small datasets [92,93]. The main disadvantage of the applied approach is that processing time rapidly increases with an increase in the number of input points, subset size, or the overlap factor [94].
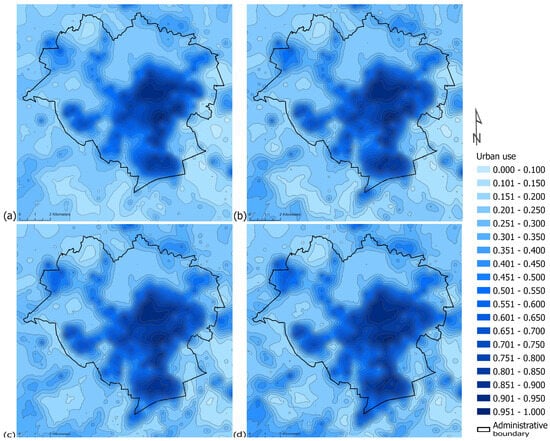
Figure 4.
Urban land-use functions in the study area expressed by the degree of membership in the interval [0.00, 1.00]: (a) 2005; (b) 2010; (c) 2017; (d) 2022.
The configuration and extent of urban expansion in Olsztyn are chiefly influenced by the presence of natural barriers that hinder further urban sprawl. This phenomenon is particularly evident in the northern and western sectors of the city, where the Municipal Forest and several lakes are situated. Olsztyn has historically not been a center for industrial activities, with industrial facilities occupying less than or slightly more than 2% of the study area from 2005 to 2022. The most significant urbanization rates were observed in the southern region of Olsztyn, primarily attributed to the rapid construction of single-family residences and multi-family dwellings. Over recent years, there has been a notable increase in the number of single-family homes in the eastern districts of Olsztyn and their immediate surroundings, leading to direct urbanization pressures in these areas.
Differences resulting from the pace of urbanization for each year under scrutiny were established by determining the degree of association with a set of urban functions at a significance level of 0.05, which detected noteworthy shifts in land use during the periods 2005–2007, 2010–2017, and 2017–2022 (Figure 5).
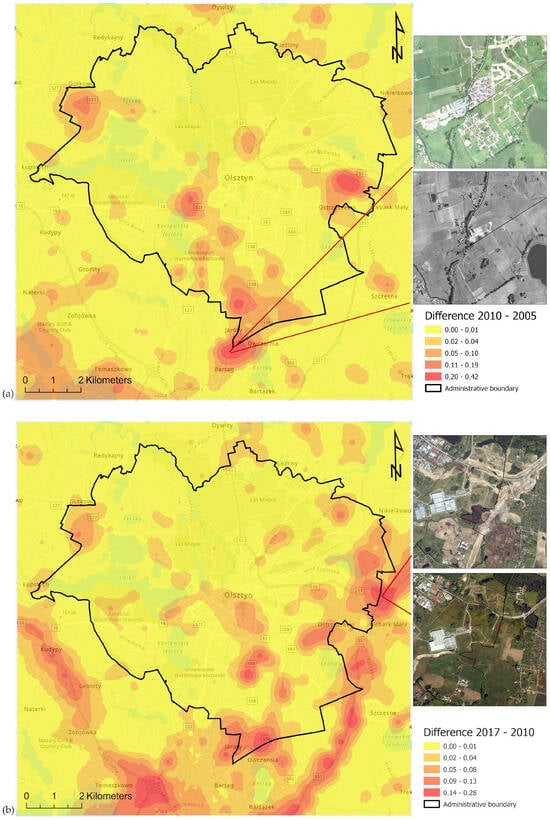
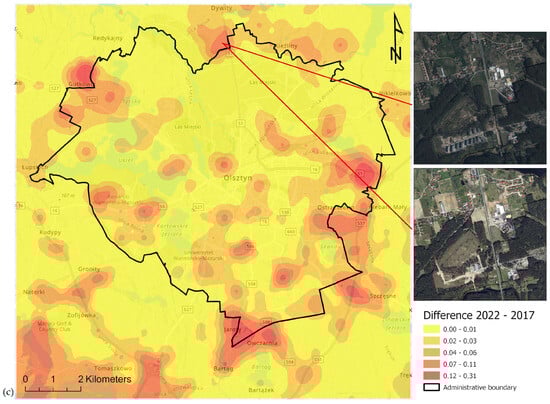
Figure 5.
Changes in land-use type in: (a): 2005–2010; (b): 2010–2017; (c): 2017–2022.
The most significant frequency of land-use alterations indicative of urban expansion occurred in the southern, eastern, and western sectors of Olsztyn. These regions, especially the southern districts, are characterized by extensive farmland and limited natural obstacles, making them readily convertible to alternative land-use categories. The inauguration of the southern segment of the Olsztyn Ring Road in 2019 notably heightened the demand for undeveloped land for residential construction in this city area. The road network in the eastern part of Olsztyn was also expanded to create access to the ring road (Figure 5b). The percentage changes in the area of selected land-use types in the studied period are presented in Table 4. Between 2005 and 2010, the greatest increase was observed in the area of the following land-use types: single-family homes (9.32%), multi-family housing (3.01%), and industrial plants and warehouses (2.15%). In turn, the greatest decrease was noted in the area of agricultural land (10.04%), natural green spaces (2.96%), and forests (2.38%). In 2010–2017, the greatest increase was determined in the area of construction sites (15.65%), single-family homes (7.21%), and public roads (3.40%), whereas the greatest decrease was noted in the area of agricultural land (19.87%), forests (7.60%), and natural green spaces (6.79%). Between 2017 and 2022, the greatest increase was observed in the area occupied by public roads (14.01%), single-family homes (8.77%), and multi-family housing (3.62%), whereas the greatest decrease occurred in the area of construction sites (16.33%), agricultural land (11.33%), and forests (3.37%).
Table 4.
Changes in land-use types in the study area in 2005–2022 in the research area.
During the entire period of the analysis (2005–2022), the greatest increase was observed in the area occupied by single-family homes (25.3%), public roads (18.44%), and multi-family housing (9.42%), whereas the greatest decrease was noted in the area of agricultural land (41.24%), forests (13.35%), and natural green spaces (9.07%) in the city of Olsztyn and in its immediate vicinity. These changes can be attributed mainly to Olsztyn’s role as the leading regional hub, as well as the large number of natural barriers that limit the spatial expansion of the city. Fuzzy set theory offers a means to scrutinize shifts in land use within regions under direct urbanization pressure, aiding in identifying and mapping these transitions within suburban areas and the urban center. Urbanization exerts continuous pressure on fragmented natural green spaces, farmland, and forests.
4. Discussion
Urbanization triggers significant spatial transformations and gradually alters the land-use fabric. It is imperative to monitor urban areas and regions experiencing direct urbanization pressure to ensure the sustainable growth of cities. Geographic Information System (GIS) tools, and photogrammetric and remote sensing data prove invaluable in detecting changes in land use within urban and suburban areas. These data primarily originate from specialized satellites within programs such as Copernicus (managed by the European Space Agency) and Landsat (administered by NASA). The data obtained from Sentinel satellites under the Copernicus program, particularly Sentinel-2 and Sentinel-1, as well as Landsat data, offer high precision and resolution [95,96,97,98].
The presented research is an example of a detailed approach to identifying the dynamics of spatial transformation phenomena using increasingly accurate photogrammetric terrain images. Due to the individual approach to the photo-interpretation process, we are able to capture spatial changes with much higher accuracy. This means that similar studies can be carried out in a limited area but we gain detailed knowledge of the dynamics of the urbanization process. The use of fuzzy logic makes it possible to highlight the smoothness of the transition of a rural space into a highly urbanized one. This avoids a clear-cut classification of areas into urban or rural zones, which can cause errors in efforts to reinforce the desired development of this space. This approach also provides an opportunity to recognize the speed of the changes taking place and so to properly assess the dynamics of the processes. This is extremely important when using this type of research to manage urbanization processes. The identification of the directions and dynamics makes it possible to indicate the need to provide a given area with the necessary public and technical infrastructure, especially areas with strong urbanization pressure, by integrating these measures over time. The proposed methodology makes it possible to indicate the need to protect areas of natural value from rapid urbanization and therefore avoid its undesirable effects from degradation.
It should be emphasized that the proposed procedure is independent of the photo-interpretation imposed when using data from CORINE Land Cover (CLC) type land cover databases. By being able to make changes to the interpretation resulting from the field survey, it offers the possibility of a more accurate analysis of the changes taking place. In addition, the applicability of the method does not depend on the date of publication of the data, making it possible to use it to monitor land-use changes.
The rapid development of urban space and the associated environmental challenges require precise mapping techniques to more accurately represent the complex characteristics of the land surface [99]. Urban Atlas databases or CORINE Land Cover (CLC) data have been successfully used to map and monitor anthropogenic as well as natural land-use changes [100,101,102,103]. All of these methods have their advantages and disadvantages, such as the availability of data, the difficulty in classifying some forms of development, implementation time, costs, and their spatial and temporal continuity. Their development also requires adequate knowledge and specialized processing algorithms. For example, within specific data repositories, like the CORINE Land Cover inventory, automated classification is employed. Yet, the varied color schemes, structures, and textures present can introduce inaccuracies when discerning particular land-use types, particularly in analyses involving numerous similar and overlapping land-cover categories [104,105].
Aerial and satellite images are often used in spatial analyses, even though interpreting these data sources is a lengthy and time-consuming process [106]. Nonetheless, spatial analyses utilizing aerial and satellite imagery proved more cost-effective and time-efficient when considering long-term perspectives. Furthermore, these data are versatile and can be used for a variety of applications such as topographic mapping, architectural planning, disaster management, and environmental monitoring, adding a layer of versatility to urban planning processes. They can be applied across numerous cities to gather sample data to determine the extent and nature of urbanization processes [107]. This is especially relevant for regions facing urbanization pressures that do not fit neatly into purely urban or rural classifications. Monitoring changes in land cover provides the most effective means of assessing the degree and pace of urbanization in such areas.
On the other hand, photogrammetric methods are not without challenges in terms of their application, especially as the process of analyzing photogrammetric data can be technically demanding through the use of specialized software and knowledge. There is also the issue of the size of the datasets produced by photogrammetric methods, which require significant resources to process and store. Another concern in the acquisition of quality data is the dependence on weather and lighting, which can affect the quality of photogrammetric data and thus the feasibility of its use. The completeness and accuracy of recorded data can also be affected by objects being obscured by other objects, making them difficult to identify or measure. The timeliness of the data also affects the results of the analysis, as we are basing our analysis on a specific point in time, and changes in the environment, infrastructure, natural disasters, or seasonal changes that occur immediately afterwards would lead to different conclusions. Finally, the recent use of drones to collect photogrammetric data may raise privacy concerns, especially in densely populated urban areas.
In terms of the method used, it should be pointed out that a limitation is the need for high-resolution photogrammetric studies that avoid errors in the identification of individual land uses. In addition, orthophotos present the state of land at a given time. Thus, seasonal changes, including crops and afforestation, as well as dynamic urbanization processes, require regular data updates. Another element that should be taken into account in terms of features identifying 24 individual types of use is the variety of norms and compositions occurring for a given period of time in the development of peri-urban areas. There is a wide variety of land-use types, planning norms and spatial compositions in peri-urban development. Using orthophotos to identify and classify these forms requires sophisticated image analysis algorithms and can be difficult due to the complexity and dynamics of change.
Comprehending urban expansion patterns is essential for sustainable urban development. Given the often ambiguous and imprecise nature of land-use data, the application of fuzzy set theory becomes crucial for pinpointing and delineating urban development boundaries, especially in regions facing direct urbanization pressures [108]. This method can precisely delineate urban area boundaries and the degree of urbanization within the range of [0, 1] can be accurately assessed. The accuracy of the resulting model primarily hinges on the type and quantity of land-use attributes and the resolution of input data. The results of land-cover analyses involving fuzzy set theory, photogrammetric data, and GIS tools can be used to develop a measure of spatial urban development that facilitates effective urban planning.
5. Conclusions
Urbanization has numerous causes and consequences. Changes in land use are the most apparent symptom of urbanization, which indicates that urbanization is undoubtedly a spatial process. In assessing urbanization processes, quantitative and structural alterations in land use at specific times and locations serve as crucial metrics. Extensive scrutiny has been devoted to the spatial expansion of cities and the concurrent growth of urban populations within land management studies. Studies investigating the dynamics of urbanization support identifying cities in which suburbanization proceeds optimally, as well as cities characterized by chaotic urban sprawl. Utilizing fuzzy set theory in urbanization studies can foster judicious land management and support sustainable urban planning efforts. By computing the degree of association with a set of urban functions within the range of [0, 1], it becomes feasible to pinpoint land-use categories exhibiting a distinctly “urban” character, entailing a greater prevalence of urban functions compared to other land-use types. The methodology outlined aligns with fuzzy set theory principles, enabling the identification and delineation of urban areas while facilitating an assessment of the degree and pace of urbanization within the spectrum of [0, 1]. A strength of the proposed approach is that it takes a zonal rather than an incremental approach to the phenomenon of urbanization. This is because it is not a phenomenon that appears and ends abruptly, but rather has the character of a phenomenon that stretches over time and space. Identifying ways of recognizing the nature of this stretch can provide important guidance in planning urban development processes.
Geospatial data is a valuable repository of insights and a pivotal reference in creating novel methodologies for identifying and overseeing urbanization trends. Current and historical orthophotomaps and databases provide practically unlimited access to land-cover data, and GIS techniques support rapid spatial information processing. High-resolution photogrammetric data are used to monitor land cover, and they have numerous applications in areas such as spatial planning, urban development, architecture, ecology, and environmental protection. These data play a fundamental role in deepening our understanding of urbanization processes and, due to their widespread availability, they are increasingly used to monitor changes in land use [109,110].
The study shows a clear expansion of predominantly urban areas. In spite of the large presence of areas of high natural value in the research area, including significant woodlands and water bodies, which are important barriers to the development of urban functions, the increase in the area of urbanized land is very dynamic. While the share of fields with a predominance of urban functions in all fields in the years analyzed is only a few percent (from 15.32% to 18.28%), in a perspective of a few years the increase of a few percent seems very large. By drawing up a fuzzy model of the city of Olsztyn in the years 2005–2022 it is possible to clearly identify the direction of the greatest urbanization pressure, being the southern direction, which provides an opportunity to prepare infrastructure development plans for the next stages of urbanization, considering at the same time the natural values of the developing areas.
The study’s main aim was fulfilled by employing photogrammetric data spanning 2005, 2010, 2017, and 2022. This involved introducing a methodology to identify and delineate the limits of urban expansion using fuzzy set theory. It also analyzed the evolving land-use patterns within regions undergoing direct urbanization pressures in Olsztyn and its nearby areas. The findings unequivocally demonstrate the practical utility of the proposed approach in guiding the trajectories of urban expansion. This method offers applicability in delineating the urbanization gradient, evaluating present requirements, and identifying potential challenges to sustainable urban progress.
It should be emphasized that the continuation of research largely depends on access to photogrammetric data, which are now much more easily available. This is influenced by the possibility of using drones, frequent aerial data acquisition campaigns, and the increasing resolution of satellite imagery that is available through various programs. It is important to note that these data provide precise information on the state of space and can be used as a basis for modeling urbanization. The data’s advantage lies in their wide availability and timeliness, which is further facilitated by the development of satellite and drone technologies, making access increasingly easy and affordable. Simultaneously, analyzing photogrammetric data necessitates advanced and therefore time-consuming methods of analysis and processing. Additionally, the diverse range of land-use forms in an area requires specialized knowledge.
The next phase of research should focus on finding new sources of spatial data to detail land-use information and adapting automation methods to improve the photo-interpretation process of the acquired material. The authors see the need to improve the process of identifying the affiliation of fields to urban or rural functions. They are also aware of changes in the characteristics of rural areas, which are currently undergoing a major transformation. This may have an impact on the change in the degrees of affiliation of the land cover forms concerned, and on the final assessment of the fields and the outcome of the analyses. Transition zones may change over time, but fuzzy logic allows the models to adapt to changing conditions, making it possible to continuously monitor and update the identification of these areas.
Therefore, the issue of urban sensing, which involves integrating with other datasets such as demographic, social, and economic data, and using the developed methods to identify and classify land-use forms, optimizes the process of creating comprehensive, coherent, and sustainable strategic studies on urban development. The involvement of local communities in the process of data collection and classification is crucial to improving the quality of the data obtained and, consequently, the spatial analyses performed on their results.
The methodology presented allows land-use changes to be compared with the urban planning actions taken by the city authorities. It makes it possible to assess whether the objectives of spatial planning are being achieved and whether the measures taken are effective in shaping the development of the city in accordance with the objectives adopted.
In order to mitigate the negative effects of urbanization, policy recommendations and urban strategies should focus on sustainable development, efficient land use, and environmental protection. The findings presented in this article can be used in a development strategy, a document indicating directions for social, economic, and spatial development. The findings can be included in master plans, indicating optimal transport solutions in relation to the existing road system, areas of planned development, or areas of high natural value to be protected.
The research conducted identifies opportunities for using sensory technologies and modern data collection methods to monitor, analyze, and manage the urban environment. Changes in urbanization occur over time. This often makes it difficult to determine the timing and intensity of changes, as they occur with varying degrees of dynamism and are spatially extended. Not infrequently, a seemingly fixed urban boundary shifts as a result of the urbanization of rural areas close to the city. Identifying these changes is therefore problematic and makes it difficult to plan sustainable spatial development that provides access to technical and social infrastructure. The adaptation of new methods in the field of urban sensing, combined with appropriate methods of analysis, which can include fuzzy set theory, allows us to better understand and respond to the needs of cities, guiding their development towards smart cities.
Author Contributions
Conceptualization, A.B.; Data curation, A.B. and S.C.; Formal analysis, A.B.; Methodology, A.B.; Project administration, I.C. and S.C.; Supervision, I.C.; Visualization, S.C. and K.S.; Writing—original draft, A.B. and S.C.; Writing—review and editing, A.B., I.C. and T.B. All authors have read and agreed to the published version of the manuscript.
Funding
This research received no external funding.
Institutional Review Board Statement
Not applicable.
Informed Consent Statement
Not applicable.
Data Availability Statement
The data presented in this study are available upon request from the corresponding author.
Conflicts of Interest
The authors declare no conflicts of interest.
References
- Parysek, J.J. Duze miasta Europy i ich rola w procesie urbanizacji, rozwoju spoleczno-gospodarczego i europejskiej integracji u schylku XX wieku. Przegląd Geograficzny. Pol. Akad. Nauk 1995, 67, 225–248. [Google Scholar]
- Węcławowicz, G. Geografia Społeczna Miast w Polsce = Urban Social Geography in Poland. Prz. Geogr. 2017, 89, 535–563. [Google Scholar] [CrossRef]
- Soliman, A.M. Urbanization and Urban Informality in the Era of Globalization. In Urban Informality; Springer International Publishing: Cham, Switzerland, 2021; pp. 85–120. ISBN 978-3-030-68987-2. [Google Scholar]
- Solon, J. Spatial Context of Urbanization: Landscape Pattern and Changes between 1950 and 1990 in the Warsaw Metropolitan Area, Poland. Landsc. Urban Plan. 2009, 93, 250–261. [Google Scholar] [CrossRef]
- Kazak, J.K.; Błasik, M.; Świąder, M. Land use change in suburban zone: European context of urban sprawl. J. Water Land Dev. 2022, 92–98. [Google Scholar] [CrossRef]
- Chen, M.; Zhou, Y.; Huang, X.; Ye, C. The Integration of New-Type Urbanization and Rural Revitalization Strategies in China: Origin, Reality and Future Trends. Land 2021, 10, 207. [Google Scholar] [CrossRef]
- Delgado-Viñas, C.; Gómez-Moreno, M.-L. The Interaction between Urban and Rural Areas: An Updated Paradigmatic, Methodological and Bibliographic Review. Land 2022, 11, 1298. [Google Scholar] [CrossRef]
- Henderson, J.V.; Wang, H.G. Aspects of the Rural-Urban Transformation of Countries. J. Econ. Geogr. 2005, 5, 23–42. [Google Scholar] [CrossRef]
- Cieślak, I. Identification of Areas Exposed to Land Use Conflict with the Use of Multiple-Criteria Decision-Making Methods. Land Use Policy 2019, 89, 104225. [Google Scholar] [CrossRef]
- Xie, H.; Zhang, Y.; Duan, K. Evolutionary Overview of Urban Expansion Based on Bibliometric Analysis in Web of Science from 1990 to 2019. Habitat Int. 2020, 95, 102100. [Google Scholar] [CrossRef]
- Degórska, B. Urbanizacja Przestrzenna Terenów Wiejskich na Obszarze Metropolitalnym Warszawy: Kontekst Ekologiczno-Krajobrazowy; IGiPZ PAN: Warsaw, Poland, 2017; ISBN 978-83-61590-86-6. [Google Scholar]
- Mills, E.S. Studies in the Structure of the Urban Economy; The Johns Hopkins Press: Baltimore, MA, USA, 2021. [Google Scholar]
- O’Sullivan, A. Urban Economics; McGraw Hill: New York, NY, USA, 2018; ISBN 978-0-07-802178-7. [Google Scholar]
- Geshkov, M. Urban Sprawl in Eastern Europe. The Sofia City Example. Econ. Altern. 2015, 2, 101–116. [Google Scholar]
- Kocur-Bera, K.; Pszenny, A. Conversion of Agricultural Land for Urbanization Purposes: A Case Study of the Suburbs of the Capital of Warmia and Mazury, Poland. Remote Sens. 2020, 12, 2325. [Google Scholar] [CrossRef]
- Lityński, P. The Intensity of Urban Sprawl in Poland. ISPRS Int. J. Geo-Inf. 2021, 10, 95. [Google Scholar] [CrossRef]
- Bryan, G.; Glaeser, E.; Tsivanidis, N. Cities in the Developing World. Annu. Rev. Econ. 2020, 12, 273–297. [Google Scholar] [CrossRef]
- Tang, J.; Li, S. Can Public Participation Promote Regional Green Innovation?—Threshold Effect of Environmental Regulation Analysis. Heliyon 2022, 8, e11157. [Google Scholar] [CrossRef]
- Nechyba, T.J.; Walsh, R.P. Urban Sprawl. J. Econ. Perspect. 2004, 18, 177–200. [Google Scholar] [CrossRef]
- Antrop, M. Rural-Urban Conflicts and Opportunities. In The New Dimensions of the European Landscape; Jongman, R.H.G., Ed.; Wageningen UR Frontis Series; Springer Netherlands: Dordrecht, The Netherlands, 2004; Volume 4, pp. 83–91. ISBN 978-1-4020-2910-3. [Google Scholar]
- Biłozor, A.; Cieślak, I.; Czyza, S. An Analysis of Urbanisation Dynamics with the Use of the Fuzzy Set Theory-A Case Study of the City of Olsztyn. Remote Sens. 2020, 12, 1784. [Google Scholar] [CrossRef]
- Biłozor, A.; Czyża, S.; Bajerowski, T. Identification and Location of a Transitional Zone between an Urban and a Rural Area Using Fuzzy Set Theory, CLC, and HRL Data. Sustainability 2019, 11, 7014. [Google Scholar] [CrossRef]
- Simon, D. Urban Environments: Issues on the Peri-Urban Fringe. Annu. Rev. Environ. Resour. 2008, 33, 167–185. [Google Scholar] [CrossRef]
- Siemiński, J.L. Kontinuum miejsko-wiejskie i niektóre jego problemy infrastrukturalne. Infrastrukt. Ekol. Teren. Wiej. 2010, 2, 215–228. [Google Scholar]
- Sobotka, S. Przekształcenia historycznych układów przestrzennych wsi w strefie podmiejskiej Olsztyna, ze szczególnym uwzględnieniem Brąswałdu, Dorotowa i Jonkowa. Acta Sci. Pol. Adm. Locorum 2014, 13, 39–57. [Google Scholar]
- Szmytkie, R. Metody Analizy Morfologii i Fizjonomii Jednostek Osadniczych; Instytut Geografii i Rozwoju Regionalnego Uniwersytetu Wrocławskiego: Wrocław, Poland, 2014; ISBN 978-83-62673-45-2. [Google Scholar]
- Konecka-Szydłowska, B. Najmniejsze Miasta w Polsce w Ujęciu Koncepcji Kontinuum Miejsko-Wiejskiego. Rozw. Reg. I Polityka Reg. 2018, 41, 151–165. [Google Scholar] [CrossRef]
- Labbé, D. Facing the Urban Transition in Hanoi: Recent Urban Planning Issues and Initiatives; Urbanisation Culture Société: Montréal, QC, Canada, 2010. [Google Scholar]
- Loibl, W.; Piorr, A.P.; Ravetz, J. Concepts and Methods. In Life Sciences; University of Copenhagen, Academic Books: København, Denmark, 2011. [Google Scholar]
- Ravetz, J.; Warhurst, P. Manchester: Re-Inventing the Local–Global in the Peri-Urban City-Region. In Peri-Urban Futures: Scenarios and Models for Land Use Change in Europe; Nilsson, K., Pauleit, S., Bell, S., Aalbers, C., Sick Nielsen, T.A., Eds.; Springer Berlin Heidelberg: Berlin/Heidelberg, Germany, 2013; pp. 169–207. ISBN 978-3-642-30528-3. [Google Scholar]
- Degórska, B. Urbanizacja przestrzenna terenów wiejskich na obszarze metropo + Spatial urbanization of rural areas of the Warsaw Metropolitan Area: Ecological and ladscape contextlitalnym Warszawy: Kontekst ekologiczno-krajobrazowy. Pr. Geogr.-Pol. Akad. Nauk 2017. Available online: https://rcin.org.pl/dlibra/doccontent?id=66131 (accessed on 27 March 2024).
- Acevedo, W.; Masuoka, P. Time-Series Animation Techniques for Visualizing Urban Growth. Comput. Geosci. 1997, 23, 423–435. [Google Scholar] [CrossRef]
- Tacoli, C. The Links between Urban and Rural Development. Environ. Urban. 2003, 15, 3–12. [Google Scholar] [CrossRef]
- Simon, D.; Mcgregor, D.; Nsiah-Gyabaah, K. The Changing Urban–Rural Interface of African Cities: Definitional Issues and an Application to Kumasi, Ghana. Environ. Urban 2004, 16, 235–247. [Google Scholar] [CrossRef]
- Gallent, N. The Rural–Urban Fringe: A New Priority for Planning Policy? Plan. Pract. Res. 2006, 21, 383–393. [Google Scholar] [CrossRef]
- Csatári, B.; Farkas, J.Z.; Lennert, J. Land Use Changes in the Rural-Urban Fringe of Kecskemét after the Economic Transition. J. Settl. Spat. Plan. 2013, 4. [Google Scholar]
- Nabielek, K.; Kronberger-Nabielek, P.; Hamers, D. The Rural-Urban Fringe in the Netherlands: Recent Developments and Future Challenges. SPOOL 2013, 1, 1–18. [Google Scholar] [CrossRef]
- Hao, P.; Geertman, S.; Hooimeijer, P.; Sliuzas, R. The Land-Use Diversity in Urban Villages in Shenzhen. Environ. Plan. A 2012, 44, 2742–2764. [Google Scholar] [CrossRef]
- Gant, R.L.; Robinson, G.M.; Fazal, S. Land-Use Change in the ‘Edgelands’: Policies and Pressures in London’s Rural–Urban Fringe. Land Use Policy 2011, 28, 266–279. [Google Scholar] [CrossRef]
- Datta, R. Territorial Integration: An Approach to Address Urbanising Villages in the Planning for Delhi Metropolitan Area, India. In Proceedings of the Territorial Integration of Urbanising Villages 40th ISoCaRP Congress, Geneva, Switzerland, 18–22 September 2004; Volume 22. [Google Scholar]
- Renigier-Biłozor, M.; Biłozor, A. Optimization of the Variables Selection in the Process of Real Estate Markets Rating. Oeconomia Copernic. 2015, 6, 139. [Google Scholar] [CrossRef]
- Bilozor, A.; Renigier-Bilozor, M.; Cellmer, R. Assessment Procedure of Suburban Land Attractiveness and Usability for Housing. In Proceedings of the 2018 Baltic Geodetic Congress (BGC Geomatics), Olsztyn, Poland, 21–23 June 2018; pp. 91–96. [Google Scholar]
- Bagnoli, C.; Smith, H. The Theory of Fuzz Logic and Its Application to Real Estate Valuation. J. Real Estate Res. 1998, 16, 169–200. [Google Scholar] [CrossRef]
- Ready, R.; Abdalla, C. GIS Analysis of Land Use on the Rural-Urban Fringe: The Impact of Land Use and Potential Local Disamenities on Residential Property Values and on the Location of Residential Development in Berks County, Pennsylvania; Northeast Regional Center for Rural Development, Pennsylvania State University: University Park, PA, USA, 2003. [Google Scholar]
- López, V.; Santos, M.; Montero, J. Fuzzy Specification in Real Estate Market Decision Making. Int. J. Comput. Intell. Syst. 2010, 3, 8–20. [Google Scholar] [CrossRef]
- Renigier-Biłozor, M. Modern Classification System of Real Estate Markets. Geod. Vestn. 2017, 61, 441–460. [Google Scholar] [CrossRef]
- Renigier-Biłozor, M.; Walacik, M.; Źróbek, S.; d’Amato, M. Forced Sale Discount on Property Market—How to Assess It? Land Use Policy 2018, 78, 104–115. [Google Scholar] [CrossRef]
- Renigier-Biłozor, M.; Źróbek, S.; Walacik, M.; Borst, R.; Grover, R.; d’Amato, M. International Acceptance of Automated Modern Tools Use Must-Have for Sustainable Real Estate Market Development. Land Use Policy 2022, 113, 105876. [Google Scholar] [CrossRef]
- Cieślak, I.; Górecka, K. An Evaluation of Urbanisation Processes in Suburban Zones Using Land-Cover Data and Fuzzy Set Theory. Bull. Geography. Socio-Econ. Ser. 2021, 54, 49–62. [Google Scholar] [CrossRef]
- Liu, X.; Hu, G.; Chen, Y.; Li, X.; Xu, X.; Li, S.; Pei, F.; Wang, S. High-Resolution Multi-Temporal Mapping of Global Urban Land Using Landsat Images Based on the Google Earth Engine Platform. Remote Sens. Environ. 2018, 209, 227–239. [Google Scholar] [CrossRef]
- Schug, F.; Okujeni, A.; Hauer, J.; Hostert, P.; Nielsen, J.Ø.; van der Linden, S. Mapping Patterns of Urban Development in Ouagadougou, Burkina Faso, Using Machine Learning Regression Modeling with Bi-Seasonal Landsat Time Series. Remote Sens. Environ. 2018, 210, 217–228. [Google Scholar] [CrossRef]
- Benedek, J.; Sebestyén, T.T.; Bartók, B. Evaluation of Renewable Energy Sources in Peripheral Areas and Renewable Energy-Based Rural Development. Renew. Sustain. Energy Rev. 2018, 90, 516–535. [Google Scholar] [CrossRef]
- Akay, S.S.; Sertel, E. Urban land cover/use change detection using high resolution spot 5 and spot 6 images and urban atlas nomenclature. Int. Arch. Photogramm. Remote Sens. Spat. Inf. Sci. 2016, 41, 789–796. [Google Scholar] [CrossRef]
- Balz, T.; Washaya, P.; Jendryke, M. Urban Change Monitoring Using Globally Available Sentinel-1 Imagery. In Proceedings of the 2018 International Workshop on Big Geospatial Data and Data Science (BGDDS), Wuhan, China, 22–23 September 2018; pp. 1–4. [Google Scholar]
- Kong, F.; Yin, H.; Nakagoshi, N.; James, P. Simulating Urban Growth Processes Incorporating a Potential Model with Spatial Metrics. Ecol. Indic. 2012, 20, 82–91. [Google Scholar] [CrossRef]
- Hansen, H. A Fuzzy Logic Approach to Urban Land-Use Mapping. In Proceedings of the 9th Scandinavian Research Conference on Geographical Information Science, Espoo, Finland, 4–6 June 2003; p. 56. [Google Scholar]
- Loia, V. (Ed.) Studies in fuzziness and soft computing. In Fuzzy Logic and the Internet; Springer: Berlin/Heidelberg, Germany, 2004; ISBN 978-3-540-20180-9. [Google Scholar]
- Cardone, B.; Di Martino, F. A New Geospatial Model Integrating a Fuzzy Rule-Based System in a GIS Platform to Partition a Complex Urban System in Homogeneous Urban Contexts. Geosciences 2018, 8, 440. [Google Scholar] [CrossRef]
- Ghajari, Y.; Alesheikh, A.; Modiri, M.; Hosnavi, R.; Abbasi, M. Spatial Modelling of Urban Physical Vulnerability to Explosion Hazards Using GIS and Fuzzy MCDA. Sustainability 2017, 9, 1274. [Google Scholar] [CrossRef]
- Asadi, P.; Hosseini, S.M.; Ataie-Ashtiani, B.; Simmons, C.T. Fuzzy Vulnerability Mapping of Urban Groundwater Systems to Nitrate Contamination. Environ. Model. Softw. 2017, 96, 146–157. [Google Scholar] [CrossRef]
- Men, B.; Liu, H.; Tian, W.; Liu, H. Evaluation of Sustainable Use of Water Resources in Beijing Based on Rough Set and Fuzzy Theory. Water 2017, 9, 852. [Google Scholar] [CrossRef]
- Hwang, S.; Thill, J.-C. Using Fuzzy Clustering Methods for Delineating Urban Housing Submarkets. In Proceedings of the 15th Annual ACM International Symposium on Advances in Geographic Information Systems, Seattle, WA, USA, 7 November 2007; ACM: Seattle, WA, USA, 2007; pp. 1–8. [Google Scholar]
- Łuczak, A.; Kalinowski, S. Fuzzy Clustering Methods to Identify the Epidemiological Situation and Its Changes in European Countries during COVID-19. Entropy 2021, 24, 14. [Google Scholar] [CrossRef] [PubMed]
- Biłozor, A. Urban Land Use Changes Forecasting. In Proceedings of the 9th International Conference “Environmental Engineering 2014”, Vilnius, Lithuania, 22–24 May 2014; Vilnius Gediminas Technical University Press Technika: Vilnius, Lithuania, 2014. [Google Scholar]
- Sui, D.Z. A Fuzzy GIS Modeling Approach for Urban Land Evaluation. Comput. Environ. Urban Syst. 1992, 16, 101–115. [Google Scholar] [CrossRef]
- Foroutan, E.; Delavar, M.R. Urban Growth Modeling Using Fuzzy Logic. In Proceedings of the ASPRS 2012 Annual Conference, Sacramento, CA, USA, 19–23 March 2012. [Google Scholar]
- Kurtener, D.; Badenko, V. A GIS Methodological Framework Based on Fuzzy Sets Theory for Land Use Management. J. Braz. Comp. Soc. 2000, 6, 26–32. [Google Scholar] [CrossRef]
- Bielinis, L.; Bielinis, E.; Zawadzka, A.; Omelan, A.; Makowska, M. The Touristic, Recreational and Natural Assets of Olsztyn City and Its Neighbouring Area in the Opinion of the Residents/Walory Turystyczne, Rekreacyjne, Przyrodnicze Olsztyna i Okolic Według Opinii Mieszkańców. Ekon. I Sr. 2015, 4, 235. [Google Scholar]
- Viegas, J.M.; Martinez, L.M.; Silva, E.A. Effects of the Modifiable Areal Unit Problem on the Delineation of Traffic Analysis Zones. Environ. Plann. B Plann. Des. 2009, 36, 625–643. [Google Scholar] [CrossRef]
- Współczesne Problemy Oceny i Waloryzacji Przestrzeni. Współczesna Waloryzacja Przestrzeni Zurbanizowanej/pod Red. Iwony Cieślak; Wydawnictwo UWM: Olsztyn, Poland, 2012. [Google Scholar]
- Longley, P.A.; Adnan, M.; Lansley, G. The Geotemporal Demographics of Twitter Usage. Environ. Plan. A 2015, 47, 465–484. [Google Scholar] [CrossRef]
- Encalada-Abarca, L.; Ferreira, C.C.; Rocha, J. Revisiting City Tourism in the Longer Run: An Exploratory Analysis Based on LBSN Data. Curr. Issues Tour. 2024, 27, 584–599. [Google Scholar] [CrossRef]
- Rutkowska, D.; Hayashi, Y. Fuzzy Inference Neural Networks with Fuzzy Parameters. TASK Quarterly Sci. Bull. Acad. Comput. Cent. Gdan. 2003, 7, 7–22. [Google Scholar]
- Zadeh, L. Fuzzy Sets. Inf. Control 1965, 8, 338–353. [Google Scholar] [CrossRef]
- Zilberstein, S. What Is “Fuzzy Logic”? Are There Computers That Are Inherently Fuzzy and Do Not Apply the Usual Binary Logic? Available online: https://www.scientificamerican.com/article/what-is-fuzzy-logic-are-t/ (accessed on 19 January 2024).
- Piegat, A. Fuzzy Modeling and Control: With 96 Tables; Studies in fuzziness and soft computing; Physica-Verl: Heidelberg, Germany, 2001; ISBN 978-3-7908-1385-2. [Google Scholar]
- Łachwa, A. Rozmyty Świat Zbiorów, Liczb, Relacji, Faktów, Reguł i Decyzji; Akademicka Oficyna Wydawnicza EXIT: Katowice, Poland, 2001; ISBN 978-83-87674-21-2. [Google Scholar]
- Cieślak, M.; Smoluk, A. Zbiory Rozmyte; Rozpoznawanie Obrazów; Teoria Katastrof: Wybór Tekstów; Państ. Wydaw. Naukowe: Warsa, Poland, 1988. [Google Scholar]
- Molecki, B. Algorytmy Genetyczne a Logika Rozmyta; Politechnika Wrocławska: Wrocław, Poland, 1998. [Google Scholar]
- Pissourios, I.A. Urban Land Use Survey Methods: A Discussion on Their Evolution. Urban Sci. 2023, 7, 76. [Google Scholar] [CrossRef]
- Linder, W. Digital Photogrammetry: A Practical Course; Springer: Berlin, Germany, 2006; ISBN 978-3-540-29153-4. [Google Scholar]
- Bishop, M.P.; Giardino, J.R. Technology-Driven Geomorphology: Introduction and Overview. In Treatise on Geomorphology; Elsevier: Amsterdam, The Netherlands, 2022; pp. 1–17. ISBN 978-0-12-818235-2. [Google Scholar]
- Bieda, A. Increase in the Number of Submitted Maps for Design Purposes as a Determinant of Proper Spatial Planning Policy. J. Water Land Dev. 2017, 34, 65–75. [Google Scholar] [CrossRef][Green Version]
- Vermeulen, F.; Antrop, M.; Hageman, B.; Wiedemann, T. Ancient Roads and Fields in Northwestern Gaul—A GIS-Based Analysis. In BAR International Series 931; Archaeopress: Oxford, UK, 2000; Volume 931; Available online: https://proceedings.caaconference.org/files/2000/27_Vermeulen_et_al_CAA_2000.pdf (accessed on 23 January 2024).
- Antrop, M. Changing Patterns in the Urbanized Countryside of Western Europe. Landsc. Ecol. 2000, 15, 257–270. [Google Scholar] [CrossRef]
- Antrop, M.; Van Eetvelde, V. Holistic Aspects of Suburban Landscapes: Visual Image Interpretation and Landscape Metrics. Landsc. Urban Plan. 2000, 50, 43–58. [Google Scholar] [CrossRef]
- Butt, A.; Shabbir, R.; Ahmad, S.S.; Aziz, N. Land Use Change Mapping and Analysis Using Remote Sensing and GIS: A Case Study of Simly Watershed, Islamabad, Pakistan. Egypt. J. Remote Sens. Space Sci. 2015, 18, 251–259. [Google Scholar] [CrossRef]
- Salehi, B.; Zhang, Y.; Zhong, M.; Dey, V. Object-Based Classification of Urban Areas Using VHR Imagery and Height Points Ancillary Data. Remote Sens. 2012, 4, 2256–2276. [Google Scholar] [CrossRef]
- Brelsford, C.; Martin, T.; Hand, J.; Bettencourt, L.M.A. Toward Cities without Slums: Topology and the Spatial Evolution of Neighborhoods. Sci. Adv. 2018, 4, eaar4644. [Google Scholar] [CrossRef] [PubMed]
- Long, Y.; Zhai, W.; Shen, Y.; Ye, X. Understanding Uneven Urban Expansion with Natural Cities Using Open Data. Landsc. Urban Plan. 2018, 177, 281–293. [Google Scholar] [CrossRef]
- Encalada-Abarca, L.; Ferreira, C.C.; Rocha, J. Measuring Tourism Intensification in Urban Destinations: An Approach Based on Fractal Analysis. J. Travel Res. 2022, 61, 394–413. [Google Scholar] [CrossRef]
- Samsonova, V.P.; Blagoveshchenskii, Y.N.; Meshalkina, Y.L. Use of Empirical Bayesian Kriging for Revealing Heterogeneities in the Distribution of Organic Carbon on Agricultural Lands. Eurasian Soil Sci. 2017, 50, 305–311. [Google Scholar] [CrossRef]
- Wieskotten, M.; Crozet, M.; Iooss, B.; Lacaux, C.; Marrel, A. A Comparison between Bayesian and Ordinary Kriging Based on Validation Criteria: Application to Radiological Characterisation. Math. Geosci. 2024, 56, 143–168. [Google Scholar] [CrossRef]
- Jia, W.; Sun, M.; Lian, J.; Hou, S. Feature Dimensionality Reduction: A Review. Complex Intell. Syst. 2022, 8, 2663–2693. [Google Scholar] [CrossRef]
- Biłozor, A.; Renigier-Bilozor, M. The Use of Geoinformation in the Process of Optymalizing the Use of Land. In Proceedings of the 9th International Conference “Environmental Engineering 2014”, Vilnius, Lithuania, 22–24 May 2014; Vilnius Gediminas Technical University Press Technika: Vilnius, Lithuania, 2014. [Google Scholar]
- Lefebvre, A.; Sannier, C.; Corpetti, T. Monitoring Urban Areas with Sentinel-2A Data: Application to the Update of the Copernicus High Resolution Layer Imperviousness Degree. Remote Sens. 2016, 8, 606. [Google Scholar] [CrossRef]
- Lisini, G.; Salentinig, A.; Du, P.; Gamba, P. SAR-Based Urban Extents Extraction: From ENVISAT to Sentinel-1. IEEE J. Sel. Top. Appl. Earth Obs. Remote Sens. 2018, 11, 2683–2691. [Google Scholar] [CrossRef]
- Zhang, M.; Chen, F.; Tian, B.; Liang, D. Multi-Temporal SAR Image Classification of Coastal Plain Wetlands Using a New Feature Selection Method and Random Forests. Remote Sens. Lett. 2019, 10, 312–321. [Google Scholar] [CrossRef]
- Lerner, A.M.; Eakin, H. An Obsolete Dichotomy? Rethinking the Rural-Urban Interface in Terms of Food Security and Production in the Global South: An Obsolete Dichotomy? Geogr. J. 2011, 177, 311–320. [Google Scholar] [CrossRef] [PubMed]
- Rogan, J.; Chen, D. Remote Sensing Technology for Mapping and Monitoring Land-Cover and Land-Use Change. Prog. Plan. 2004, 61, 301–325. [Google Scholar] [CrossRef]
- Treitz, P. Remote Sensing for Mapping and Monitoring Land-Cover and Land-Use Change. Prog. Plan. 2004, 61, 267. [Google Scholar] [CrossRef]
- Alqurashi, A.F.; Kumar, L. Investigating the Use of Remote Sensing and GIS Techniques to Detect Land Use and Land Cover Change: A Review. Adv. Remote Sens. 2013, 02, 193–204. [Google Scholar] [CrossRef]
- Danielaini, T.T.; Maheshwari, B.; Hagare, D. Defining Rural–Urban Interfaces for Understanding Ecohydrological Processes in West Java, Indonesia: Part II. Its Application to Quantify Rural–Urban Interface Ecohydrology. Ecohydrol. Hydrobiol. 2018, 18, 37–51. [Google Scholar] [CrossRef]
- Śleszyński, P.; Gibas, P.; Sudra, P. The Problem of Mismatch between the CORINE Land Cover Data Classification and the Development of Settlement in Poland. Remote Sens. 2020, 12, 2253. [Google Scholar] [CrossRef]
- Xu, J.; Chen, C.; Zhou, S.; Hu, W.; Zhang, W. Land Use Classification in Mine-Agriculture Compound Area Based on Multi-Feature Random Forest: A Case Study of Peixian. Front. Sustain. Food Syst. 2024, 7, 1335292. [Google Scholar] [CrossRef]
- Morgan, J.L.; Gergel, S.E.; Coops, N.C. Aerial Photography: A Rapidly Evolving Tool for Ecological Management. BioScience 2010, 60, 47–59. [Google Scholar] [CrossRef]
- Vanderhaegen, S.; Canters, F. Mapping Urban Form and Function at City Block Level Using Spatial Metrics. Landsc. Urban Plan. 2017, 167, 399–409. [Google Scholar] [CrossRef]
- Leung, Y. On the Imprecision of Boundaries. Geogr. Anal. 1987, 19, 125–151. [Google Scholar] [CrossRef]
- Thomas, N.; Hendrix, C.; Congalton, R.G. A Comparison of Urban Mapping Methods Using High-Resolution Digital Imagery. Photogramm. Eng. Remote Sens. 2003, 69, 963–972. [Google Scholar] [CrossRef]
- Yu, D.; Fang, C. Urban Remote Sensing with Spatial Big Data: A Review and Renewed Perspective of Urban Studies in Recent Decades. Remote Sens. 2023, 15, 1307. [Google Scholar] [CrossRef]
Disclaimer/Publisher’s Note: The statements, opinions and data contained in all publications are solely those of the individual author(s) and contributor(s) and not of MDPI and/or the editor(s). MDPI and/or the editor(s) disclaim responsibility for any injury to people or property resulting from any ideas, methods, instructions or products referred to in the content. |
© 2024 by the authors. Licensee MDPI, Basel, Switzerland. This article is an open access article distributed under the terms and conditions of the Creative Commons Attribution (CC BY) license (https://creativecommons.org/licenses/by/4.0/).