Article

Identifying Heterogeneous Willingness to Pay for New Energy Vehicles Attributes: A Discrete Choice Experiment in China

SILC Business School, Shanghai University, Shanghai 201800, China
*
Author to whom correspondence should be addressed.
Sustainability 2024, 16(7), 2949; https://doi.org/10.3390/su16072949
Submission received: 7 February 2024 / Revised: 21 March 2024 / Accepted: 26 March 2024 / Published: 2 April 2024

Abstract

:
New energy vehicles (NEVs) have emerged as a promising solution to reduce carbon emissions and address environmental concerns in the transportation sector. In order to effectively accelerate market acceptance, it is crucial to prioritize the heterogeneity of consumer preferences for NEV attributes. This study employs the multinomial logit model (MNL) and latent class model (LCM) to investigate both observed and unobserved preference heterogeneity based on stated preferences obtained from a discrete choice experiment conducted across seven cities in China. Results from the MNL model indicate that all attributes significantly influence alternative utility. In particular, there are differences in the willingness to pay (WTP) for attributes of battery electric vehicles (BEVs) and plug-in hybrid electric vehicles (PHEVs). Analysis of MNL subgroups reveals observed heterogeneity in WTP for identical attributes among consumers from regions with different latitudes and markets with different NEV penetration rates. Furthermore, the LCM model uncovers unobserved preference heterogeneity by classifying respondents into four distinct classes and identifies specific socioeconomic variables associated with each class. The recognition of heterogeneous WTP for NEV attributes across vehicle types, regions, markets, and consumer classes provides important implications for formulating targeted policies that promote the sustainable development of the NEV industry.

1. Introduction

China is one of the leading automotive markets worldwide. According to the Energy Conservation and New Energy Vehicle Development Report 2022 released by the China Automotive Technology and Research Center, China’s vehicle fleet emitted a total of 770 million tons of carbon and consumed 233 million tons of fuel in 2021. The growing concerns over carbon emissions and fuel consumption have prompted the adoption of new energy vehicles (NEVs) as a viable solution to achieve the sustainable development of the automobile industry in China [1,2,3,4], which offer significant environmental and economic benefits by utilizing renewable energy sources. Generally, NEVs include battery electric vehicles (BEVs) and plug-in hybrid electric vehicles (PHEVs), each with distinct functional and performance characteristics [5]. BEVs operate exclusively on battery power and necessitate a sufficient range and access to charging infrastructure. Conversely, PHEVs feature a hybrid power system that addresses the limited range associated with BEVs’ single power system, providing consumers with more flexibility [6].
Despite the rapid growth rate of the NEV market, its overall market share remains relatively low. As of January 2023, NEVs accounted for only 4.1% of the nationwide passenger vehicle market, and the NEV penetration rates showed substantial disparities across different cities in China [7]. Moreover, the NEV market is transitioning to a post-subsidy phase, characterized by reductions in purchase subsidies and more stringent technological subsidy thresholds [8,9,10]. This transition has resulted in considerable fluctuations in the supply and demand for NEVs. Therefore, it is essential to understand the factors that influence consumer preferences and willingness to pay (WTP) for NEV attributes, as these factors are instrumental in shaping the market demand for NEVs [11,12]. Furthermore, analysis of preference heterogeneity is particularly valuable for policymakers and NEV manufacturers, enabling them to design targeted policy incentives and develop NEV attributes that cater to customers’ preferences and WTP [13,14].
The previous literature has examined consumer preferences for NEV attributes in the Chinese market based on stated preferences [15,16,17,18]. According to random utility theory, respondents make trade-offs among multiple NEV attributes in discrete choice experiments [19]. The consistent findings reveal that functional attributes such as price, range, charging infrastructure, and charging time, significantly influence NEV utility. Moreover, consumers are willing to pay a premium for these attributes [12,13,14,20,21,22,23,24,25]. However, limited attention has been paid to preference heterogeneity, which refers to the difference in perceived value of identical vehicle attributes among different consumer groups [26,27]. Preference heterogeneity is typically categorized into two types: observed heterogeneity, which involves identifiable systematic variations, and unobserved heterogeneity, which encompasses random variations [28].
In terms of observed preference heterogeneity, Xiong and Qin [14] focused on the difference in consumers’ WTP between cities with vehicle restrictions and those without, concluding that driving restrictions significantly influence consumer preference heterogeneity. Huang and Qian [26] investigated preference heterogeneity for EV attributes among cities of different tiers, finding that consumers in smaller cities exhibit a stronger preference for monetary and functional attributes of EVs. Furthermore, regional disparity and different stages of NEV market development in China may also contribute to the heterogeneity of consumer preferences for NEVs across different cities. For instance, in regions with severe winter conditions, there is a marked discrepancy between the real-world driving range and the range determined under controlled laboratory conditions, which presents a significant obstacle to the widespread acceptance of NEVs [29,30]. In addition, a higher market share of NEVs in a specific region can enhance consumer preferences, a phenomenon known as the “neighbor effect” [31]. The increased information flow among consumers and a higher level of knowledge about NEVs are recognized to promote NEV adoption. To further investigate observed preference heterogeneity, we conduct subgroup analyses using a multinomial logit model (MNL) based on latitude and NEV market penetration rate. By comparing the coefficients between groups, we can gain insights into the preference heterogeneity for identical attributes across different regions and markets.
In addition to latitude and market penetration rate, the mixed findings regarding the impact of demographic characteristics on consumer preferences for NEVs highlight the importance of examining unobserved preference heterogeneity at the individual level. The latent class model (LCM) is widely employed to capture unobserved preference heterogeneity, which is effective in identifying the underlying individual causes of preference heterogeneity [20,22,32,33]. Recent systematic reviews indicate that there has been relatively limited research conducted on unobserved preference heterogeneity within the Chinese market. Xiong and Qin [14] applied the LCM model separately in cities with and without vehicle restrictions, and grouped respondents into three classes based on demographic characteristics, each with distinct preferences for NEV attributes. Similarly, Li et al. [34] used the LCM model to investigate heterogeneous consumer preferences across the population when analyzing the effect of policy incentives on BEV preferences. However, these studies primarily focused on the functional attributes of NEVs, such as price, range, charging time, and coverage of charging facilities, while neglecting two emerging technologies, replaceable battery and Vehicle-to-Grid (V2G) technology. NEVs equipped with replaceable batteries enable owners to swap a depleted battery for a fully charged one within minutes during long trips, significantly reducing recharging time and alleviating range anxiety [35]. Moreover, a replaceable battery can eliminate consumer losses caused by battery degradation and slow down the depreciation of NEV value over time. V2G technology allows NEV owners to sell surplus electricity from their vehicle battery back to the grid when profitable, providing additional economic benefits for owners and improving grid efficiency [36]. Thus, these two emerging technologies offer unique value to consumers and may have distinctive influences on consumer preference for NEVs compared to other attributes.
In the post-subsidy phase, it is crucial for policymakers and automobile manufacturers to understand the features and influencing factors of consumer preferences for NEV attributes, in order to encourage purchases beyond subsidies. Particularly, analysis of heterogeneity in preference and WTP can provide important insights into which vehicle attributes are highly valued by different consumer groups and which attributes are aligned with consumer interests in specific regions and markets. Moreover, the identification of consumers with similar preferences facilitates the design of targeted marketing strategies to maximize consumer value. These findings are critical to achieving the sustainable development of the automobile industry and transportation sector. Thus, we conduct a discrete choice experiment to collect stated preferences for NEV attributes in this paper. Our main objectives are to address the following questions:
(1)
What are consumers’ WTP for attributes of BEVs and PHEVs?
(2)
How does WTP for NEV attributes differ across distinct consumer groups based on region and market?
(3)
How does WTP for NEV attributes differ across different consumer classes with different individual characteristics, and what are the underlying sources of preference heterogeneity among the classes?
  • To achieve these objectives, we first use the MNL model to assess consumers’ WTP for NEV attributes, with a specific emphasis on comparison between BEVs and PHEVs. Second, we conduct MNL subgroup analyses based on latitude and NEV market penetration rate to capture the heterogeneity in WTP among different cities. Third, we use the LCM model to capture unobserved preference heterogeneity, and further explain the sources of heterogeneity in WTP across different consumer classes based on socioeconomic variables.
This study makes three key contributions to the existing literature. First, unlike previous studies that concentrate on a single city or certain levels of cities, our survey covers seven cities that exhibit diverse regional characteristics and NEV penetration rates. This broad scope offers valuable insights for the development of NEVs in other Chinese cities with similar characteristics. Second, beyond the examination of functional attributes of NEVs, we incorporate two emerging technologies, replaceable battery, and V2G technology, in a discrete choice experiment. Quantifying consumers’ WTP for these emerging technologies is important for understanding the potential market acceptance of future technological advancements in the automotive industry. Lastly, instead of focusing on a single type of preference heterogeneity, we employ two modeling frameworks, the MNL model and LCM model, to explore both observed and unobserved preference heterogeneity in WTP for NEV attributes across consumers from different regions and markets, and across consumers with different individual characteristics.
The remainder of this paper is structured as follows: Section 2 provides a comprehensive literature review of the WTP for NEV attributes and preference heterogeneity. Section 3 provides detailed information on survey design. Section 4 outlines the specification of discrete choice models and the calculation of WTP. Section 5 presents the findings of regression analysis and estimation of WTP for various vehicle attributes. Section 6 concludes the paper with implications and direction for future research.

2. Literature Review

2.1. Willingness to Pay for NEV Attributes

Previous literature has primarily focused on the functional attributes of NEVs and service infrastructure in the design of discrete choice experiments [23,37]. The purchase price, as a form of monetary payment, has been shown to negatively affect NEV utility [38]. Furthermore, studies consistently demonstrate that consumers exhibit significantly positive WTP for attributes such as fuel cost savings, increased driving range, shorter charging time, and increased coverage of charging facilities [12,13,14,20,21,22,23,24,25,38,39]. For example, Hidrue et al. [20] estimated that an additional mile of electric range is valued between 35 USD and 75 USD, while a one-hour reduction in charging time is valued between 425 USD and 3250 USD. According to Plenter et al. [40], the WTP for EV charging service is 2.42 EUR per hour in suburban area and 11.79 EUR per hour in the city center. Kim et al. [41] reported that a 1% enhancement in charging facility coverage has a WTP of 249 USD. Within the Chinese NEV market, consumers are willing to pay 49,091 CNY for a 200 km increase in driving range, 12,727 CNY for a 5-min decrease in refueling time, and 12,909 CNY for a 20% improvement in the coverage of charging facility [42].
Beyond functional attributes and service infrastructure, demographic factors such as age, gender, education, family size, and household income, and psychological factors also significantly affect consumer preference and WTP for NEVs [8,43,44,45,46,47]. Jansson et al. [48] identified several key psychological drivers behind the adoption of NEVs, including interpersonal influence and attitudinal factors. Costa et al. [49] found that consumers with stronger environmental awareness are more willing to pay for the green economy of NEVs. Furthermore, Salari [50] demonstrated that latent psychological attitudes, such as perception of vehicle attributes and openness to new technology, are crucial determinants of NEV purchase intention.

2.2. Preference Heterogeneity

To capture preference heterogeneity exogenously, research often divides respondents based on research objectives prior to model estimation, followed by subgroup analyses. For example, Helveston et al. [38] analyzed the difference in consumer preferences between the US and China, discovering that US consumers exhibit a higher WTP for PHEVs with shorter driving ranges. Rotaris et al. [51] found that Italian consumers are more sensitive to price, whereas Slovenian consumers prioritize range and fuel economy when making purchasing decisions. In a study by Noel et al. [36], the potential of V2G technology in enhancing NEV preference was examined across five Nordic countries, revealing a significant WTP for V2G only in Norway (5209 EUR) and Finland (3802 EUR). As mentioned earlier, Xiong and Qin [14] and Huang and Qian [26] investigated the heterogeneity in consumers’ WTP for NEV attributes across different cities in China.
The LCM model offers an endogenous approach to capturing heterogeneity in consumer preferences for NEV attributes. In the LCM model, respondents are classified into a finite number of discrete classes based on demographic characteristics, with utility coefficients estimated for each class, respectively. This method allows for the identification of the sources of preference heterogeneity across different classes by examining the impact of demographic characteristics on classification and WTP [52]. Previous research has consistently concluded that respondents with higher WTP for NEV attributes tend to be younger, more educated, exhibit a higher level of environmental concern, possess an interest in new technologies, and engage in an environmentally friendly lifestyle [20,21,22,32,33,53]. Ferguson et al. [33] divided consumers into four classes, revealing that the BEV-oriented class has higher WTP for rapid acceleration and lower maintenance costs. Hidrue et al. [20] applied the LCM model and grouped respondents into two distinct classes: those with a preference for traditional gasoline vehicles and those with a preference for NEVs. They found that NEV-oriented respondents have higher WTP for fuel cost saving and driving range. Recently, Kormos et al. [32] identified five consumer classes with distinct preferences for zero-emissions vehicles in the Canadian market, showing diverse WTP for attributes such as fuel savings, charging access, and refueling access.
Table 1 presents a summary of the relevant literature reviewed, including information on sample size, survey region, models used, and attributes considered. Previous studies have conducted analyses in China and other countries using MNL, LCM, or MXL models, with sample sizes ranging from 394 to 4105. The examined attributes can be divided into three categories: product attributes, service attributes, and policy incentives. Among them, product attributes such as price, cost, driving range, charging time, and service attributes like charging station coverage are frequently examined due to their direct impact on driving satisfaction. It has been consistently concluded that they have a significant effect on consumer preferences for NEVs. Based on the literature review, our focus is on the use of two discrete choice models, the MNL model and the LCM model, to effectively capture both observed and unobserved heterogeneity in preferences and WTP for NEV attributes.

3. Materials and Methods

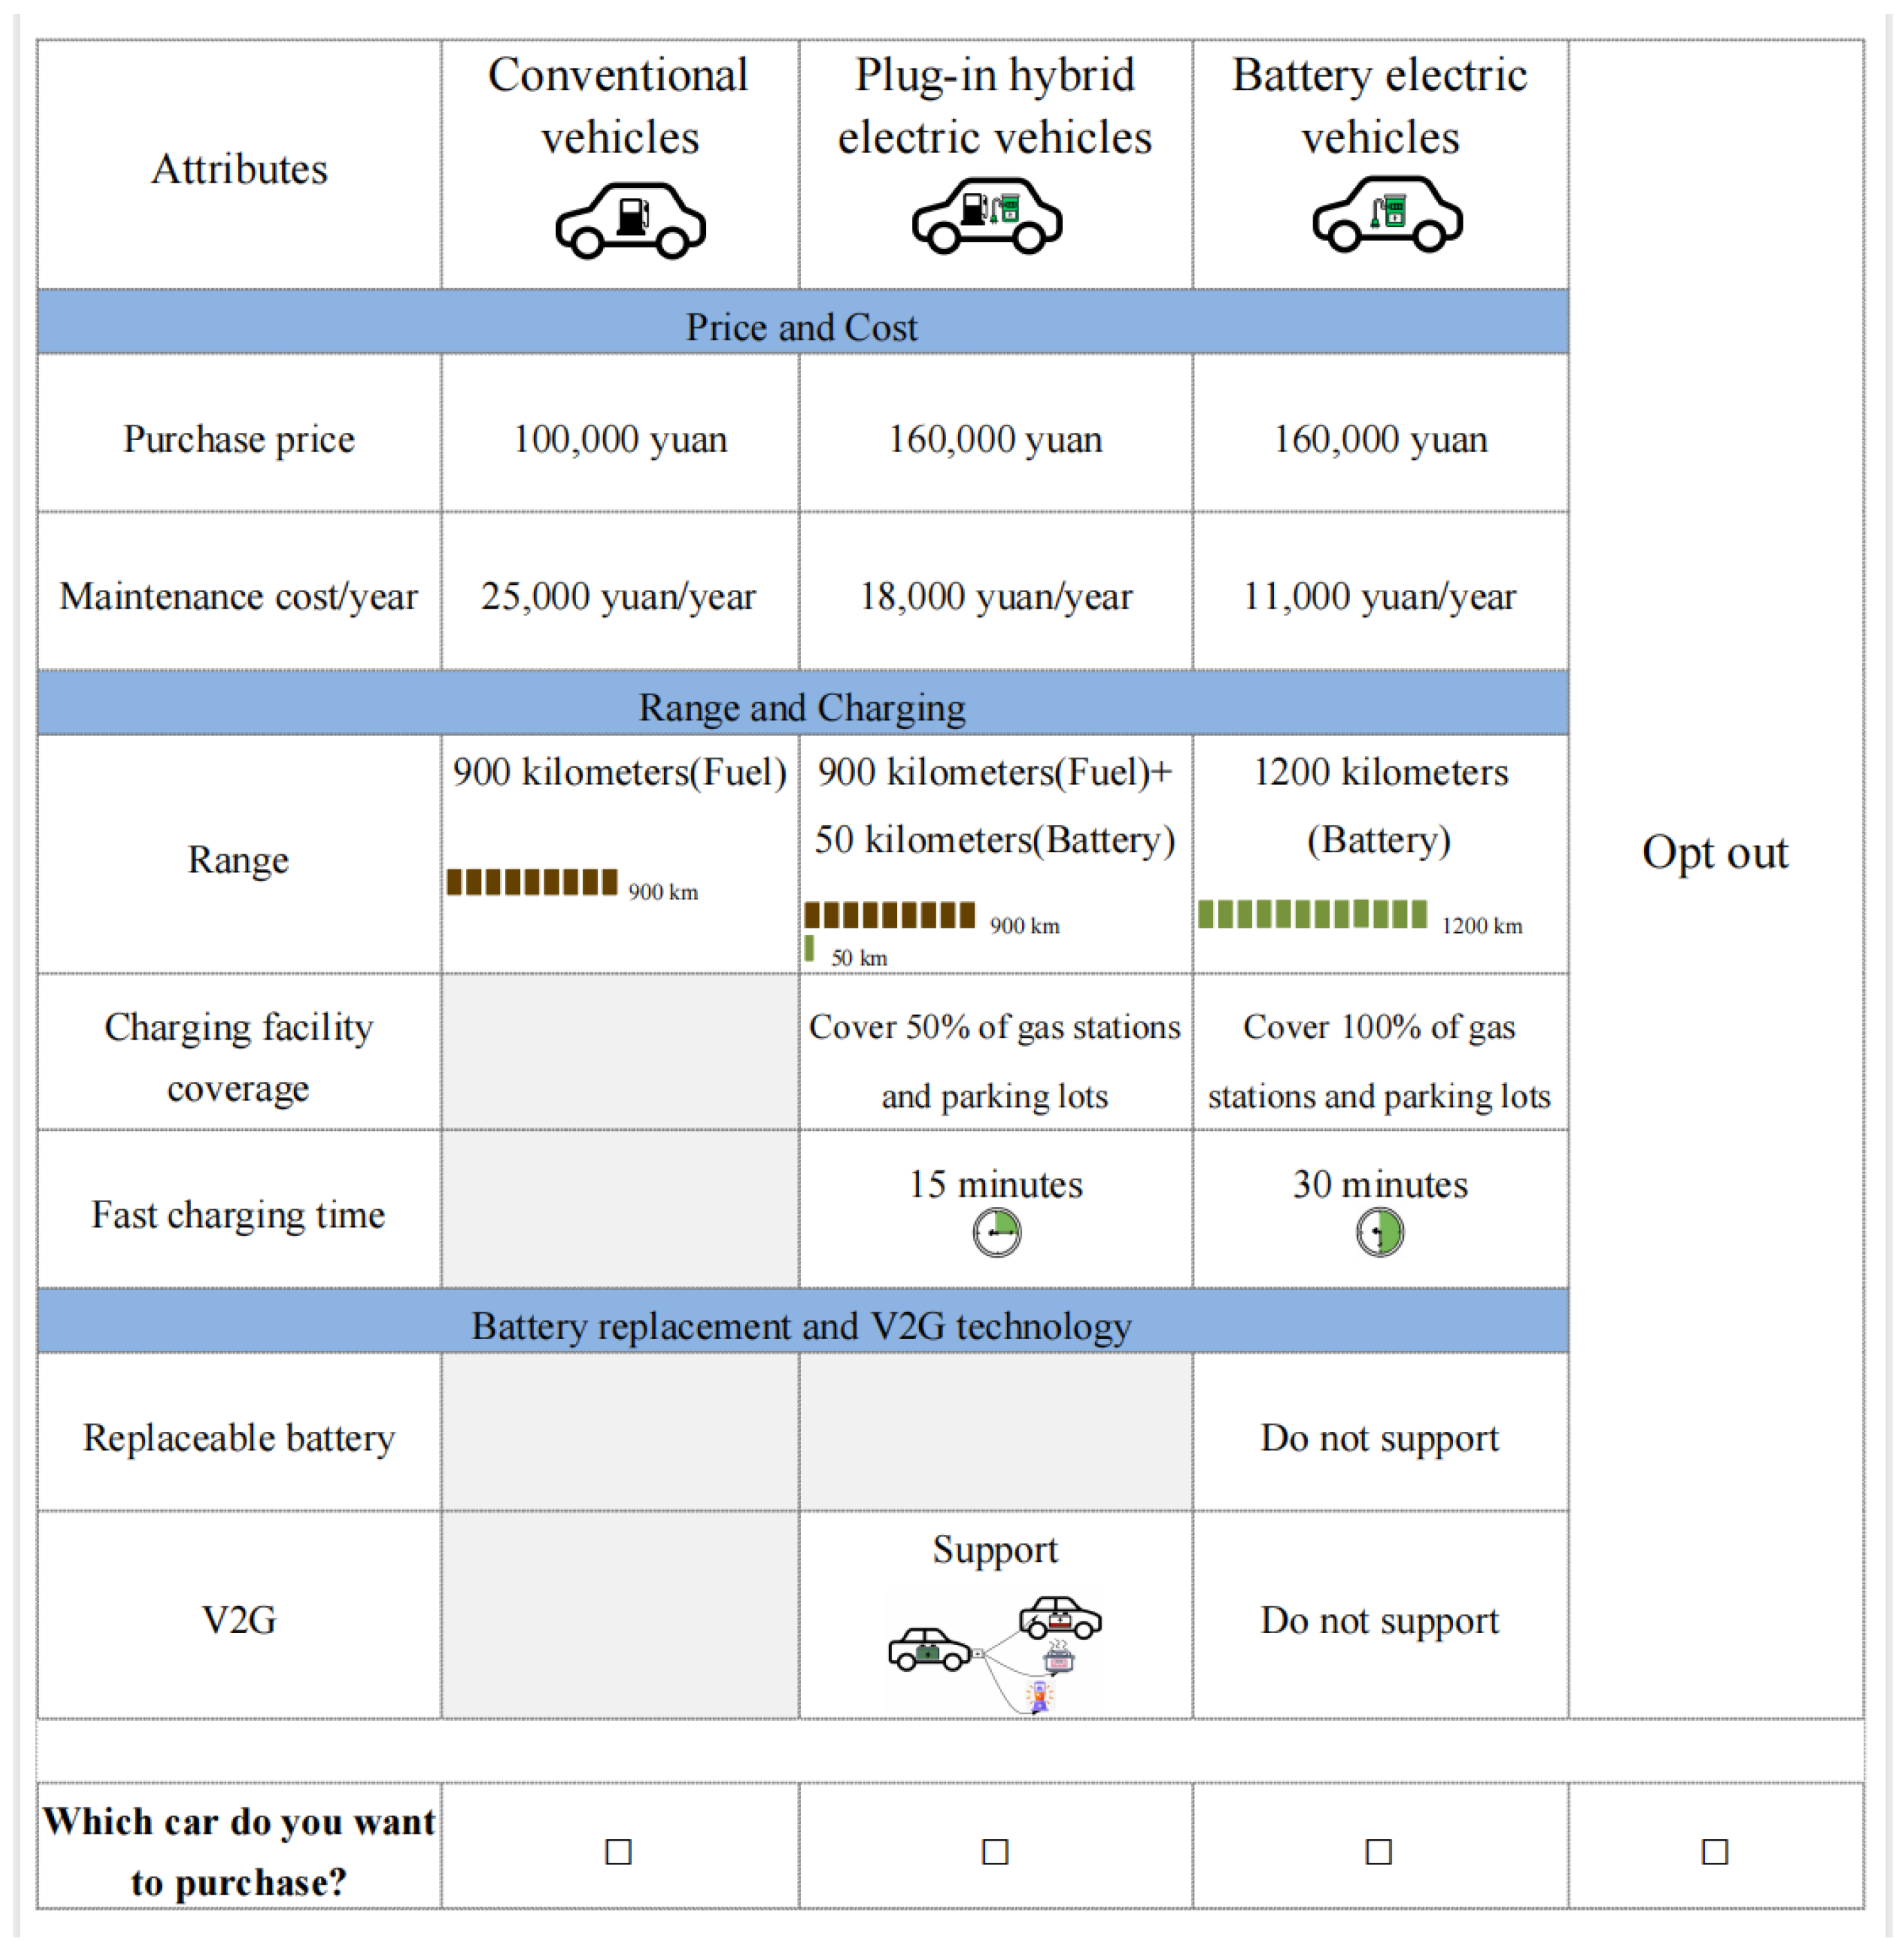
3.1. Discrete Choice Experiment

We conducted a discrete choice experiment (DCE) to collect stated preferences, a method extensively used to assess consumers’ WTP for NEV attributes [54,55]. Based on random utility theory, DCE requires respondents to consider multiple attributes simultaneously within a product portfolio, thereby reflecting the trade-offs they make to optimize their utility, as opposed to evaluating a single attribute in isolation [56]. This approach is more aligned with the real-world decision-making process, where consumers’ overall preference for vehicles is influenced by a combination of attributes, not a single one. In our DCE, we distinguished between BEVs and PHEVs. These two types of NEVs differ in power systems and performance characteristics, which may appeal to different consumer groups [5].
The design of DCE involves several crucial steps: selection of attributes, identification of attribute levels, and generation of choice sets [57]. We selected attributes including purchase price, maintenance cost, range, coverage of charging facilities, and fast charging time, as these factors have been shown to significantly affect NEV utility from previous studies [23] and are of considerable interest to consumers in the Chinese market. Additionally, we particularly incorporated two emerging technologies, replaceable battery, and V2G technology, providing insights into the technological development of the NEV industry in China. Each attribute is categorized into multiple levels. For monetary attributes like price and maintenance cost of conventional vehicles, we employed a pivoting design, setting the base level based on the expected price range specified by respondents before DCE [58]. To generate more realistic choice scenarios, we set the levels of range and fast charging time based on the performance of mainstream vehicles in 2021. Furthermore, we accounted for potential near-term technological advancements relative to the base values for BEVs and PHEVs. Attributes such as range, charging facility coverage, fast charging time, and V2G technology are distinguished between BEVs and PHEVs. Due to smaller battery capacity, PHEVs typically have reduced electric range and require less time to charge than BEVs; only BEVs have replaceable batteries. Table 2 provides an overview of the attributes and respective level settings in DCE.
The product profiles are constructed using a factorial design that randomly combines attributes and levels. If we employed full factor design, there would be an impractically large number of choice scenarios, 4 8 × 2 3 × 3 2 (4,718,592) scenarios in total. To avoid this issue, we adopted an orthogonal main effect factorial design, following the principles of orthogonal balance and D-optimization [59]. Given that the attributes in DCE have two, three, and four levels, we set the number of scenarios to be 48, a choice that effectively balances these levels and is consistent with previous studies [33,60]. D-optimization measures the “goodness” of the orthogonal main effect factorial design in comparison to the full-factorial design. In our study, the D-efficiency reaches 95.66%, indicating that the selected 48 scenarios can sufficiently represent the full set of possible scenarios. Since 48 choice scenarios could be overwhelming for one respondent, we randomly divided them into eight subsets. Each respondent is presented with one subset containing six scenarios. An illustrative example of a choice scenario is depicted in Figure 1. Additionally, we incorporated an opt-out alternative, allowing respondents to forgo making a decision if none of the presented choices maximizes their utility in a given scenario.

3.2. Socioeconomic Variables

In addition to vehicle attributes, consumers’ WTP for NEV attributes is also influenced by the socioeconomic variables of respondents [23,61]. To capture these effects, we collected socioeconomic information from respondents at both the individual and household levels. The socioeconomic variables include gender, age, annual household income, education, living area, number of vehicles owned, access to home charging, family size, a job related to vehicles, need for frequent driving, commuting distance, ownership of BEVs, ownership of PHEVs, expected price range, perception of battery safety, openness to life change, awareness of air pollution, and perception of the environmental benefits of NEVs. These socioeconomic variables are included in the model when examining consumers’ WTP for NEV attributes (see Section 4 for more details). Table S1 displays a detailed description of the definition of variables and summary statistics.

3.3. Data Collection

We carried out DCE and other inquiries through an online survey administered on the SOJUMP platform (https://www.wjx.cn, accessed on 18 September 2023). The survey was conducted in seven major cities in China, including Shanghai, Hangzhou, Nanjing, Beijing, Tianjin, Guangzhou, and Shenzhen. These cities have different NEV market penetration rates in 2022 annual sales, ranging from 35% in Nanjing to 49% in Shenzhen, as reported by the China Association of Automobile Manufacturers (CAAM). Additionally, these seven cities are located in the North (Beijing, Tianjin), East (Shanghai, Hangzhou, Nanjing), and South (Guangzhou, Shenzhen) of China, providing a geographically representative overview of NEV markets in China. The findings regarding WTP for NEV attributes in these cities have important implications for the development of NEVs in other cities.
The survey was conducted twice. The first round was from 30 August to 24 September 2022, and the second round was from 17 August to 18 September 2023. The qualified respondents are individuals who either own vehicles or intend to purchase one within the next three years. These respondents are assumed to be potential consumers of NEVs and possess a basic understanding of vehicles. To ensure their basic understanding of available alternatives and NEV attributes, education content on vehicle types and NEV attributes is provided at the beginning of the survey. Furthermore, nine trap questions are included throughout the survey to further improve data quality, consisting of five questions regarding basic knowledge of NEVs and four designated-response questions. Respondents who fail any trap question are excluded because failing indicates either insufficient NEV knowledge or a lack of careful reading. The response time for each respondent is recorded, with an average of 21 min and a median of 17.98 min. Therefore, we excluded respondents who took less than 10 min or longer than 90 min to complete the survey. Ultimately, 1065 questionnaires are qualified for analysis. Because each respondent is presented with six choice scenarios in one set, there are a total of 6390 experiment observations for analysis (According to the rule methodology proposed by Orme (1998) to determine the required sample size for a DCE method, the required minimum sample size in our case is 111 questionnaires [62]).

3.4. Sample Distribution

Table 3 presents the key demographic characteristics of the 1065 respondents and the comparison with data from China 2020 Population Census Data, which are calculated as weighted averages in seven surveyed cities. The weight assigned to each city is based on their respective sample size. Among the respondents, 36% are from Shanghai, 12% from Hangzhou, 9% from Nanjing, 12% from Beijing, 8% from Tianjin, 11% from Shenzhen, and 14% from Guangzhou. Females represent 54% of the sample, exceeding the weighted mean of census data (48%). The majority of respondents fall within the age group of 25–34 years old. Around 72% of respondents hold a bachelor’s degree. Nearly half of the respondents come from three-member households, which have a larger household size than the census data (2.32 people). Concerning annual household income, a significant portion of respondents falls within the range of 100,000 to 999,000 CNY. Compared to the census data, our sample is skewed toward individuals who are younger, possess higher education levels, and have higher income levels. This is attributed to the criteria to be qualified respondents, either own vehicles or intend to purchase one, and the nature of the online survey.

4. Model

4.1. Discrete Choice Model

The discrete choice model is a common approach to measuring WTP for product attributes, using discrete outcomes as the dependent variable [63]. Based on random utility theory, it is assumed that a rational agent will choose the alternative that maximizes his/her utility [64]. Let U i j and U i k denote the utility that respondent i receive if choosing alternative j and k, respectively. The respondent will choose alternative j in a choice set J if
U i j > U i k , j , k J , k j .
The utility function U i j consists of an observable component ( V i j ) and an error term ( ϵ i j ), as follows:
U i j = V i j + ϵ i j ,
where V i j is a linear combination of alternative attributes including a constant ( X i j ),
V i j = β X i j .
The probability of respondent i choosing alternative j in choice set J, given that the utility derived from alternative j is greater than that of k:
P [ U i j > U i k , j , k J , k j ] = P [ ( V i j V i k ) > ( ε i k ε i j ) , j , k J , k j ] .

4.2. Multinomial Logit Model

The MNL model is a widely used discrete choice model due to its robust ability to interpret parameters. Its coefficients indicate the relative importance of each attribute in determining the alternative utility. In this study, we employ the MNL model to examine the impact of vehicle attributes and socioeconomic variables on NEV preferences, and measure consumers’ WTP for specific attributes of BEVs and PHEVs. To capture the observed preference heterogeneity among consumers from cities with different latitudes and different NEV market penetration rates, we conduct MNL subgroup analyses and explore the heterogeneity of consumers’ WTP for identical attributes.
If two conditions, independence of irrelevant alternatives (IIA) and the identically independently distributed (IID) error term [65], are met, the probability of respondent i choosing option j in the choice set J is:
P i j = exp ( β X i j ) k = 1 J exp ( β X i k ) ,
where X i j consists of generic or alternative-specific attributes, including a constant. Purchase price and maintenance cost are considered generic attributes, while other attributes in DCE are alternative-specific attributes. Socioeconomic variables are incorporated by interacting with alternative-specific constant (ASC) [66]. Furthermore, city- and year-fixed effects are included to control for the influences of NEV policies, NEV technological progress, consumers’ general perception of NEVs, economic growth, and other unobservable factors that vary across cities or over time. β is a vector of coefficients to be estimated. All coefficients are estimated using the maximum likelihood method. Prior to estimating the MNL model, a Hausman test needs to be conducted to verify if the IIA assumption holds.
WTP refers to the monetary value that individuals are willing to pay for a change in attribute level while keeping the overall utility constant [67]. The change in attribute level should cause an equivalent but opposite change in utility compared to the change in purchase price. Based on the MNL model, WTP for NEV attribute x can be calculated as follows:
W T P x = β x β p ,
where β x is the estimated coefficient of attribute x, and β p is the estimated coefficient of price attribute. The significance level of WTP can be obtained using the Delta method.

4.3. Latent Class Model

The LCM model is a logit model that relaxes the IIA assumption in the MNL model and is able to capture unobserved preference heterogeneity. It simultaneously estimates a class utility model and a class membership model [57]. In the class membership model, respondents are grouped into a finite number of identifiable classes based on socioeconomic variables, and the utility model is estimated separately for each class. We adopt the LCM model to investigate the heterogeneous preferences among consumers with different characteristics and explore the source of unobserved preference heterogeneity. The LCM model can endogenously classify consumers into different classes based on individual characteristics and measure WTP for NEV attributes within each class.
Within consumer class c, the conditional probability of respondent i choosing option j in choice set J is:
P i j | c = exp ( β c X i j ) k = 1 J exp ( β c X i k ) ,
where X i j comprises generic or alternative-specific attributes, including a constant. β c is a vector of coefficients to be estimated, which is specific to class c.
The latent class exhibits unobservable endogeneity, and the probability that respondent i belongs to class c based on socioeconomic variables is:
P i c = exp ( θ c Z i ) c = 1 C exp ( θ c Z i ) ,
where θ c is a vector of coefficients in class c, C represents the set of classes, and Z i represents socioeconomic variables of respondent i.
By combining the two probability models in Equations (7) and (8), the unconditional probability for respondent i choosing option j in the choice set J is:
P i j = c = 1 C P i j | c × P i c = c = 1 C exp ( β c X i j ) k = 1 J exp ( β c X i k ) × exp ( θ c Z i ) c = 1 C exp ( θ c Z i ) .
Similar to the MNL model, all coefficients in the LCM model are estimated using the maximum likelihood method. Akaike information criterion (AIC) and Bayesian information criterion (BIC) are two common statistical criteria to determine the optimal number of classes [68]. Moreover, it is crucial to avoid situations where groups are either too large (exceeding 50% of the sample) or too small (falling below 5% of the sample) and ensure the interpretability of differences in utility coefficients [53].
In the LCM model, the WTP of respondents in class c for NEV attribute x can be calculated as follows:
W T P x | c = β x | c β p | c ,
where β x | c and β p | c represent the estimated coefficients of attribute x and price attribute for class c, respectively. Since the two parameters vary across classes, the calculated WTPs are also different across classes, indicating that consumer preferences and WTP for NEV attributes are heterogeneous across consumer classes.

5. Results

In this study, we employ both the MNL model and the LCM model to examine the heterogeneity in consumers’ WTP for NEV attributes across different vehicle types, regions, markets, and consumer classes. The results from the MNL model indicate a significantly negative impact of monetary expenditure on consumer preferences, whereas basic performance has a positive effect. The analysis further demonstrates that consumers generally exhibit higher WTP for range and V2G technology of BEVs compared to the same attributes of PHEVs. The MNL subgroup analyses highlight significant differences in WTP for NEV attributes among consumers from different regions and markets. Consumers in the northern region demonstrate greater WTP for charging facility coverage and PHEV range, consumers in the central region show greater WTP for innovative technologies of BEVs, and consumers in the southern region have relatively lower WTP for most attributes. Compared to markets with high NEV penetration rates, consumers in markets with low penetration rates generally exhibit relatively lower WTP for most BEV attributes. LCM model uncovers the heterogeneity in WTP for NEV attributes among different consumer classes, and identifies the specific socioeconomic characteristics associated with each class. Consumers are classified into four distinct classes: “convenience-oriented class”, “cost-conscious class”, “potential buyer class”, and “conservative class”. Particularly, the “potential buyer class”, characterized by previous experience of NEV purchases, lower vehicle ownership, and recognition of the environmental benefits and battery safety of NEVs, exhibit higher WTP for NEV attributes.

5.1. WTP for Attributes of PHEVs and BEVs

We employ the MNL model to examine the impact of vehicle attributes and socioeconomic variables on NEV preferences and to compare the WTP for identical attributes between BEVs and PHEVs. The Hausman test is conducted, yielding a p-value close to 1 and a chi-square value of −451.83, which confirms the absence of IIA violation and the validity of the MNL model. Table 4 presents the estimated results of the MNL model, including coefficients and WTP. The coefficients of all attributes have the expected signs and are statistically significant at 1% level. Overall, purchase price and maintenance cost have a negative effect on NEV preference. Conversely, other vehicle performance attributes, such as range, charging facility coverage, shorter fast charging time, replaceable battery, and V2G have a positive effect. For example, the coefficient of purchase price is significantly negative ( β = −0.119, se = 0.005), indicating that the higher the price, the lower the consumer’s choice utility. The coefficient of BEV V2G is significantly positive ( β = 0.341, se = 0.058), indicating that V2G technology will increase the alternative utility of BEV. In general, the coefficients show that consumers prefer NEVs with lower prices, lower maintenance costs, longer range, higher coverage of charging facilities, shorter fast charging time, replaceable batteries, and V2G technology.
With estimated coefficients, the WTP for attributes of BEVs and PHEVs can be further calculated. Consumers, on average, are willing to pay 4.27 CNY to reduce annual maintenance costs by 1 CNY for all vehicles. Consistent with prior research [20,22,23,36], consumers demonstrate significant WTP for attributes like longer range, higher coverage of charging facilities, shorter fast charging time, replaceable batteries, and V2G technology.
Notably, there are substantial differences in WTP between BEVs and PHEVs for certain attributes. For instance, consumers are willing to pay 131.84 CNY when the BEV range increases by 1 km, while they are only willing to pay 95.87 CNY for the same increase in the PHEV range. Given that BEVs rely solely on battery power with limited range, and it is generally inconvenient to recharge in the middle of a trip. In contrast, PHEVs, despite their limited electric range, can switch to gasoline when the battery runs out of power, lessening the urgency for extended battery range. Consequently, the higher WTP for the BEV range is understandable. Similarly, consumers are also willing to pay more for V2G technology associated with BEVs (28,576.29 CNY) compared to PHEVs (14,477.78 CNY). This can be attributed to the fact that BEVs typically have excess battery power beyond meeting daily travel needs compared to PHEVs, making it more profitable for BEV drivers to use V2G technology.
Interestingly, when it comes to the reduction of fast charging time, consumers are willing to pay more for PHEVs compared to BEVs. When fast charging time is reduced by 1 minute, consumers are willing to pay 981.60 CNY for PHEVs, while the WTP falls to 622.67 CNY for the same reduction in BEVs. This unexpected result might be due to the case that consumers who choose PHEVs care more about charging or refueling time than the consumers who choose BEVs. Consumers who are less willing to wait for recharging in the middle of a trip prefer PHEVs, and these consumers have a higher WTP for fast charging time.
In contrast to the above attributes, consumers have a similar WTP for charging facility coverage for both BEVs and PHEVs; they are willing to pay 880.63 CNY for BEVs and 899.92 CNY for PHEVs for an increase of 1% in charging facility coverage. Only BEVs have the attribute of replaceable batteries, and consumers are willing to pay 31,300.75 CNY for this attribute, highlighting its perceived value in the BEV market.

5.2. Heterogenous WTP for Attributes across Regions and Markets

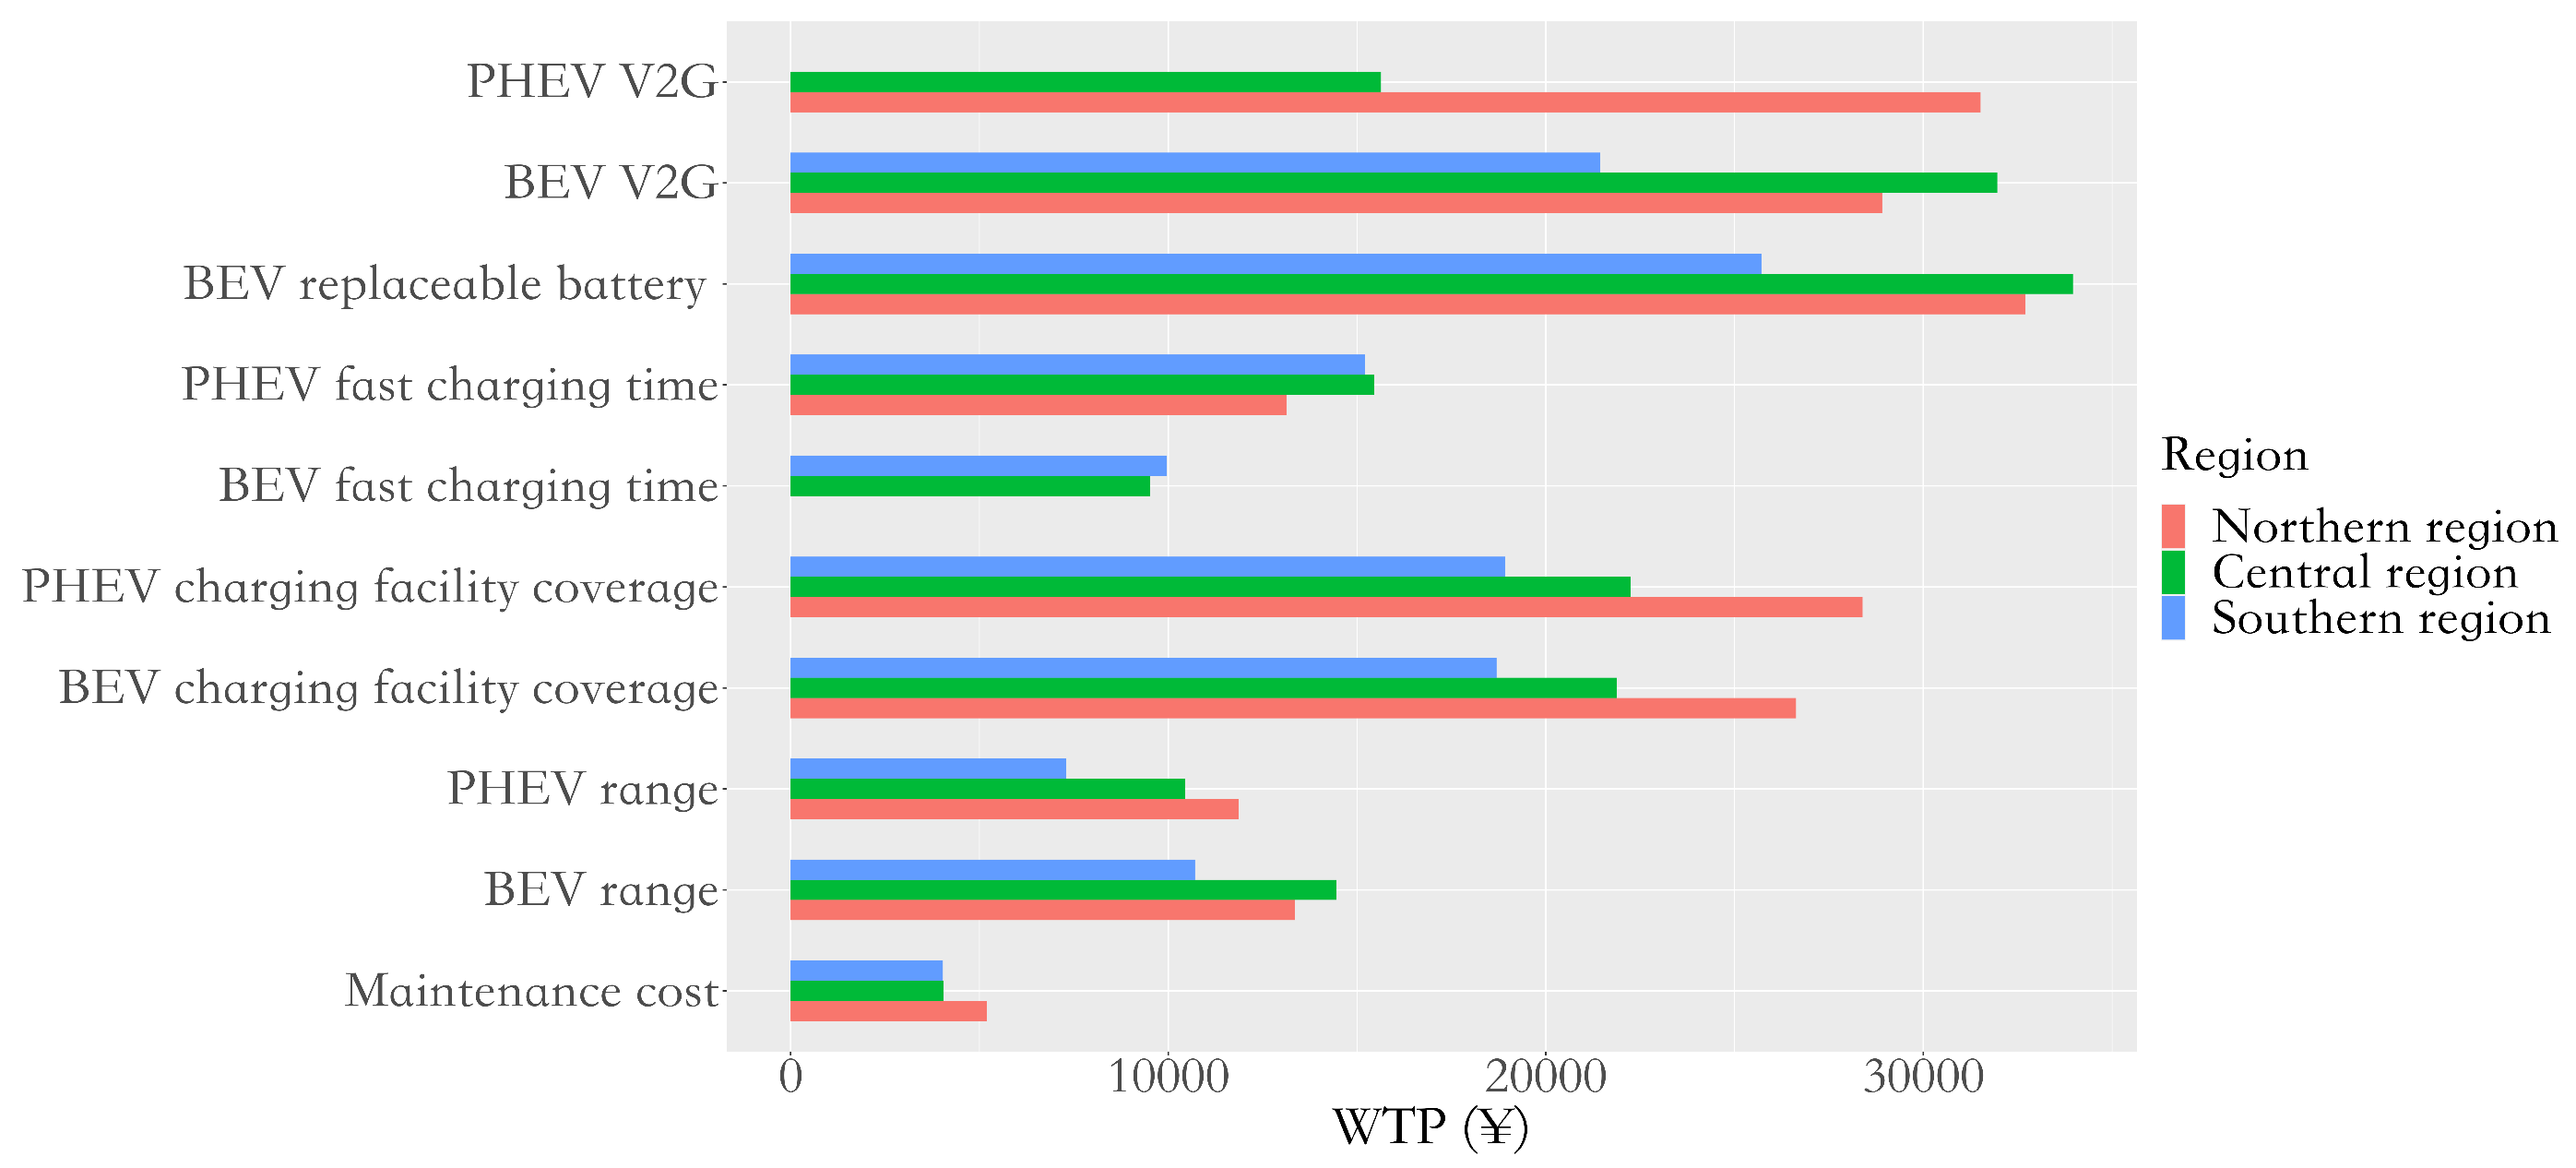
5.2.1. Heterogenous WTP for Attributes across Regions with Different Latitude

We first categorize the seven surveyed cities into three regions based on latitude: the northern region (Beijing and Tianjin), the central region (Shanghai, Nanjing, and Hangzhou), and the southern region (Guangzhou and Shenzhen). The winter temperature in these three regions is significantly different, and a cold winter can cause substantial disparities between the real-world performance and laboratory performance of NEVs [30]. This, in turn, can potentially affect consumers’ WTP for specific attributes. The three MNL models have all passed the Hausman test, indicating that there is no violation of the assumption of IIA. Table 5 presents the coefficient estimates and WTP. Consistent with the MNL model estimated for the whole sample, monetary attributes still significantly reduce alternative utility, while other attributes significantly increase alternative utility in the three regions, except for BEV fast charging time in the northern region and PHEV V2G technology in the southern region. Figure 2 compares the heterogenous WTP for identical attributes across different regions.
In the northern region, consumers exhibit a higher WTP for saving on annual maintenance costs (5.19 CNY), indicating a greater concern for daily operational costs. Furthermore, these consumers care more about charging convenience, exhibiting a higher WTP for charging facility coverage than consumers in the other two regions. The lower temperature in the northern region leads to an unstable battery range, prompting consumers to prioritize charging convenience. This preference has also increased consumers’ WTP for PHEV-related attributes since dual power systems can ensure the reliability of driving. If the PHEV range increases by 1 km, consumers are willing to pay 118.70 CNY, much higher than in the other two regions; their WTP for PHEV V2G technology (31,517.28 CNY) is also significantly higher.
Consumers in the central region demonstrate the highest WTP for replaceable batteries (33,960.99 CNY) and BEV V2G (31,958.03 CNY), indicating their strong preference for these innovative technologies. Based on the sales data for NEVs released by the CAAM, Shanghai and Hangzhou have secured significant portions of NEV market share. Research has found that consumers in pioneer cities usually have higher WTP for NEVs and associated cutting-edge technologies [50]. Additionally, consumers in the central region have the highest WTP for an additional kilometer of BEV range (144.49 CNY) among the three regions, likely because the current BEV range generally meets the daily commuting needs of consumers in this region. Conversely, consumers in the southern region have a higher level of price sensitivity than those in the other two regions, resulting in relatively lower WTP for almost all attributes.

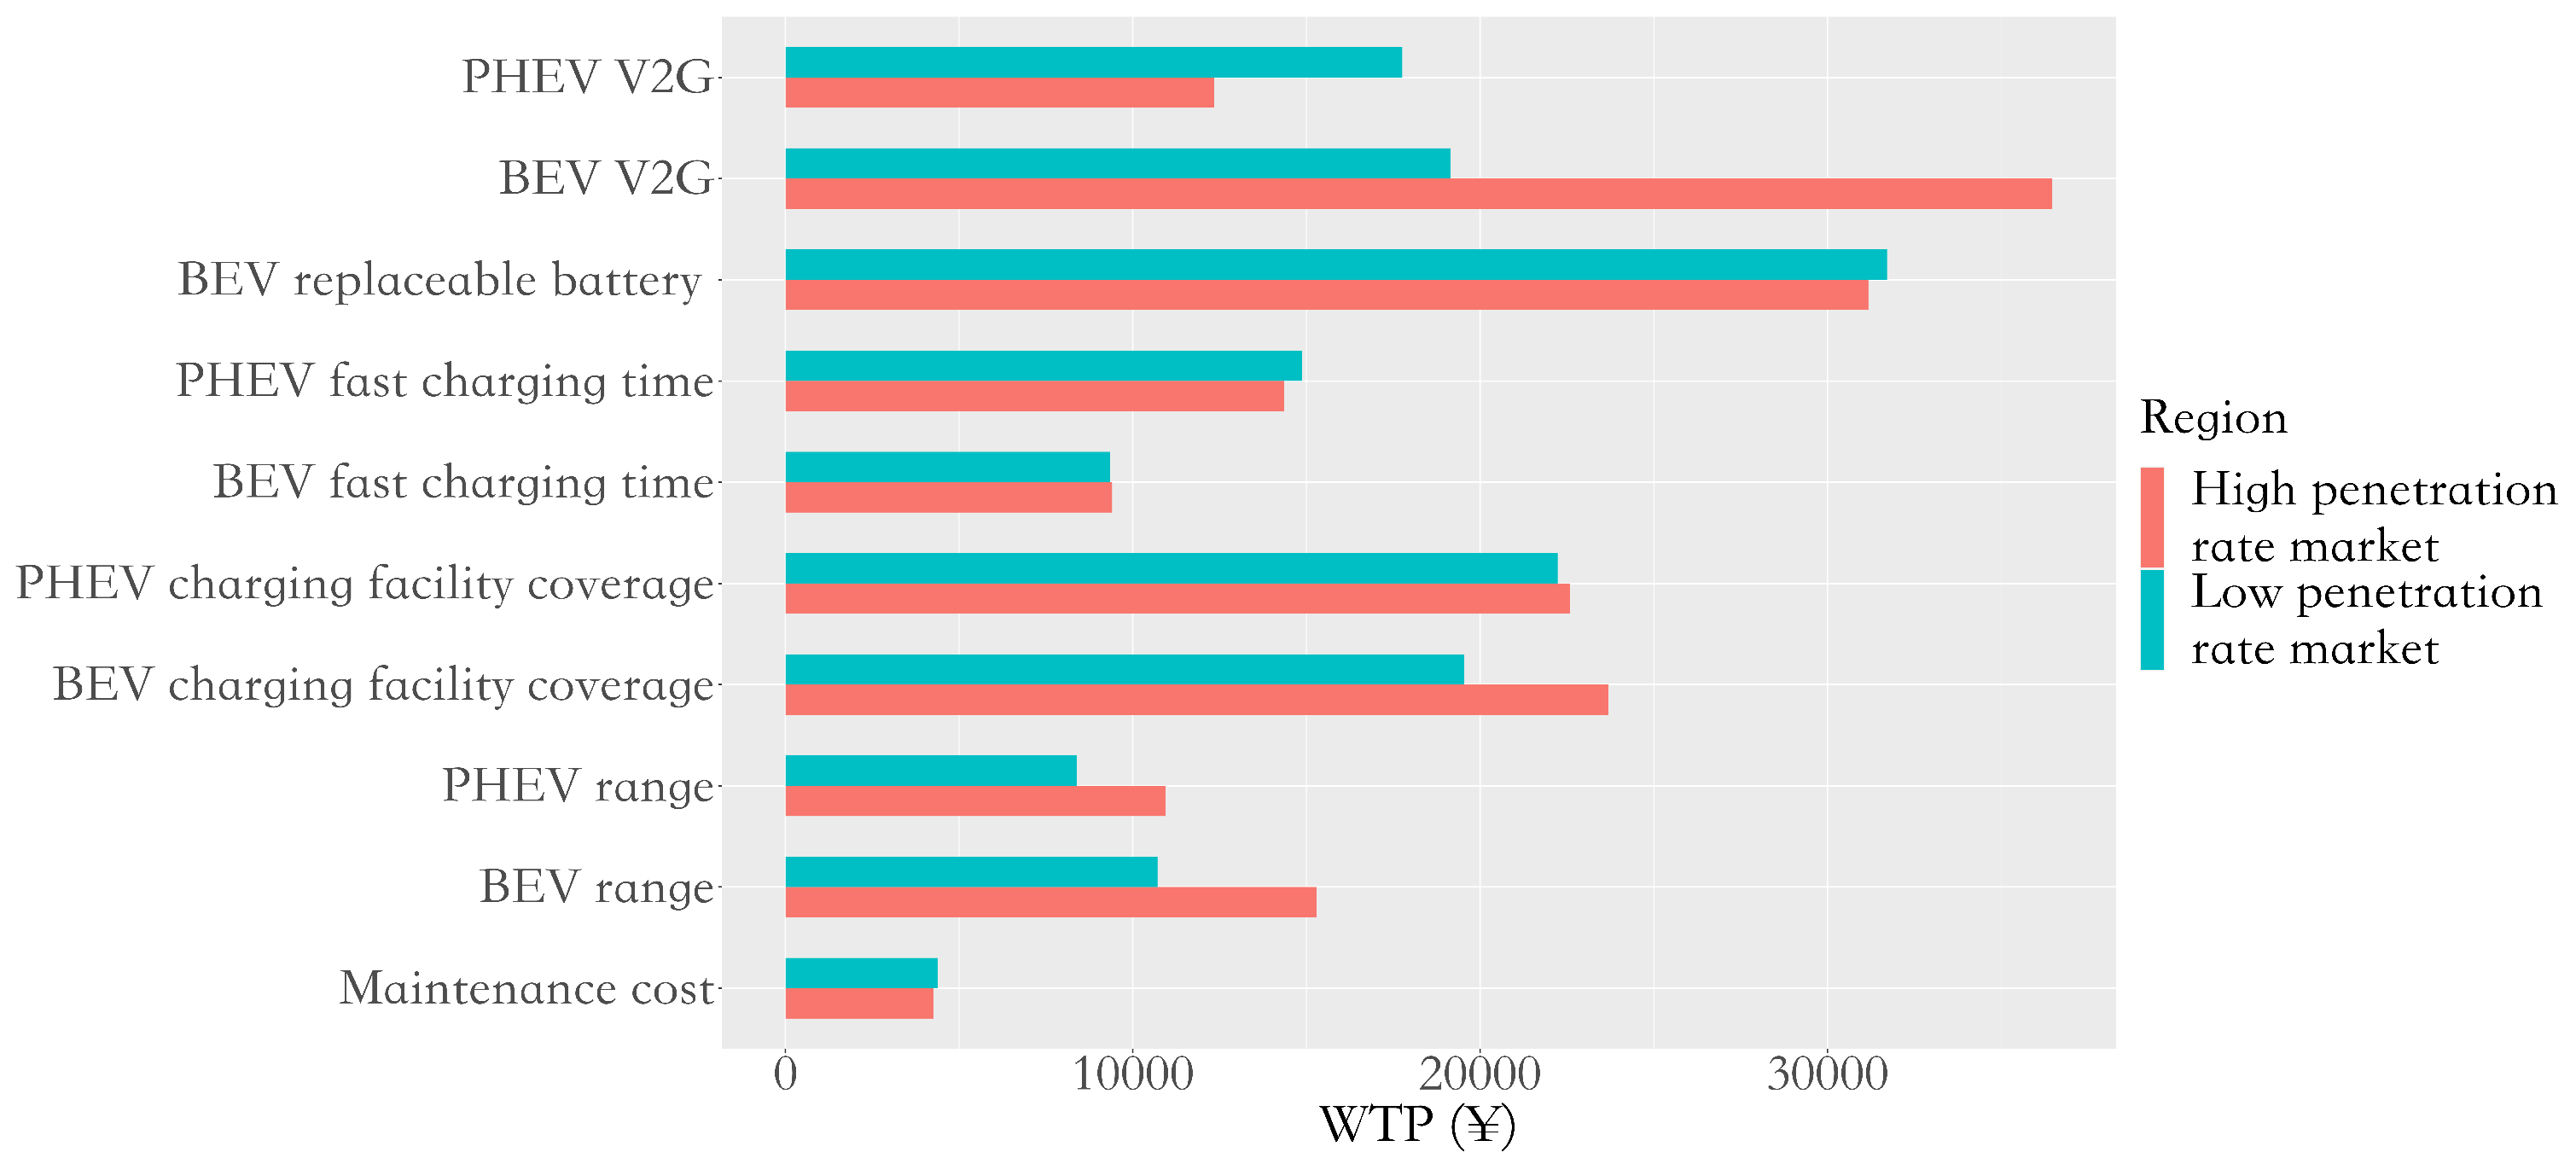
5.2.2. Heterogenous WTP for Attributes across Markets with Different Penetration Rates

Based on data released by the CAAM, the average penetration rate of NEVs in 2022 annual sales exceeded 40% in Shenzhen, Shanghai, and Hangzhou. Therefore, these three cities are categorized as cities with a high penetration rate market. The penetration rate of NEVs in 2022 annual sales in Guangzhou, Tianjin, Nanjing, and Beijing was lower than 40%, so these four cities are classified as cities with low penetration rate market. We conduct analysis for each market type and report results of estimated coefficients and WTP in Table 6. The two MNL models have both passed the Hausman test, confirming the absence of IIA violation. The effects of vehicle attributes on alternative utility in both markets are consistent with the MNL model estimated for the whole sample. Figure 3 compares the heterogenous WTP for identical attributes across different markets. All attributes exhibit statistically significant WTP.
Results indicate that consumers in a high penetration market exhibit higher WTP for almost all BEV attributes and approximately half of the PHEV attributes. In this market, consumers perceive added value in longer range and higher coverage of charging facilities. They are willing to pay more for driving convenience related to both BEVs and PHEVs, with a stronger preference for BEVs. Specifically, their WTP for an additional kilometer of range of BEVs and PHEVs are 152.86 CNY and 109.45 CNY, respectively. In addition, their attention shifts from basic attributes to innovative technologies, especially V2G technology. Their WTP for BEV V2G (36,481.65 CNY) is much higher than that of consumers from a lower penetration market (19,146.38 CNY). These findings suggest that consumers demonstrate a stronger preference for NEV attributes with increasing market penetration. Enhanced information flow in a high penetration market reduces uncertainty and ambiguity regarding NEV performance [31], leading to more positive attitudes toward NEVs, especially BEVs.
In contrast, consumers in a low penetration market prioritize fuel cost reduction and are willing to pay a premium (4.38 CNY) for 1 CNY of savings on annual maintenance costs. Moreover, consumers show slightly higher WTP for shorter fast charging time of PHEVs and replaceable batteries. Furthermore, in a low penetration market, consumers have higher WTP for charging-related attributes of PHEVs than for those of BEVs. For the attributes where the WTP for PHEVs is lower than for BEVs, the difference is also smaller in a low penetration market than in a high penetration market. Previous literature found that PHEVs are usually considered to be a transitional fuel type during the transition from conventional fuel-powered fleets to BEV fleets [69]. Consistent with this finding, consumers in the low NEV penetration market perceive higher values for PHEVs, which possess hybrid power systems and operate more similarly to conventional vehicles, than for BEVs, which require a significant change in traditional driving behavior.

5.3. Heterogenous WTP on Attributes across Consumer Classes

We use the LCM model to estimate heterogeneous WTP for NEV attributes across consumer classes. Before estimation, the appropriate number of classes needs to be determined. The model diagnostics for different class settings are presented in Table 7. With an increase in the number of classes, both AIC and BIC are decreasing. However, when the number of classes is set to 5, Class 5 raises the issue of an excessively small class. Taking all considerations into account, the optimal number of classes is determined to be 4. The proportion of data in each class is 15.3%, 32.7%, 23.8%, and 28.2%, respectively. Class 4 is randomly selected as the base class. This setting ensures the existence of interpretable and meaningful preference heterogeneity.
The LCM model simultaneously estimates both the class utility model (results are reported in Table 8) and the class membership model (results are reported in Table 9). The class utility model allows for a comparison of the effect and significance level of vehicle attributes on alternative utility across four classes in the class utility model. Meanwhile, the class membership model explores the impacts of socioeconomic variables on class membership, which can further explain the source of heterogeneity. In the class membership model, class 4 is set as the base class, and significant coefficients are highlighted in bold. Figure 4 compares the heterogenous WTP for identical attributes across different classes.
In Class 1, BEV ASC negatively influences alternative utility, and consumers’ valuation of maintenance cost savings is not significant. However, there is a higher WTP for coverage of charging facilities and replaceable batteries, suggesting that an extensive network of charging stations and battery replacement could enhance the intention of consumers in this class to purchase NEVs. Therefore, Class 1 is labeled as “convenience-oriented class”. Consumers in this class generally own fewer vehicles, have prior experience in purchasing NEVs, perceive batteries to be safe, have a lower level of openness, and believe that NEVs can reduce air pollution. To attract consumers in this class, manufacturers can promote the application of replaceable batteries and the construction of battery exchange stations to reduce waiting time for charging. Additionally, the enhancement of efficient intelligent charging systems can also better serve the needs of these consumers.
In Class 2, the WTP for annual maintenance cost saving is the highest, at 6.68 CNY per unit saved, indicating a prioritization of cost savings by consumers in this class. Thus, we label Class 2 as “cost-conscious class”. The coefficient for PHEV ASC is significantly positive, showing a preference for PHEVs. Compared to the base class, this class predominantly consists of individuals who have frequent driving needs, have experience in purchasing NEVs, perceive batteries to be safe, and have a higher level of openness. Given that consumers prioritize long-term cost savings, manufacturers can consider reducing daily driving expenses or developing battery technology to enhance the efficiency of energy consumption.
In Class 3, most vehicle attributes exhibit the highest WTP, with BEV ASC having a significantly positive coefficient. Thus, Class 3 is labeled as “potential buyer class”. Consumers in this class have strong environmental consciousness, recognize the environmental advantages of EV, previous experience with NEV purchases, and trust in the safety of electric vehicle batteries. Therefore, they are willing to pay a price premium for NEVs. According to these findings, if manufacturers are able to enhance public recognition of the environmental benefits of NEVs and guarantee the safety of NEV batteries, more consumers will be attracted to choose NEVs and have higher WTP for NEV attributes. It is noteworthy that these consumers have lower vehicle ownership. This contrasts with previous literature suggesting that NEVs are usually chosen as secondary vehicle after a conventional vehicle in a family to address range anxiety and charging waiting time [70]. This difference may be attributed to the strict license plate restrictions in large cities in China. Opting for NEVs as primary family vehicles provides the advantage of obtaining a complimentary license plate.
Class 4 is characterized by significantly negative coefficients for both BEV ASC and PHEV ASC, indicating lower perceived utility for NEVs compared to conventional vehicles. Consumers in Class 4 show the highest sensitivity to vehicle price and the lowest WTP for almost all vehicle attributes. Their WTP for the PHEV range and V2G technology related to both BEVs and PHEVs are even not significant. Therefore, Class 4 is labeled as “conservative class”, who are cautious about NEV reliability. Public education campaigns can be launched to raise public environmental consciousness among consumers in this class. Meanwhile, manufacturers can collaborate with vehicle rental platforms to offer in-depth NEV driving experiences, thereby enriching consumers’ technical knowledge and encouraging initial purchase interest.

6. Conclusions, Implications, and Future Research

6.1. Conclusions

This study employs a discrete choice experiment to collect stated preferences and uses both the MNL model and LCM model to analyze observed and unobserved preference heterogeneity. We examine consumers’ heterogeneous WTP for NEV attributes across different vehicle types, regions, markets, and consumer classes. We find that consumers have different perceptions of value for the same attributes of BEVs and PHEVs, due to the distinct powertrain systems and performance characteristics of BEVs and PHEVs. Furthermore, we find that, beyond the restriction of the license plate and city tier studied by previous literature, regional disparities and varying stages of NEV market development also contribute to the heterogeneity of consumer preferences across cities. Consumers from different regions and markets exhibit substantial differences in WTP for identical NEV attributes. LCM model uncovers the unobserved heterogeneity in WTP for NEV attributes among different consumer classes and identifies that specific attitudinal variables, not only demographic factors, are also associated with higher WTP for these attributes. Notably, the “potential buyer class”, which have the highest WTP for most NEV attributes, is characterized by previous experience with NEV purchases, lower vehicle ownership, and recognition of the environmental benefits and battery safety of NEVs. Especially, high WTP for two innovative technologies, replaceable battery and V2G, suggests strong potential for the future development of these new technologies in the Chinese NEV market.

6.2. Implications

Our findings have important implications for policymaking and industry development. First, NEV manufacturers should pay attention to the differences in consumers’ WTP for identical attributes between BEVs and PHEVs. This discrepancy suggests the necessity for different technology strategies for BEVs and PHEVs. Second, the heterogeneous WTP for the same attributes across consumers from different regions and markets suggests that policy design and market promotions of NEVs should be tailored to the preferences of local consumers. Third, consumers have a higher WTP for the saving of maintenance costs in general. Lowering long-term maintenance expenses can be an effective strategy to encourage more consumers to choose NEVs. Lastly, consumers with higher WTP for NEV attributes typically possess certain socioeconomic characteristics. Identifying and targeting this specific group of consumers should be a priority in the formulation of policy incentives and promotion strategies.

6.3. Limitations and Future Research

This study employs an online survey to collect consumers’ stated preferences and to estimate consumers’ WTP for NEV attributes. It is always ideal to use revealed preferences, which are derived from actual market data, to estimate consumers’ WTP. However, such data for this study is not available for the following two reasons. First, we include two special attributes, replaceable battery and V2G technology. However, replaceable battery technology is only adopted by one brand of NEVs (NIO) in China currently and lacks comparisons among different NEVs; V2G technology has not yet been applied to NEVs in the market, precluding the availability of applicable market data. Second, for other functional attributes, we include some attribute levels that have not yet been achieved to incorporate potential improvements in technology in the near future. Consequently, there is no real market data available for these attribute levels either. Without real market data, we have to rely on stated preferences collected from surveys to measure consumers’ WTP for NEV attributes, which, unfortunately, may introduce “hypothetical bias” or “sample bias”, and may not fully reflect actual purchase behavior. Fortunately, as the two emerging technologies and advanced attribute levels become available in the future, real market data will also become accessible. Therefore, future research can then apply the BLP model with real sales data to further explore consumers’ preferences for NEV attributes by estimating real market supply and demand. Second, in our models, psychological variables are treated as control variables. In future studies, it would be beneficial to integrate latent attitudes into a hybrid choice model (HCM) to enhance the understanding of the decision-making process of consumers.

Supplementary Materials

The following supporting information can be downloaded at: https://www.mdpi.com/article/10.3390/su16072949/s1, Table S1: Variable definition and summary statistics (N=1065); Table S2: Estimated results of MNL Model; Table S3: Estimated results of MNL model for northern region; Table S4: Estimated results of MNL model for central region; Table S5: Estimated results of MNL Model for southern region; Table S6: Estimated results of MNL model for high penetration rate market; Table S7: Estimated results of MNL model for low penetration rate market.

Author Contributions

Conceptualization, H.H. and S.S.; Methodology, H.H. and S.S.; Software, H.H.; Validation, H.H.; Formal analysis, H.H.; Investigation, H.H.; Writing-original draft preparation, H.H.; Writing-review and editing, H.H. and S.S.; Project administration, S.S. All authors have read and agreed to the published version of the manuscript.

Funding

This research received no external funding.

Institutional Review Board Statement

Before starting the data collection, participants were informed about the objective of the research. Participation in the study was fully voluntary and anonymous and subjects could withdraw from the survey at any time and for any reason. Ethical review and approval were dropped for this study since it did not involve direct intervention of the subjects.

Data Availability Statement

The data and estimation codes that support the findings of this study are available from the corresponding author.

Acknowledgments

The authors thank all participants who voluntarily engaged in the data survey.

Conflicts of Interest

The authors declare no conflicts of interest.

References

  1. Elshurafa, A.M.; Peerbocus, N. Electric vehicle deployment and carbon emissions in Saudi Arabia: A power system perspective. Electr. J. 2020, 33, 106774. [Google Scholar] [CrossRef]
  2. Sarsia, P.; Munshi, A.; Sheikh, F.; Yadav, K.; Shukla, P. Driving the Energy Transition: Large-Scale Electric Vehicle Use for Renewable Power Integration. Eng. Proc. 2023, 59, 106. [Google Scholar] [CrossRef]
  3. Xiang, L.; Fan, Y.; Yu, X.; Liang, S. The distributed environmental benefits from driving electrical vehicles-evidence from China. Resour. Conserv. Recycl. 2022, 182, 106338. [Google Scholar] [CrossRef]
  4. Zhang, L.; Qin, Q. China’s new energy vehicle policies: Evolution, comparison and recommendation. Transp. Res. Part A Policy Pract. 2018, 110, 57–72. [Google Scholar] [CrossRef]
  5. Lane, B.W.; Dumortier, J.; Carley, S.; Siddiki, S.; Clark-Sutton, K.; Graham, J.D. All plug-in electric vehicles are not the same: Predictors of preference for a plug-in hybrid versus a battery-electric vehicle. Transp. Res. Part D Transp. Environ. 2018, 65, 1–13. [Google Scholar] [CrossRef]
  6. Sankar, M.M.; Chatterjee, K. A posteriori multiobjective approach for techno-economic allocation of PV and BES units in a distribution system hosting PHEVs. Appl. Energ. 2023, 351, 121851. [Google Scholar] [CrossRef]
  7. Ma, S.; Fan, Y.; Feng, L. An evaluation of government incentives for new energy vehicles in China focusing on vehicle purchasing restrictions. Energy Policy 2017, 110, 609–618. [Google Scholar] [CrossRef]
  8. Liao, Y. Intention of consumers to adopt electric vehicle in the post-subsidy era: Evidence from China. Int. J. Sustain. Transp. 2022, 16, 647–659. [Google Scholar] [CrossRef]
  9. Lu, T.; Yao, E.; Jin, F.; Yang, Y. Analysis of incentive policies for electric vehicle adoptions after the abolishment of purchase subsidy policy. Energy 2022, 239, 122136. [Google Scholar] [CrossRef]
  10. Liu, D.; Zou, H.; Qiu, Y.; Du, H. Consumer reaction to green subsidy phase-out in China: Evidence from the household photovoltaic industry. Energy Econ. 2024, 129, 107270. [Google Scholar] [CrossRef]
  11. Shende, V. Analysis of Research in Consumer Behavior of Automobile Passenger Car Customer. Int. J. Sci. Res. Publ. 2014, 4, 1–8. [Google Scholar]
  12. Bansal, P.; Kumar, R.R.; Raj, A.; Dubey, S.; Graham, D.J. Willingness to pay and attitudinal preferences of Indian consumers for electric vehicles. Energy Econ. 2021, 100, 105340. [Google Scholar] [CrossRef]
  13. Jia, W.; Chen, T. Investigating heterogeneous preferences for plug-in electric vehicles: Policy implications from different choice models. Transp. Res. Part A Policy Pract. 2023, 173, 103693. [Google Scholar] [CrossRef]
  14. Xiong, Y.; Qin, S. Differences in consumers’ product attribute preferences and willingness to pay for new energy vehicles: A comparison between the license plate- and non-license plate-restricted cities in China. Int. J. Sustain Transp. 2022, 16, 57–72. [Google Scholar] [CrossRef]
  15. Yang, J.; Chen, F. How are social-psychological factors related to consumer preferences for plug-in electric vehicles? Case studies from two cities in China. Renew. Sustain. Energy Rev. 2021, 149, 111325. [Google Scholar] [CrossRef]
  16. Wang, N.; Tang, L.; Pan, H. Analysis of public acceptance of electric vehicles: An empirical study in Shanghai. Technol. Forecast. Soc. Chang. 2018, 126, 284–291. [Google Scholar] [CrossRef]
  17. Ma, S.; Xu, J.; Fan, Y. Willingness to pay and preferences for alternative incentives to EV purchase subsidies: An empirical study in China. Energy Econ. 2019, 81, 197–215. [Google Scholar]
  18. Qian, L.; Huang, Y.; Tyfield, D.; Soopramanien, D. Dynamic consumer preferences for electric vehicles in China: A longitudinal approach. Transp. Res. Part A Policy Pract. 2023, 176, 103797. [Google Scholar] [CrossRef]
  19. Friedel, J.E.; Foreman, A.M.; Wirth, O. An introduction to “discrete choice experiments” for behavior analysts. Behav. Process 2022, 198, 104628. [Google Scholar] [CrossRef]
  20. Hidrue, M.K.; Parsons, G.R.; Kempton, W.; Gardner, M.P. Willingness to pay for electric vehicles and their attributes. Resour. Energy Econ. 2011, 33, 686–705. [Google Scholar]
  21. Axsen, J.; Bailey, J.; Castro, M.A. Preference and lifestyle heterogeneity among potential plug-in electric vehicle buyers. Energy Econ. 2015, 50, 190–201. [Google Scholar] [CrossRef]
  22. Hackbarth, A.; Madlener, R. Willingness-to-pay for alternative fuel vehicle characteristics: A stated choice study for Germany. Transp. Res. Part A Policy Pract. 2016, 85, 89–111. [Google Scholar] [CrossRef]
  23. Liao, F.; Molin, E.; van Wee, B. Consumer preferences for electric vehicles: A literature review. Transp. Rev. 2017, 37, 252–275. [Google Scholar] [CrossRef]
  24. Cecere, G.; Corrocher, N.; Guerzoni, M. Price or performance? A probabilistic choice analysis of the intention to buy electric vehicles in European countries. Energy Policy 2018, 118, 19–32. [Google Scholar] [CrossRef]
  25. Danielis, R.; Rotaris, L.; Giansoldati, M.; Scorrano, M. Drivers’ preferences for electric cars in Italy. Evidence from a country with limited but growing electric car uptake. Transp. Res. Part A Policy Pract. 2020, 137, 79–94. [Google Scholar] [CrossRef]
  26. Huang, Y.; Qian, L. Consumer preferences for electric vehicles in lower tier cities of China: Evidences from south Jiangsu region. Transp. Res. Part D Transp. Environ. 2018, 63, 482–497. [Google Scholar] [CrossRef]
  27. Huang, Y.; Qian, L.; Tyfield, D.; Soopramanien, D. On the heterogeneity in consumer preferences for electric vehicles across generations and cities in China. Technol. Forecast Soc. Chang. 2021, 167, 120687. [Google Scholar] [CrossRef]
  28. Li, D.; Miwa, T.; Morikawa, T.; Liu, P. Incorporating observed and unobserved heterogeneity in route choice analysis with sampled choice sets. Transp. Res. Part C Emerg. Technol. 2016, 67, 31–46. [Google Scholar] [CrossRef]
  29. Yuksel, T.; Michalek, J.J. Effects of regional temperature on electric vehicle efficiency, range, and emissions in the United States. Envion. Sci. Technol. 2015, 49, 3974–3980. [Google Scholar] [CrossRef] [PubMed]
  30. Xiong, Y.; Cheng, Q. Effects of new energy vehicle adoption on provincial energy efficiency in China: From the perspective of regional imbalances. Energy 2023, 281, 128324. [Google Scholar] [CrossRef]
  31. Mau, P.; Eyzaguirre, J.; Jaccard, M.; Collins-Dodd, C.; Tiedemann, K. The ‘neighbor effect’: Simulating dynamics in consumer preferences for new vehicle technologies. Ecol. Econ. 2008, 68, 504–516. [Google Scholar] [CrossRef]
  32. Kormos, C.; Axsen, J.; Long, Z.; Goldberg, S. Latent demand for zero-emissions vehicles in Canada (Part 2): Insights from a stated choice experiment. Transp. Res. Part D Transp. Environ. 2019, 67, 685–702. [Google Scholar] [CrossRef]
  33. Ferguson, M.; Moataz, M.; Higgins, C.D.; Abotalebi, E.; Kanaroglou, P. How open are Canadian households to electric vehicles? A national latent class choice analysis with willingness-to-pay and metropolitan characterization. Transp. Res. Part D Transp. Environ. 2018, 58, 208–224. [Google Scholar] [CrossRef]
  34. Li, L.; Wang, Z.; Chen, L.; Wang, Z. Consumer preferences for battery electric vehicles: A choice experimental survey in China. Transp. Res. Part D Transp. Environ. 2020, 78, 102185. [Google Scholar] [CrossRef]
  35. Adu-Gyamf, G.; Song, H.; Obuobi, B.; Nketiah, E.; Wang, H.; Cudjoe, D. Who will adopt? Investigating the adoption intention for battery swap technology for electric vehicles. Renew. Sust. Energ. Rev. 2022, 156, 111979. [Google Scholar] [CrossRef]
  36. Noel, L.; Carrone, A.P.; Jensen, A.F.; Rubens, G.Z.; Kester, J.; Sovacool, B.K. Willingness to pay for electric vehicles and vehicle-to-grid applications: A Nordic choice experiment. Energy Econ. 2019, 78, 525–534. [Google Scholar] [CrossRef]
  37. Rezvani, Z.; Jansson, J.; Bodin, J. Advances in consumer electric vehicle adoption research: A review and research agenda. Transp. Res. Part D Transp. Environ. 2015, 34, 122–136. [Google Scholar] [CrossRef]
  38. Helveston, J.P.; Liu, Y.; Feit, E.M.; Fuchs, E.; Klampfl, E.; Michalek, J.J. Will subsidies drive electric vehicle adoption? Measuring consumer preferences in the U.S. and China. Transp. Res. Part A Policy Pract. 2015, 73, 96–112. [Google Scholar] [CrossRef]
  39. Allahmoradi, E.; Mirzamohammadi, S.; Bonyadi Naeini, A.; Maleki, A.; Mobayen, S.; Skruch, P. Policy Instruments for the Improvement of Customers’ Willingness to Purchase Electric Vehicles: A Case Study in Iran. Energies 2022, 15, 4269. [Google Scholar] [CrossRef]
  40. Plenter, F.; Von Hoffen, M.; Chasin, F.; Benhaus, S.; Matzner, M.; Paukstadt, U.; Becker, J. Quantifying consumers’ willingness to pay for electric vehicle charging. In Proceedings of the 2018 IEEE 20th Conference on Business Informatics (CBI), Vienna, Austria, 11–13 July 2018; pp. 196–203. [Google Scholar]
  41. Kim, J.H.; Kim, H.J.; Yoo, S.H. Willingness to pay for fuel-cell electric vehicles in South Korea. Energy 2019, 174, 497–502. [Google Scholar] [CrossRef]
  42. Li, W.; Long, R.; Chen, H.; Chen, F.; Zheng, X.; He, Z.; Zhang, L. Willingness to pay for hydrogen fuel cell electric vehicles in China: A choice experiment analysis. Int. J. Hydrogen Energy 2020, 45, 34346–34353. [Google Scholar] [CrossRef]
  43. Bryla, P.; Chatterjee, S.; Ciabiada-Bryla, B. Consumer Adoption of Electric Vehicles: A Systematic Literature Review. Energies 2023, 16, 205. [Google Scholar] [CrossRef]
  44. Qian, L.; Yin, J. Linking Chinese cultural values and the adoption of electric vehicles: The mediating role of ethical evaluation. Transp. Res. Part D Transp. Environ. 2017, 56, 175–188. [Google Scholar] [CrossRef]
  45. Thøgersen, J.; Ebsen, J.V. Perceptual and motivational reasons for the low adoption of electric cars in Denmark. Transp. Res. Part F Traffic Psychol. Behav. 2019, 65, 89–106. [Google Scholar] [CrossRef]
  46. Ottesen, A.; Banna, S.; Alzougool, B. Attitudes of Drivers towards Electric Vehicles in Kuwait. Sustainability 2022, 14, 12163. [Google Scholar] [CrossRef]
  47. Bjørge, N.M.; Hjelkrem, O.A.; Babri, S. Characterisation of Norwegian Battery Electric Vehicle Owners by Level of Adoption. World Electr. Veh. J. 2022, 13, 150. [Google Scholar] [CrossRef]
  48. Jansson, J.; Nordlund, A.; Westin, K. Examining drivers of sustainable consumption: The influence of norms and opinion leadership on electric vehicle adoption in Sweden. J. Clean. Prod. 2017, 154, 176–187. [Google Scholar] [CrossRef]
  49. Costa, E.; Montemurro, D.; Giuliani, D. Consumers’ willingness to pay for green cars: A discrete choice analysis in Italy. Environ. Dev. Sustain. 2019, 21, 2425–2442. [Google Scholar] [CrossRef]
  50. Salari, N. Electric Vehicle Adoption Behavior: Synthesizing the Technology Readiness Index with Environmentalism Values and Instrumental Attributes. Transp. Res. Part A Policy Pract. 2022, 164, 60–81. [Google Scholar] [CrossRef]
  51. Rotaris, L.; Giansoldati, M.; Scorrano, M. The slow uptake of electric cars in Italy and Slovenia. Evidence from a stated-preference survey and the role of knowledge and environmental awareness. Transp. Res. Part A Policy Pract. 2021, 144, 1–18. [Google Scholar] [CrossRef]
  52. Boxall, P.C.; Adamowicz, W.L. Understanding Heterogeneous Preferences in Random Utility Models: A Latent Class Approach. Environ. Resour. Econ. 2002, 23, 421–446. [Google Scholar] [CrossRef]
  53. Khan, S.; Maoh, H.; Dimatulac, T. The demand for electrification in canadian fleets: A latent class modeling approach. Transp. Res. Part D Transp. Environ. 2021, 90, 102653. [Google Scholar] [CrossRef]
  54. Alamri, A.S.; Stelios, G.; Stella, S. Discrete choice experiments: An overview on constructing D-optimal and near-optimal choice sets. Heliyon 2023, 9, e18256. [Google Scholar] [CrossRef] [PubMed]
  55. Ling, Z.; Cherry, C.R.; Wen, Y. Determining the Factors That Influence Electric Vehicle Adoption: A Stated Preference Survey Study in Beijing, China. Sustainability 2021, 13, 11719. [Google Scholar] [CrossRef]
  56. Hoyos, D. The State of the Art of Environmental Valuation with Discrete Choice Experiments. Ecol. Econ. 2010, 69, 1595–1603. [Google Scholar] [CrossRef]
  57. Hensher, D.A.; Rose, J.M.; Greene, W.H. Applied Choice Analysis, 2nd ed.; Cambridge University Press: Cambridge, UK, 2015. [Google Scholar]
  58. Qian, L.; Soopramanien, D. Heterogeneous consumer preferences for alternative fuel cars in China. Transp. Res. Part D Transp. Environ. 2011, 16, 607–613. [Google Scholar] [CrossRef]
  59. Vieira, H.; Sanchez, S.M.; Kienitz, K.H.; Belderrain, M.C.N. Efficient, nearly orthogonal-and-balanced, mixed designs: An effective way to conduct trade-off analyses via simulation. J. Simul. 2013, 7, 264–275. [Google Scholar] [CrossRef]
  60. Higgins, C.D.; Mohamed, M.; Ferguson, M.R. Size matters: How vehicle body type affects consumer preferences for electric vehicles. Transp. Res. Part A Policy Pract. 2017, 100, 182–201. [Google Scholar] [CrossRef]
  61. Singh, V.; Singh, V.; Vaibhav, S. A review and simple meta-analysis of factors influencing adoption of electric vehicles. Transp. Res. Part D Transp. Environ. 2020, 86, 102436. [Google Scholar] [CrossRef]
  62. Orme, B. Sawtooth Software Sample Size Issues for Conjoint Analysis Studies. Res. Pap. Ser. 1998, 98382, 237–238. [Google Scholar]
  63. Becker, G.S. The Economic Approach to Human Behavior; University of Chicago Press: Chicago, IL, USA, 1976. [Google Scholar]
  64. Lohmann, S. Rational Choice and Political Science. In The New Palgrave Dictionary of Economics; Palgrave Macmillan: London, UK, 2008. [Google Scholar]
  65. Ben-Akiva, M.; Lerman, S.R. Discrete Choice Analysis: Theory and Application to Travel Demand; MIT Press: Cambridge, MA, USA, 1985. [Google Scholar]
  66. Train, K.E. Discrete Choice Methods with Simulation; Cambridge University Press: Cambridge, UK, 2003. [Google Scholar]
  67. Freeman, A.M. The Measurement of Environmental and Resource Values. Theory and Methods, 2nd ed.; Resources for the Future: Washington, DC, USA, 2003. [Google Scholar]
  68. Louviere, J.J.; Hensher, D.A.; Swait, J.D.; Adamowicz, W. Stated Choice Methods: Analysis and Applications; Cambridge University Press: Cambridge, UK, 2000. [Google Scholar]
  69. Carley, S.; Krause, R.M.; Lane, B.W.; Graham, J.D. Intent to purchase a plug-in electric vehicle: A survey of early impressions in large US cites. Transp. Res. Part D Transp. Environ. 2013, 18, 39–45. [Google Scholar] [CrossRef]
  70. Karlsson, S. What are the value and implications of two-car households for the electric car? Transp. Res. Part C Emerg. Technol. 2017, 81, 1–17. [Google Scholar] [CrossRef]
Figure 1. An example of DCE choice scenario.
Sustainability 16 02949 g001
Figure 2. Comparison of heterogenous WTP for attributes across regions. Note: WTP for each 1000 CNY decrease in maintenance cost, each 100 km increase in BEV range, each 100 km increase in PHEV range, each 25% increase in BEV charging facility coverage, each 25% increase in PHEV charging facility coverage, each 15-min decrease in BEV fast charging time, each 15-min decrease in PHEV fast charging time, BEV replaceable battery, BEV V2G and PHEV V2G.
Sustainability 16 02949 g002
Figure 3. Comparison of heterogenous WTP for attributes across markets. Note: WTP for each 1000 CNY decrease in maintenance cost, each 100 km increase in BEV range, each 100 km increase in PHEV range, each 25% increase in BEV charging facility coverage, each 25% increase in PHEV charging facility coverage, each 15-min decrease in BEV fast charging time, each 15-min decrease in PHEV fast charging time, BEV replaceable battery, BEV V2G and PHEV V2G.
Sustainability 16 02949 g003
Figure 4. Comparison of heterogenous WTP for attributes across classes. Note: WTP for each 1000 CNY decrease in maintenance cost, each 100 km increase in BEV range, each 100 km increase in PHEV range, each 25% increase in BEV charging facility coverage, each 25% increase in PHEV charging facility coverage, each 15-min decrease in BEV fast charging time, each 15-min decrease in PHEV fast charging time, BEV replaceable battery, BEV V2G and PHEV V2G.
Sustainability 16 02949 g004
Table 1. Summary of reviewed literature.
AuthorsSample SizeSurvey RegionModelAttributes
Xiong and Qin (2022) [14]526ChinaLCMPrice, fuel cost, driving range, charging time, emission reduction, subsidy intensity, infrastructure, road use rights
Ma et al. (2019) [17]1719ChinaMNL, MXLPrice, range, charging time, charging station, parking, charging fee, highway use, traffic restriction, bus lane, restriction on vehicle purchase
Qian et al. (2023) [18]507ChinaMNL, MXLPrice, driving cost, range, charging facility coverage, fast charging time, normal charging time, home charging access, government subsidy, vehicle licensing policy
Hidrue et al. (2011)  [20]3029U.S.LCMPrice, range, charging time, acceleration, pollution, fuel cost
Hackbarth and Madlener (2016) [22]711GermanyMNL, LCMPrice, fuel cost, CO2 emission, driving range, fuel availability, refueling time, charging time, policy incentives
Kormos et al. (2019) [32]2123CanadaLCMPrice, incentive, fuel cost, range, recharging time destination recharging, fast charging, H2 refueling access
Li et al. (2020) [34]394ChinaMXL, LCMPrice, range, fast charging time, normal charging time, battery warranty, cost, depreciation rate, charging station coverage, brand, other policy incentives
Noel et al. (2019) [36]4105Denmark, Finland, Iceland, Norway, SwedenMXLPrice, driving range, acceleration, recharging time, fuel type, V2G
Helveston et al. (2015) [38]832US, ChinaMNL, MXLPrice, type, brand, fast charging capability, fuel cost, acceleration
Kim et al. (2019) [41]1000South KoreaMXLPrice, fuel efficiency, accessibility, air pollution, vehicle type
Li et al. (2020)  [42]1072ChinaMNLPrice, driving range, refueling time, fuel cost, emissions reduction, refueling accessibility
Present study1065ChinaMNL, LCMPrice, maintenance cost, range, charging facility coverage, fast charging time, replaceable battery, V2G
Table 2. Attributes and level setting in a discrete choice experiment.
AttributesConventional VehiclePlug-In Hybrid VehicleBattery Electric Vehicle
Purchase priceBase level(1) Base level(1) Base level
(2) +20%(2) +20%
(3) +40%(3) +40%
(4) +60%(4) +60%
Maintenance costBase level(1) Base level(1) −40%
(2) −15%(2) −55%
(3) −30%(3) −70%
Range900 km (Fuel)(1) 900 km (Fuel) + 50 km (Battery)(1) 300 km (Battery)
(2) 900 km (Fuel) + 150 km (Battery)(2) 600 km (Battery)
(3) 900 km (Fuel) + 250 km (Battery)(3) 900 km (Battery)
(4) 900 km (Fuel) + 350 km (Battery)(4) 1200 km (Battery)
Charging facility coverageNo(1) Cover 25% of gas stations and parking lots(1) Cover 25% of gas stations and parking lots
(2) Cover 50% of gas stations and parking lots(2) Cover 50% of gas stations and parking lots
(3) Cover 75% of gas stations and parking lots(3) Cover 75% of gas stations and parking lots
(4) Cover 100% of gas stations and parking lots(4) Cover 100% of gas stations and parking lots
Fast charging timeNo(1) 15 min(1) 15 min
(2) 30 min(2) 30 min
(3) 45 min(3) 45 min
(4) 60 min(4) 60 min
Replaceable batteryNoNo(1) Yes
(2) No
V2GNo(1) Yes(1) Yes
(2) No(2) No
Table 3. Demographic Characteristics of respondents and comparison with census data.
Demographic
Variables
Variable LevelsSample (1065)Census Data
(Weighted Mean)
Frequency Percentage
GenderMale48746%52%
Female57854%48%
Age≤19202%3%
20–2413513%7%
25–3455552%23%
35–4428226%19%
45–54575%17%
≥55162%31%
EducationalHigh school or below353%66%
College graduation10410%14%
Bachelor’s degree77072%
Master’s degree14714%21%
Doctor’s degree91%
Family size1394%2.32 people
2969%
353750%
425524%
≥513813%
Annual household income≤CNY 99,000394%
CNY 100,000–CNY 199,00022521%
CNY 200,000–CNY 299,00031630%
CNY 300,000–CNY 499,00029528%
CNY 500,000–CNY 999,00015214%
CNY 1,000,000–CNY 1,999,000313%
CNY 2,000,000–CNY 4,999,00061%
≥CNY 5,000,00010%
CityShanghai38336%
Hangzhou12412%
Nanjing919%
Beijing12412%
Tianjin838%
Shenzhen11211%
Guangzhou14814%
Note: Census data are from China 2020 Population Census Data and retrieved from the Chinese Research Data Services (CNRDS) Platform. Census data are the weighted mean of seven cities, with each city’s weight calculated based on its sample size. Certain percentages do not add up to 100% due to rounding reasons.
Table 4. Estimated results of MNL model.
VariablesCoefficientWTP b
BEV ASC−2.164 *** (0.426)-
PHEV ASC−0.673 (0.424)-
Opt out ASC−2.784 *** (0.599)-
Purchase price−0.119 *** (0.005)-
Maintenance cost−0.509 *** (0.047)4.27
BEV range0.002 *** (0.000)131.84
PHEV range0.001 *** (0.000)95.87
BEV charging facility coverage0.011 *** (0.001)880.63
PHEV charging facility coverage0.011 *** (0.001)899.92
BEV fast charging time−0.007 *** (0.002)622.67
PHEV fast charging time−0.012 *** (0.002)981.60
BEV replaceable battery0.374 *** (0.058)31,300.75
BEV V2G0.341 *** (0.058)28,576.29
PHEV V2G0.173 *** (0.061)14,477.78
Socioeconomic variables × ASC aYes
City fixed effectYes
Year fixed effectYes
# of observations6390
McFadden R20.15519
Log Likelihood−6524.6
Note: The parentheses represent standard errors, and *** indicate significance at the 1% significance level. a Socioeconomic variables interacted with ASC are controlled and the estimated results for these variables are reported in Table S2 in the Supplementary Materials. b WTP is presented in CNY. At the time of data collection, 1 USD = 6.88 CNY (2022), 1 USD = 7.18 CNY (2023).
Table 5. Estimates for heterogenous WTP for attributes across regions.
VariablesNorthern RegionCentral RegionSouthern Region
Coefficient WTP b Coefficient WTP b Coefficient WTP b
BEV ASC−4.471 ***-−1.870 ***-−0.492-
(0.975)(0.547)(1.009)
PHEV ASC−2.566 ***-−0.722-1.311-
(0.965)(0.545)(0.995)
Opt Out ASC−5.045 ***-−2.720 ***-−1.111-
(1.440)(0.766)(1.413)
Purchase price−0.120 ***-−0.112 ***-−0.145 ***-
(0.010)(0.006)(0.010)
Maintenance cost−0.624 ***5.19−0.456 ***4.05−0.584 ***4.03
(0.109)(0.062)(0.097)
BEV range0.002 ***133.490.002 ***144.490.002 ***107.11
(0.000)(0.000)(0.000)
PHEV range0.001 **118.700.001 ***104.440.001 *72.97
(0.001)(0.000)(0.001)
BEV charging
facility coverage
0.013 ***1065.130.010 ***875.390.011 ***747.72
(0.002)(0.001)(0.002)
PHEV charging
facility coverage
0.014 ***1135.670.010 ***889.820.011 ***756.69
(0.003)(0.002)(0.002)
BEV fast
charging time
−0.007-−0.007 ***634.70−0.010 ***664.49
(0.004)(0.002)(0.004)
PHEV fast
charging time
−0.011**875.07−0.012 ***1030.06−0.015 ***1013.83
(0.004)(0.003)(0.004)
BEV replaceable
battery
0.393 ***32,701.960.382 ***33,960.990.372 ***25,711.06
(0.134)(0.077)(0.120)
BEV V2G0.347 **28,907.840.359 ***31,958.030.311 **21,446.28
(0.136)(0.078)(0.121)
PHEV V2G0.379 ***31,517.280.176 **15,632.760.045-
(0.141)(0.082)(0.125)
Socioeconomic variables × ASC aYes Yes Yes
City fixed effectYes Yes Yes
Year fixed effectYes Yes Yes
No. of observations1242 3588 1560
McFadden R20.20123 0.16386 0.18241
Log Likelihood−1170.0 −3655.4 −1538.9
Note: The parentheses represent standard errors, and *, **, and *** indicate significance at the 10%, 5%, and 1% significance level, respectively. a Socioeconomic variables interacted with ASC are controlled and the estimated results for these variables are reported in Tables S3–S5 in the Supplementary Materials. b WTP is presented in CNY. At the time of data collection, 1 USD = 6.88 CNY (2022), 1 USD = 7.18 CNY (2023).
Table 6. Estimates for heterogenous WTP on attributes across markets.
VariablesHigh Penetration
Rate Market
Low Penetration
Rate Market
Coefficient WTP b Coefficient WTP b
BEV ASC−2.174 ***-−2.651 ***-
(0.527)(0.681)
PHEV ASC−0.541-−0.838-
(0.518)(0.678)
Opt Out ASC−2.907 ***-−3.477 ***-
(0.724)(0.993)
Purchase price−0.110 ***-−0.136 ***-
(0.006)(0.007)
Maintenance cost−0.471 ***4.27−0.596 ***4.38
(0.061)(0.074)
BEV range0.002 ***152.860.001 ***107.15
(0.000)(0.000)
PHEV range0.001 ***109.450.001 ***83.83
(0.000)(0.000)
BEV charging
facility coverage
0.010 ***947.860.011 ***781.95
(0.001)(0.002)
PHEV charging
facility coverage
0.010 ***903.640.012 ***889.35
(0.001)(0.002)
BEV fast
charging time
−0.007 ***627.14−0.008 ***623.34
(0.002)(0.003)
PHEV fast
charging time
−0.011 ***957.32−0.013 ***991.91
(0.002)(0.003)
BEV replaceable battery0.344 ***31,178.010.431 ***31,720.87
(0.076)(0.090)
BEV V2G0.402 ***36,481.650.260 ***19,146.38
(0.076)(0.091)
PHEV V2G0.136 *12,348.320.242 **17,762.69
(0.080)(0.095)
Socioeconomic variables × ASC aYes Yes
City fixed effectYes Yes
Year fixed effectYes Yes
No. of observations3714 2676
McFadden R20.15645 0.1798
Log Likelihood−3817.0 −2619.7
Note: The parentheses represent standard errors, and *, **, and *** indicate significance at the 10%, 5%, and 1% significance level, respectively. a Socioeconomic variables interacted with ASC are controlled and the estimated results for these variables are reported in Tables S6 and S7 in the Supplementary Materials. b WTP is presented in CNY. At the time of data collection, 1 USD = 6.88 CNY (2022), 1 USD = 7.18 CNY (2023).
Table 7. Model diagnostics for 2 to 5 latent classes.
No. of ClassesLog-LikelihoodAIC aBIC bAvoid Small or Large Class?
2−6534.627013,179.25213,452.642No
3−6281.973212,755.94413,233.134Yes
4−6071.050212,416.09813,097.088Yes
5−5916.106212,188.21013,073.000No
Notes: Number of respondents n = 1065, number of observations N = 6390. a Akaike information criterion = −2(LL − k), where LL is the Log-likelihood, and k is the number of parameters. b Bayesian information criterion = −2LL + Ln(N) × k, where N is the number of observations.
Table 8. Estimates for LCM model—4 Classes Utility Model.
VariablesClass 1Class 2Class 3Class 4
Coefficient WTP a Coefficient WTP a Coefficient WTP a Coefficient WTP a
BEV ASC−0.898*-−0.665-1.340 **-−2.964 ***-
(0.523)(0.407)(0.578)(0.426)
PHEV ASC0.362-1.816 ***-0.935-−0.465 *-
(0.438)(0.288)(0.641)(0.274)
Opt Out ASC−1.321 **-−6.211 ***-−3.131 ***-−11.648 ***-
(0.585)(0.740)(0.930)(0.762)
Purchase price−0.114 ***-−0.087 ***-−0.085 ***-−0.212 ***-
(0.016)(0.010)(0.013)(0.014)
Maintenance cost−0.231-−0.584 ***6.68−0.509 ***5.98−0.654 ***3.08
(0.176)(0.087)(0.155)(0.115)
BEV range0.002 ***165.760.002 ***206.840.002 ***198.460.002 ***86.70
(0.000)(0.000)(0.000)(0.000)
PHEV range0.001-0.002 ***196.920.002*234.750.001-
(0.001)(0.001)(0.001)(0.001)
BEV charging
facility coverage
0.013 ***1141.250.009 ***1030.180.013 ***1551.730.013 ***629.96
(0.003)(0.002)(0.003)(0.003)
PHEV charging
facility coverage
0.017 ***1514.770.009 ***1021.460.011**1312.870.016 ***736.87
(0.004)(0.002)(0.005)(0.003)
BEV fast
charging time
-0.005-−0.009**998.67−0.012 **1456.49−0.009 **429.51
(0.005)(0.003)(0.006)(0.004)
PHEV fast
charging time
−0.014 **1271.20−0.014 ***1658.38−0.011-−0.015 ***685.82
(0.006)(0.004)(0.008)(0.005)
BEV replaceable
battery
0.618 ***54,415.290.344 ***39,329.570.482 **56,713.810.606 ***28,567.13
(0.170)(0.123)(0.196)(0.148)
BEV V2G0.402 **35,356.560.365 ***41,754.900.645 ***75,792.360.121-
(0.172)(0.125)(0.196)(0.150)
PHEV V2G0.557 ***48,986.360.287 **32,816.440.594 ***69,853.40−0.236-
(0.204)(0.122)(0.220)(0.146)
Note: The parentheses represent standard errors, and *, **, and *** indicate significance at the 10%, 5%, and 1% significance level, respectively. a WTP is presented in CNY. At the time of data collection, 1 USD = 6.88 CNY (2022), 1 USD = 7.18 CNY (2023).
Table 9. Estimation results of LCM model—class membership model.
VariablesClass 1
Coefficient
Class 2
Coefficient
Class 3
Coefficient
Class 4
Coefficient
Male−0.276−0.3200.151-
(0.259)(0.231)(0.245)
Age [Base: 18–24 years old]
   25–34 years old0.050−0.4260.102-
(0.390)(0.328)(0.417)
   35–44 years old0.084−0.792 **0.096-
(0.440)(0.374)(0.468)
   ≥45 years old0.894−0.2580.731-
(0.563)(0.538)(0.617)
Annual household income [Base: ≤CNY199,000]
   CNY200,000–CNY499,0000.055−0.219−0.568 *-
(0.313)(0.298)(0.331)
   ≥CNY500,0000.640−0.158−0.815 *-
(0.462)(0.413)(0.470)
Education [Base: Below bachelor]
   Bachelor degree0.062−0.1310.249-
(0.392)(0.335)(0.394)
   Graduate degree0.4260.0330.670-
(0.524)(0.443)(0.493)
Live in suburb−0.329−0.262−0.122-
(0.306)(0.278)(0.318)
Number of vehicles owned−0.800 ***−0.086−0.981 ***-
(0.284)(0.253)(0.302)
Home charging access−0.0180.020−0.038
(0.284)(0.247)(0.273)
Family size−0.024−0.0100.045
(0.137)(0.121)(0.134)
Vehicle-related job−0.3350.124−0.118-
(0.437)(0.332)(0.421)
Frequent driving need−0.2210.768 **0.407-
(0.421)(0.310)(0.346)
Commuting distance−0.009−0.006−0.006-
(0.011)(0.010)(0.010)
Own BEVs1.178 ***0.801 **1.917 ***-
(0.350)(0.313)(0.346)
Own PHEVs1.027 **1.122 ***0.764 *-
(0.399)(0.353)(0.408)
Expected price range [Base: ≤CNY199,000]
   CNY200,000–CNY300,000−1.292 ***0.1910.424-
(0.321)(0.258)(0.275)
   ≥CNY300,000−2.817 ***1.252 ***0.602-
(1.045)(0.401)(0.495)
Perception on battery safety [Base: Safe]
   Acceptable−1.083 *−0.882 *−2.018 ***-
(0.574)(0.483)(0.481)
   Unsafe−1.378 **−1.563 ***−2.742 ***-
(0.623)(0.539)(0.564)
Openness to life change−0.405 *0.476 **0.262-
(0.232)(0.193)(0.213)
Perceive air pollution0.0660.0030.411 *-
(0.254)(0.228)(0.241)
Believe EVs can reduce air pollution0.970 **0.4062.481 ***-
(0.446)(0.357)(0.785)
Region [Base: Central region]
   Northern region−0.3290.194−0.277-
(0.346)(0.299)(0.347)
   Southern region0.0240.115−0.146-
(0.302)(0.265)(0.296)
Constant2.063 *−0.515−1.519-
(1.220)(1.010)(1.299)
Note: The parentheses represent standard errors, and *, **, and *** indicate significance at the 10%, 5%, and 1% significance level, respectively.
Disclaimer/Publisher’s Note: The statements, opinions and data contained in all publications are solely those of the individual author(s) and contributor(s) and not of MDPI and/or the editor(s). MDPI and/or the editor(s) disclaim responsibility for any injury to people or property resulting from any ideas, methods, instructions or products referred to in the content.

