Article

Pathway to a Sustainable Energy Economy: Determinants of Electricity Infrastructure in Nigeria

1
College of Business, Al Ain University, Al Ain P.O. Box 64141, United Arab Emirates
2
Department of Finance, University of Lagos, Lagos 101017, Nigeria
3
Amity Business School, Amity University Dubai, Dubai International Academic City, Dubai P.O. Box 345019, United Arab Emirates
4
Department of Business Administration, Faculty of Commerce, Tanta University, Tanta P.O. Box 6632110, Egypt
5
Business Department, Higher Colleges of Technology, Abu Dhabi P.O. Box 41012, United Arab Emirates
6
Department of Economics, Bowen University, Iwo 232101, Nigeria
*
Author to whom correspondence should be addressed.
Sustainability 2024, 16(7), 2953; https://doi.org/10.3390/su16072953
Submission received: 11 December 2023 / Revised: 20 March 2024 / Accepted: 27 March 2024 / Published: 2 April 2024
(This article belongs to the Special Issue Energy Economy and Agricultural Economy in Sustainable Development)

Abstract

:
This study examines the link between energy (using electricity generation as a proxy) and sustainable economic growth alongside the mediating role of salient socio-political factors, such as education, life expectancy, government effectiveness, and governance structure, among others, based on data about the Nigerian economy from 1980 to 2022. We employed a battery of econometric techniques, ranging from unit root tests to autoregressive distributed lag bound tests for cointegration and a modified version of the Granger causality test proposed by Dumitrescu and Hurlin. We also employed general-to-specific estimation techniques to examine the possibility of substituting renewable and non-renewable energy sources. Our results suggest a bi-directional Granger causality between electricity generation and sustainable economic growth. This supports the validity of the feedback hypothesis, suggesting that electricity and sustainable economic growth are interdependent. Our results further revealed that socio-political factors significantly impact electricity generation. The results of our general-to-specific estimation techniques suggest that no possibility of substitution exists between the two main energy sources in Nigeria. This has some key policy implications.

1. Introduction

The level of a country’s growth and development largely depends on its level of energy generation, as energy is regarded as the wheels of an economy [1]. The energy economics literature has noted that electricity is at the forefront of the energy bank [2,3,4]. Energy is the crux of growth; access to electricity is the principal factor in achieving sustainable economic growth because it enhances rapid and sustained industrial growth, technological progress, and job creation [5]. According to [6], about 1.2 billion people worldwide (17% of the global population) lacked access to electricity in the year 2013; the record was 84 million higher in the year 2012. The figure decreased to 759 million by the end of 2019 [7].
Several factors account for electricity generation, including economic, demographic, climate, socio-cultural, political, and other factors. Each of these factors is, in some way, connected with electricity generation [8,9]. From an economic perspective, gross domestic product, gross capital formation, government expenditure, credit in the private sector, trade, inflation rate, exchange rate, and economic structure are factors that sharpen electricity generation. Demographic factors include urbanization and gender, among others; climate factors include ecological footprints, variations in temperature, socio-cultural and political factors, including government effectiveness (effective governance), education, life expectancy, and good governance structure. It is expected that a positive relationship exists between economic growth factors (aside from inflation and exchange rates) and electricity generation, as well as a positive relationship between socio-political factors and electricity generation.
Beyond the nexus between electricity generation and economic growth, the role of the ecological footprint is worth studying as it will offer policymakers the available options for preventing nations from being locked into high carbon footprints and dependence on volatile fossil energy prices, hence achieving sustainable growth. Ref. [10] opined that, although energy sector activities are key to the economic growth of a nation, they could also be great catalysts in emission inducement and environmental degradation, if not properly managed. The debate surrounding the nexus between sustainable economic growth, energy generation, and ecological footprint remains inconclusive, as some authors have established a positive relationship among the trio [11], while some authors have noted that a negative relationship exists among them [2]. Others have argued that, at best, the relationship can be described as neutral [12]. The current study attempts to examine this nexus within the context of the electricity generation, sustainable economic growth, and ecological footprint nexus. As a frontier market characterized by a growth-induced model, Nigeria is expected to induce emissions through her economic engagements; hence, it is important to examine the nexus between economic growth, electricity generation, and ecological footprint in Nigeria.
In addition to examining the correlation between traditional electrification sources and economic growth, it is important to examine the possibility of substituting non-renewable energy sources with renewable energy in Nigeria. This is premised on the fact that renewable energy sources are a key to mitigating global warming/climate change, which is currently on the front burner for global policymakers in regard to energy and the environment. It is important to note that while the Global North economies are strongly canvassing for migration towards clean and sustainable energy, the Global South economies, which are largely poor, have been slow or reluctant because most of the Global South economies are at economic tootling age, often characterized with an abundance of non-renewable energy sources [13,14,15,16]. Nigeria is blessed with an abundance of both renewable energy sources and non-renewable energy sources, and it has a growth-oriented economy [17,18,19,20]. Hence, there is a need to find potential environmentally friendly energy sources that will support its pro-growth policy [8,19,21,22]. This current study attempts to examine this potential by accounting for total energy sources and calibrating non-renewable energy sources and renewable energy sources into our model. We provide insight into the possibility of inter-energy substitution between renewable and non-renewable energy sources for electrification in Nigeria.
Nigeria is Africa’s most populous nation, accounting for 1/5th of its population [23]. In terms of GDP, it is one of the largest in the continent. The country is characterized by an energy deficit, with pronounced evidence of a lack of access to adequate, reliable, and good-quality electricity by its citizens, which poses a great challenge to socio-economic development. The availability of electricity generation capacity in the country ranges from 5603 MW to about 12,500 MW [24]. About 58% of the population had access to electricity as of 2016, with urban access standing at 78.4% while only 39.3% of rural dwellers enjoy access to electricity [25].
The goal of this study is to empirically identify the factors that influence electricity generation in Nigeria based on data sourced from 1980 to 2022. Examining the major determinants of electricity generation in Nigeria will help in providing a better perception and description of the existing types of domestic electricity generation, along with an initiative for developing a reliable and sustainable national electricity sector blueprint.
This study contributes to the literature by employing autoregressive distributed lag (ARDL) bound testing techniques and [26] bootstrap autoregressive distributed lag (BARDL) techniques to examine the nature of the relationship between energy, proxied by electricity generation, and economic growth in Nigeria. The choice of these methods lies in their advantages over alternative methods, for instance, ARDL bound tests are superior to the estimation techniques used in [27], among others. First, the ARDL bound tests can be applied irrespective of the variables’ order of integration (either of order zero I(0) or integrated of order one I(1)); provided it is not more than one I(1). Second, the model possesses good statistical data for small sample sizes of 30–40 observations, which is a common phenomenon with single-country datasets like the one employed in the current study. Having established the existence of a long-run relationship among the variables, we proceeded to examine the causal effect among them by employing the [26] Granger causality test. The strength of the [26] Granger causality over other causality techniques is that it is applicable irrespective of the order of integration of the variables and whether the variables in the model are co-integrated. We concluded our analysis by employing the GETs estimate to examine the possibility of substituting non-renewable energy with renewable energy in sustainable electricity generation in Nigeria.
Unlike most of the existing literature [28,29] that has focused on energy consumption, we employed electricity generation based on the fact that, in developing economies, non-technical transmission and distribution losses are often high; hence, electricity consumption figures are underestimated and may be misleading [30,31,32,33]. We calibrated several explanatory constructs to examine the nexus between electricity and economic growth. The constructs are economic variables like real gross domestic product (RGDP), real gross fixed capital formation, financial credit in the private sector as a percentage of the GDP, and socio-cultural and political variables like governance structure, education, life expectancy, and corruption. We expect that each of these variables induces a functional relationship with electricity generation; for instance, an increase in gross capital formation will increase the level of productivity, which implies an increase in the demand for electricity and acts as a catalyst for electricity generation. For the socio-cultural and political variables, we expect governance structure, education, and life expectancy to positively impact both electricity generation and growth.
Against this background, this research attempts to assess the nexus between electricity generation and economic growth, renewable energy sources, non-renewable energy sources, and ecological footprint in Nigeria. We intend to answer the following questions: What drives the quest for electricity infrastructure in Nigeria? In other words, does electricity generation exhibit a long-run relationship with the explanatory variables in Nigeria? If yes, what is the nature of the causality between electricity generation and economic growth, renewable energy sources, non-renewable energy sources, and ecological footprint in Nigeria? If causality is established, what is the possibility of substituting renewable energy sources for non-renewable energy sources in Nigeria?
The remainder of the study is structured as follows: Section 2, which follows this section, deals with the literature review; Section 3 provides the materials and methods; Section 4 presents the results; Section 5 discusses the results; and Section 6 concludes the study.

2. Literature Review

The theoretical note on the relationship between electricity generation and economic growth can be classified into four hypotheses. These are the conservation hypothesis (i.e., unidirectional Granger causality running from electricity generation to GDP); growth hypothesis (suggesting that unidirectional Granger causality runs from GDP to electricity); feedback hypothesis (here, bidirectional Granger causality exists between economic growth and electricity generation); and neutrality hypothesis (where no Granger causality exists between electricity generation and economic growth) [2,34]. These four hypotheses have been tested by the extant literature on different economies, using different methodologies with varying results. Ref. [31] opined that variations in a nation’s characteristics, such as different indigenous energy supplies, political and economic histories, structures, institutions, and cultures, among others, could all be reasons for different results. Ref. [1] noted that methodological issues are key to different results; hence, the debate on this relationship remains inconclusive.
A critical review of the extant literature suggests that the bulk of the discussion on the linkage between economic growth and electricity focuses on electricity consumption with little attention being paid to electricity generation; furthermore, several salient factors were not considered. We attempt to divide the reviewed literature into segments for better understanding.

2.1. Electricity Consumption and Economic Growth

Ref. [35] examined the link between electricity consumption and economic growth in China with a focus on the Asian financial crisis and the global economic meltdown era. The study employed the SVAR model and noted that deviation between the two variables disappears once the economy is stable [36] and documented the existence of a non-linear relationship between electricity consumption and economic growth in Vietnam based on data sourced from 1990 to 2020. Ref. [37] calibrated renewable energy consumption into an economic growth–energy consumption nexus and noted that unidirectional causality runs from macroeconomic factors to renewable energy in Pakistan. The study also documented the existence of bidirectional causality between exchange rate and energy consumption. The results of its variance decomposition analysis suggest that economic growth is key to renewable energy consumption in Pakistan. In Jordan, the authors of [38] employed a multivariate model to analyse annual data on the link between energy and a selection of macroeconomic factors. The results of the VECM analysis revealed that GDP, urbanization, the structure of the economy, and aggregate water consumption are significant and positively related to electricity consumption, while electricity prices are negatively related to electricity consumption. Ref. [25] noted that pricing is a major determinant of energy consumption in Nigeria. The study also noted that electricity consumption induces growth only to the extent of the ability and willingness to consume.

2.2. Electricity Consumption and Ecological Footprint

In Ethiopia, the authors of [39] calibrated climate change’s impact on the energy–economic growth nexus within the context of the environmental Kuznets curve by employing the ARDL model to analyse data sourced from 1981 to 2015. The results suggest that both renewable and non-renewable electricity consumption positively impact economic growth and mitigate carbon emissions in Ethiopia. The study further noted that non-renewable electricity has less impact on growth given its small size in the Ethiopian electricity energy basket. The study further reported the validity of the EKC hypothesis as well as an N-shaped pattern of association between economic growth and CO2 emissions per capita, especially in the long run. In certain Sub-Saharan African economies, the authors of [40] examined the role of economic policy uncertainty in the energy–growth–emissions nexus by employing a one-step system-GMM to analyse a panel dataset sourced from 1996 to 2014. The study noted that a positive relationship exists between macroeconomic policy indicators and electricity generation. The study further observed that real GDP and electricity generation increase CO2 emissions, though economic policy impact on emissions disappears in the long run.

2.3. Energy Consumption and Economic Growth

Ref. [41] employed a battery of econometric models, such as the Maki cointegration test, Ng-Perron, Zivot-Andrews, Kwiatkowski unit root tests, and the FMOLS, DOLS, and CCR estimation techniques, to examine the relationship between economic growth and energy consumption, with urbanization serving as a moderating variable for Nigeria, based on annual data sourced from 1971 to 2014. The study noted that electricity consumption drives economic growth, though evidence abounds to show that urbanization obstructs growth in the long run. In Nepal, the authors of [42] examined the inter-relationship between energy security, electricity, population, and economic growth by employing the ARDL bound test approach to cointegration, as well as the Toda-Yomamoto Granger causality tests, to analyse data sourced from 1975 to 2014. The study observed that there is no long-run relationship between electricity consumption and economic output for the studied economy. The study also noted that a 1% increase in population induces an upward surge in electricity consumption by 4.16% in the long run. The study canvassed for large-scale investment in renewable energy sources, like hydropower, and intended to improve the pursuit of energy efficiency in order to enhance long-run energy security on the one hand and mitigate climate change on the other hand. Ref. [43] built on [42] in order to expand the discussion on the energy security growth–environmental nexus in India. The study calibrated the role of FDI and trade openness to this discussion and employed the ARDL and the VECM Granger causality tests. The results suggest the presence of a co-integration relationship among the variables. The study reported that a 1% increase in FDI will lead to a 0.013% fall in energy use, and that energy use is caused by output, carbon emissions, FDI, and long-term trade openness in the studied economy. The study further noted that the FDI-induced energy efficiency model is key to mitigating climate change in India.
In select European economies, the authors of [44] examined the nexus between renewable energy consumption and economic growth based on data sourced from 1970 to 2019 by employing panel data estimates with structural breaks with sharp and smooth changes, as well as fixed effects models. The study noted that economic growth is significantly influenced by renewable energy consumption, capital stock, and human capital index. Ref. [45] further expanded the work presented in [44] by calibrating the role of CO2 emissions to the nexus between renewable energy and economic growth for the European economies based on panel econometrics analysis, the pool OLS, random effects, and fixed effects in order to conduct its estimates and noted that renewable energy consumption reduces CO2 emissions in the home economy as well as in neighbouring economies. Ref. [46] canvassed for switching from non-renewable consumption to renewable energy in order to achieve sustainable economic growth, sustainable urban cities, and green environment for a selection of economies in Europe and Asia based on the application of the Feasible Generalized Least Square (FGLS) and panel-corrected standard errors (PCSEs). A major flaw of these studies is that they focused on electricity consumption when discussing the nexus between electricity and economic growth.

2.4. Electricity Generation and Economic Growth

The proponents of the electricity generation–economic growth nexus are of the view that non-technical transmission and distribution (T and D) losses are often high, especially in developing economies. According to [47,48,49], T and D losses in developing economies are two or more times higher than in OECD economies, thus electricity consumption figures will be misleading as they are often underestimated. It is therefore rational to focus on electricity generation as an appropriate proxy for electricity when examining the electricity–economic growth nexus. Some of the extant literature on the relationship between electricity generation and economic growth offers mixed results. We attempt to review some of this literature here. The authors of [31] employed ARDL and Granger causality techniques to examine the link between electricity generation and economic growth with exports and prices serving as moderating factors for Malaysia based on data sourced from 1970 to 2008. The study noted that a unidirectional Granger causality runs from economic growth to electricity generation for the studied period. The study supports the relevance of conservation policies in shaping the Malaysian electricity market to support economic growth. In the European Union, the authors of [50] noted that renewable electricity generation supports economic growth. The study employed a battery of econometric tools to analyse panel data sourced from 2000 to 2015 from several European Union member economies and noted that electricity, interconnection, and higher levels of greenhouse gas emissions motivate the development of renewable electricity with point elasticities of 0.55 and 0.87, respectively. The study noted the importance of conservative policy that emphasizes mitigating climate change while promoting the energy–growth nexus.
In the South African electricity sector, the authors of [51] examined six electricity generation mega projects focusing on how project governance scale and scope impact the development of the projects. The study noted that size and uniqueness have a significant impact on the success of the projects. The study noted that governance structure is key to the success of any electricity generation plant in South Africa. In a related development, the authors of [52] observed that socio-cultural and political structures impact the success of electricity projects in Papua New Guinea. The study noted that the dichotomy between Western-style formal governance models adopted after independence and the culturally attuned informal governance model negatively alters the ability to effectively generate appropriate electricity in the studied economy. Ref. [53] noted that the absence of overall plans and approaches and lack of clarity in policies are the main challenges for generating electricity in Sub-Saharan African economies.
Ref. [54] calibrates the role of biomass gasification and decentralized power options into the electricity–economic growth model. The authors canvassed for decentralized biomass gasification-based power generation as an appropriate alternative in India, as it possesses the ability to meet the needs of remote and hilly terrains in India. The study reviewed various technical options for biomass gasification-based options with a focus on the economic implications and the principal factors that shape the viability of biomass-based power generation. Ref. [55] extends the work presented in [54] by canvassing for the adoption of the decentralized crop residue-based power generation as an appropriate remedy to the acute shortage of grid-connected power supply in rural India. The study noted that decentralized power plants have a positive influence on employment and wealth creation. Ref. [56] extends the work presented in [55] by calibrating the impact of techno-economic and social challenges to the discussion on the role of decentralized electricity generation systems on economic growth. The study examined the regional potential and social acceptance of power-to-gas in decentralized co-generation for southwest Germany. The study opined that power-to-gas (PtG) decentralization is key to achieving a sustainable energy pathway, promoting economic growth and reducing unemployment. Ref. [57] opined that economies should be cautious in the direct deployment and direct linking of the generators of decentralized generation units to power distribution systems as they have the potential to alter both the vertical and horizontal power flows, which can provoke overloads and voltage problems. The study advocates for a relaxed, decentralized (but not a fully decentralized) energy/electricity system when attaining economic growth is in view.
Ref. [58] presents a detailed and consistent analysis of the attractiveness of decentralized photovoltaic technologies using both high-resolution spatial data and national reports on the potentiality of renewable energy’s impact on economic growth for a selection of Sub-Saharan African economies. The study develops and builds a new composite indicator that accounts for the interactions among social, political, environmental, and financial factors at a granular regional level for the studied economies. The study opined that electricity induces growth positively but failed to show any positive impact of decentralized electricity on labour and wealth creation.

2.5. Electricity Generation, Economic Growth, Socio-Political Factors

Regarding the impact of governance structure on the decentralized energy system, the authors of [59] noted that, though decentralized energy plant offers numerous advantages over mega plants, some of which include environmental friendliness, lower up-front costs, greater affordability and reliability, and community empowerment, among others, the governance structure essentially determines the success or otherwise of these projects in local communities. The study examines the impacts of governance structure on decentralized power plants in Indonesia and Nepal. For Nepal, the study noted that failure on the part of the donor agency to calibrate stakeholders in the administration of the project negatively impacts the expected outcome of the project. The results from Indonesia suggest that a weak governance structure negatively impacts the outcome of the various decentralized power projects. In Uganda and Zambia, the authors of [60] noted that existing evidence shows that a good governance structure is not observed in the effective management of the various decentralized electricity projects, hence, hampering the expected output. The authors suggest concerted efforts, such as completing regulatory frameworks, improving transparency, and designing meaningful interactions between stakeholders, to foster inclusiveness and responsiveness of energy access governance.
Ref. [61] canvassed for a more severe governance structure in advancing the impact of electricity generation on economic growth. The study built a multiple-criteria decision-aiding model to assess the impact of governance capacities on energy efficiencies for the European Union economies. The study advocates for a more rigid and demanding European legal framework on energy efficiency both in the medium and long term. Ref. [62] opined that good governance and institutional reforms are key to achieving efficiency and optimal productivity that will support growth in the decentralized energy plants in Africa, as this will induce lower discount rates on investment for private sector funding needed to finance the energy sector in Africa. The study built the Electricity Access Governance Index (EAGI), a composite index of energy sector regulatory quality, energy sector governance, and market risk to evaluate the role of different sources of risk as a means of evaluating the role of selected Sub-Saharan African economies.
Ref. [63] calibrated accountability into the energy governance structure to ensure that a multi-level electricity system meets societal needs and expectations. The author stressed the need to focus on issues related to inclusiveness, capacity building, coherence, adaptiveness, and transparency as key to achieving sustainable energy that will support economic growth.
Ref. [2] employed a non-parametric regression technique with Driscoll–Kraay standard errors to analyse data sourced from 1990 to 2017 in a selection of Sub-Saharan African economies. The study intends to discern the nature of the relationship between access to electricity, human development index, political system environment, income level, and income inequality in the studied economies. The authors noted that income inequality hurts access to electricity, whereas income level and human development have a positive impact. The study further canvassed for the enhancement of the political system environment to enhance access to clean and modern electricity, as the negative impact of the political system on income inequality suggests that a good governance environment reduces income inequality.
Ref. [64] factored in the impact of the authoritarian governance regime on electricity generation in Tanzania from 2005 to 2021. The study noted that consistent substantive increases were achieved in electricity under focused centralized dominant regimes, though the results obtained were reduced during the centralized fragmented regimes. The study relied on the political settlement framework.
Summarizing policy contributions or recommendations, the extant literature recommends the adoption of conservative policy tools [30,31,50] for the economies of Malaysia, the European Union, the US, and China and an effective governance structure [51,52] for South Africa and Papua New Guinea. Refs. [55,56] suggested decentralization of power plants as a policy option with the goal of achieving a breakthrough in electricity for India and Germany, respectively, though [58] presents a contrary view to this policy tool for Sub-Saharan African economies. Ref. [59] recommends an effective governance structure that accommodates local/host communities’ input as a policy trust for Indonesia and Nepal. This position was recommended by [60] for Uganda and Zambia, with an emphasis on improving transparency, competitive regulatory framework, and inclusivity, among others.
To advance the impact of electricity generation on economic growth, the authors of [61] canvassed a more severe governance structure [62] and pointed out the role of institutional reforms [63] in order to prioritize capacity building, coherence, adaptivity, and transparency. Ref. [4] advocates for an enhanced political system environment, and [64] recommends a political settlement framework.

Literature on Substitution Effect

A trending topic in energy economics is the potential of substituting non-renewable energy with renewable energy, basically because of issues relating to CO2 emissions. While multinational institutions and global bodies have canvassed for this shift, several resource-rich countries, especially in the Global South, have raised concerns about the possibility of a gradual shift. The extant literature has attempted to examine the possibility of substituting non-renewable energy sources with renewable energy sources, with mixed results. For instance, while [13,14,15,16,44,45,46,65,66,67,68,69,70] have documented instances where NRE was substituted for RE in different economies using different methods, [12,71,72,73,74] have noted that substitutability does not exist among the two classes of energy, as they are often complementary to each other. The variation in the results of these studies could be due to methodology. For instance, the authors of [69] employed a non-linear autoregressive distributed lag and spectral causality model to analyse data sourced from 1984 to 2020 and documented the positive/negative shock on fossil fuel consumption decreases/increases in renewable energy consumption, suggesting a substitutional effect. Ref. [44] employed Seemingly Unrelated Regression on data sourced between 1987 to 2016 for Nigeria and noted that the substitutional effect is valid. Ref. [45] employed the CS-ARDL model for 24 OECD economies from data sourced from 1990 to 2022 and noted that the substitutional effect holds for the studied economies. Ref. [46] employed a revolutionary model to examine the validity of substitution between the two energy sources focused on cement and steel industries in Iran and noted that a weak form of substitution exists. Ref. [65] estimates of 166 economies using the GMM system suggest that the substitutional effect is valid, with corruption playing an inhibiting role. Ref. [66] employed an augmented meta-group model to analyse data sourced from 1995 to 2020 to examine the role of institutional quality and quality of democracy in the transition process from non-renewable energy sources to renewable energy for the G7 economies and noted that these factors are key to the transition to renewable energy from non-renewable energy. Ref. [67] employed fuzzy techniques for India and noted that fossil fuel prices are a motivator for the transition towards renewable energy. Ref. [71] opined that scale, economies, and sitting problems inherent in renewable power generation constitute problems for achieving the substitution of renewable energy for non-renewable energy in ECOWAS member states. The position of [71] was in line with that of [12], noting that complementary effects rather than substitution are valid for at least 8 out of 12 manufacturing industries in OECD economies based on data sources from 1995 to 2009. An earlier study [73] noted that the inter-energy relationship is largely complementary. This position was also upheld by [72]. In a recent development, the authors of [74] assessed the electricity substitution policy of China, using an input–output model to suggest that electricity substitution is not sufficient for China, hence, a complementary model should also the employed to achieve sustainable economic growth in China.

3. Materials and Methods

In the current study, we employed data sourced from several reputable global outlets from 1980 to 2022. For instance, data on macroeconomic variables, like real gross domestic product (RGDP), gross capital formation, total government expenditure, and credit in the private sector as a percentage of GDP, were sourced from the Central Bank of Nigeria Statistical Bulletin [75]; the data on electricity generation capacity and energy sources—renewable energy and non-renewable energy—were sourced from the International Energy Agency [6]. The data on ecological footprints were sourced from the Global Footprint Network [76]; data on socio-political factors like education, governance structure, life expectancy, and corruption were sourced from the World Development Indicator [24].
The study classified the variables employed into four groups. The first group is the dependent variable—electricity generation capacity; the second group comprises the independent variables—economic growth (real gross domestic products (RGDP) were used as a proxy), renewable energy (REN), non-renewable energy (N-REN), and Ecological footprint with economic growth serving as the core-independent variable; this is largely due to the fact that Nigeria is a pro-growth economy [1]. The third group comprises the control variables, which consist of real gross capital formation, total government expenditure, credit in the private sector as a percentage of RGDP, and urbanization rate (The control variables were essentially employed for robustness check). The fourth group is composed of mediating variables, which are largely the socio-political variables, such as governance structure, education, life expectancy, and corruption, that mediate the influence of the independent variables on the dependent variables.

3.1. Methodology

We present the model that represents the nature of the relationship between our variables of interest in Equation (1) as follows:
G e n c a p i t = β 0 + β 1 E C t 1 + β 2 X t + β 3 K t + β 4 E F t + u t
where G e n c a p represents electricity generation capacity; EC is the basket of macroeconomic variables, including RGDP, gross capital formation, total government expenditure, and credit in the private sector as a percentage of GDP, among others; X is a basket of energy sources comprised of renewable and non-renewable energy sources; K represents the socio-political factors, like governance structure, education, life expectancy and corruption, that can influence electricity generation; E F is ecological footprint; and U t is the error term. β 0 is constant, β 1 to β 4 are the coefficients of the explanatory variables, and u t is the time.
Theoretically, we expect a positive relationship between electricity generation and economic growth. For the control variables, we expect a positive relationship between electricity generation and each of real gross capital formations, total government expenditure, and credit in the private sector as a percentage of GDP.
When we replace the dependent variable with each of the independent variables, we expect a negative relationship between renewable energy consumption and ecological footprint, while the relationship between non-renewable energy and ecological footprint remains positive. This is because, while renewable energy inhibits ecological footprints, non-renewable energy spurs ecological footprints. The relationship between electricity generation capacity and each of the socio-political factors is expected to be positive, except for that of corruption.

3.2. Estimation Strategies

Following the extant literature [8,18,20] that employed multivariate models to analyse the short-run and long-run nexus between relevant variables, we employed the unit root tests, the autoregressive distributed lag (ARDL) model, and the [26] Granger causality test. We began our analysis by conducting a unit root test to examine the stationary and cointegration order of the series. Non-stationarity of variables could lead to spurious results. For the ARDL models, the variables must be either integrated at I(0), I(1), or both, but not above I(1) [37]. We employed the traditional Augmented Dickey and Filler (ADF) (1979) and the Perron and Vogelsang (PV) stationary tests to assess the stationary characteristics of the underlying variables. To overcome the problem of heteroscedasticity, we changed all the variables into natural logarithms. The PV test accounts for structural break dates in the series. For a robustness check, the study employed the bootstraps ARDL.

3.3. The ARDL Bound Testing Model

This study employs the ARDL bound approach to examine the existence of cointegration among the variables. Empirically, cointegration is established between two or more variables when there is a long-term equilibrium among them [20]. The ARDL bound test was preferred to others because (i) it is appropriate for a small sample size, as is present the current study; (ii) it can be used when the series is integrated in the order I(0), I(1), or both, but not above I(1); (iii) it can account for the presence of both long- and short-run relationships among the variables examined; (iv) it is more flexible and appropriate for the variable cointegration order when compared with other alternative estimation techniques; and (v) t functions effectively and can handle the potential problems of endogeneity and autocorrelation problems in the dataset [8,18,20].
The ARDL model exhibits two instances of degeneration, suggesting that further integration of the variables is flawed. The first flaw occurs when the lagged explained facet has no significant effect, while the second occurs when the lagged explanatory facets do not have a significant effect. The Bootstrap ARDL techniques employ critical values (CVs) to encapsulate the attributes of the combined integration of each tested series, thereby addressing the issue of stability in standard co-integration findings [77]. This approach allows the endogeneity of several variables, whereas the conventional ARDL model only accommodates one [20,78]. Thus, empirical models that employ numerous variables should adopt this method [77].
Going forward, the co-integration of the electricity generation capacities, economic growth, renewable energy, non-renewable energy, and ecological footprint in Nigeria will be established if the values of ( F s t a t i s t i c o v ) ,   ( t s t a t i s t i c D V ) ,   a n d   ( F s t a t i s t i c I D V ) are more than the CVs of the bootstrap model. The ARDL model is thus presented below:
I n G e n C a p t i t = θ 0 + i = 1 q ρ 1 I n G e n C a p t t j + i = 1 f ρ 2 R G D P t j + + i = 1 f ρ 3 R E N t j + + i = 1 f ρ 4 N R E N t j + + i = 1 f ρ 5 E F t j + π 1 I n G e n C a p t t i + π 2 R G D P t i + π 3 R E N t i + π 4 N R E N t i + π 5 E F t i + ω E C T t 1 + i t
where i t represents the white noise, represents the first difference process operator, θ 0 is the intercept, ρ 1 ρ 5 are the coefficients of explanatory variables in the short term, π 1 π 5 are the coefficients of the explanatory variables in the long term, q is the lag of the dependent variable and represents the lags of the explanatory variables, i and t are subscripts, and ω ECT is the error correction term, which is the speed of adjustment back to equilibrium.
The study estimated several ARDL models with each of the variables of interest servicing as the dependent variables; however, to conserve space, we only present one co-integration equation. Two hypotheses are tested: (i) H 0 : π 1 = π 2 = π 3 = π 4 = π 5 = 0 and (ii) H 1 : π 1 = π 2 = π 3 = π 4 = π 5 = 0 . In the traditional ARDL model, the F-test ( F s t a t i s t i c o v ) is employed on all the lagged variables, and the T-test is employed on the lagged explained factor H 0 : π 1 = 0 to explain the long-run relationship between the variables employed. Ref. [78] expanded the frontier of knowledge by adding an F-test on the lagged independent variables ( H 1 : π 1 = π 2 = π 3 = π 4 = π 5 = 0 ); hence, an advanced ARDL model (with Bootstrap ARDL model) is based on the F-Statistic on the coefficient of overall lagged facets, the t-statistic on lagged explained facets, and the F-Statistic on the lagged explanatory facets. Ref. [78] argued that the model will help in differentiating between co-integration, non-integration and degenerate scenarios.
The study further employed the ‘Jarque—Bera test’ to examine the normality of the dataset ‘Ramsey RESET’ to predict model fit. To test for auto serial correlation, we employed the Breusch Godfrey LM (BG-LM) procedure, and the Brush–Pagan–Godfrey (BPG) test was employed to examine the heterogeneity.
To examine the speed of adjustment back to equilibrium, we employed the Error Correction Model, mathematically expressed as follows:
I n G e n C a p t i t = 0 + i = 1 p δ 1 I n G e n C a p t t j + i = 1 q δ 2 I n R G D P t j + + i = 1 q δ 3 I n R E N t j + + i = 1 q δ 4 I n N R E N t j + + i = 1 q δ 5 I n E F t j + ω E C T t 1 + i t
I n R G D P i t = 0 + i = 1 p δ 1 I n R G D P t j + i = 1 q δ 2 I n G e n C a p t t j + + i = 1 q δ 3 I n R E N t j + + i = 1 q δ 4 I n N R E N t j + + i = 1 q δ 5 I n E F t j + ω E C T t 1 + i t
I n R E N i t = 0 + i = 1 p δ 1 I n R E N t j + i = 1 q δ 2 I n G e n C a p t t j + + i = 1 q δ 3 I n R G D P t j + + i = 1 q δ 4 I n N R E N t j + + i = 1 q δ 5 I n E F t j + ω E C T t 1 + i t
I n N R E N i t = 0 + i = 1 p δ 1 I n N R E N t j + i = 1 q δ 2 I n G e n C a p t t j + + i = 1 q δ 3 I n R G D P t j + + i = 1 q δ 4 I n R E N t j + + i = 1 q δ 5 I n E F t j + ω E C T t 1 + i t
I n E F i t = 0 + i = 1 p δ 1 I n E F t j + i = 1 q δ 2 I n G e n C a p t t j + + i = 1 q δ 3 I n R G D P t j + + i = 1 q δ 4 I n R E N t j + + i = 1 q δ 5 I n N R E N t j + ω E C T t 1 + i t
where is the first difference, i t represents the error term, and W E G t 1 represents the lagged ECT.
To account for the role of control variables in influencing the behaviour of electricity generation capacity in the studied economy, we expand Equation (2) as follows:
I n G e n C a p t i t = 0 + i = 1 p δ 1 I n G e n C a p t t j + i = 1 q δ 2 I n G C F t j + i = 1 q δ 2 I n E X P D t j + i = 1 q δ 2 I n P C R E t j + i = 1 q δ 3 I n R E N t j + + i = 1 q δ 4 I n N R E N t j + + i = 1 q δ 5 I n E F t j + ω E C T t 1 + i t
The variables are as earlier defined.
To assess the role of socio-political factors in influencing the nexus between electricity generation capacity and the set of explanatory variables employed, the study followed [79] and employed the following model:
I n G e n C a p t i t = X 1 I n R G D P i t + K = 1 4 B k I n X i t + φ i t
M i , t , n = X 2 I n G e n C a p t i t + k = 1 4 φ k I n X i t + φ i t
I n G e n C a p t i t = X 3 I n R G D P i t + k = 1 4 X n M i + n + k = 1 4 φ k I n X i t + Σ i , t
M E R n =   / X n .   X n X 1 /
Having established co-integration among our variables of interest, we proceed to examine the nature of causation among the variables by employing the [26] causality test. This is preferred to the existing conventional time domain causality test, as used in [80], because it is appropriate for correctional dependence and heterogeneity, and it is applicable to all categories of N > T/N < T [81,82,83]. The study tests the null hypothesis of no causal linkages between the variables in the model against the alternative that a causal link exists between the variables for at least one cross-sectional unit.

3.4. Substitutional Effect Model

General-to-Specific Estimation Techniques

Regarding the possibility of the existence of inter-fuel substitution between non-renewable and renewable energy, the extant literature is divided into two broad views: the inter-factor view and the inter-fuel substitution view. The former deals with examining the possibility of substitution energy for other factor inputs, like labour and capital in the production system, while the latter focuses on examining the substitution possibilities among competing energy sources, like gas, electricity, coal, wind, solar, and tidal, among others. Several methodological approaches have been put forward to assess the possibility of substitution among the various energy sources; some of these include generalized types of Cobb and Douglas cost functions, the transcendental (trans-log) cost and production functions, the Constant Elasticity of Substitution (CES) function, the Normalized Quadratic (NQ) cost function with different estimation procedures, the Seemingly Unrelated Regression (SUR), and the recently developed general-to-specific estimation techniques [65,84,85,86].
The current study’s adoption of general-to-specific estimation techniques was born out of the approach’s superior performance when compared with the other existing techniques highlighted above. For instance, the techniques account for both the relevance of the theory and the data-generating process (DGP). We first constructed the General Unrestricted Model (GUM), calibrating all the theory-related potential variables and their lags. In doing this, we examined the possibility of having some portion of the data-generating procedure that could be explained with intervention dummies. The GES procedure accounts for Impulse Indicator Saturation (IIS), Step Indicator Saturation (SIS), Differenced Impulse Indicator Saturation (DIIS), and break-in trends (trend indication saturation) (TIS) dummies for each observation. The second stage of our analysis begins with keeping the chosen dummies fixed, while we search for theory-relevant variables. Our procedure attempts to ‘approximate’ the local data-generating process, targeting the congruency of the final model with the general unrestricted model, following [87,88,89,90]. We employed the general unrestricted model as stated below:
G e n c a p t = α 0 + 1 2 α i G e n c a p t + 3 4 α i R G D P t 1 + 5 6 α i R E N t 1 + 7 8 N R E N t 1 + 9 10 E F t 1 + 1 T β i I I S t + 1 T γ i S I S t + 1 T δ i D I I S t + 1 T θ t T I S t + ε t
where α i ’s represents the estimated coefficients, the variables are as earlier defined, and the dummies are as earlier defined by the GETs model.

4. Results

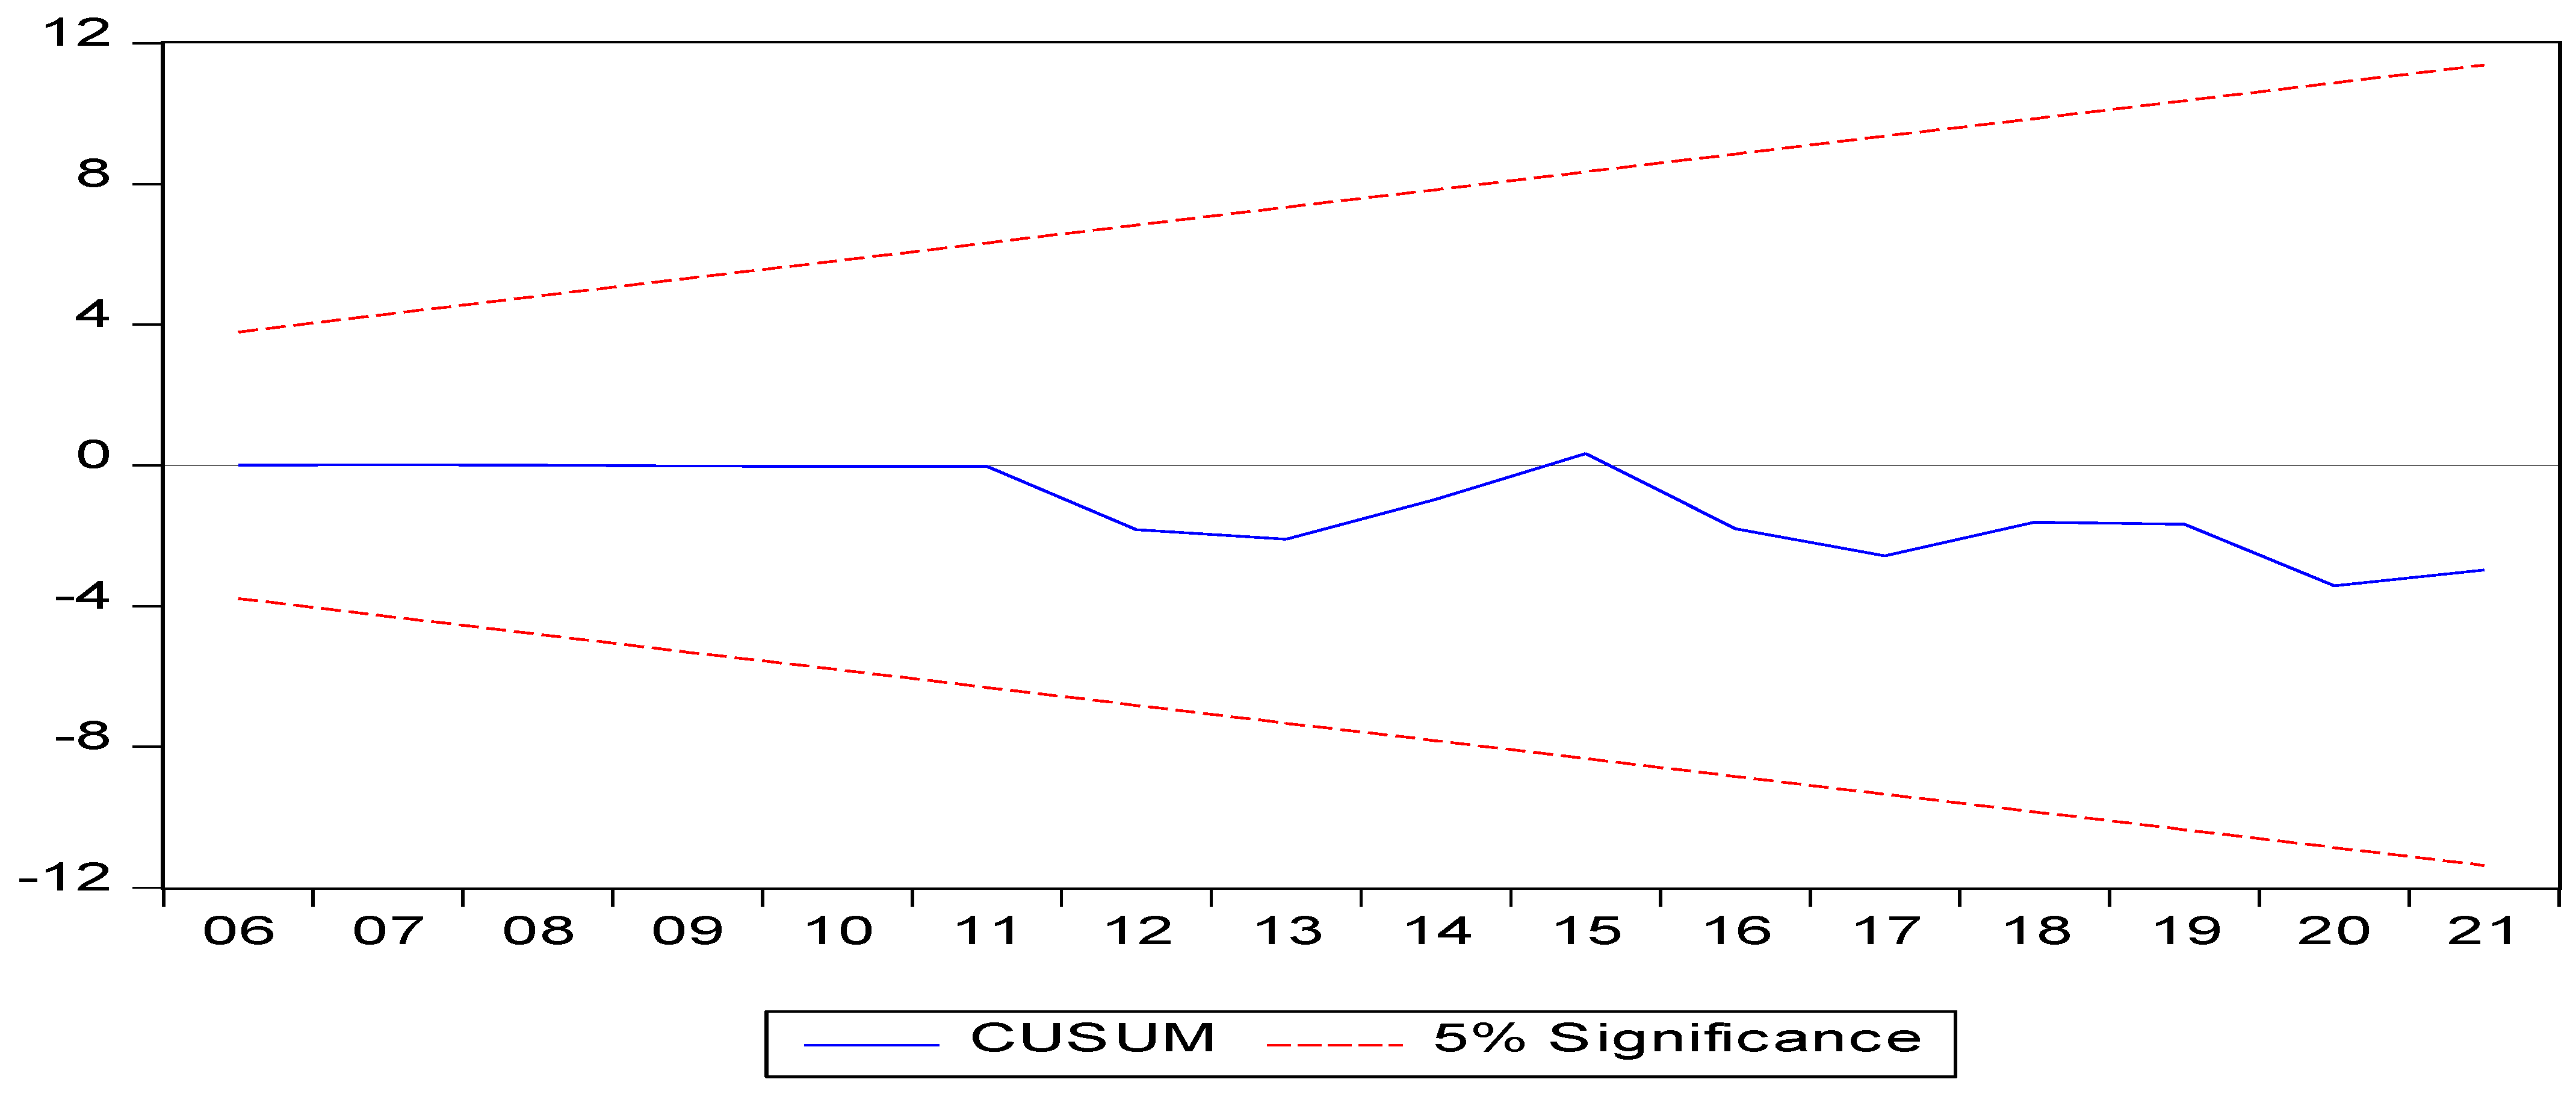
4.1. Stability Test Result

The results of the ADF and the PV unit root tests are presented in Table 1. The results of the tests suggest that all the series are integrated in order one I(1), at least in the first difference, hence satisfying the employment of the ARDL model. The PV test further revealed the existence of structural break dates (SBD), which coincide with key events in the Nigerian economy. For instance, the structural break dates of electricity generation capacity in the year 2000 (at level) coincide with the emergence of the democratic government of the fourth republic in Nigeria, which began the process of expanding the electricity infrastructure in Nigeria. In the same vein, the SBD of the year 2010 (at first difference) coincided with rapid growth in the electricity generation capacity in Nigeria. For the real gross domestic product, the year 2014 SBD coincided with the rebasing of the Nigerian economy, which made it the largest in Africa.

4.2. Bootstrap ARDL Technique Results

The results of the BARDL estimates are presented in Table 2. Based on these results, it can be deduced that the bootstrap values for the F-Statistic overall at 3.660, the T-Statistic dependent variable (−3.554), and the F-Statistic independence variable (4.618) are greater than the critical values (CVs) 3.578, −3.218, and 4.34 at 1%, respectively. Thus, the BARDL cointegration test suggests the existence of a long-run relationship among the variables.
Having confirmed that the series were co-integrated, the study proceeded to employ the Autoregressive Distributed Lag (ARDL) model. The results are presented in Table 3. From the results, it can be deduced that, when electricity generation capacity is the dependent variable, the coefficients of ecological footprints are negative and significant, which is in line with our expectation. The result shows that a 1% increase in ecological footprint will lead to a 0.2988% fall in electricity generation capacity in Nigeria in the short term. The result remains the same in terms of magnitude and direction in the long term. The findings are in line with those of [2,10,43].
Regarding the relationship between electricity generation and economic growth, the results, as presented in Table 3, show that the results of the coefficients of economic growth are positive and significant both in the long and short run. The results suggest that, for every 1% increase in economic growth, for which real gross domestic product acts as a proxy, electricity generation capacity will increase by 0.033% in the short run and by 0.0945% in the long run. This suggests that economic growth positively impacts electricity generation both in the long and short run. Our result is in line with the findings of [39,41] but contradicts [43].
The results regarding the nexus between electricity generation and non-renewable energy sources are positive and significant in both the short and long runs, so much so that a 1% increase in non-renewable energy will increase electricity generation by 0.1285% in the short run, and 0.0987% in the long run. This result is in line with a prior expectation. Our result is line with the results found by the authors of [2,10], who noted that a strong relationship exists between electricity and non-renewable energy sources. However, the result of our findings differs from those found by the authors of [46], who noted that no relationship exists between electricity and non-renewable energy sources for a selection of European and Asian economies. Ref. [12] documented that the relationship between the two is at best neutral and [36] noted that a non-linear relationship exists between the two for Vietnam.
The results of the nexus between electricity generation and renewable energy sources are positive and significant in the short run but positive and not significant in the long run. This could be based on the fact that the adoption of renewable energy sources is still new in the studied economy. The results show that a 1% increase in renewable energy sources will increase electricity generation by 0.0569% in the short run. This result is in line with the findings of [37,38].

4.3. Diagnostic Test

We conducted a diagnostic test of the model by conducting the Jarque–Bera test, the Ramsey REST test, the Breusch–Pegan–Godfrey test, the Breusch–Godfrey LM test, the CUSUM, and the CUSUMQ Curve. The results of the diagnostic test are reported in Table 2. The CUSUM and CUSUMQ curves, as presented in Figure 1 and Figure 2, confirm that the model employed is stable, as the plots of both curves lie within 5% critical bound.

4.4. Robustness Check

4.4.1. Introducing the Control Variables

As previously stated, the core explanatory variable in our model is the economic growth proxy by real gross domestic product (RGDP). To test the robustness of our analysis, we replace RGDP with the control variables and present the results in Table 4. In these results, the signs and magnitude (significant levels) of the control variables are not different from that of the RGDP as the explanatory variable. For instance, the coefficients of real gross capital formation at 0.046 and 0.932 are positive and significant both in the short and long runs. The same could be said of the coefficients of total government expenditure at 0.039 and 0.945 in both the long and short runs. The results of the credit in the private sector are not far from the two earlier mentioned. This suggests that the result is robust.
The lower part of Table 4 presents the results of the error correction model, which is another way of ascertaining the existence of a long-run relationship among the variables examined. It is also the speed of adjustment from short-run instability to long-run equilibrium. A statistically significant negative coefficient shows that a long-run relationship exists among the variables. The results as presented suggest that the coefficient of the error correction model (−0.413) is negative and statistically significant. This implies that the divergence or distortions from equilibrium are corrected by about 41% per annum. In other words, the speed of adjustment back to equilibrium is about 41%.

4.4.2. [26] Causality Test Results

Having established the existence of cointegration, as well as the long-run relationship among our variables, we proceed to determine the existence of causality between these variables by employing the D&H (Dumitrescu and Hurlin) causality test. In Table 5, we present the results of the [26] causality estimates. Based on these results, it can be deduced that a bi-directional causality exists between electricity generation capacity and real gross domestic product, non-renewable energy and real gross domestic product, and non-renewable energy and real gross domestic product. This suggests that each of these variables causes the other. The results further revealed that unidirectional causality runs from non-renewable energy to ecological footprint, suggesting that non-renewable energy like fossil fuel increases the ecological footprint in Nigeria. The results of the causality estimates validate the ARDL position that long-term relationships exist among these variables in Nigeria. The result of the causality estimate is in support of earlier findings, like those in [40], which determined that economic growth causes electricity. Ref. [42] established causality between renewable energy sources and electricity in Nepal. Ref. [39] determined that both renewable and non-renewable energy causes economic growth and adversely affects CO2 emissions.

4.4.3. Results Regarding the Mediating Role of Socio-Political Factors

In Table 6, the results of the mediating mechanisms of socio-political factors on the nexus between electricity generation capacity and the core explanatory variable are presented. In the results, it is evident that economic growth is significant and positively related to education, life expectancy, and governance structure with coefficients of 1.6101, 1.154, and 1.109, respectively. The impact of economic growth on corruption is negative but not significant. These results imply that an increase in economic growth will lead to improvement in education, life expectancy, and governance structure and that an increase in economic growth has no significant impact on corruption.
Regarding the impact of the mediating factors on electricity generation capacity, the results, as shown in column (6), suggest that the coefficient of education at (0.031), life expectancy at 0.041, and governance structure at 0.0257 are positive and significant, while the coefficient of corruption at −0.0545 is negative and significant. This suggests that an increase in each of the first three variables (education, life expectancy, and governance structure) with positive and significant coefficients will increase electricity generation in Nigeria, while corruption will induce a decrease in electricity generation capacity in Nigeria. These results could be influenced by several factors, for instance, improvement in education could increase employability, which will, in turn, have an impact on the productive capacity of the economy. Since energy is key to production, an increase in energy demand will invariably induce an increase in energy supply [62]. Regarding the life expectancy window, improved life expectation creates hope and aspirations that spur consumption, an increase in consumption will, in turn, drive up the supply window, hence improving the generation capacity of electricity in Nigeria [60]. In terms of governance structure, good governance structure will create an enabling environment that will stimulate the electricity generation capacity of the economy [51,52,53].

4.5. The Results of the GETs MODEL

The results of the GETs estimate are presented in Table 7. We began our analysis by searching for the intervention dummies with a tighter significance level while keeping the theoretical relevant variables. The significance level was traditionally kept at 10%, and we employed the PcGive component of the OxMetrics 8.10 software package to perform the search procedure. Based on the results, it can be deduced that the model search algorithm has identified four saturation indicators which are impulse dummies for (1986) (I:1986); step indicator saturation dummies for 1999 (SI:1999) and 2007 SI (2007); and blip dummies for 2016 (DI:2016). We noted that these dates coincided with important periods in Nigeria’s socioeconomic and political life. For instance, I:1986 coincided with the nation’s adoption of the International Monetary Funds (IMF)-sponsored Structural Adjustment Program (SAP); the SI:1999 step dummy coincided with a return to democracy, which motivates or attracts foreign interest and investment in Nigeria, with the energy sector taking a giant share. SI:2007 coincided with a massive investment in the power sector, with the Federal Government spending more than a 16 billion USD in the power sector (both non-renewable and renewable energy sources saw massive investment). The DI:2016 coincided with the recessionary period in Nigeria, which was characterized by a fall in oil prices.
In panel A of Table 8, we presented the results of the long-run relationship among the variables. Based on these results, it can be deduced that both the non-renewable energy sources and economic growth have a statistically significant and negative impact on renewable energy sources in Nigeria. The negative elasticity of non-renewable energy sources suggests that renewable energy is not currently being substituted for non-renewable energy in Nigeria. This result is in line with the findings of [57] for the G7 economies, [86] for Indonesia and China, [91] for a selection of 64 developed and emerging economies, [89] for a selection of oil-exporting economies, [46,90] for Iran, [65] for 24 OECD economies, and [67] for India.
In panel B of Table 8, we presented the diagnostic test results of the final specification of the GETs estimates. The results support the chosen specification, suggesting that the final model is statistically correct, and the results are logical. We also presented the results of the cointegration results of our GETs model in panel C, and the results of the unit root test for cointegration reject the null of no cointegration, suggesting that the variables move together in the long run.
In panel D of Table 8, we tested for potential non-linearity using the test presented in [92] for the non-linearity model. The results suggest that no substantial evidence exists to establish non-linearity in the model parameters. The existence of non-linearity suggests that the relationship between renewable energy and non-renewable energy sources in Nigeria is not substitutional at the moment. It suggests that a complementary relationship exists between the two; hence, policymakers should formulate policy that will enhance the development of both energy sources. This is important because Nigeria is a pro-growth economy, with an abundance of non-renewable energy. The results of our estimate are in line with the findings of [71] for the ECOWAS sub-region, [12] for OECD economies, and [74] for China, which noted that the relationship between the two sources of energy sources is complementary rather than substitutionary.

5. Discussion

The results obtained in this study suggest that a bi-directional relationship exists between electricity generation and economic growth in Nigeria. At least two probable reasons could account for this. First, economic growth has led to an increase in the commercial and industrial sectors of the economy, and electricity is a major input factor in these two sectors; hence, the expansion of these sectors will induce upward demand for electricity, which will motivate supply via the price mechanism. Second, an increase in the per capita income connotes an increase in the ability to consume; hence, there will be an increase in demand for electronic gadgets which will, in turn, induce upward demand for electricity and eventually increase electricity generation through the price mechanism. The other leg of a bi-directional relationship between electricity and economic growth suggests that an increase in electricity infrastructure will induce an upward shift in economic growth, especially in the manufacturing and small and medium-scale enterprises sector. The results obtained from the coefficients of other explanatory variables are consistent with economic theory; for instance, the result of the link between economic growth and public expenditure is positive, and the link between public expenditure and electricity generation is not significant. This suggests that, unlike private sector funding, public sector investment has not generated the deserved results in the energy sector. The positive impact of financial credit in the private sector for electricity generation suggests that private sector investment in power plants and modular refineries induces upward trust in Nigeria’s electricity sector.
Our results support the validity of the feedback hypothesis and are consistent with some earlier findings: [93] for China; [50] for European Union economies; and [39,40,94] for a selection of Sub-Saharan African economies. Our findings, however, differ from those in [36], which documented the existence of a non-linear relationship between energy and economic growth in Vietnam; [95], which observed that unidirectional causality runs from macroeconomic factors to energy in Pakistan; and [38], which noted the existence of a negative relationship between electricity price and electricity consumption in Jordan.

6. Conclusions

Over the past decades, concerted efforts have been put in place to improve the energy bank of Nigeria. This is premised on the fact that energy is key to growth. Electricity is a major contributor to the nation’s energy bank and is key to achieving sustainable growth. Understanding the link between economic growth and electricity generation is key to the effective policy formation required for achieving sustainable economic growth. As noted earlier, the directions of the relationship between electricity generation and economic growth (as with any other energy basket–economic growth nexus) could be grouped into four: electricity-led growth following the hypothesis; growth-led electricity following the hypothesis; the feedback/bi-directional hypothesis; and the neutrality/indifferent hypothesis. Each of these offer different policy implications.
This paper employed the ADRL bound estimation techniques and the [26] Granger causality approach to examine the nature of the relationship between electricity generation and economic growth in Nigeria based on data sourced from 1980 to 2022. The study also accounts for the impact of some salient control variables, such as financial credit in the private sector, total public expenditure, and gross capital formation, among others. We employed three-step procedures to analyse this relationship. First, we used the ADRL bound estimation techniques to examine the existence of co-integration between electricity generation and macroeconomic variables. Secondly, we employed the [26] Granger causality techniques to examine the causal relationships between the variables. Our results suggest that there is a long-run and causal relationship between electricity generation and economic growth in Nigeria. The results established the fact that electricity generation supports economic growth, validating the feedback hypothesis; hence, policies that enhance electricity generation should be encouraged. The results of other explanatory variables also suggest that financial credit in the private sector, total public expenditure, governance, and real gross fixed capital formation stimulate growth. Therefore, policymakers must employ measures that will increase financial credit in the private sector, enhance employment opportunities, maintain good governance, and increase real gross fixed capital, among others.
The second strand of our study dealt with examining the existence of causality between electricity generation and the various independent variables. We addressed this by employing the [26] Granger causality estimates. Our results show that bidirectional Granger causality runs between economic growth and electricity generation; between non-renewable and electricity generation; and between non-renewable energy and real gross domestic product. These results present some policy implications.
The third strand of our study focused on the possibility of a substitutability relationship between renewable and non-renewable energy sources in Nigeria by employing the GETs estimates. Our results suggest that there is a negative significant relationship between non-renewable energy and renewable energy in Nigeria, ruling out the existence of the possibility of substitutability between the variables. Currently, Nigeria’s economics are growth-oriented; they largely depend on oil or fossil energy sources both as the major source of revenue and the major energy source. Hence, policymakers should focus on exploring the non-renewable energy sources and use the proceeds to develop the renewable energy sector. Our results suggest that electricity generation is key to economic growth, and that the ecological footprint inhibits electricity generation in Nigeria. Hence, some of the key policy implications that arose from our findings are as follows:
First, the study established the existence of a bi-directional relationship between economic growth and electricity generation in Nigeria. Hence, policymakers are encouraged to pursue policies that will stimulate growth, boost electricity generation, and minimise distribution losses. The government should provide an enabling environment that will support massive investment in electricity generation in Nigeria and enhance effective distribution of the generated supply, so much so that distributional losses will be reduced to a minimum. Policymakers are encouraged to prioritise smart grids and the adoption of advanced technologies in order to achieve a drastic reduction in technical losses, thereby optimising electricity distribution and grid stability. The government should initiate reforms with a good level of commitment, mitigate sovereign risks, provide grants and tax incentives for investors, and open up the electricity industry to competition.
Second, support should be made available for renewable energy development. Policymakers should facilitate rapid growth of the renewable energy sector. This could be a way of initiating policies and regulatory frameworks that will fast-track the development and integration of renewable energy, such as wind, tidal, solar, biomass, etc. into the electricity grid. The framework could be designed in such a way that investments will be attracted into the sector.
Third, concerted efforts should be made to expand the non-renewable energy components. Nigeria is a growth-oriented economy with an abundance of non-renewable energy sources. Policymakers should formulate policies that will enhance the development of non-renewable energy sources so that the sector will be positioned to further contribute to the nation’s total energy basket. It is recommended that the surplus from the sales of non-renewable energy should be invested in the renewable electricity sector. A natural gas subsector should be developed to support electricity generation that will support economic growth. The development of the non-renewable energy sector is key, as the results of our GETs estimate rule out the possibility of substitution among renewable and non-renewable energy sources in Nigeria at the moment.
The difference between our results and those of the previous studies could be explained by the following: First, our study employed a longer data set than these studies. Second, unlike existing studies that examined electricity consumption, we focused on electricity generation. This was premised on the fact that, in developing economies characterized by non-technical T and D losses, like Nigeria, electricity generation is a better proxy for energy than electricity consumption. The third reason could be the fact that we employed the [26] Granger causality (superior to the common uses multivariate VECM) approach, while most of the existing studies employed conventional Granger causality tests.
Though this study has made substantial contributions to our knowledge, it is not immune to caveats; for instance, the study focuses mainly on electricity generation at an aggregate level due to data availability. Further research can look into this relationship by employing disaggregated datasets, employing different estimation techniques, and examining this relationship for different economies (single-country and/or multi-country). The study does not include national endowments like access to hydro power, carbon resources, nuclear power knowhow, etc.; insights in these fields could be included in future research.

Author Contributions

Conceptualization, A.I.L., E.O. and M.I.T.; methodology, A.I.L. and A.A.; software, A.I.L. and Y.E.; validation, A.I.L., M.I.T. and L.N.D.; formal analysis, A.I.L., M.I.T. and Y.E.; investigation, Y.E. and L.N.D.; resources, M.I.T.; data curation, A.I.L. and E.O.; writing—original draft preparation, A.I.L. and M.I.T.; writing—review and editing, L.N.D.; visualization, A.I.L.; supervision, M.I.T. and E.O.; project administration, A.I.L. and M.I.T.; funding acquisition, M.I.T., A.A., Y.E. and L.N.D. All authors have read and agreed to the published version of the manuscript.

Funding

This research received no external funding.

Institutional Review Board Statement

Not applicable.

Informed Consent Statement

Not applicable.

Data Availability Statement

Central Bank of Nigeria Statistical Bulletin (2022) https://www.cbn.gov.ng/documents/Statbulletin.asp?beginrec=1&endrec=13 (accessed on 7/31/2023). Global Footprint Network (2022) https://www.footprintnetwork.org/ (accessed on 08/22/2023). International Energy Agency (2022) https://www.iea.org/ (accessed on accessed on 08/22/2023). World Development Indicator (2022) https://databank.worldbank.org/source/world-development-indicators (accessed on accessed on 08/22/2023).

Conflicts of Interest

The authors declare no conflicts of interest.

References

  1. Isola, A.; Ozturk, I.; Olanipekun, I.O.; John, A. Examining the linkages between electricity consumption and economic growth in African economies. Energy 2020, 208, 118363. [Google Scholar] [CrossRef]
  2. Sarkodie, S.A. Causal effect of environmental factors, economic indicators and domestic material consumption using frequency domain causality test. Sci. Total Environ. 2020, 736, 139602. [Google Scholar] [CrossRef] [PubMed]
  3. Sarkodie, S.A.; Strezov, V. An empirical study of the Environmental Kuznets curve and Environmental Sustainability curve hypothesis for Australia, China, Ghana and the USA. J. Clean. Prod. 2018, 201, 98–110. [Google Scholar] [CrossRef]
  4. Sarkodie, S.A.; Strezov, V. A review of the Environmental Kuznets Curve hypothesis using bibliometric and meta-analysis. Sci. Total Environ. 2019, 649, 128–145. [Google Scholar] [CrossRef] [PubMed]
  5. Adebola, S.; Al-mulali, U.; Ozturk, I. Validating the environmental Kuznets curve hypothesis in India and China: The role of hydroelectricity consumption. Renew. Sustain. Energy Rev. 2017, 80, 1578–1587. [Google Scholar] [CrossRef]
  6. IEA. World Energy Outlook 2014; IEA: Paris, France, 2014; Available online: https://www.iea.org/reports/world-energy-outlook-2014 (accessed on 22 August 2023).
  7. IEA. World Energy Outlook 2021; IEA: Paris, France, 2021; Available online: https://www.iea.org/reports/world-energy-outlook-2021 (accessed on 22 August 2023).
  8. Lawal, A.I.; Salisu, A.A.; Asaleye, A.J.; Oseni, E.; Lawal-Adedoyin, B.B.; Dahunsi, S.O.; Omoju, E.O.; DickTonye, A.O.; Ogunwole, E.B.; Babajide, A.A. Economic Growth, Exchange Rate and Remittance Nexus: Evidence from Africa. J. Risk Financ. Manag. 2022, 15, 235. [Google Scholar] [CrossRef]
  9. Omoju, O.E.; Li, J.; Zhang, J.; Rauf, A.; Sosoo, V.E. Implications of shocks in energy consumption for energy policy in sub-Saharan Africa. Energy Environ. 2019, 31, 1077–1097. [Google Scholar] [CrossRef]
  10. Aliyu, A.K.; Modu, B.; Tan, C.W. A review of renewable energy development in Africa: A focus in A focus in South Africa, Egypt and Nigeria. Renew. Sustain. Energy Rev. 2018, 81, 2502–2518. [Google Scholar] [CrossRef]
  11. Aydin, M. Renewable and non-renewable electricity consumption e economic growth nexus: Evidence from OECD countries. Renew. Energy 2019, 136, 599–606. [Google Scholar] [CrossRef]
  12. Wesseh, P.K., Jr.; Lin, B. Output and substitution elasticities of energy and implications for renewable energy expansion in the ECOWAS region. Energy Policy 2016, 89, 125–137. [Google Scholar] [CrossRef]
  13. Singh, M.K.; Malek, J.; Sharma, H.K.; Kumar, R. Converting the threats of fossil fuel-based energy generation into opportunities for renewable energy development in India. Renew. Energy 2024, 224, 120153. [Google Scholar] [CrossRef]
  14. Huang, J.; Luan, B.; He, W.; Chen, X.; Li, M. Energy technology of conservation versus substitution and energy intensity in China. Energy 2022, 244, 122695. [Google Scholar] [CrossRef]
  15. Raza, M.Y.; Lin, B. Renewable energy substitution and energy technology impact in a transitional economy: A perspective from Pakistan. J. Clean. Prod. 2022, 360, 132163. [Google Scholar] [CrossRef]
  16. Amigues, J.-P.; Kama AA, L.; Moreaux, M. Equilibrium transitions from non-renewable energy to renewable energy under capacity constraints. J. Econ. Dyn. Control 2015, 55, 89–112. [Google Scholar] [CrossRef]
  17. Adeleye, B.N.; Id, R.O.; Lawal, A.I.; De Alwis, T. Energy use and the role of per capita income on carbon emissions in African countries. PLoS ONE 2021, 16, e0259488. [Google Scholar] [CrossRef]
  18. Lawal, A.I.; Asaleye, A.J.; Iseolorunkanmi, J.; Popoola, O.R. Economic growth, agricultural output and tourism development in Nigeria: An application of the ARDL bound testing approach. J. Environ. Manag. Tour. 2018, 9, 786–794. [Google Scholar] [CrossRef]
  19. Lawal, A.I.; Somoye, R.O.; Babajide, A.A. Are African stock markets efficient? Evidence from wavelet unit root test for a random walk. Econ. Bull. 2017, 37, 2665–2679. [Google Scholar]
  20. Lawal, A.I.; Nwanji, T.I.; Asaleye, A.; Ahmed, V. Economic growth, financial development and trade openness in Nigeria: An application of the ARDL bound testing approach. Cogent Econ. Financ. 2016, 4, 1258810. [Google Scholar] [CrossRef]
  21. Fashina, O.A.; Asaleye, A.J.; Ogunjobi, J.O.; Lawal, A.I. Foreign aid, human capital and economic growth nexus: Evidence from Nigeria. J. Int. Stud. 2018, 11, 104–117. [Google Scholar] [CrossRef]
  22. Lawal, A.I.; Bose Bukola, L.-A.; Olakanmi, O.; Samson, T.K.; Ike, N.T.; Ajayi, A.S.; Adeniran, F.S.; Ezekiel, O.; Oyelude, O.; Adigun, G. Examining the Link between Technical Efficiency, Corporate Governance and Financial Performance of Firms: Evidence from Nigeria. J. Risk Financ. Manag. 2022, 15, 524. [Google Scholar] [CrossRef]
  23. UNDP. Human Development Indices and Indicators: 2018 Statistical Update, Technical Notes; Human Development Report Office: New York, NY, USA, 2018; Available online: https://hdr.undp.org/system/files/documents/2018summaryhumandevelopmentstatisticalupdateen.pdf (accessed on 22 August 2023).
  24. World Development Indicator. WDI 2022. 2022. Available online: https://databank.worldbank.org/source/world-development-indicators (accessed on 22 August 2023).
  25. Ayodele, T.R.; Ogunjuyigbe AS, O.; Ajayi, O.D.; Yusuff, A.A.; Mosetlhe, T.C. Willingness to pay for green electricity derived from renewable energy sources in Nigeria. Renew. Sustain. Energy Rev. 2021, 14, 111279. [Google Scholar] [CrossRef]
  26. Dumitrescu, E.I.; Hurlin, C. Testing for Granger non-causality in heterogeneous panels. Econ. Model. 2012, 29, 1450–1460. [Google Scholar] [CrossRef]
  27. Johansen, S.; Juselius, K. Testing structural hypothesis in a multivariate co-integration analysis of the PPP and UIP for UK. J. Econom. 1992, 53, 211–244. [Google Scholar] [CrossRef]
  28. Meng, G.; Liu, H.; Li, J.; Sun, C. Determination of driving forces for China’s energy consumption and regional disparities using a hybrid structural decomposition analysis. Energy 2022, 239, 122191. [Google Scholar] [CrossRef]
  29. Shahbaz, M.; Song, M.; Ahmad, S.; Vo, X.V. Does economic growth stimulate energy consumption? The role of human capital and R&D expenditures in China. Energy Econ. 2021, 105, 105662. [Google Scholar] [CrossRef]
  30. Ameyaw, B.; Li, Y.; Ma, Y.; Korang, J.; Appiah-kubi, J.; Annan, A. Renewable electricity generation proposed pathways for the US and China. Renew. Energy 2021, 170, 212–223. [Google Scholar] [CrossRef]
  31. Hooi, H.; Smyth, R. Multivariate Granger causality between electricity generation, exports, prices and GDP in Malaysia. Energy 2010, 35, 3640–3648. [Google Scholar] [CrossRef]
  32. Shaffer, R.B.R. Perspectives and Challenges in the Policing of Terrorism. Terror. Political Violence 2018, 30, 174–180. [Google Scholar] [CrossRef]
  33. Li, J.; Omoju, O.E.; Zhang, J.; Ikhide, E.E.; Lu, G.; Lawal, A.I.; Ozue, V.A. Does Intellectual Property Rights Protection Constitute a Barrier to Renewable Energy? An Econometric Analysis. Natl. Inst. Econ. Rev. 2020, 251, R37–R46. [Google Scholar] [CrossRef]
  34. Ben, M.; Ben, S.; Ozturk, I. Testing environmental Kuznets curve hypothesis: The role of renewable and non-renewable energy consumption and trade in OECD countries. Ecol. Indic. 2017, 60, 824–831. [Google Scholar] [CrossRef]
  35. Lin, B.; Liu, C. Why is electricity consumption inconsistent with economic growth in China? Energy Policy 2016, 88, 310–316. [Google Scholar] [CrossRef]
  36. Son, H.; Yoon, S. Reducing energy poverty: Characteristics of household electricity use in Vietnam. Energy Sustain. Dev. 2020, 59, 62–70. [Google Scholar] [CrossRef]
  37. Khan, Z.; Malik, M.Y.; Ph, D.; Latif, K.; Jiao, Z. Heterogeneous effect of eco-innovation and human capital on renewable & non-renewable energy consumption: Disaggregate analysis for G-7 countries. Energy 2020, 209, 118405. [Google Scholar] [CrossRef]
  38. Al-bajjali, S.K.; Yacoub, A. Estimating the determinants of electricity consumption in Jordan. Energy 2018, 147, 1311–1320. [Google Scholar] [CrossRef]
  39. Usama, A.; Adebola, S.; Salahuddin, M. The prominence of renewable and non-renewable electricity generation on the environmental Kuznets curve: A case study of Ethiopia. Energy 2020, 211, 118665. [Google Scholar] [CrossRef]
  40. Fatai, F.; Ozturk, I.; Oluwatoyin, M.; Agboola, P.O.; Victor, F. The implications of renewable and non-renewable energy generating in Sub-Saharan Africa: The role of economic policy uncertainties. Energy Policy 2021, 150, 112115. [Google Scholar] [CrossRef]
  41. Sadi, H.; Prince, S.; Uzuner, G.; Victor, F.; Asumadu, S. Trivariate modelling of the nexus between electricity consumption, urbanization and economic growth in Nigeria: Fresh insights from Maki Cointegration and causality tests. Heliyon 2020, 6, e03400. [Google Scholar] [CrossRef]
  42. Nepal, R.; Paija, N. Energy security, electricity, population and economic growth: The case of a developing South Asian resource-rich economy. Energy Policy 2019, 132, 771–781. [Google Scholar] [CrossRef]
  43. Nepal, R.; Paija, N.; Tyagi, B.; Harvie, C. Energy security, economic growth and environmental sustainability in India: Does FDI and trade openness play a role? J. Environ. Manag. 2021, 281, 111886. [Google Scholar] [CrossRef]
  44. Guliyev, H.; Tatoğlu, F.Y. The Relationship Between Renewable Energy and Economic Growth in European Countries: Evidence from Panel Data Model with Sharp and Smooth Changes. Renew. Energy Focus 2023, 46, 185–196. [Google Scholar] [CrossRef]
  45. Geng, L.; Ofori, C.; Ampong, S.A.; Appiah-Twum, F.; Alhassan, E.A. Towards a sustainable environment: Examining the spatial VARIATIONS of renewable energy, environmental pollution, and economic growth in Europe. Energy Strategy Rev. 2023, 50, 101231. [Google Scholar] [CrossRef]
  46. Nuţă, F.M.; Ali, S.; Abban, O.J.; Khan, I.; Irfan, M.; Nutßa, A.C.; Dankyi, A.; Asghar, M. The relationship among urbanization, economic growth, renewable energy consumption, and environmental degradation: A comparative view of European and Asian emerging economies. Gondwana Res. 2024, 128, 325–339. [Google Scholar] [CrossRef]
  47. Atems, B.; Hotaling, C. The effect of renewable and nonrenewable electricity generation on economic growth. Energy Policy 2018, 112, 111–118. [Google Scholar] [CrossRef]
  48. Hdom, A.D. Examining carbon dioxide emissions, fossil & renewable electricity generation and economic growth: Evidence from a panel of South American countries. Renew. Energy 2019, 139, 186–197. [Google Scholar] [CrossRef]
  49. Marques, A.C.; Fuinhas, J.A.; Nunes, A.R. Electricity generation mix and economic growth: What role is being played by nuclear sources and carbon dioxide emissions in France? Energy Policy 2016, 92, 7–19. [Google Scholar] [CrossRef]
  50. Mac Domhnaill, C.; Ryan, L. Towards renewable electricity in Europe: Revisiting the determinants of renewable electricity in the European Union. Renew. Energy 2020, 154, 955–965. [Google Scholar] [CrossRef]
  51. Gregory, J. Governance, scale, scope: A review of six South African electricity generation infrastructure megaprojects. Util. Policy 2020, 66, 101103. [Google Scholar] [CrossRef]
  52. Sandu, S.; Yang, M.; Shi, X.; Chi, Y. A governance perspective on electricity industry development: The case of Papua New Guinea. Energy Policy 2020, 141, 111464. [Google Scholar] [CrossRef]
  53. Dagnachew, A.G.; Hof, A.F.; Roelfsema, M.R.; Van Vuuren, D.P. Actors and governance in the transition toward universal electricity access in Sub-Saharan Africa. Energy Policy 2020, 143, 111572. [Google Scholar] [CrossRef]
  54. Buragohain, B.; Mahanta, P.; Moholkar, V.S. Biomass gasification for decentralized power generation: The Indian perspective. Renew. Sustain. Energy Rev. 2010, 14, 73–92. [Google Scholar] [CrossRef]
  55. Hiloidhari, M.; Baruah, D.C. Crop residue biomass for decentralized electrical power generation in rural areas (part 1): Investigation of spatial availability. Renew. Sustain. Energy Rev. 2011, 15, 1885–1892. [Google Scholar] [CrossRef]
  56. König, S.; Bchini, Q.; McKenna, R.; Köppel, W.; Bachseitz, M.; Entress, J.; Ryba, M.; Michaelis, J.; Roser, A.; Schakib-Ekbatan, K. Analysing the regional potential and social acceptance of power-to-gas in the context of decentralized co-generation in Baden-Württemberg. J. Energy Storage 2018, 16, 93–107. [Google Scholar] [CrossRef]
  57. Lehner, J.; Weißbach, T. Global and local effects of decentralised electric power generation on the grid in the Western Balkan Countries (WBC). Energy 2009, 34, 555–563. [Google Scholar] [CrossRef]
  58. Moner-Girona, M.; Bender, A.; Becker, W.; Bódis, K.; Szabó, S.; Kararach, A.; Anadon, L. A multidimensional high-resolution assessment approach to boost decentralised energy investments in Sub-Saharan Africa. Renew. Sustain. Energy Rev. 2021, 148, 111282. [Google Scholar] [CrossRef]
  59. Ha, Y.; Sapkota, S. Investigating decentralized renewable energy systems under different governance approaches in Nepal and Indonesia: How does governance fail? Energy Res. Soc. Sci. 2021, 80, 102214. [Google Scholar] [CrossRef]
  60. Stritzke, S.; Trotter, P.A.; Twesigye, P. Towards responsive energy governance: Lessons from a holistic analysis of energy access in Uganda and Zambia. Energy Policy 2021, 148 Pt A, 111934. [Google Scholar] [CrossRef]
  61. Saba, C.S.; Biyase, M. Determinants of renewable electricity development in Europe: Do Governance indicators and institutional quality matter? Energy Rep. 2022, 8, 13914–13938. [Google Scholar] [CrossRef]
  62. Falchetta, G.; Dagnachew, A.G.; Hof, A.F.; Milne, D.J. The role of regulatory, market and governance risk for electricity access investment in sub-Saharan Africa. Energy Sustain. Dev. 2021, 62, 136–150. [Google Scholar] [CrossRef]
  63. Brisbois, M.C. Decentralised energy, decentralised accountability? Lessons on how to govern decentralised electricity transitions from multi-level natural resource governance. Glob. Transit. 2020, 2, 16–25. [Google Scholar] [CrossRef]
  64. Dye, B.J. Unpacking authoritarian governance in electricity policy: Understanding progress, inconsistency and stagnation in Tanzania. Energy Res. Soc. Sci. 2021, 80, 102209. [Google Scholar] [CrossRef]
  65. Opeyemi, B.M. Path to sustainable energy consumption: The possibility of substituting renewable energy for non-renewable energy. Energy 2021, 228, 120519. [Google Scholar] [CrossRef]
  66. Husain, S.; Sohag, K.; Wu, Y. Proven reserve oil and renewable energy nexus: Efficacy of policy stringency. Resour. Policy 2024, 90, 104835. [Google Scholar] [CrossRef]
  67. Mohammad-Bagher, J.; Rasti-Barzoki, M.; Altmann, J. An evolutionary game-theoretic approach for investigating the long-term behavior of the industry sector for purchasing renewable and non-renewable energy: A case study of Iran. Energy 2023, 285, 129245. [Google Scholar] [CrossRef]
  68. Acheampong, A.O.; Boateng, E.; Annor, C.B. Do corruption, income inequality and redistribution hasten transition towards (non)renewable energy economy? Struct. Chang. Econ. Dyn. 2024, 68, 329–354. [Google Scholar] [CrossRef]
  69. Saadaoui, H.; Omri, E.; Chtourou, N. The transition to renewable energies in Tunisia: The asymmetric impacts of technological innovation, government stability, and democracy. Energy 2024, 293, 130686. [Google Scholar] [CrossRef]
  70. Huihui, W.; Alharthi, M.; Ozturk, I.; Sharif, A.; Hanif, I.; Dong, X. A strategy for the promotion of renewable energy for cleaner production in G7 economies: By means of economic and institutional progress. J. Clean. Prod. 2024, 434, 140323. [Google Scholar] [CrossRef]
  71. Lin, B.; Ankrah, I. On Nigeria’s renewable energy program: Examining the effectiveness, substitution potential, and the impact on national output. Energy 2019, 167, 1181–1193. [Google Scholar] [CrossRef]
  72. Kumara, S.; Fujiib, H.; Managi, S. Substitute or complement? Assessing renewable and nonrenewable energy in OECD countries. Appl. Econ. 2015, 47, 1438–1459. [Google Scholar] [CrossRef]
  73. Taheri, A.A. Oil shocks and the dynamics of substitution adjustments of industrial fuels in the US. Appl. Econ. 1994, 26, 751–756. [Google Scholar] [CrossRef]
  74. Wua, W.; Cheng, Y.; Lin, X.; Yao, X. How does the implementation of the Policy of Electricity Substitution influence green economic growth in China? Energy Policy 2019, 131, 251–261. [Google Scholar] [CrossRef]
  75. CBN. Central Bank of Nigeria Statistical Bulletin; CBN (Central Bank of Nigeria): Abuja, Nigeria, 2006.
  76. GFN. Global Footprint Network. 2022. Available online: https://api.footprintnetwork.org/v1/data/5001%26type=BCtot,EFCtot/all/ (accessed on 12 August 2023).
  77. Joof, F.; Samour, A.; Tursoy, T.; Ali, M. Climate change, insurance market, renewable energy, and biodiversity: Double-materiality concept from BRICS countries. Environ. Sci. Pollut. Res. 2023, 30, 28676–28689. [Google Scholar] [CrossRef] [PubMed]
  78. McNown, R.; Sam, C.Y.; Goh, S.K. Bootstrapping the autoregressive distributed lag test for cointegration. Appl. Econ. 2018, 50, 1509–1521. [Google Scholar] [CrossRef]
  79. Li, J.; Dong, X.; Dong, K. Green efficiency of natural gas and driving factors analysis: The role of the natural gas price in China. Energy Effic. 2022, 15, 24. [Google Scholar] [CrossRef]
  80. Toda, H.Y.; Yamamoto, T. Statistical inference in vector autoregressions with possibly integrated process. J. Econom. 1995, 66, 225–250. [Google Scholar] [CrossRef]
  81. Ahmed, Z.; Nathaniel, S.P.; Shahbaz, M. The criticality of information and communication technology and human capital in environmental sustainability: Evidence from Latin American and Caribbean countries. J. Clean. Prod. 2021, 286, 125529. [Google Scholar] [CrossRef]
  82. Yasmeen, R.; Zhang, X.; Sharif, A.; Shah Wu, H.; Dincă, M.S. The role of wind energy towards sustainable development in top-16 wind energy consumer countries: Evidence from STIRPAT model. Gondwana Res. 2023, 121, 56–71. [Google Scholar] [CrossRef]
  83. Sun, C.; Khan, A.; Ren, Y. Empowering Progress: Education, innovations and financial development in the battle against energy poverty. J. Clean. Prod. 2023, 425, 138941. [Google Scholar] [CrossRef]
  84. Adebola, S.; Opeyemi, M. The impact of shale gas development on the U.S. economy: Evidence from a quantile autoregressive distributed lag model. Energy 2020, 205, 118004. [Google Scholar] [CrossRef]
  85. Lin, B.; Ankrah, I. Renewable energy (electricity) development in Ghana: Observations, concerns, substitution possibilities, and implications for the economy. J. Clean. Prod. 2019, 233, 1396–1409. [Google Scholar] [CrossRef]
  86. Salim, R.A.; Ra, S. Why do some emerging economies proactively accelerate the adoption of renewable energy? Energy Econ. 2012, 34, 1051–1057. [Google Scholar] [CrossRef]
  87. Galadima, M.D.; Aminu, A.W. Nonlinear Unit Root and Nonlinear Causality in Natural Gas—Economic Growth Nexus: Evidence from Nigeria. Energy 2019, 190, 116415. [Google Scholar] [CrossRef]
  88. Kruse, R.; Kaufmann, H.; Wegener, C. Bias-corrected estimation for speculative bubbles in stock prices. Econ. Model. 2018, 73, 354–364. [Google Scholar] [CrossRef]
  89. Mukhtarov, S.; Mikayilov, J.I.; Humbatova, S.; Muradov, V. Do High Oil Prices Obstruct the Transition to Renewable Energy Consumption? Sustainability 2020, 12, 4689. [Google Scholar] [CrossRef]
  90. Mukhtarov, S.; Mikayilov, J.I.; Maharramov, S.; Aliyev, J. Higher oil prices, are they good or bad for renewable energy consumption: The case of Iran? Renew. Energy 2022, 186, 411–419. [Google Scholar] [CrossRef]
  91. Omri, A.; Khuong, D. On the determinants of renewable energy consumption: International evidence. Energy 2014, 72, 554–560. [Google Scholar] [CrossRef]
  92. Castle, J.L.; Hendry, D.F. A low-dimension portmanteau test for non-linearity. J. Econom. 2010, 158, 231–245. [Google Scholar] [CrossRef]
  93. Wesseh, P.K., Jr.; Lin, B. Can African countries efficiently build their economies on renewable energy? Renew. Sustain. Energy Rev. 2016, 54, 161–173. [Google Scholar] [CrossRef]
  94. Chakamera, C.; Alagidede, P. Electricity crisis and the effect of CO2 emissions on infrastructure-growth nexus in Sub-Saharan Africa. Renew. Sustain. Energy Rev. 2018, 94, 945–958. [Google Scholar] [CrossRef]
  95. Malik, I.A.; Siyal, G.-E.; Bin Abdullah, A.; Alam, A.; Zaman, K.; Kyophilavong, P.; Shahbaz, M.; Baloch, S.U.; Shams, T. Turn on the lights: Macroeconomic factors affecting renewable energy in Pakistan. Renew. Sustain. Energy Rev. 2014, 38, 277–284. [Google Scholar] [CrossRef]
Figure 1. CUSUM Curve.
Sustainability 16 02953 g001
Figure 2. CUSUM Q Curve.
Sustainability 16 02953 g002
Table 1. Unit Root Test Result.
ADF Unit Root TestPV Unit Root Test
Variables‘At Level’ At   First DifferencesVariables‘At Level’ At   First Differences
t-Stat.t-Stat.t-Stat.SBDt-Stat.SBD
I n G e n C a p t −0.801−6.218 *** I n G e n C a p t −2.7112000−7.165 ***2010
I n R G D P −1.522−4.109 *** I n R G D P −2.6022003−5.102 ***2014
I n R E N −1.106−5.855 *** I n R E N −3.5662010−7.122 ***2018
I n N R E N −0.929−4.077 *** I n N R E N −2.0132009−4.609 ***2014
I n E F −0.811−4.804 *** I n E F −2.1051996−5.448 ***2003
I n G C F −1.114−5.032 *** I n G C F −3.6252011−5.182 ***2017
I n E X P D −0.498−3.004 *** I n E X P D −1.0452008−3.402 ***2019
I n P C R E −0.7441−3.624 *** I n P C R E −1.1822004−5.098 ***2008
*** represent 1% significant levels.
Table 2. Results of the Bootstrap ARDL technique.
Bootstrap ARDLDiagnostic Tests
TestValueCV at 5%TestTest Statisticsp-Values
F-statistics3.660 ***3.544Jarque-Bera0.6440.703
T-dependence−3.554 ***−3.228Ramsey Reset1.1870.239
F-dependence4.618 ***4.23BPG1.1720.359
BG-LM0.2450.769
Source: Authors Computation 2023. Note: *** represent 1% significance levels.
Table 3. Results of the ARDL estimates in the short and long runs.
VariablesCoefficientsStd. Errort-Statistic
I n R G D P 0.033 ***0.084414.4544
I n R E N 0.0569 **0.00718.0988
I n N R E N 0.1285 ***0.01439.0237
I n E F −0.2988 ***0.02836.8445
I n R G D P 0.0945 ***0.02333.4982
I n R E N 0.04470.04312.0665
I n N R E N 0.0987 ***0.11622.2099
I n E F −0.3228 ***0.04511.7662
E C T −0.4130.10522.5669
Source: Authors Computation 2023. Note: ** and *** represent 5% and 1% significance levels, respectively.
Table 4. Robustness Check with the control variables.
VariablesCoefficientsStd. Errort-Statistic
I n G C F 0.046 ***0.045413.7544
I n E X P D 0.039 **0.005114.0584
I n P C R E 0.034 ***0.026414.5349
I n R E N 0.0419 **0.00518.0128
I n N R E N 0.1202 **0.01739.0147
I n E F 0.2078 ***0.04036.2025
I n G C F 0.9032 *0.01432.1512
I n E X P D 0.945 **0.03322.1062
I n P C R E 0.816 ***0.04172.1007
I n R E N 0.0387 ***0.08212.0815
I n N R E N 0.0917 *0.10322.2009
I n E F 0.4128 *0.03311.7012
E C T −0.4190.10141.7091
Source: Authors Computation 2023. Note: *, **, and *** represent 10%, 5%, and 1% significance levels, respectively.
Table 5. Causality Test Results.
Variables I n G e n C a p t I n R G D P I n R E N I n N R E N I n E F
I n G e n C a p t -0.7032 ***0.8207 **0.9157 ***0.9004 ***
I n R G D P 0.0145 ***-0.61260.3409 ***0.3176
I n R E N 0.90330.7443-0.18070.5521
I n N R E N 0.0672 ***0.0633 ***0.8221 **-0.0988 ***
I n E F 0.85070.78420.21190.0193-
Source: Authors’ computation, 2023. Notes: *** and ** represent 1%, 5%, and significance levels, respectively.
Table 6. Results of the mediating mechanism.
Variables(1)
I n G e n C a p t
(2)
I n E D U
(3)
I n L I F
(4)
I n G O V E
(5)
I n C O R
(6)
I n G e n C a p t
I n R G D P 0.329 ***
(4.18)
1.6101 ***
(3.05)
1.154 ***
(5.46)
1.109 **
(0.77)
0.922
(1.31)
0.164 ***
(4.05)
I n E D U 0.031 ***
(10.29)
I n L I F 0.041 ***
(11.01)
I n G O V E 0.0257 ***
(5.19)
I n C O R −0.0545 ***
(5.15)
I n R E N 0.0134
[0.021]
0.0138
[0.021]
0.079
[0.002]
0.084
[0.004]
−0.1556 *
[0.024]
−0.158
[0.014]
I n N R E N 0.027 ***
[0.051]
0.0205 **
[0.052]
0.0256 ***
[0.025]
0.0904 **
[0.052]
0.186 *
[0.034]
0.148 *
[0.015]
I n E F 0.035 ***
[0.051]
0.158 **
[0.032]
0.741 ***
[0.003]
0.035 *
[0.025]
0.137 **
[0.044]
0.145 *
[0.021]
C o n s −0.251
[0.007]
−0.108
[0.005]
−0.343
[0.004]
−0.445
[0.013]
0.154 *
[0.044]
0.182 *
[0.014]
x t t e s t 3 3603.55 ***7.4 × 10⁴ ***51203.04 ***2.6 × 10⁵ ***15224.01 ***1544f8.09 ***
Source: Authors’ computation, 2023. Notes: ***, **, and * represent 1%, 5%, and 10% significance levels, respectively.
Table 7. Estimation results of GETs approach in dynamic autoregressive distributed lagged form.
Panel A: Final Model Specification Results in Dynamic Form
VariablesCoefficientsp-Value
InGENCAP0.70950.0005
InRGDP0.33510.0332
InREN−4.00210.0433
InNREC−0.51120.0044
InECOF0.43280.0065
Structural dates
I:1986−0.3566−0.4476
S1:19990.42230.0338
S1:2007−1.1770.0000
D1:20161.04320.0000
R-Square0.8743
Adjusted R-Square0.7705
Table 8. Results of the cointegration, diagnostic, and non-linearity estimates of GETs estimate.
Panel A: Long-Run Coefficients
RECNRECI:1986SI:1999SI:2003DI:2016
−0.0911 ***−0.7322 ***−0.4103 **0.2336 ***−1.0033 ***0.8771 ***
Panel B: Diagnostic tests results
AR 1–2 testARCH 1–1 testNormality TestHetero testHetero-XRESET 23 Test
2.7524 [0.0825]0.4033 [0.5113]0.4211 [0.7211]1.1001 [0.4048]0.7433 [0.6022]0.3044 [0.7331]
Panel C: Cointegration test results
−6.3422 **
Panel D: Non-linearity test results
Chi-square
14.658 [0.4011]
F-form
0.65448 [0.7443]
Notes: **, *** indicate rejection of the null hypothesis at 5%, and 1% significance levels, respectively.
Disclaimer/Publisher’s Note: The statements, opinions and data contained in all publications are solely those of the individual author(s) and contributor(s) and not of MDPI and/or the editor(s). MDPI and/or the editor(s) disclaim responsibility for any injury to people or property resulting from any ideas, methods, instructions or products referred to in the content.

