
Study on the Microclimatic Effects of Plant-Enclosure Conditions and Water–Green Space Ratio on Urban Waterfront Spaces in Summer


Abstract
:1. Introduction
2. Materials and Methods
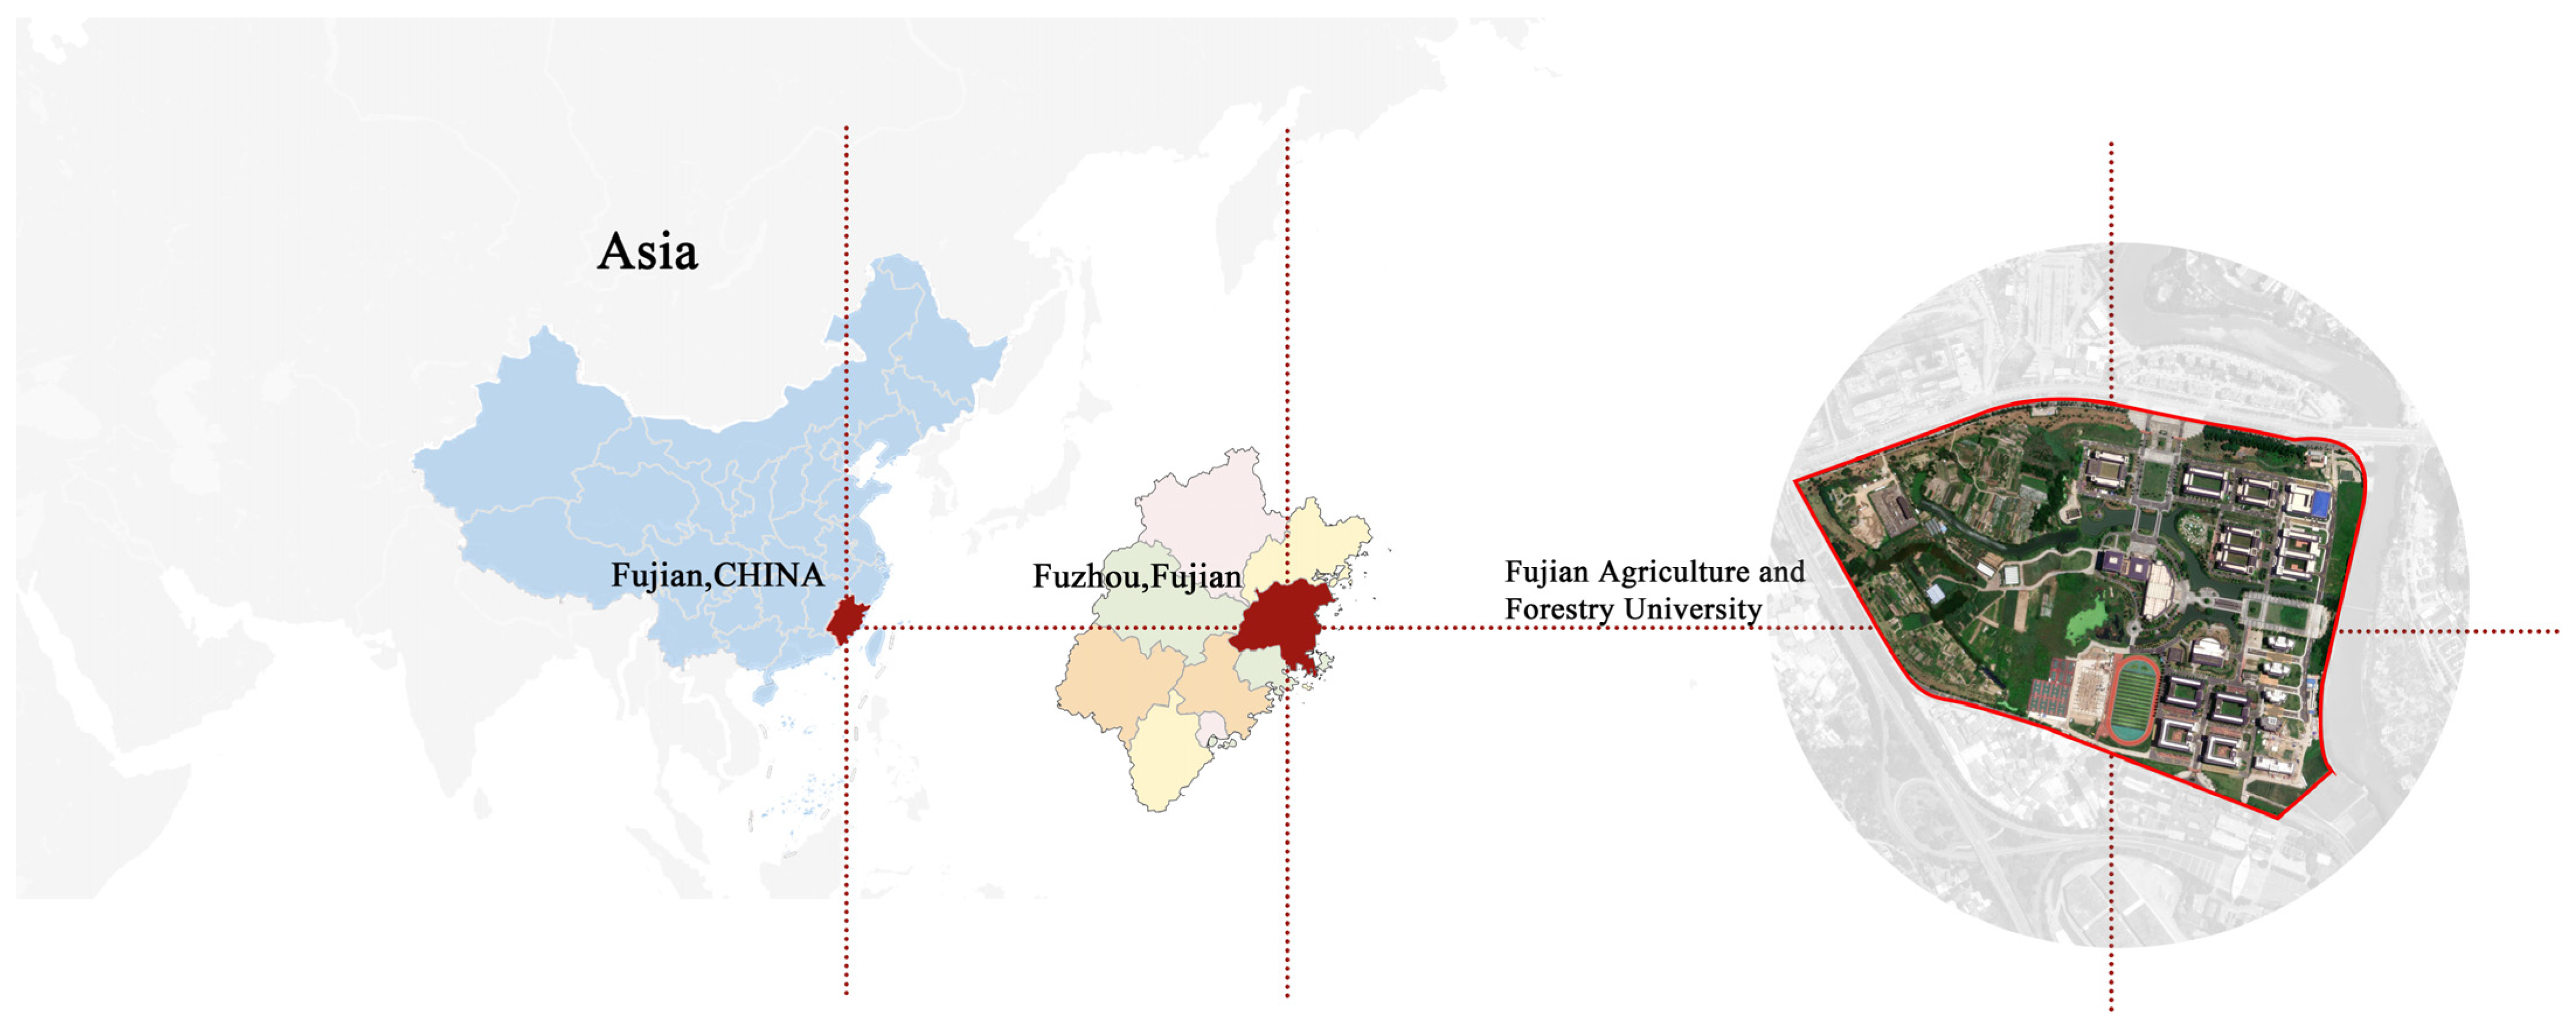
2.1. Study Area
2.2. Field Measurement
2.3. ENVI-Met Simulation
2.3.1. Model Validation
2.3.2. Modeling Scheme
2.4. Data Analysis
3. Results
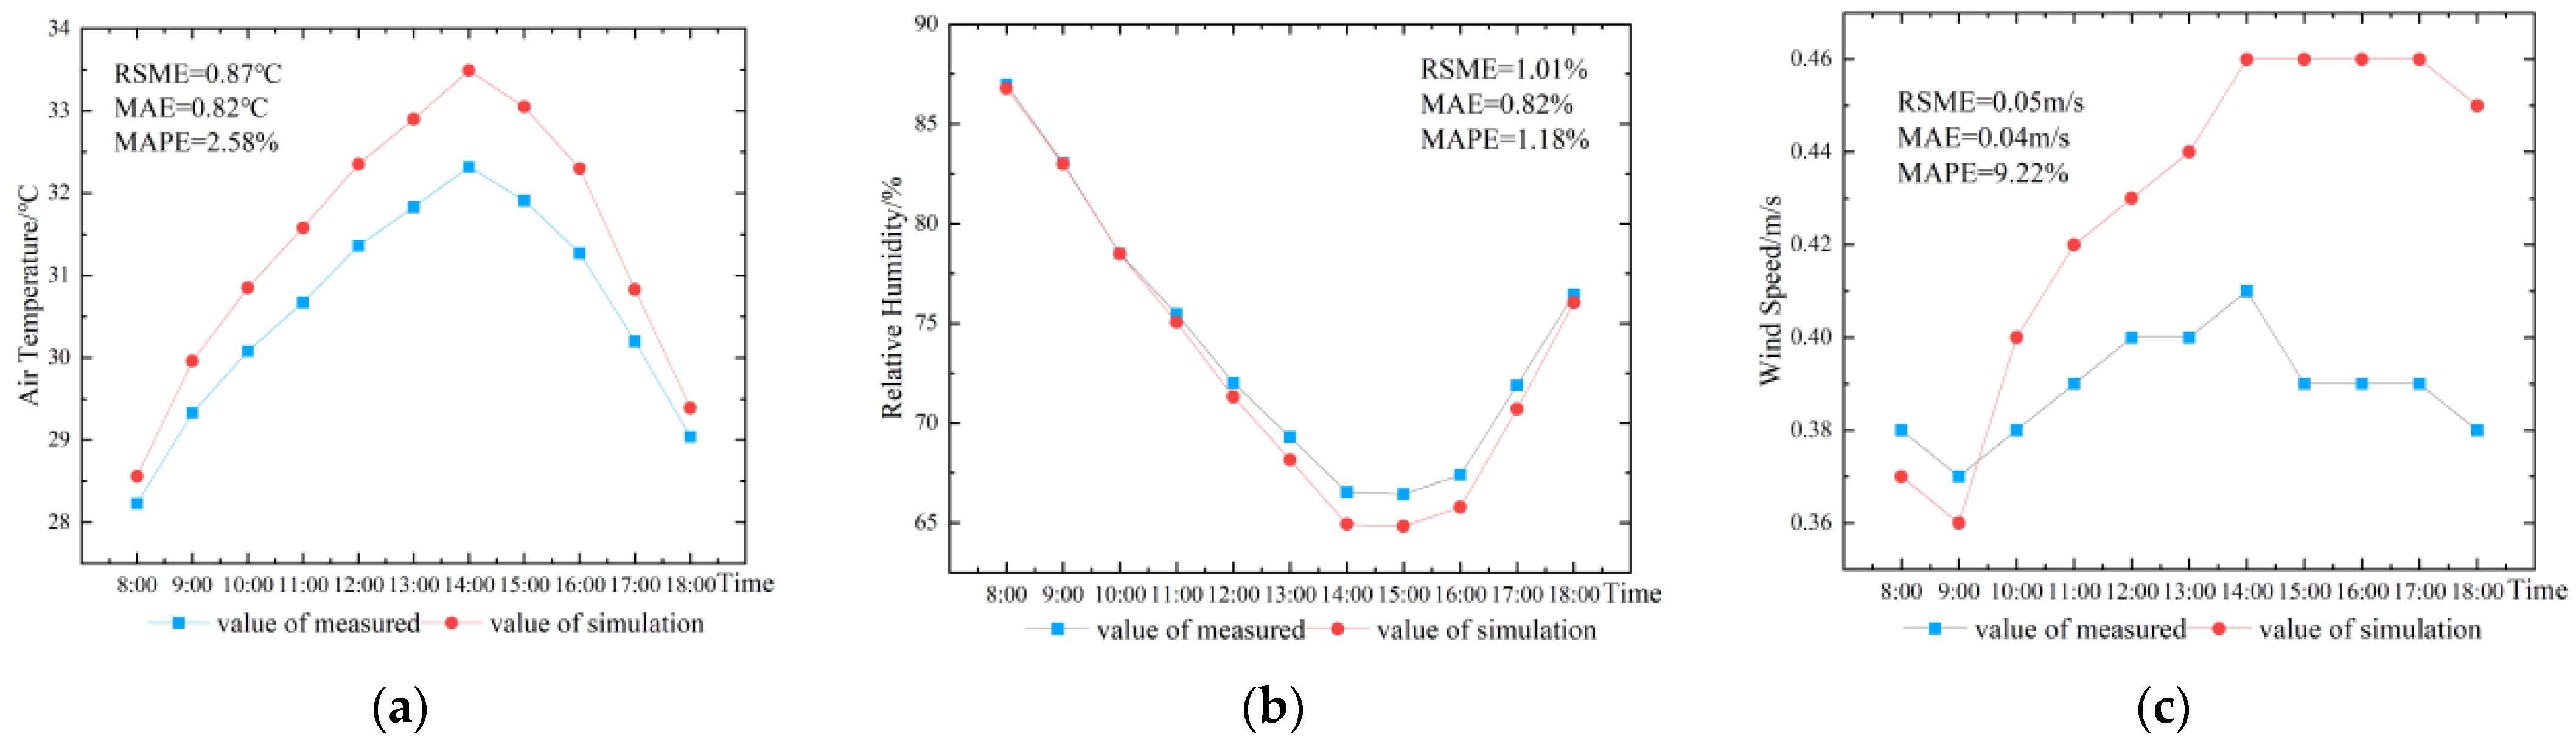
3.1. Comparative Analysis of the Errors between Simulated and Measured Value
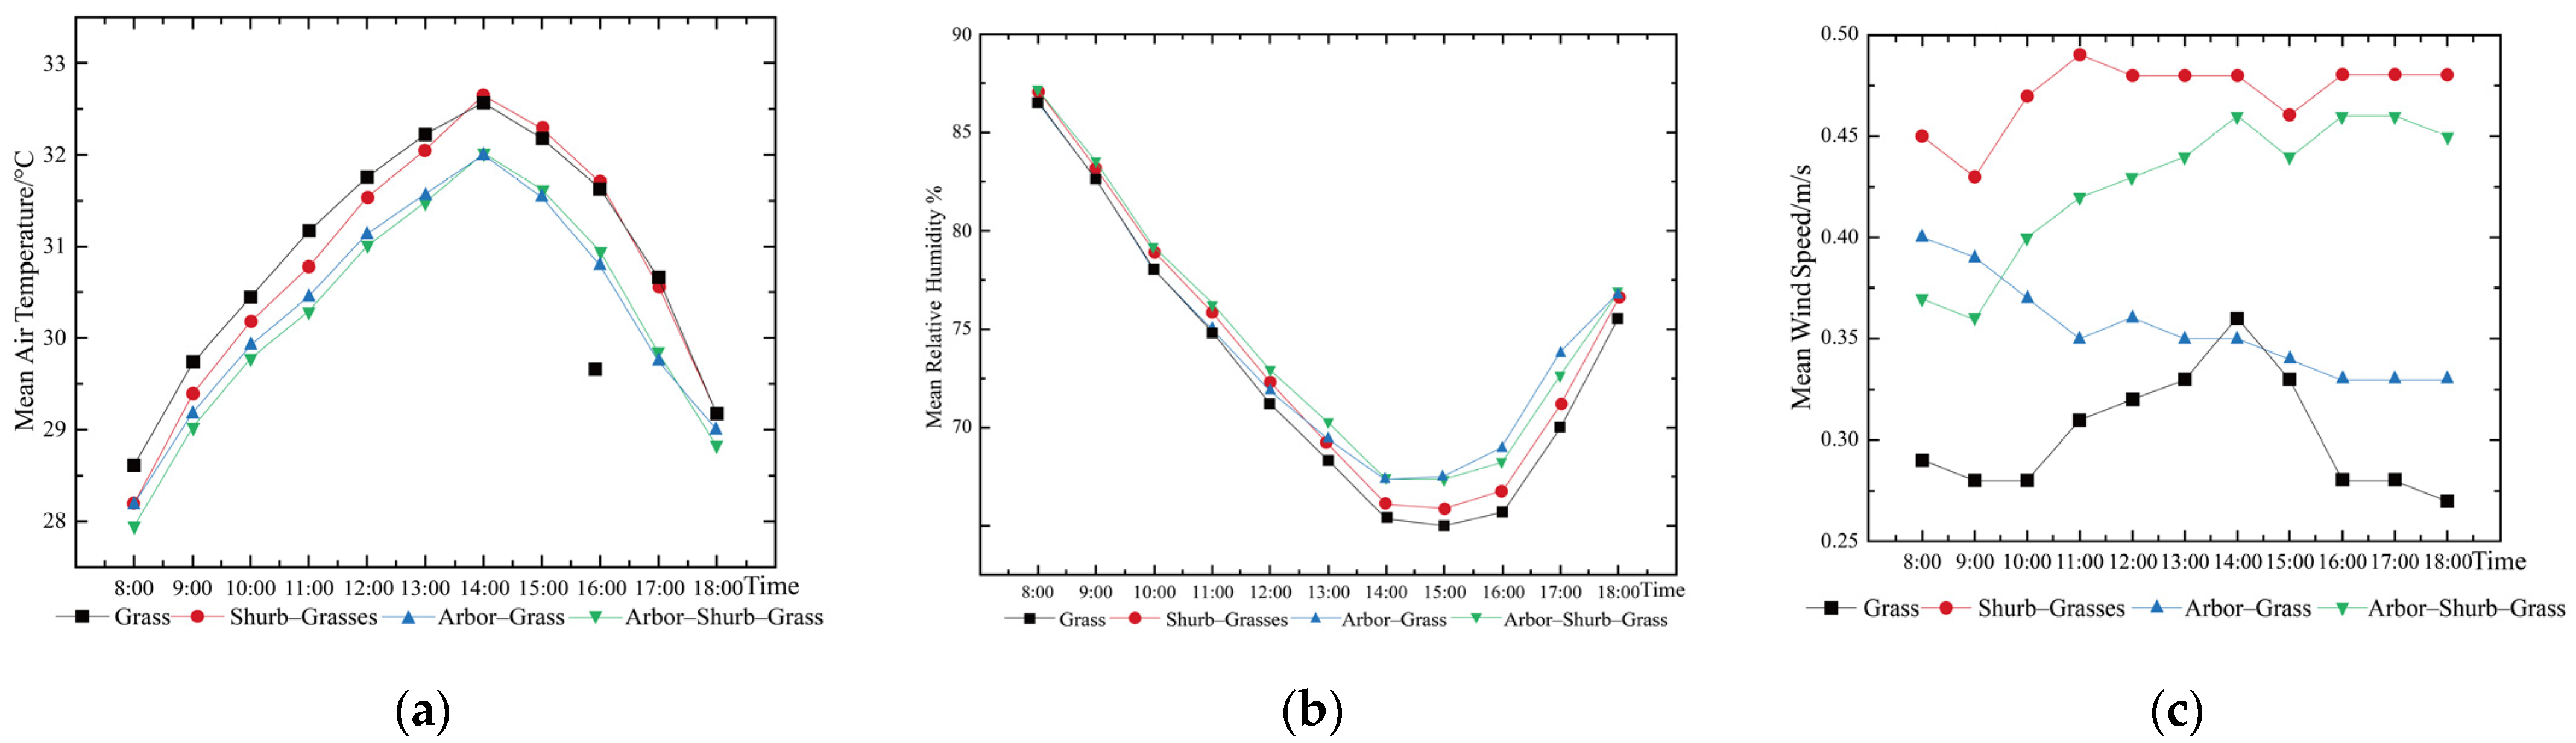
3.2. Analysis of Measured Results of Plant Communities in Waterfront Spaces
- (1)
- Temperature. The average daily temperatures of different plant communities in waterfront spaces in summer had the same trend. The overall trend was an inverted U-shaped curve which increased and then decreased. All the maximum temperatures occurred at 14:00 p.m. and the minimum temperatures occurred at 8:00 a.m. The temperature of grassland varied from 28.64 °C to 32.57 °C with a mean daily temperature of 30.92 °C. At 14:00 p.m., the lowest air temperature was 27.94 °C for tree–shrub–grass, followed by the tree–grass and shrub–grass plant communities with temperatures of 31.13 °C and 31.54 °C, the highest air temperature was 31.76 °C for grass. At 8:00 a.m., the order in terms of coolness of the plant community was: tree–shrub–grass (coolest) > tree–grass > shrub–grass > grass, and the air temperatures were: 27.94 °C, 28.17 °C, 28.18 °C, and 28.61 °C, respectively.
- (2)
- Humidity. The daily average humidity of different plant communities in waterfront spaces in summer had the same trend. The overall trend showed a U-shaped curve which decreased and then increased, with the lowest humidity occurring at 15:00 p.m. and the highest humidity occurring at 8:00 a.m. The humidity of the tree–shrub–grass varied from 67.30% to 87.18%, and the daily average humidity was 74.71%. Compared to tree–shrub–grass, grassland had the lowest average daily humidity of 73.01%, followed by tree–grass at 74.39%. At 15:00 p.m., tree–grass had the highest relative humidity of 67.51%, followed by tree–shrub–grass and shrub–grass plant communities at 67.30% and 65.89%, respectively, and grass had the lowest relative humidity of 65.03%. At 8:00 a.m., the order of highest humidity in the plant community was: tree–shrub–grass > tree–grass > shrub–grass > grass, and the relative humidity was: 87.18%, 87.08%, 87.07%, and 86.54%, respectively.
- (3)
- Wind speed. The wind speed fluctuated in summer at each measurement point. The shrub–grass had the highest average wind speed and the best ventilation. (wind speeds ranged from 0.47 to 0.48 m/s, with an average wind speed of 0.47 m/s), followed by tree–shrub–grass (wind speeds ranged from 0.36 to 0.46 m/s, with an average wind speed of 0.43 m/s) and shrub–grass (wind speeds ranged from 0.32 to 0.39 m/s, with an average wind speed of 0.35 m/s). Grassland had the worst ventilation (wind speed range from 0.27 to 0.36 m/s, mean wind speed of 0.30 m/s).
3.3. Analysis of the Effects of Different Enclosure Conditions and Water–Green Space Ratio on Microclimate and Comfort Level
- (1)
- Cooling index. Comparative calculation of the average summer cooling index (Table 4) found that, under the same enclosure conditions, different water body–green space ratios have different effects on temperature regulation. With the increase in water body percentage, the cooling index showed a trend of increasing and then decreasing. Comparing the average value of each water body–green space ratio, it can be seen that the water body–green space ratio of 1.8:1 has the best heat preservation effect, with an average cooling index of 1.83 °C, followed by the water body–green space ratios of 4:1 and 1:1, with an average cooling index of 1.80 °C. By analyzing the correlation between the water body–green space ratio and the cooling index (Figure 5a), it was found that the water body–green space ratio was significantly positively correlated with the cooling index under the three-side enclosure space (R2 = 0.81), and the water body–green space ratio was positively correlated with the cooling index under the two-side enclosure space (R2 = 0.66), i.e., the three-side enclosure space > two-side enclosure space. In all other enclosure conditions, the correlation was not significant. By analyzing the correlation between the enclosure and the cooling index (Figure 5b), it was found that the spatial enclosure cooling and the temperature index were significantly positively correlated (R2 = 0.96) when the water body–green space ratio was 1.8:1 and that the spatial enclosure was significantly positively correlated with the cooling index when the water body–green space ratio was 1:1 (R2 = 0.93), i.e., the water body–green space ratio of 1.8:1 > the water body–green space ratio of 1:1. The other enclosures were not strongly correlated with the cooling index. A comprehensive comparison shows that the average cooling benefit of B4 (enclosure on the east side) is better. The cooling index is the highest at 2.03% for a water body–green space ratio of 1.8:1, and the cooling indices of the other water body–green space ratios are in the following order: 2.02%, 2.02%, 2.01%, and 2.00%, followed by C4 (enclosure on the southwestern side), and the space with a water body–green space ratio of 1.8:1. The cooling indices were all 1.99%.
- (2)
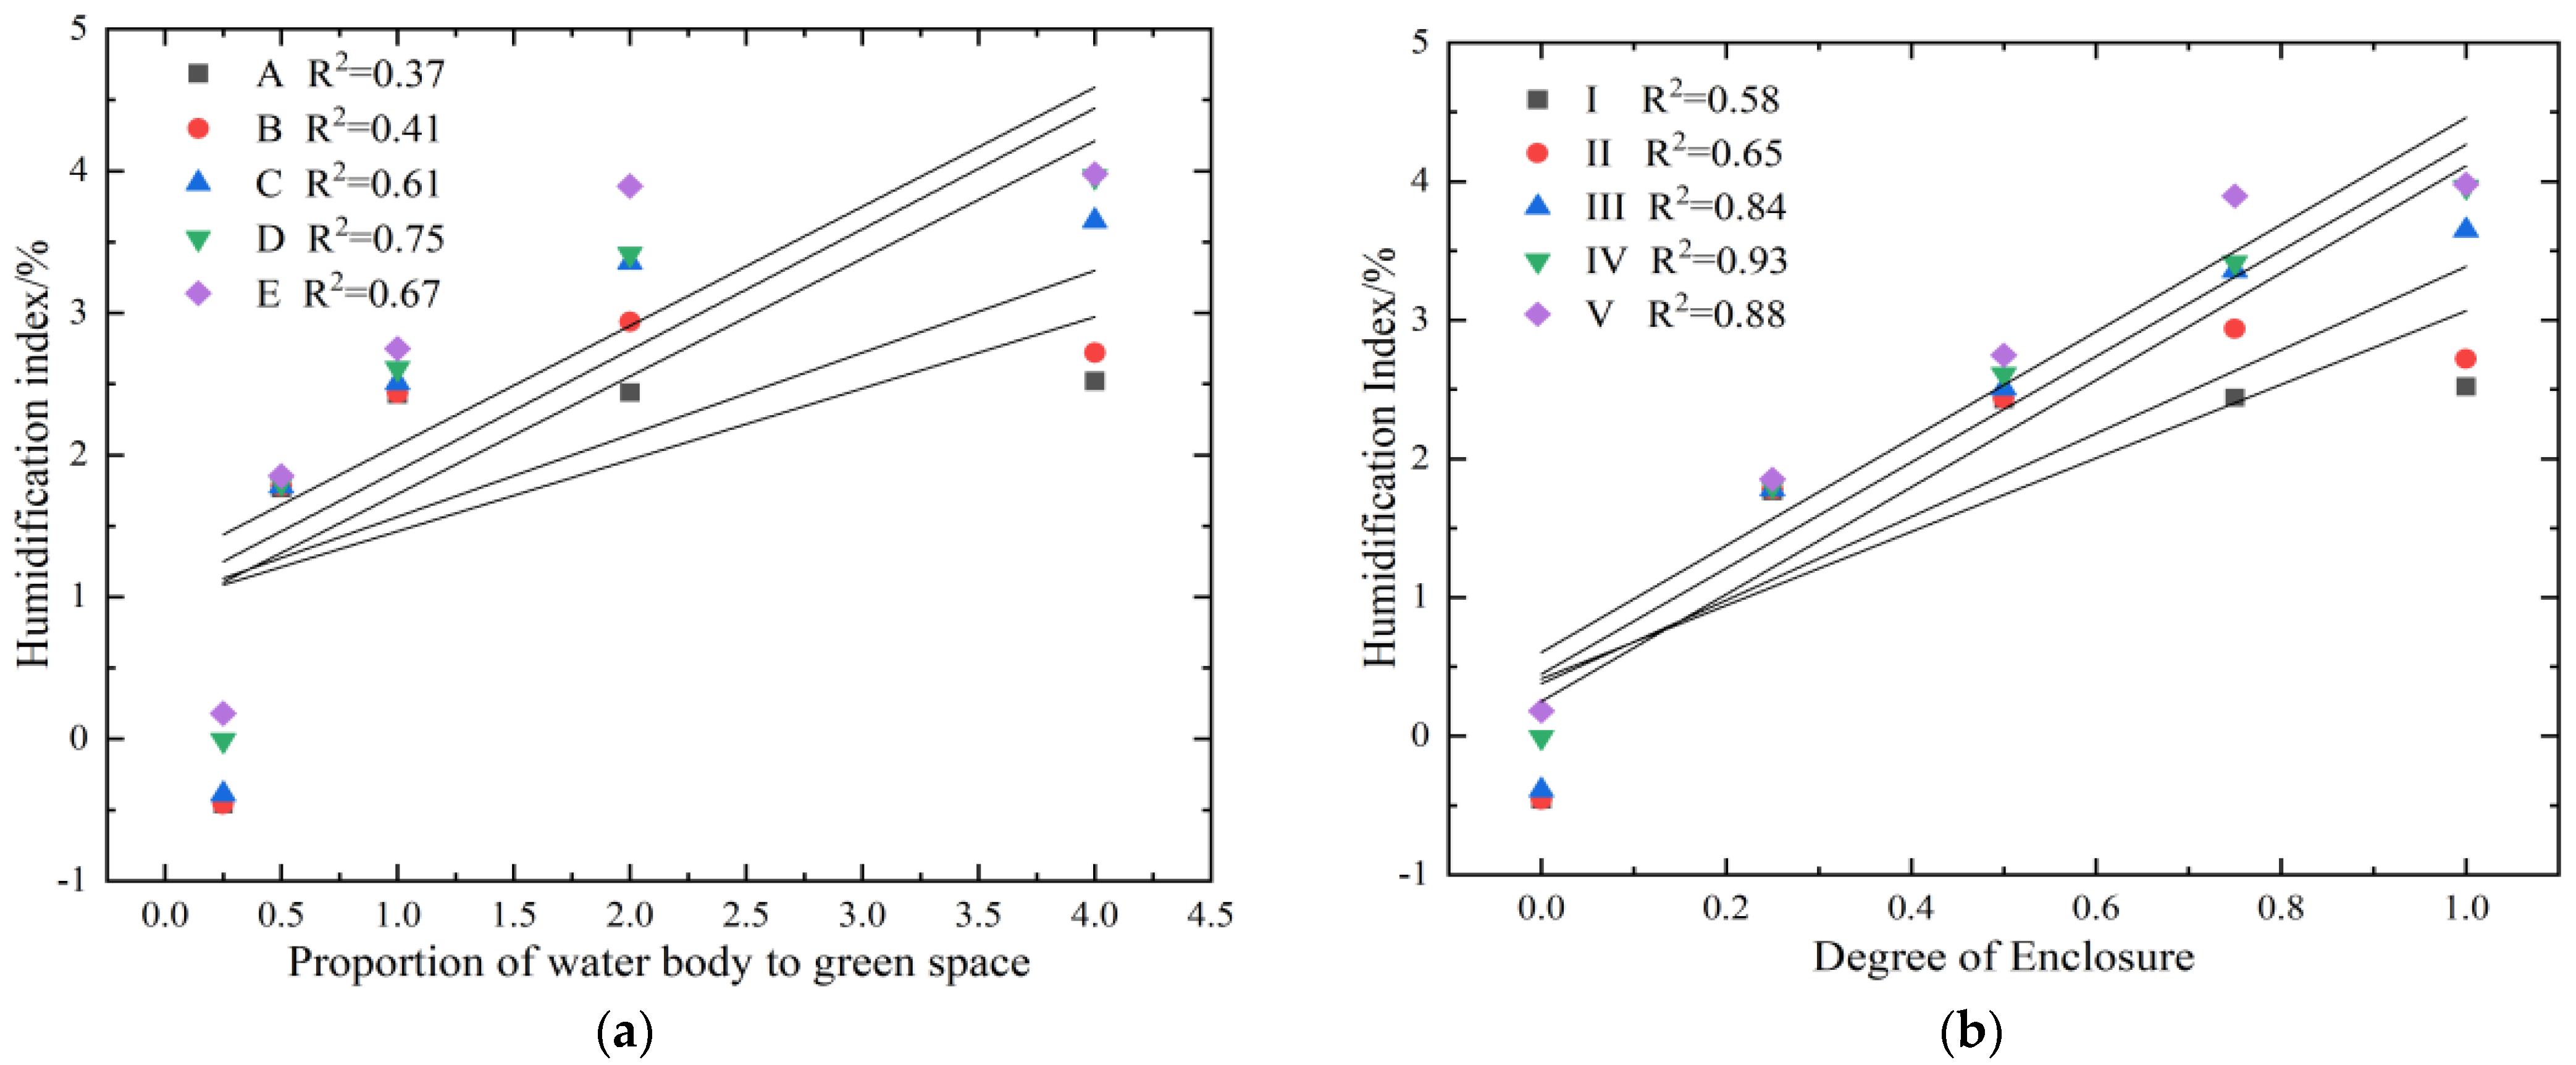
- Humidification index. The higher the content of water molecules in the air in summer, the better the humidification benefit and the better the improvement of the environment. From Table 5, it can be seen that under the same enclosure conditions, different water body–green space ratios have different humidification effects. The higher the water body–green space ratio, the higher the relative humidity, which is due to the presence of a large number of water molecules in the water body that can increase humidity. The average humidification rates were 2.09%, 2.23%, 2.43%, 2.53%, and 2.73% for water body–green space ratios of 1:4, 1:1.8, 1:1, 1.8:1, and 4:1, with the humidification rate increasing in that order. Analyzing the correlation between the water body–green space occupancy ratio and the humidification index, it was found (Figure 6a) that the water body–green space ratio and the humidification index were positively correlated under different enclosure conditions. Among them, the correlation between water body–green space ratio and humidification index was significantly positive under three-side enclosure, four-side enclosure, and two-side enclosure conditions (R2 = 0.93, R2 = 0.88, and R2 = 0.84). Analyzing the correlation between the enclosure and the humidification index found (Figure 6b) that spatial enclosure was positively correlated with the humidification index at water body–green space ratios of 1:1, 1.8:1, and 4:1 (R2 = 0.61, R2 = 0.75, and R2 = 0.67). Taken as a whole, different enclosure conditions showed different regulatory effects on humidity, and the highest humidification effect was found in D2 (three-sided enclosure in the north-south-east and south-east, with a water–green space ratio of 4:1) and D4 (three-sided enclosure in the east-west and south-west, with a water–green space ratio of 4:1), with humidification rates of 4.88%, and 4.66%, respectively; these were followed by E, the space with water–green space ratios of 1.8:1, 4:1, which had a humidification rate of 3.96%, 3.98%.
- (3)
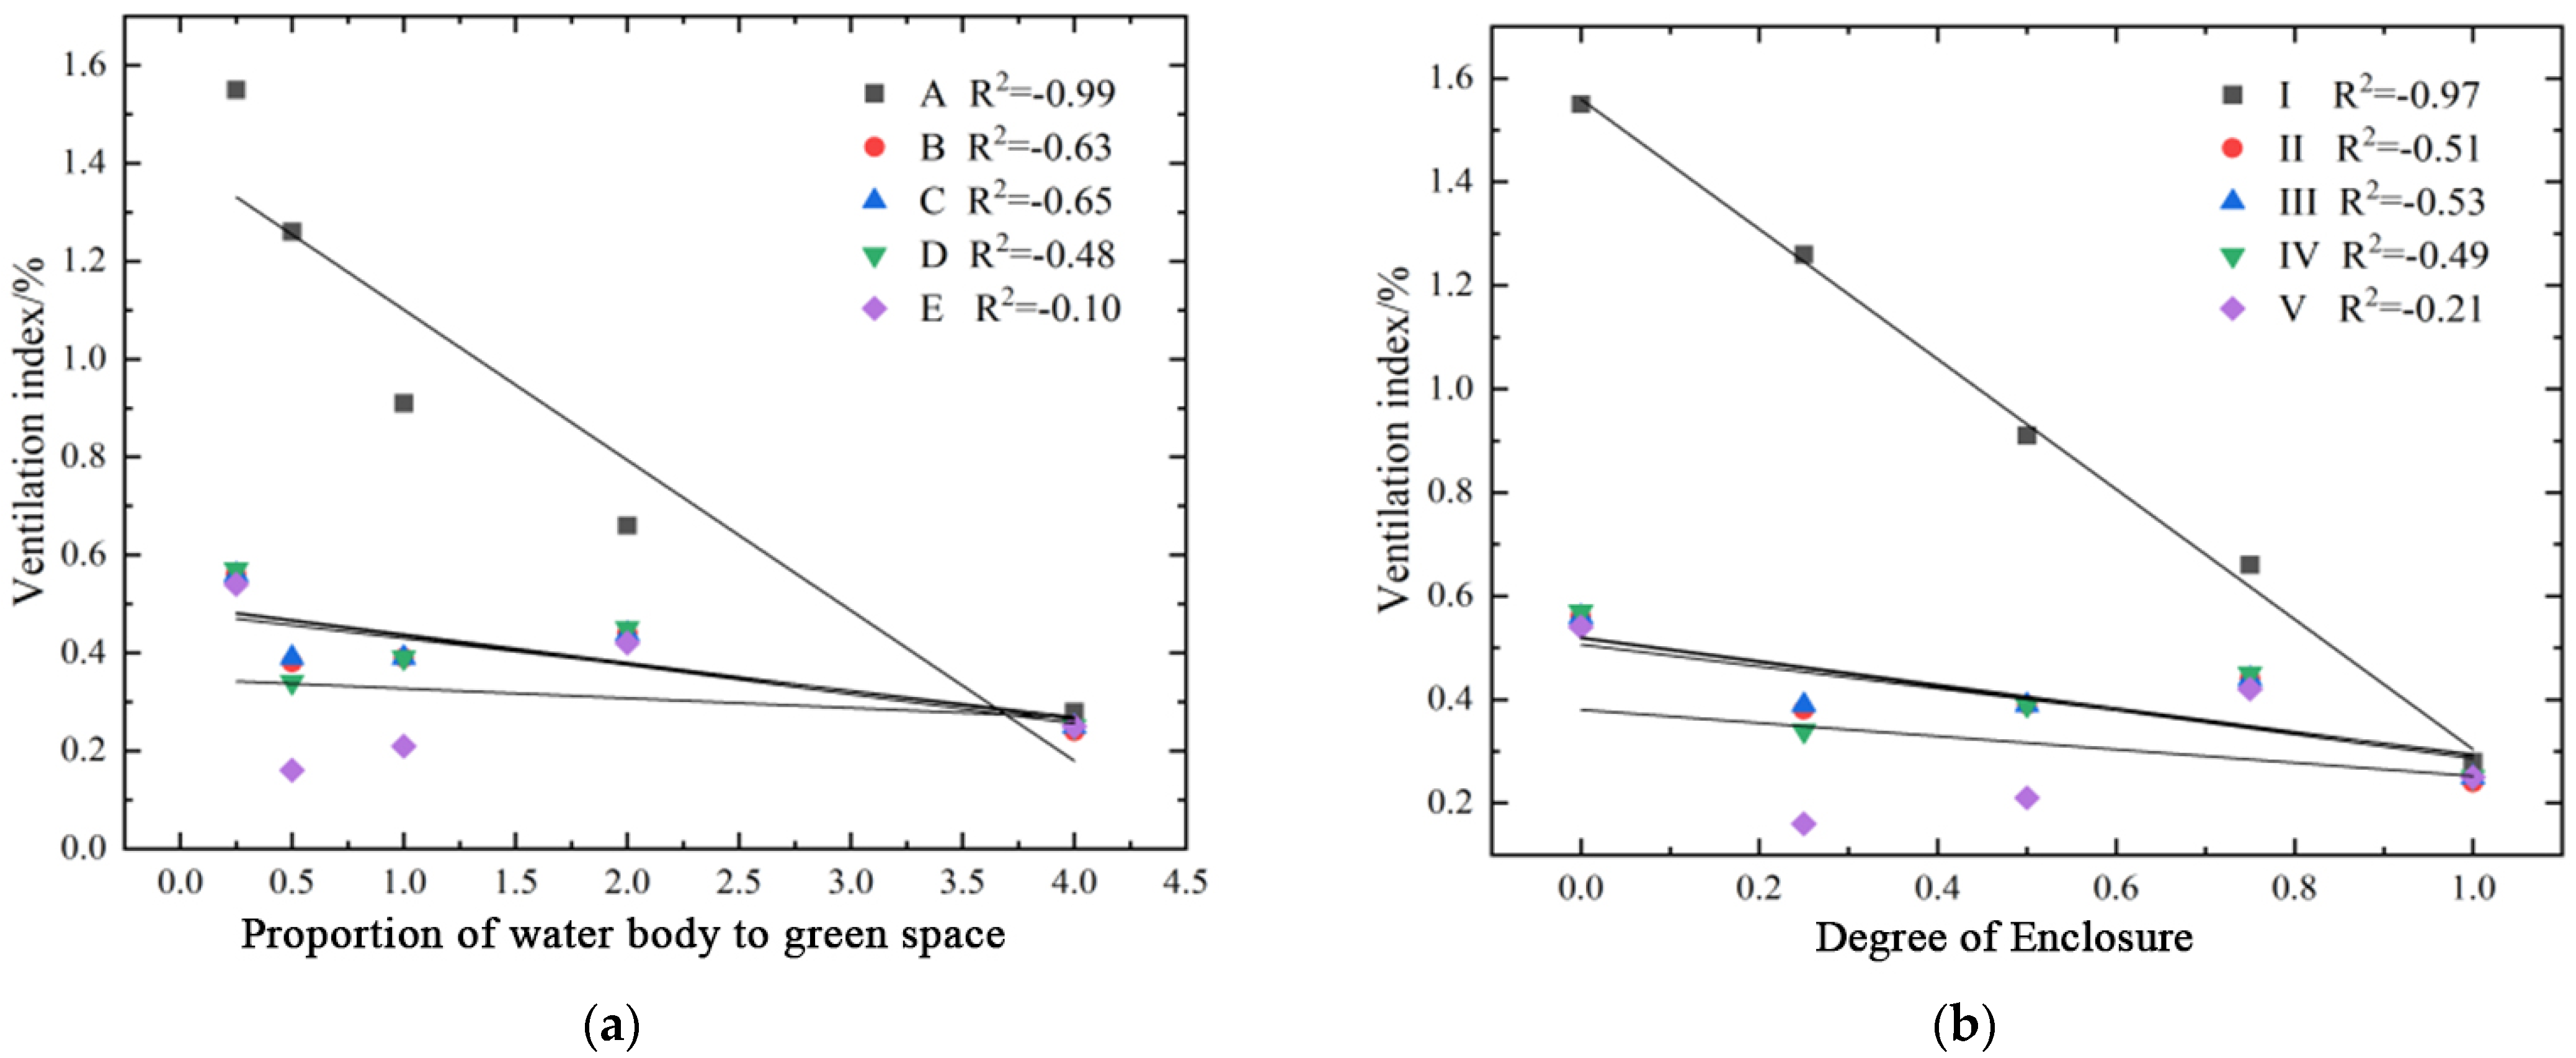
- Ventilation index. Table 6 shows that under the same enclosure conditions, different water body–green space ratios have different effects on the regulation of wind speed. Observation of the ventilation index values revealed that the waterfront space was best ventilated when plants were not enclosed, and the water body–green space ratio was 1:4, with an average ventilation index of 0.94%. Analyzing the correlation between water body–green space occupancy and humidification index, it was found (Figure 7a) that the water body–green space ratio was negatively correlated with the ventilation index under the same enclosure condition and that the water body–green space ratio under the no-enclosure space had a significant negative correlation with the ventilation index (R2 = 0.99). As shown in Figure 7b, the degree of enclosure was negatively correlated with the ventilation index, where the strongest correlation was for the waterfront space with a waterbody–green space ratio of 1:4 (R2 = −0.97). Enclosure degree, enclosure direction, and underlayment ratio each had an effect on wind speed. In summary, A (unobstructed), with a waterbody–green space ratio of 1:4, had the best ventilation index of 1.55%. This was followed by B3 (enclosure on the west side, enclosure on the south side, enclosure on the east side, and enclosure on the north side) with a water body–green space ratio of 1:4, with ventilation indices of 1.41%, 1.30%, 1.24%, and 1.09%, respectively.
- (4)
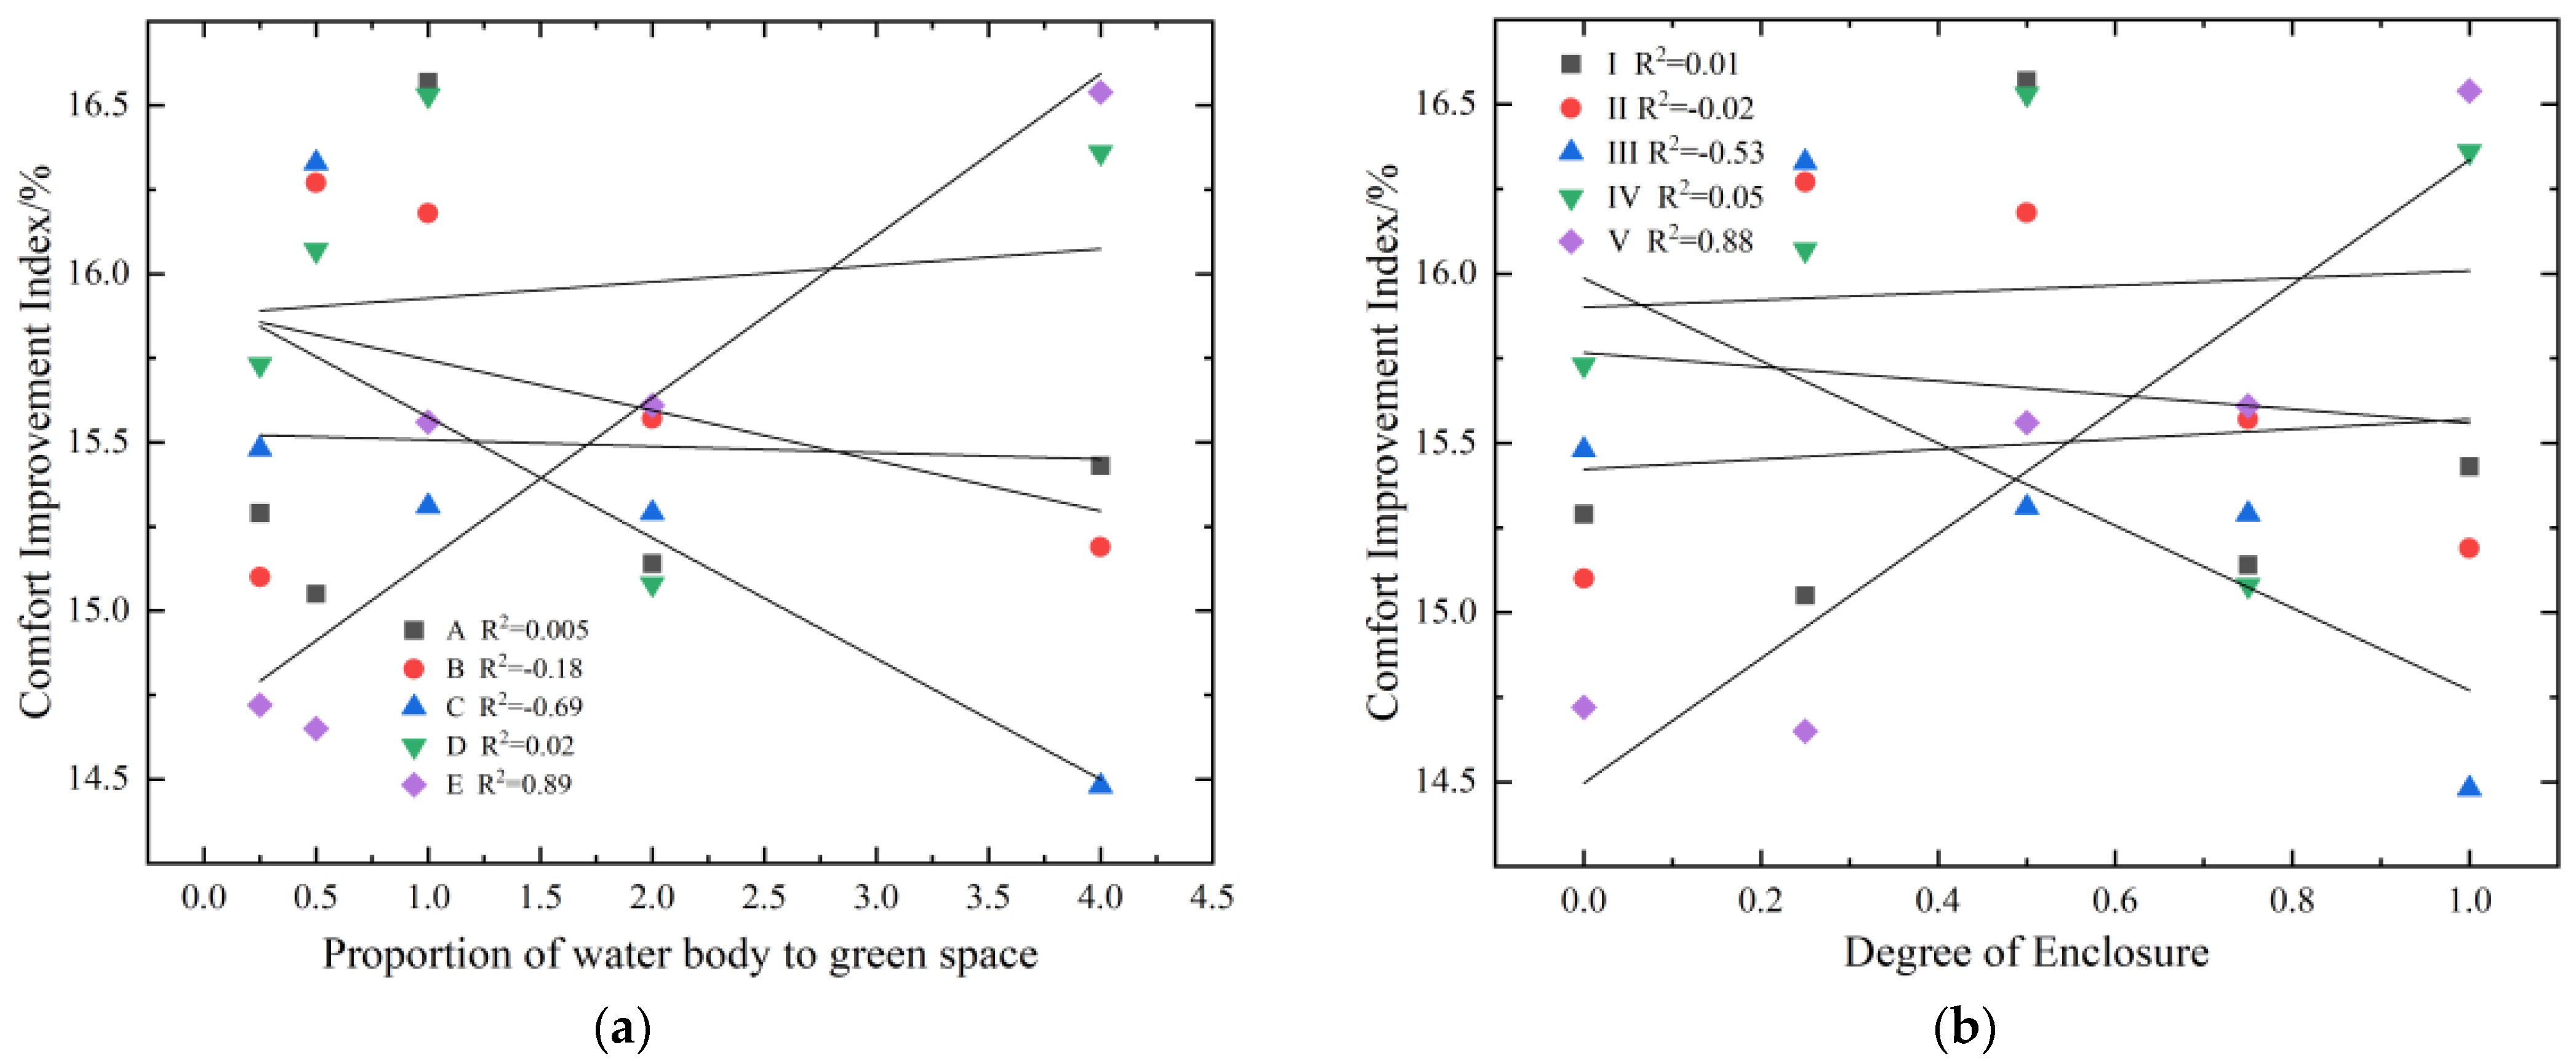
- Human comfort index. As shown in Table 7, the degree of enclosure, the direction of enclosure, and the water–green space ratio improved human comfort to some extent. As shown in Figure 8a, different water body–green space ratios under the same enclosure conditions had different improvement effects on the comfort index. The water–green space ratio under the two-side enclosure space was negatively correlated with the comfort improvement index; the water–green space ratio under the entire enclosure space was significantly positively correlated with the comfort improvement index; and there was no significant correlation between the water–green space ratio and the comfort improvement index under the rest of the enclosure conditions. Comparing the average comfort improvement indexes of water–green space ratios, it was found that the most extensive average comfort improvement index was 15.99% for a water–green space ratio of 1.8:1, and the smallest average comfort improvement index was 15.36% for a water–green space ratio of 4:1. Under the condition of the same water body–green space ratio, different enclosure degrees and enclosure directions have different abilities to improve the human comfort index. When the water body–green space ratio was 1:1, the degree of enclosure was negatively correlated with the comfort improvement index; when the water body–green space ratio was 4:1, the degree of enclosure was significantly positively correlated with the comfort improvement index, and the rest were not significantly correlated (Figure 8b). Taken together, the most significant improvement index was C4 (two southwestern enclosures, water–green space ratio of 1:4) at 17.38%, followed by C3 (two northeastern enclosures, water–green space ratio of 1:4) at 17.34%, and then C4 (two southwestern enclosures, water–green space ratio of 1.8:1), all with an improvement index of 17.27%.
4. Discussion
4.1. Microclimatic Effects of Plant Communities in Waterfront Spaces
4.2. Microclimatic Effects of Different Enclosure Conditions and Water Body–Green Space Ratios on Waterfront Spaces
- (1)
- Cooling Index. This simulation study explores the relationship between enclosure conditions, the water body–green space ratio, and their combined effects on cooling. It reveals that the cooling index correlates significantly and positively with the enclosure degree at water body–green space ratios of 1:1 and 1.8:1, with weaker correlations observed at other ratios. This phenomenon likely results from the interplay of enclosure degree, water body size, green space area, and other factors [39]. Previous research indicates that urban temperature variations directly relate to subsurface structure and composition differences [40], as well as to variations in surrounding vegetation coverage and types, which influence green spaces’ abilities to regulate thermal energy [41]. Furthermore, each water body–green space ratio possesses a distinct temperature regulation capacity. As the proportion of water bodies increases, the cooling index initially rises, then declines, suggesting an optimal ratio at 1.8:1 for maximizing cooling effects. Notably, a higher water body proportion does not guarantee improved cooling, aligning with Offerle’s findings [42]. Additionally, the degree and orientation of enclosure significantly impact the waterfront space’s internal environment. An entirely open site, devoid of shade and subject to high temperatures, can regulate its cooling index by enhancing enclosure, such as increasing tall trees and structures’ projection area, modifying microclimatic factors like light and wind speed, or adjusting the water body–green space ratio.
- (2)
- Humidification index. There is a correlation between waterfront-space enclosure and humidification index. Under the same enclosure conditions, the larger the water body–green space ratio, the stronger the humidification effect, which is consistent with the findings of Ranhao et al. [43]. The weakest correlation was found when the water body–green space ratio was 1:4, which might be related to the size of the water body area. The large area of the water body means that the water surface has high albedo and evaporation, which can take away part of the heat during air exchange, thus achieving a good cooling and humidifying effect. At the same time, the open water surface increases the exchange with the dominant wind, further increasing the wind speed, which is similar to the research results of Saaroni H and Steeneveld, G. J. [44,45]. In addition, the shading area and enclosure of tall trees, such as street trees and other tall trees, and the regulation of air circulation also affect the humidity change [46], which is consistent with the research results of Zhu et al. [47].
- (3)
- Ventilation index. The ventilation index assesses the impact of various water body–green space ratios under uniform enclosure conditions on ventilation, corroborating existing research that highlights the positive effects of both water bodies and grasslands on the wind environment [48]. Our experiments demonstrate that spaces without enclosures exhibit a superior ventilation effect due to the reduction in wind obstruction as vertical shading decreases. This facilitates increased airflow and wind speeds during summer [49], echoing the observations of Dan Song et al. [50]. Notably, spaces with a water body–green space ratio of 1:4 achieve the highest ventilation index, attributed to the water surface’s minor roughness creating wind channels that enhance wind speed and, consequently, natural ventilation. This setup optimally leverages the water’s large specific heat capacity and gradual temperature changes to minimize convection and turbulence between the water surface and air, promoting steady wind flow [51].
- (4)
- Human comfort improvement index. Human comfort is mainly affected by the joint influences of temperature, humidity, and wind speed [52]. Under the same enclosure conditions, the water body–green space ratio of the two-sided enclosure space was negatively correlated with the comfort improvement index; this was inconsistent with the findings of Kuang W H et al. [53], which might be related to the single water-body-plate setting in the simulation software. The water body–green space ratio of the fully enclosed space was significantly positively correlated with the comfort improvement index; under conditions with the same water body–green space ratio, the enclosure was significantly positively correlated with the comfort improvement index when the water body–green space ratio was 4:1. This may be due to the use of green trees as the enclosure method in our simulation, and the tall, leafy trees can impede particular air circulation and form a heat insulation layer [54], which makes the external greenery insulate the external hot and high temperatures. The internal water body environment reduces the temperature and increases the humidity, which results in the improvement of the comfort level.
5. Conclusions
- (1)
- Waterfront vegetation contributes to cooling and humidifying the microclimate, with the effectiveness of different plant communities ranked as follows: tree–shrub–grass > tree–grass > shrub–grass > grass. This research also reaffirms ENVI-met software’s scientific reliability and practical utility for microclimate studies.
- (2)
- A water body–green space ratio of 1.8:1 achieves the most significant cooling effect. Enclosure conditions positively impact the cooling index at ratios of 1:1 or 1.8:1.
- (3)
- In terms of humidification, a positive correlation exists between the water body–green space ratio and the humidification index, in descending order of effectiveness: 1.8:1 > 4:1 > 1:1 > 1:1.8 > 1:4. Similarly, enclosure methods correlate positively with the humidification index, ranked as: three-sided > four-sided > two-sided > one-sided > no enclosure.
- (4)
- For ventilation, a ratio of 1:4 between water body and green space, under uniform enclosure conditions, inversely affects the humidification index, with larger water body areas enhancing ventilation.
- (5)
- The optimal ratio for improving human comfort is 1.8:1, with negative correlations observed for a 1:1 ratio in minimally enclosed spaces and positive correlations for a 4:1 ratio in fully enclosed spaces.
Author Contributions
Funding
Institutional Review Board Statement
Informed Consent Statement
Data Availability Statement
Conflicts of Interest
Appendix A

| Enclosure Condition | Water Body–Green Space Ratio | |||||
|---|---|---|---|---|---|---|
| Enclosure Degree | Enclosure Direction | I-1:4 | II-1:1.8 | III-1:1 | IV-1.8:1 | V-4:1 |
| A | - |  |  |  |  |  |
| B | B1—North |  |  |  |  |  |
| B2—South |  |  |  |  |  | |
| B3—West |  |  |  |  |  | |
| B4—East |  |  |  |  |  | |
| C | C1—West-North |  |  |  |  |  |
| C2—South-North |  |  |  |  |  | |
| C3—East-North |  |  |  |  |  | |
| C4—West-South |  |  |  |  |  | |
| C5—East-West |  |  |  |  |  | |
| C6—East-South |  |  |  |  |  | |
| D | D1—North-South-West |  |  |  |  |  |
| D2—North-South-East |  |  |  |  |  | |
| D3—East-West-North |  |  |  |  |  | |
| D4—East-West-South |  |  |  |  |  | |
| E | East-South-West-North |  |  |  |  |  |
References
- Morakinyo, T.E.; Lam, Y.F.; Hao, S. Evaluating the role of green infrastructures on near-road pollutant dispersion and removal: Modelling and measurement. J. Environ. Manag. 2016, 182, 595–605. [Google Scholar] [CrossRef] [PubMed]
- Tong, Z. Supporting Information for “Roadside Vegetation Barrier Designs to Mitigate Near-Road Air Pollution Impacts”. Sci. Total Environ. 2015, 541, 920–927. [Google Scholar] [CrossRef] [PubMed]
- Hagler, G.S.W.; Lin, M.Y.; Khlystov, A.; Baldauf, R.W.; Isakov, V.; Faircloth, J.; Jackson, L. Field investigation of roadside vegetative and structural barrier impact on near-road ultrafine particle concentrations under a variety of wind conditions. Sci. Total Environ. 2012, 419, 7–15. [Google Scholar] [CrossRef] [PubMed]
- Govindarajulu, D. Urban green space planning for climate adaptation in Indian cities. Urban Clim. 2014, 10, 35–41. [Google Scholar] [CrossRef]
- Fu, B. The Climatic Effects of Waters in Different Natural Conditions. Acta Geogr. Sin. 1997, 52, 246–253. [Google Scholar]
- Aslan, N.; Koc-San, D. Analysis of relationship between urban heat island effect and land use/cover type using Landsat 7 ETM+ and Landsat 8 OLI images. Int. Arch. Photogramm. Remote Sens. Spat. Inf. Sci. 2016, 41, 821–828. [Google Scholar] [CrossRef]
- Li, X.; Ratti, C.; Seiferling, I. Quantifying the shade provision of street trees in urban landscape: A case study in Boston, USA, using Google Street View. Landsc. Urban Plan. 2018, 169, 81–91. [Google Scholar] [CrossRef]
- Morakinyo, T.E.; Kong, L.; Lau, K.L.; Yuan, C.; Ng, E. A study on the impact of shadow-cast and tree species on in-canyon and neighborhood’s thermal comfort. Build. Environ. 2017, 115, 1–17. [Google Scholar] [CrossRef]
- Ruhland, C.T.; Day, T.A. Changes in UV-B radiation screening effectiveness with leaf age in Rhododendron maximum. Plant Cell Environ. 2010, 19, 740–746. [Google Scholar] [CrossRef]
- Fung, C.K.W.; Jim, C. Influence of blue infrastructure on lawn thermal microclimate in a subtropical green space. Sustain. Cities Soc. 2019, 52, 101858. [Google Scholar] [CrossRef]
- Cheng, S.X.; Jing, L.; Lei, Y. lmpact Analysis of Riverfront Residential Building Design in Northern Region on the Thermal and Humid Environment in Summer. Build. Sci. 2015, 31, 6. [Google Scholar]
- Liu, Z.; Brown, R.D.; Zheng, S.; Jiang, Y.; Zhao, L. An In-Depth Analysis of the Effect of Trees on Human Energy Fluxes. Urban For. Urban Green. 2020, 50, 126646. [Google Scholar] [CrossRef]
- Robitu, M.; Musy, M.; Inard, C.; Groleau, D. Modeling the influence of vegetation and water pond on urban microclimate. Sol. Energy 2006, 80, 435–447. [Google Scholar] [CrossRef]
- Li, K.; Gong, G.; Zou, S. Numerical Simulation of the Impact of Water Body on Building Natural Ventilation. J. Hunan Univ. (Nat. Sci. Ed.) 2009, 36, 119–123. [Google Scholar]
- Xu, X.; Liu, S.; Sun, S.; Zhang, W.; Liu, Y.; Lao, Z.; Guo, G.; Smith, K.; Cui, Y.; Liu, W.; et al. Evaluation of Energy Saving Potential of an Urban Green Space and its Water Bodies. Energy Build. 2019, 188–189, 58–70. [Google Scholar] [CrossRef]
- Jamei, E.; Rajagopalan, P.; Seyedmahmoudian, M.; Jamei, Y. Review on the impact of urban geometry and pedestrian level greening on outdoor thermal comfort. Renew. Sustain. Energy Rev. 2016, 54, 1002–1017. [Google Scholar] [CrossRef]
- Zhao, D.; Lei, Q.; Shi, Y.; Wang, M.; Chen, S.; Shah, K.; Ji, W. Role of Species and Planting Configuration on Transpiration and Microclimate for Urban Trees. Forests 2020, 11, 825. [Google Scholar] [CrossRef]
- Sanusi, R.; Johnstone, D.; May, P.; Livesley, S.J. Microclimate benefits that different street tree species provide to sidewalk pedestrians relate to differences in Plant Area Index. Landsc. Urban Plan. 2017, 157, 502–511. [Google Scholar] [CrossRef]
- Montazeri, H.; Toparlar, Y.; Blocken, B.; Hensen, J. Simulating the cooling effects of water spray systems in urban landscapes: A computational fluid dynamics study in Rotterdam, The Netherlands. Landsc. Urban Plan. 2017, 159, 85–100. [Google Scholar] [CrossRef]
- Jacopo, G.; Kristian, F.; Martina, L. The use of Outdoor Microclimate analysis to support decision making process: Case study of Bufalini square in Cesena. Sustain. Cities Soc. 2018, 42, 206–215. [Google Scholar]
- Marçal, N.A.; da Silva, R.M.; Santos, C.A.G.; dos Santos, J.S. Analysis of the environmental thermal comfort conditions in public squares in the semiarid region of northeastern Brazil. Build. Environ. 2019, 152, 145–159. [Google Scholar] [CrossRef]
- Zakhour, S. The impact of urban geometry on outdoor thermal comfort conditions in hot-arid region. J. Civ. Eng. Archit. Res. 2015, 2, 862–875. [Google Scholar]
- Ketterer, C.; Matzarakis, A. Human-biometeorological assessment of heat stress reduction by replanning measures in Stuttgart, Germany. Landsc. Urban Plan. 2014, 122, 78–88. [Google Scholar] [CrossRef]
- Bruse, M.; Fleer, H. Simulating surface–plant–air interactions inside urban environments with a three dimensional numerical model. Environ. Model. Softw. 1998, 13, 373–384. [Google Scholar] [CrossRef]
- Ziaul, S.; Pal, S. Modeling the effects of green alternative on heat island mitigation of a meso level town, West Bengal, India. Adv. Space Res. 2020, 65, 1789–1802. [Google Scholar] [CrossRef]
- Zhang, L.; Zhan, Q.; Lan, Y. Effects of the tree distribution and species on outdoor environment conditions in a hot summer and cold winter zone: A case study in Wuhan residential quarters. J. Affect. Disord. 2018, 130, 27–39. [Google Scholar] [CrossRef]
- Xu, H.; Zhu, J.; Li, H. Optimization Design of Summer Microclimate Adaptability of Urban Campus Green Space Based on ENVl-met Simulation. Mod. Urban Res. 2023, 38, 101–106. [Google Scholar]
- Emmanuel, R.; Loconsole, A. Green infrastructure as an adaptation approach to tackling urban overheating in the Glasgow Clyde Valley Region, UK. Landsc. Urban Plan. 2015, 138, 71–86. [Google Scholar] [CrossRef]
- Ebrahimabadi, S.; Johansson, C.; Rizzo, A.; Nilsson, K. Microclimate assessment method for urban design—A case study in subarctic climate. Urban Des. Int. 2018, 23, 116–131. [Google Scholar] [CrossRef]
- Oke, T. The urban energy balance. Prog. Phys. Geogr. Earth Environ. 1988, 12, 471–508. [Google Scholar] [CrossRef]
- Wang, Y. Study on Leaf Area Index Characteristics and Influencing Factors of Main Tree Species in Urban Park Green Space of Fuzhou City. Master’s, Thesis, Fujian Agriculture and Forestry University, Fuzhou, China, 2018. [Google Scholar]
- Xu, H.; Lin, X.; Lin, Y.; Zheng, G.; Dong, J.; Wang, M. Study on the microclimate effect of water body layout factors on campus squares. Int. J. Environ. Res. Public Health 2022, 19, 14846. [Google Scholar] [CrossRef]
- Li, Y.; Song, Y. Optimization of vegetation arrangement to improve microclimate and thermal comfort in an urban park. Int. Rev. Spat. Plan. Sustain. Dev. 2019, 7, 18–30. [Google Scholar] [CrossRef]
- Dui, W.; Xuejiao, D. Environmental meteorology and special weather forecast. Guangdong Meteorol. 2000, 26, 3–5. [Google Scholar]
- Zhang, B.; Amani-Beni, M.; Shi, Y.; Xie, G. The summer microclimate of green spaces in Beijing Olympic Park and their effects on human comfort index. Ecol. Sci. 2018, 37, 10. [Google Scholar]
- Chang, C.R.; Li, M.H.; Chang, S.D. A preliminary study on the local cool-island intensity of Taipei city parks. Landsc. Urban Plan. 2007, 80, 386–395. [Google Scholar] [CrossRef]
- Yoshida, A.; Kinoshita, S.; Hashida, S. Effect of tree canopies on thermal environment, thermal sensation and mental state. Environ. Eng. 2013, 110, 46a. [Google Scholar] [CrossRef]
- Liu, B.Y.; Lin, J. Study on Relationship between Microclimate and Space Section of Urban Waterfront Green Belt A Case Study of Riverfront Green Belt in Suzhou and Shanghai. Landsc. Archit. 2015, 6, 46–54. [Google Scholar]
- Tan, C.L.; Wong, N.H.; Tan, P.Y.; Jusuf, S.K.; Chiam, Z.Q. Impact of plant evapotranspiration rate and shrub albedo on temperature reduction in the tropical outdoor environment. J. Affect. Disord. 2015, 94, 206–217. [Google Scholar] [CrossRef]
- Bowler, D.E.; Buyung-Ali, L.; Knight, T.M.; Pullin, A.S. Urban greening to cool towns and cities: A systematic review of the empirical evidence. Landsc. Urban Plan. 2010, 97, 147–155. [Google Scholar] [CrossRef]
- Song, J.; Wang, Z.-H. Impacts of mesic and xeric urban vegetation on outdoor thermal comfort and microclimate in Phoenix, AZ. J. Affect. Disord. 2015, 94, 558–568. [Google Scholar]
- Offerle, B.; Eliasson, I.; Grimmond, C.S.B.; Holmer, B. Surface heating in relation to air temperature, wind and turbulence in an urban street canyon. Bound.-Layer Meteorol. 2007, 122, 273–292. [Google Scholar] [CrossRef]
- Sun, R.; Chen, A.; Chen, L.; Lü, Y. Cooling effects of wetlands in an urban region: The case of Beijing. Ecol. Indic. 2012, 20, 57–64. [Google Scholar] [CrossRef]
- Saaroni, H.; Ziv, B. The impact of a small lake on heat stress in a Mediterranean urban park: The case of Tel Aviv, Israel. Int. J. Biometeorol. 2003, 47, 156–165. [Google Scholar] [CrossRef] [PubMed]
- Steeneveld, G.; Koopmans, S.; Heusinkveld, B.; Theeuwes, N. Refreshing the role of open water surfaces on mitigating the maximum urban heat island effect. Landsc. Urban Plan. 2014, 121, 92–96. [Google Scholar] [CrossRef]
- Shahmohamadi, P.; Che-Ani, A.I.; Maulud, K.N.A.; Tawil, N.M.; Abdullah, N.A.G. The impact of anthropogenic heat on formation of urban heat island and energy consumption balance. Urban Stud. Res. 2011, 2011, 497524. [Google Scholar] [CrossRef]
- Zhu, X.; Wang, X.; Yan, D.; Liu, Z.; Zhou, Y. Analysis of remotely-sensed ecological indexes’ influence on urban thermal environment dynamic using an integrated ecological index: A case study of Xi’an, China. Int. J. Remote Sens. 2019, 40, 3421–3447. [Google Scholar] [CrossRef]
- Hong, B.; Lin, B. Study on Optimal Design of Vegetation in Residential District in Winter Coupling Field Experiment and Numerical Simulation. Chin. Landsc. Archit. 2014, 30, 104–108. [Google Scholar]
- Du, H.; Song, X.; Jiang, H.; Kan, Z.; Wang, Z.; Cai, Y. Research on the cooling island effects of water body: A case study of Shanghai, China. Ecol. Indic. 2016, 67, 31–38. [Google Scholar] [CrossRef]
- Song, D.; Zhang, X.; Zhou, X.; Shi, X.; Jin, X. Influences of wind direction on the cooling effects of mountain vegetation in urban area. J. Affect. Disord. 2022, 209, 108663. [Google Scholar] [CrossRef]
- Tan, Z.; Lau, K.K.-L.; Ng, E. Urban tree design approaches for mitigating daytime urban heat island effects in a high-density urban environment. Energy Build. 2016, 114, 265–274. [Google Scholar] [CrossRef]
- Zhou, X.; Zhang, S.; Zhu, D. Impact of urban water networks on microclimate and PM2. 5 distribution in downtown areas: A case study of Wuhan. J. Affect. Disord. 2021, 203, 108073. [Google Scholar]
- Kuang, W. Seasonal variation in air temperature and relative humidity on building areas and in green spaces in Beijing, China. Chin. Geogr. Sci. 2020, 30, 75–88. [Google Scholar] [CrossRef]
- Muyiti, T.; Han, L.-X.; Jin, J. Numerical simulation of the effects of residual chlorine in cooling water discharge from a power plant on the water environment. J. Hohai Univ. Nat. Sci. 2008, 36, 475–478. [Google Scholar]
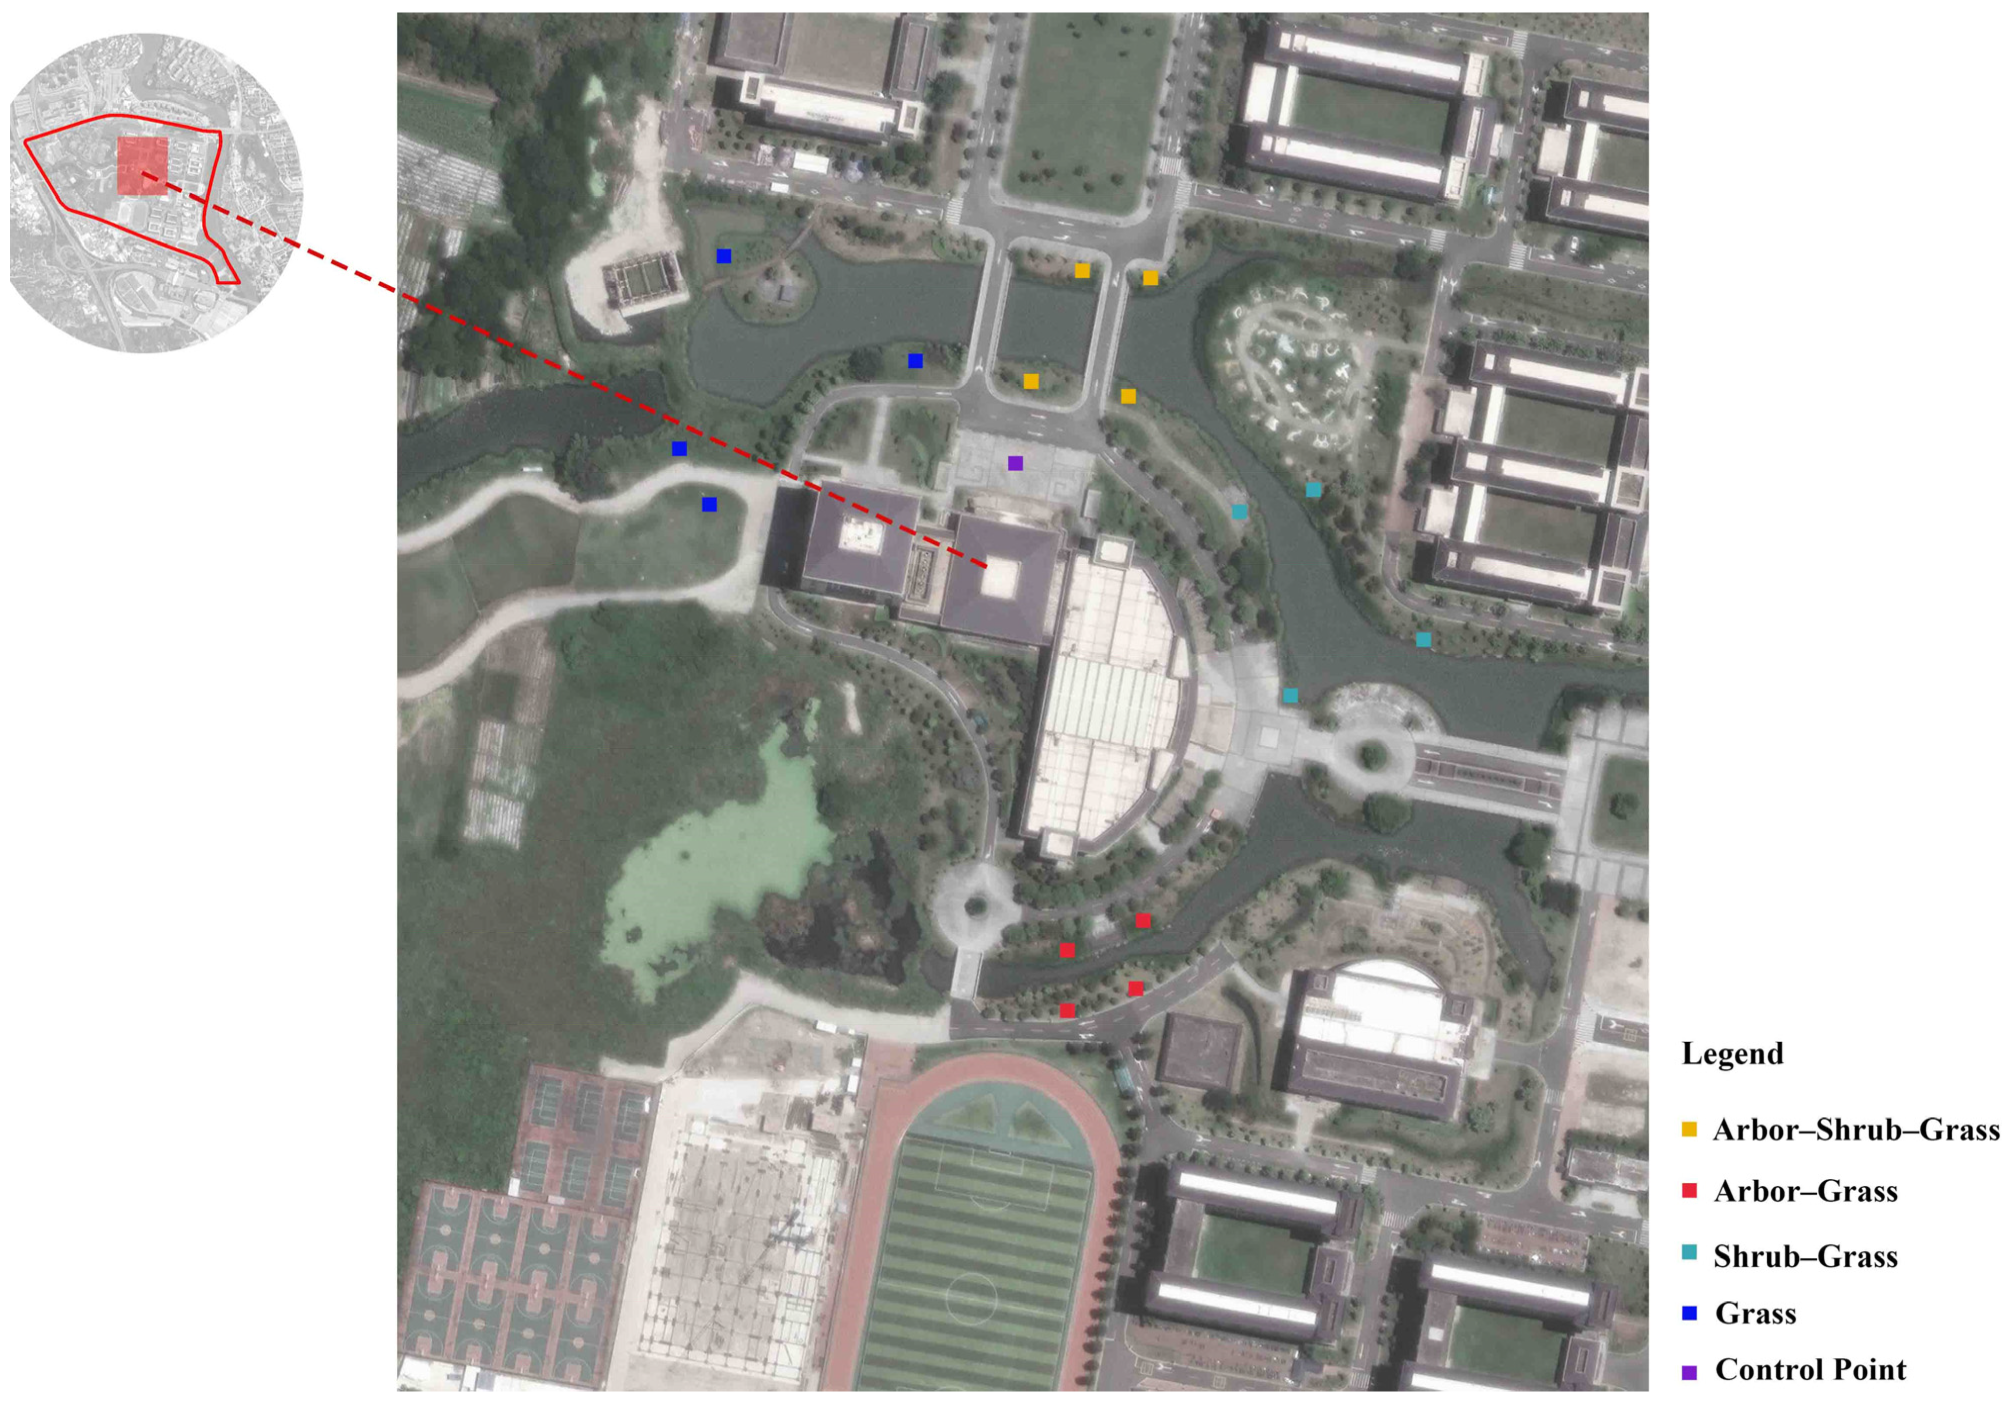

| Measurement Point Type and Identification | Plant Community Type | Spatial Characteristic | Photographs of Measurement Point |
|---|---|---|---|
1 | Grass | The perimeter is open and the ground cover plants area dominated by Zoysia matrella. |  |
2  | Shrub–grass | Enclosed by shrubs. Shrubs are mainly Nerium oleander and Cyperus involucratus. Ground cover plants were mainly Zoysia japonica. |  |
3  | Tree–grass | Enclosed by trees. The ground cover is Ophiopogon bodinieri. Trees are Camphora officinarum. |  |
4  | Tree–shrub–grass | Enclosed by trees. Trees are mainly Bischofia javanica, Melaleuca bracteata, Liriodendron chinense. Shrubs are mainly Hibiscus rosa-sinensis, Fagraea ceilanica, Cordyline fruticosa, Bougainvillea spectabilis. Ground covers are Zoysia japonica. | 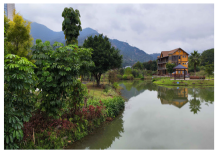 |
Control point | Open space. Hard paved floors | 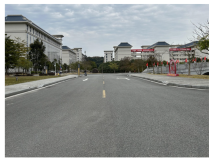 |
| Parameter Name | Parameter Name | Parameter Values |
|---|---|---|
| Grid settings | Model dimensions/size of grid cell in meter | 270 × 180 × 30/4 m × 4 m × 3 m |
| Model location | Base settings | Fujian Agriculture and Forestry University (Qishan Campus). 26.08° N, 119.23° E |
| Microscale roughness length of surface (m) | 0.01 | |
| Time and date | Start date | 21 June 2022 |
| Start time | 5:00 a.m. | |
| Total simulation time | 14 | |
| Meteorological data | Specific humidity in 2500 m (g/kg) | 7 |
| Wind direction | 135° (south-east) | |
| Windspeed (m/s) | 2.5 | |
| Temperature range | 17–28 | |
| Soil section | Upper layer (0–20 cm) | 65 °C/50%RH |
| Middle layer (20–50 cm) | 70 °C/50%RH | |
| Deep layer (50–200 cm) | 75 °C/50%RH |
| Equation Number | Formula | Meaning | Symbol and Its Representation | Reference |
|---|---|---|---|---|
| (1) | Evaluate the accuracy of the model, compare the error between the measured and simulated values, and reflect the applicability of the model. | xi denotes the simulated value xi’ denotes the measured value n denotes the number of tests | [34] | |
| (2) | ||||
| (3) | ||||
| (4) | Evaluate the level of human comfort in different meteorological conditions. | Level 6: 65–70 (warm, comfortable). Level 7: 70–75 (hot, more comfortable). Level 8: 75–80 (stuffy, uncomfortable). Level 9: >80 (Extremely stuffy, extremely uncomfortable). | [35] | |
| (5) | The cooling index, humidification index, ventilation index, and comfort improvement index were used to indicate the improvement extent of the plaza’s microclimate and of human comfort. | ΔTac, ΔRhc, ΔVac, ΔCic, ΔTam, ΔRhm, ΔVam, and ΔCim denote, respectively, the air temperature, relative humidity, wind speed, comfort index of the control point and the measurement point | [36,37] | |
| (6) | ||||
| (7) | ||||
| (8) |
| Enclosure Condition | Water Body–Green Space Ratio | ||||||
|---|---|---|---|---|---|---|---|
| Index | Enclosure Degree | Enclosure Direction | I-1:4 | II-1:1.8 | III-1:1 | IV-1.8:1 | V-4:1 |
| Cooling index | A | - | 1.70 | 1.70 | 1.72 | 1.74 | 1.71 |
| B | B1—North | 1.59 | 1.60 | 1.60 | 1.60 | 1.60 | |
| B2—South | 1.70 | 1.70 | 1.71 | 1.72 | 1.71 | ||
| B3—West | 1.75 | 1.77 | 1.79 | 1.82 | 1.80 | ||
| B4—East | 2.02 | 2.02 | 2.01 | 2.03 | 2.00 | ||
| C | C1—West-North | 1.67 | 1.67 | 1.67 | 1.68 | 1.66 | |
| C2—South-North | 1.76 | 1.76 | 1.78 | 1.82 | 1.80 | ||
| C3—East-North | 1.78 | 1.78 | 1.82 | 1.85 | 1.82 | ||
| C4—West-South | 1.89 | 1.90 | 1.91 | 1.99 | 1.94 | ||
| C5—East-West | 1.79 | 1.88 | 1.88 | 1.89 | 1.88 | ||
| C6—East-South | 1.78 | 1.78 | 1.78 | 1.82 | 1.81 | ||
| D | D1—North-South-West | 1.78 | 1.82 | 1.87 | 1.86 | 1.87 | |
| D2—North-South-East | 1.72 | 1.72 | 1.76 | 1.76 | 1.86 | ||
| D3—East-West-North | 1.82 | 1.82 | 1.86 | 1.92 | 1.82 | ||
| D4—East-West-South | 1.73 | 1.73 | 1.85 | 1.90 | 1.75 | ||
| E | East-South-West-North | 1.77 | 1.78 | 1.85 | 1.89 | 1.76 | |
| Average value | 1.77 | 1.78 | 1.80 | 1.83 | 1.80 | ||
| Enclosure Condition | Water Body–Green Space Ratio | ||||||
|---|---|---|---|---|---|---|---|
| Index | Enclosure Degree | Enclosure Direction | I-1:4 | II-1:1.8 | III-1:1 | IV-1.8:1 | V-4:1 |
| Humidification index | A | - | −0.46 | −0.46 | −0.39 | −0.01 | 0.18 |
| B | B1—North | 1.78 | 1.80 | 1.81 | 1.84 | 1.87 | |
| B2—South | 1.78 | 1.80 | 1.81 | 1.83 | 1.87 | ||
| B3—West | 1.77 | 1.74 | 1.75 | 1.76 | 1.79 | ||
| B4—East | 1.75 | 1.80 | 1.81 | 1.82 | 1.86 | ||
| C | C1—West-North | 2.32 | 2.37 | 2.36 | 2.37 | 1.87 | |
| C2—South-North | 2.36 | 2.14 | 2.20 | 2.26 | 2.18 | ||
| C3—East-North | 2.46 | 2.38 | 2.49 | 2.58 | 2.96 | ||
| C4—West-South | 2.38 | 2.62 | 2.77 | 2.87 | 2.65 | ||
| C5—East-West | 2.50 | 2.51 | 2.61 | 2.81 | 2.89 | ||
| C6—East-South | 2.56 | 2.58 | 2.64 | 2.74 | 3.94 | ||
| D | D1—North-South-West | 2.78 | 2.89 | 2.89 | 2.99 | 3.00 | |
| D2—North-South-East | 2.18 | 2.90 | 3.74 | 3.76 | 4.88 | ||
| D3—East-West-North | 2.11 | 2.98 | 3.10 | 3.18 | 3.04 | ||
| D4—East-West-South | 2.68 | 2.97 | 3.69 | 3.76 | 4.66 | ||
| E | East-South-West-North | 2.52 | 2.72 | 3.65 | 3.96 | 3.98 | |
| Average value | 2.09 | 2.23 | 2.43 | 2.53 | 2.73 | ||
| Enclosure Condition | Water Body–Green Space Ratio | ||||||
|---|---|---|---|---|---|---|---|
| Index | Enclosure Degree | Enclosure Direction | I-1:4 | II-1:1.8 | III-1:1 | IV-1.8:1 | V-4:1 |
| Ventilation index | A | - | 1.55 | 0.56 | 0.56 | 0.57 | 0.54 |
| B | B1—North | 1.09 | 0.38 | 0.38 | 0.38 | 0.25 | |
| B2—South | 1.30 | 0.38 | 0.39 | 0.33 | 0.11 | ||
| B3—West | 1.41 | 0.35 | 0.36 | 0.35 | 0.13 | ||
| B4—East | 1.24 | 0.40 | 0.42 | 0.31 | 0.16 | ||
| C | C1—West-North | 0.98 | 0.43 | 0.43 | 0.43 | 0.26 | |
| C2—South-North | 0.85 | 0.40 | 0.40 | 0.41 | 0.23 | ||
| C3—East-North | 0.88 | 0.36 | 0.36 | 0.36 | 0.19 | ||
| C4—West-South | 0.91 | 0.34 | 0.34 | 0.35 | 0.11 | ||
| C5—East-West | 0.93 | 0.42 | 0.42 | 0.42 | 0.27 | ||
| C6—East-South | 0.91 | 0.39 | 0.39 | 0.39 | 0.20 | ||
| D | D1—North-South-West | 0.68 | 0.46 | 0.46 | 0.47 | 0.45 | |
| D2—North-South-East | 0.64 | 0.42 | 0.43 | 0.43 | 0.43 | ||
| D3—East-West-North | 0.66 | 0.44 | 0.44 | 0.45 | 0.40 | ||
| D4—East-West-South | 0.66 | 0.44 | 0.44 | 0.45 | 0.41 | ||
| E | East-South-West-North | 0.28 | 0.24 | 0.25 | 0.25 | 0.25 | |
| Average value | 0.94 | 0.40 | 0.40 | 0.40 | 0.27 | ||
| Enclosure Condition | Water Body–Green Space Ratio | ||||||
|---|---|---|---|---|---|---|---|
| Index | Enclosure Degree | Enclosure Direction | I-1:4 | II-1:1.8 | III-1:1 | IV-1.8:1 | V-4:1 |
| Human comfort improvement index | A | - | 15.29 | 15.10 | 15.48 | 15.73 | 14.72 |
| B | B1—North | 15.03 | 16.22 | 16.66 | 15.61 | 14.96 | |
| B2—South | 15.07 | 16.34 | 15.99 | 16.04 | 14.98 | ||
| B3—West | 15.02 | 16.32 | 16.45 | 16.52 | 14.76 | ||
| B4—East | 15.06 | 16.21 | 16.23 | 16.11 | 13.92 | ||
| C | C1—West-North | 15.90 | 16.17 | 15.15 | 16.02 | 16.46 | |
| C2—South-North | 16.17 | 16.19 | 15.38 | 16.22 | 15.16 | ||
| C3—East-North | 17.34 | 16.61 | 15.29 | 17.26 | 15.15 | ||
| C4—West-South | 17.38 | 16.27 | 15.18 | 17.27 | 16.11 | ||
| C5—East-West | 15.95 | 15.73 | 15.43 | 15.72 | 15.44 | ||
| C6—East-South | 16.70 | 16.10 | 15.45 | 16.69 | 15.05 | ||
| D | D1—North-South-West | 14.69 | 14.94 | 14.71 | 14.68 | 15.98 | |
| D2—North-South-East | 15.68 | 16.13 | 15.94 | 15.79 | 15.70 | ||
| D3—East-West-North | 15.02 | 15.48 | 15.27 | 14.92 | 16.87 | ||
| D4—East-West-South | 15.17 | 15.75 | 15.24 | 14.94 | 13.89 | ||
| E | East-South-West-North | 15.43 | 15.19 | 14.48 | 16.36 | 16.54 | |
| Average value | 15.68 | 15.92 | 15.52 | 15.99 | 15.36 | ||
Disclaimer/Publisher’s Note: The statements, opinions and data contained in all publications are solely those of the individual author(s) and contributor(s) and not of MDPI and/or the editor(s). MDPI and/or the editor(s) disclaim responsibility for any injury to people or property resulting from any ideas, methods, instructions or products referred to in the content. |
© 2024 by the authors. Licensee MDPI, Basel, Switzerland. This article is an open access article distributed under the terms and conditions of the Creative Commons Attribution (CC BY) license (https://creativecommons.org/licenses/by/4.0/).
Share and Cite
Xu, H.; Zheng, G.; Lin, X.; Jin, Y. Study on the Microclimatic Effects of Plant-Enclosure Conditions and Water–Green Space Ratio on Urban Waterfront Spaces in Summer. Sustainability 2024, 16, 2957. https://doi.org/10.3390/su16072957
Xu H, Zheng G, Lin X, Jin Y. Study on the Microclimatic Effects of Plant-Enclosure Conditions and Water–Green Space Ratio on Urban Waterfront Spaces in Summer. Sustainability. 2024; 16(7):2957. https://doi.org/10.3390/su16072957
Chicago/Turabian StyleXu, Han, Guorui Zheng, Xinya Lin, and Yunfeng Jin. 2024. "Study on the Microclimatic Effects of Plant-Enclosure Conditions and Water–Green Space Ratio on Urban Waterfront Spaces in Summer" Sustainability 16, no. 7: 2957. https://doi.org/10.3390/su16072957